Abstract
Linear dichroism (LD) can be used to study the alignment of absorbing chromophores within long molecules. In particular, Couette flow LD has been used to good effect in probing ligand binding to DNA and to fibrous proteins. This technique has been previously limited by large sample requirements. Here we report the design and application of a new micro-volume Couette flow cell that significantly enhances the potential applications of flow LD spectroscopy by reducing the sample requirements for flow linear dichroism to 25 μL (with concentrations such that the absorbance maximum of the sample in a 1-cm pathlength cuvette is ∼1). The micro-volume Couette cell has also enabled the measurement of fluorescence-detected Couette flow linear dichroism. This new technique enables the orientation of fluorescent ligands to be probed even when their electronic transitions overlap with those of the macromolecule and conversely. The potential of flow-oriented fluorescence dichroism and application of the micro-volume Couette LD cell are illustrated by the collection of data for DNA with minor groove and intercalating ligands: DAPI, Hoechst, and ethidium bromide. As with conventional fluorescence, improved sensitivity compared with absorbance LD is to be expected after instrumentation optimization.
INTRODUCTION
Linear dichroism (LD) is a phenomenon caused by the differential absorption of light polarized parallel and perpendicular to an orientation axis. It has a long history and a wide range of applications, all requiring a means of orienting the sample. For biological molecules, where the sample has to be hydrated, the most versatile sample orientation method has proved to be solution phase Couette flow orientation (Bloemendal and Vangrondelle, 1993; Hofricheter and Eaton, 1976; Nordén et al., 1992; Rodger, 1993). The main applications of such flow LD to date have been to DNA and DNA drug systems (Nordén et al., 1992; Wada, 1964; Wada and Kozawa, 1964). Recent applications of LD for structural characterization of biomacromolecular systems include both membrane-bound and fibrous proteins, which can be difficult to study using other methods (Dafforn et al., 2004; Johansson and Davidsson, 1985; Rodger, 1993; Rodger et al., 2002). However, despite recent sample reduction (Rodger et al., 2002), the sample requirements of flow LD experiments to date (200 μL of a sample whose absorbance is ∼1 in a 1-cm cuvette) has precluded its use in systems where limited material is available.
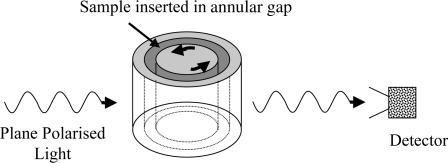
Couette cells are derived from the work of Couette (1890) and were first developed into an instrument for flow dichroism by Wada and Kozawa (1964). Sample orientation is effected by viscous drag generated by a flow gradient imposed on solution flowing in a narrow gap between the walls of a rotating cylindrical cell (Fig. 1). Previous studies have used either a rotating inner and fixed outer cylinder (Wada and Kozawa, 1964), or a rotating outer and fixed inner cylinder (Lee and Davidson, 1968; Oriel and Schellman, 1966). The former design offers more flow stability and has been the most popular. The light path through the cell is made of ultraviolet (UV) transparent materials, usually quartz, that allow optimal transmission of light. If the center rotates then it needs to be made of optically transparent material and the stationary outer cylinder requires at least two transparent windows, and vice versa. The incident light beam can be either perpendicular (Wada and Kozawa, 1964) or parallel (Lee and Davidson, 1968) to the axis of rotation. We adopt the perpendicular orientation in all of our applications.
FIGURE 1.
Schematic diagram of LD flow Couette cell.
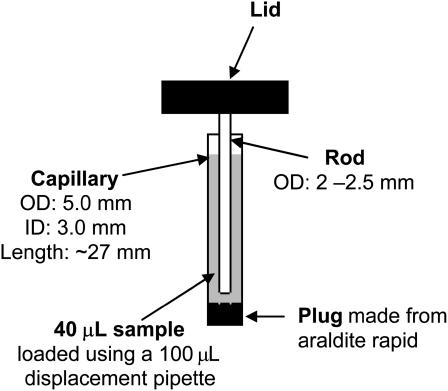
The micro-volume Couette LD cell developed here is based on a quartz capillary (∼5-mm outer diameter and ∼3-mm inner diameter) and centrally mounted rod (2–2.5-mm outer diameter) inserted into the capillary (Fig. 2). Flow orientation is generated by rotating the outer capillary. The capillary and rod are demountable for easy cleaning and are in principle disposable. In our previous low-volume Couette (Dafforn et al., 2004; Rodger et al., 2002) the annular gap between an outer stationary cylinder and an inner rotating one was reduced to 50 μm (the standard gap is typically 500 μm). The volume required for the 50-μm cell is ∼200 μL, compared to 1800 μL or more (with a 1-mm pathlength) in earlier cells. In this article the new micro-volume Couette LD cell reduces the sample volume by a further order of magnitude (with a pathlength of ∼0.5 mm) at the same time opening the way to disposable LD sample holders and also flow-oriented fluorescence dichroism. It is this micro-volume 250-μm annular gap Couette LD cell that has been used for all the work reported in this article.
FIGURE 2.
Schematic diagram showing the capillary and rod assembly in the micro-volume Couette cell.
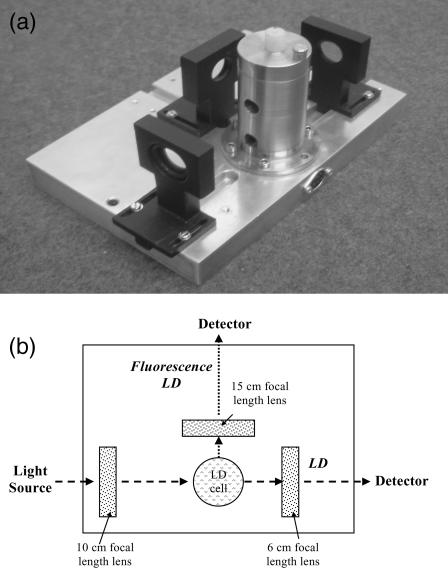
As well as the application of standard LD to new systems (such as liposomes and fibers) a potential area of advance has been the coupling of LD with other techniques. This was first mentioned by Wada (1972), who proposed combination of LD with infrared absorbance fluorescence, and light scattering. Until now, however, fluorescence-detected flow linear dichroism (FDFLD) has not been possible using Couette shear flow due to lack of suitable instrumentation. The micro-volume Couette LD cell offers this possibility because of its small diameter, therefore allowing the collection of photons emitted perpendicular to the incident light direction (Fig. 3). The 90° configuration cell allows the study of fluorophores that exhibit spectral overlap with other species in the solution, so cannot be studied using the standard 180° configuration LD cell. This enhances the capacity of LD for the study of ligand orientation on linear molecules.
FIGURE 3.
(a) Photograph of micro-volume Couette flow cell and (b) schematic diagram of micro-volume Couette flow cell.
LD experiments are usually undertaken using adapted circular dichroism (CD) spectropolarimeters as LD has the same issues as CD with regard to the equivalence of the intensity of the two polarized light beams. In our case we increase the voltage across the photoelastic modulator (PEM) so that it becomes an oscillating half-wave plate with alternating horizontal and vertical polarizations. The key component of the micro-volume Couette LD cell to enable its use in standard CD spectropolarimeters, where light beams are large, is the use of a focusing lens before the capillary housing to ensure the light is only incident on the central part of the unit. The diverging lens effect of the capillary/rod requires another focusing lens after the sample. FDFLD is detected by addition of an exit hole at 90° to the incident light and the use of a lens to focus any emitted light onto the photomultiplier tube (PMT), which for the purposes of these experiments was relocated to a position on the back of the CD spectropolarimeter sample compartment at 90° to the incident light (Fig. 3 b). This design is not optimized for FDFLD, in particular all scattered photons are detected, resulting in comparatively poor signal/noise ratios. However, as discussed below, we have confirmed that there are no intrinsic problems with the capillary design leading to spectroscopic artifacts.
The LD for a given transition depends on the orientation of the sample (as summarized by the orientation parameter S) and the angle α between the macroscopic orientation axis and the transition moment according to Eq. 1:
 |
(1) |
where LDr is the reduced linear dichroism and A is the absorbance by the sample (in practice, we measure this independently and scale to adjust for pathlength differences between the LD and absorbance experiment).
MATERIALS AND METHODS
Design of micro-volume Couette flow LD cell
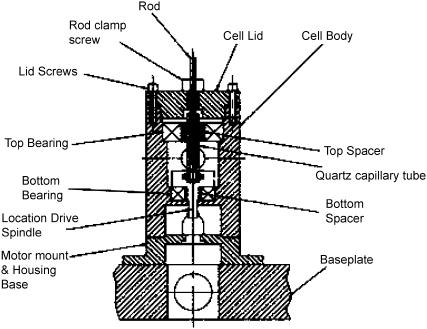
A cross section of the micro-volume Couette flow LD cell is shown in Fig. 4. This was designed and built by Crystal Precision Optics, Rugby, UK. The major innovation in our design is the use of quartz capillaries and rods to hold and orient the sample (Glass Precision Engineering, Leighton Buzzard, UK and Enterprise-Q, Manchester, UK). The capillary units are demountable for removal during cleaning and sample loading. This also provides the possibility for use as a disposable sample holder, an attractive idea in the case of some samples. In this work, the capillaries are sealed at the base with Araldite Rapid (Bostik Findley, Stafford, UK) and held in position in the metal base unit by an “O”-ring. A quartz rod is held suspended rigidly from the lid and is inserted into the capillary before operation (Fig. 2).
FIGURE 4.
General arrangement drawing showing detail of quartz micro-volume Couette flow LD cell.
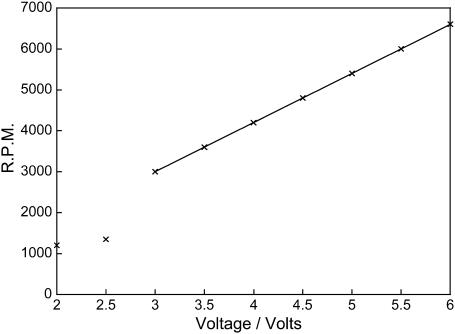
The motor used to drive the capillary is mounted directly below the cell. It is controlled electronically by an EP-603 (0–30 V) power supply, adapted to allow more precise measurements (two decimal places) of applied voltage by the addition of a 10-turn potentiometer. Potential vibration was excluded by using a flexible coupling between the driver spindle and motor. Rotation speeds from 0 to 7000 revolutions per minute (rpm) can be achieved, without inducing turbulent flow. Rotation speeds were ascertained in a calibration experiment by marking the outside of the capillary and measuring the frequency with which the light beam was interrupted using a fast kinetic program on the spectropolarimeter (Fig. 5).
FIGURE 5.
A chart to show the relationship between voltage and rpm of the capillary.
Before collecting the data reported in this article, extensive work was undertaken to demonstrate that different batches of quartz capillaries had no depolarizing effects on the incident light beam. In addition we have shown that the intrinsic LD signal from the capillary is independent of the face of the capillary that is in the light beam. This means that the baseline spectrum for an LD experiment can be collected simply by stopping the rotating capillary and hence the alignment. This is an extremely attractive option and contrasts with our previous practice of emptying and refilling the cell with water. In the case of light-scattering samples, measuring the baseline on the same sample usually produces better baselines. However, the rods are not as uniform as the capillaries and it is essential that they are always inserted into the capillary in the same orientation.
Due to the size of the surface area of the capillary and the need to have light incident only on the middle front and back of the solution (otherwise an averaging over samples oriented perpendicular and parallel to the propagation direction would occur) a 2.54-cm diameter × 10-cm focal length lens (Edmund Optics, York, UK) was placed 10 cm in front of the center of the rod. The beam diverges after the capillary unit (in part due to the first lens and in part due to the capillary/rod), so a second lens (2.54-cm diameter × 6-cm focal length) was placed after the sample to focus the light onto the PMT, thereby improving the signal/ noise ratio by maximizing the number of photons reaching the PMT. The focal length of this lens can be varied somewhat without compromising the quality of the data.
The micro-volume 180° Couette flow LD cell was adapted to detect light emitted at 90° by drilling an extra exit hole in the capillary housing at 90° from the path of the incident beam and putting a long focal length lens (2.54-cm diameter × 15-cm focal length) close to this hole to capture and focus maximum light onto the PMT (which is located further from the cell in this configuration).
The minimum volume of sample required depends on the amount of Araldite Rapid used to seal the bottom end of the capillaries because the height of the light beam and the O-ring are fixed. In our standard system a depth of ∼4 mm Araldite Rapid was used to seal the capillaries, the rod was lowered to ∼1 mm above this when fully assembled, and the total pathlength of the system was ∼500 μm. Volumes of at least 25 μL gave the same LD signal, however, higher volumes (e.g., 40 μL) are easier to load without introducing bubbles.
Construction of micro-volume Couette flow LD cell
A major consideration when constructing the micro-volume Couette LD cell was to ensure the rotating quartz capillary and the stationary quartz rod remained parallel. The main body of the micro-volume Couette LD cell is manufactured from laboratory and food industry specification stainless steel (Fig. 4). The bearings and drive spindle were also stainless steel and designed to be dust and water resistant. The drive spindle has a precision-located rubber insert to maintain parallelism and friction drive. The baseplate has been designed specifically for a Jasco CD spectropolarimeter (Tokyo, Japan) with a large sample compartment, but can readily be modified for other CD spectropolarimeters. The base incorporates positioning dowels. These are sufficient to ensure that the cell body is automatically located to line up with the center of the light beam.
The stationary suspended quartz rod is held firmly in position by a cell cap. This has been designed to enable different diameter rods to be installed, allowing the option of changing the annular gap between the inside of the capillary and the outside of the rod without losing the axial parallelism between the capillary and the rod. The base unit of the LD cell has three slots to hold the lenses machined to an accuracy of 10 μm in the linear path and 0.001° in the 90° plane to ensure concentricity in all paths relative to the center line of the rotating capillary. The lens holders were fabricated to ensure that the center of the lens was concentric with the center of the capillary and vertically with the light beam. The optical pathlength of the beam could be adjusted by the linear movement of the lenses along the precision-machined slide ways.
DNA and ligand preparation
Calf thymus DNA, highly lypholized, and the well-characterized DNA groove binders 4′,6-diamidino-2-phenylindole (DAPI) and bisbenzimide H33258 (Hoechst), and ethidium bromide were all supplied by Sigma (Poole, UK). Stock solutions were prepared in water (18.2 MΩ). DNA solutions were prepared by hydration of ct-DNA overnight in deionized water. Concentrations of ct-DNA were determined spectrophotometrically using the molar absorption coefficient per base of ɛ259 = 6600 M−1 cm−1 (Wells et al., 1970). High-purity groove binders/intercalators were used and their concentrations determined by mass using a Sartorius supermicro seven-figure balance (Goettingen, Germany).
Control and validation experiments
The effect of using capillaries as a sample holder for LD and FDFLD was investigated by comparing to reference data collected for LD, CD, and fluorescence. For LD, comparisons against a large-volume Couette flow LD cell (1800 μL) with an inner quartz cylinder that rotates within a steel housing unit with two quartz windows (pathlength 1 mm) was undertaken using ct-DNA solutions at a range of concentrations from 0 to 1000 μM in sodium cacodylate buffer (10 mM, pH 7, Sigma) and NaCl (10 mM, Sigma) (Rodger, 1993). Buffer baseline subtracted LD data were collected from 400 to 190 nm at a data pitch of 0.5 nm, scanning speed of 500 nm min−1, a response of 0.25 s, bandwidth of 2 nm, and averaging over four scans. CD analysis using ammonium camphor sulphonate (0.02% w/v, Jasco) was carried out with the capillary stationary within the baseplate setup and the spectra compared with a 5-mm pathlength quartz cuvette in the normal position for CD analysis. Water baseline corrected CD data were collected between 350 and 185 nm every 0.5 nm, scanning at 200 nm min −1, a response of 0.5 s, bandwidth of 2 nm, and averaging eight scans. Both of these measurements were collected using the Jasco J-715 spectropolarimer in appropriate modes. Fluorescence data were collected using a Perkin Elmer LS50B fluorimeter (Buckinghamshire, UK) not adapted for the use of capillaries, comparing a masked (mimicking the location of the rod) capillary and a 5-mm pathlength quartz cuvette with four polished sides. Aqueous solutions of ct-DNA (317 μM, Sigma), ethidium bromide (30 μM, Sigma) in sodium cacodylate buffer (10 mM, pH 7, Sigma), and NaCl (10 mM, Sigma) were used. Buffer baseline corrected data were collected in excitation mode with the emission wavelength set at 0 nm. Fluorescence data were collected from 600 to 200 nm at a scanning speed of 200 nm min−1, excitation slit widths of 5 nm, and emission slit widths of 2.5 nm. Data were averaged over four scans.
The design of the micro-volume Couette LD cell at present is such that all samples need to be preprepared and loaded into a clean capillary, as it is not possible to remove and replace the rod unit and accurately titrate into the capillary. Validation of the micro-volume Couette LD cell was carried out using ct-DNA (200 μM) comparing repeat analyses in the same capillary and different capillaries. Data were collected using the parameters detailed above under LD control experiments. Analysis of the negative signal at 259 nm yielded information about the errors associated with sample reloading and cell reassembly.
DNA-ethidium bromide binding validation experiments
An application of the micro-volume Couette LD cell is in the analysis of DNA-ligand binding. An example of the binding of ethidium bromide, a classical intercalator, and DNA is shown in this article. The concentration of ct-DNA was held constant at 200 μM and the concentration of ethidium bromide was varied from 5 to 50 μM in 5-μM increments. All solutions were buffered at pH 7.0 using sodium cacodylate buffer (10 mM, Sigma) and contained NaCl (10 mM, Sigma).
LD and fluorescence linear dichroism experiments of DNA-ligand complexes
Applications involving LD and FDFLD of ligands binding to DNA are also reported here. The fluorescent ligands chosen include ethidium bromide, a DNA intercalator with α ∼ 90°, and two DNA minor groove binders, Hoechst and 4′,6-diamidino-2-phenylindole (DAPI) with α ∼ 45° for long-axis polarized transitions and α ∼ 90° for short-axis polarized transition. These ligands were expected to provide both positive and negative LD and/or FDFLD signals at a range of different wavelengths. LD and FDFLD experiments of DNA-ligand complexes were performed using calf thymus DNA and groove binder/intercalator solutions of concentration 1000 μM and 50 μM, respectively, thus giving a mixing ratio of 20:1. The solutions were buffered at pH 7 using sodium cacodylate (10 mM, Sigma).
LD and FDFLD data were collected using a Jasco J-715 circular dichroism spectropolarimeter with a large sample compartment that was adapted for LD measurements by turning the PEM into an oscillating half-wave plate. CD artifacts are less likely with this configuration than when a quarter-wave plate is added to an unadapted CD machine. There is no evidence in any spectra of such artifacts. All spectra were taken at room temperature (23°C) using the same quartz capillary and rod with the following parameters: 600–200 nm, data pitch 0.5 nm, scan speed 500 nm min−1, response 0.25 s, bandwidth 2 nm, and averaged over four separate scans. The corrected spectra were calculated by subtracting a baseline from the stationary capillary, when no LD signal would be present.
UV-visible absorbance spectra and fluorescence spectra were recorded using a Jasco V-550 UV-visible spectrophotometer and a Perkin Elmer LS50B fluorimeter, respectively. A 1-mm pathlength quartz cuvette was used to collect UV spectra of ct-DNA and ligands, and a 1-cm pathlength cuvette used for the concentration determination of ct-DNA. Fluorescence excitation spectra were collected in a 5-mm pathlength cuvette with the emission wavelength set to 0 nm, which means all wavelengths emitted and scattered light are collected. This was done to reflect fluorescence data collected in the micro-volume Couette LD system, because the J-715 spectropolarimeter does not have a second monochromator. For fluorescence measurements of the groove binders (DAPI and Hoechst) an excitation slit width of 4 nm and emission slit width of 2.5 nm were used, whereas for ethidium bromide an excitation slit width of 10 nm and emission slit width of 5 nm was used. Data were averaged over four scans at 200 nm min−1 scanning speed.
Fluorescence LD control experiments were also carried out using both ct-DNA (1000 μM) and each respective drug (50 μM) at pH 7.0 to ensure that the signal being detected is not due to background scatter or intrinsic properties of the components of the DNA-ligand mixtures.
RESULTS
Verification that capillaries as sample holders do not distort spectra
Control linear dichroism (capillary system versus large-volume Couette flow LD cell with a pathlength of 1 mm), circular dichroism (3-mm inner diameter (i.d.) capillary versus 5-mm pathlength rectangular cuvette) and fluorescence (3-mm i.d. capillary versus 5-mm square fluorescence cuvette) experiments using the capillaries were carried out to show that there are no intrinsic problems with undertaking spectroscopic experiments in the extruded quartz capillaries.
LD spectra of ct-DNA in the range 0–1000 μM measured with the micro-volume Couette LD cell were able to be rescaled so that there was good agreement with data collected in the standard Couette cell across the whole wavelength range down to 200 nm (data not shown). All spectra were consistent with those in the literature (Hofricheter and Eaton, 1976; Houssier et al., 1974; Lee and Davidson, 1968; Nordén et al., 1992; Nordén and Kurucsev, 1994; Simonson and Kubista, 1993; Wada, 1964; Wilson and Schellman, 1978).
CD measurements were undertaken using ammonium camphor sulfonate (0.02% w/v), a standard routinely used for the calibration of CD spectropolarimeters. It yields two signals, a negative signal at 192.5 nm and the other a positive signal at 290.5 nm, with the ratio of the two being 2 (Lowry, 1935; Miles et al., 2003; Takakuwa et al., 1985). The i.d. of the capillaries used is three-fifths that of the reference quartz cuvette. The 3-mm i.d. capillary when rescaled by the appropriate pathlength gave a very good agreement with the reference cuvette data down to 190 nm (data not shown). This shows that the capillary is giving accurate data down to these wavelengths.
Both the LD and CD validation experiments were done with the capillary in the Jasco J-715 CD spectropolarimeters with holders that have been designed for that instrument's baseplate and light beam. With regard to the fluorescence experiments, the controls were undertaken in an LS50B fluorimeter for which we were not able to design a holder that focused the light beam appropriately, therefore the data were of much poorer quality. However, when using ct-DNA (317 μM) and ethidium bromide (30 μM) a masked capillary yielded fluorescence spectra that overlaid with the controls from the same instrument, albeit with less intensity and more noise (data not shown).
Validation of micro-volume Couette flow LD cell
Measurement of a number of individual capillaries established that their pathlength differs by <1% when capillaries are cut from the same local region of the extruded quartz source material. Multiple LD analyses of the same sample were undertaken, by comparing the signal intensity at 259 nm of a sample of ct-DNA (200 μM) over 15 separate loadings of the capillary. The relative standard deviation (RSD) was 1.1%. An analogous experiment on the same sample without reloading gave an RSD of 0.8%. Thus the errors from realignment and small pathlength variations from sample reloading and cell reassembling contribute an acceptably small amount to overall variation.
Fig. 5 shows the relationship between voltage and rpm using a ct-DNA (200 μM) sample. It can be seen that a minimum voltage of 3 V is required to ensure sufficient rotation of this cell. This value will depend on the motor being used. As the voltage and rpm increases, the intensity of the LD signal also increases. A linear relationship was observed at voltages above 3 V (which fortuitously corresponds to 3000 rpm).
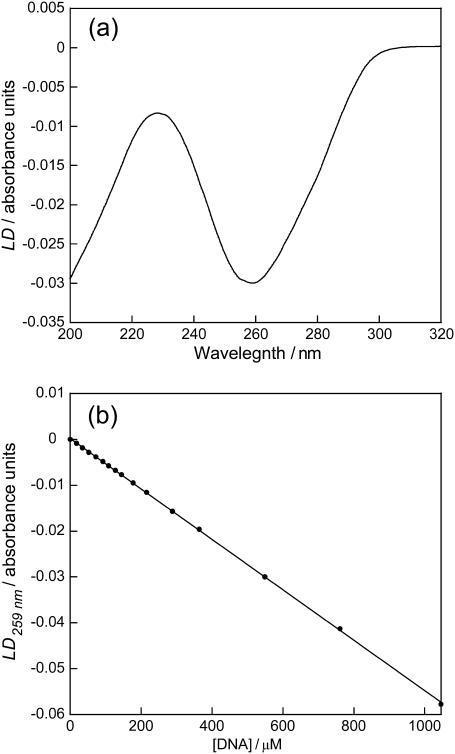
The LD of DNA in the micro-volume Couette LD cell (Fig. 6 a) shows a typical DNA LD spectrum: a negative maximum at 259 nm due to π-π* transitions of the DNA bases. Fig. 6 b shows a plot of LD259 versus DNA concentration at constant rotation speed. These follow the Beer-Lambert law and show the orientation of DNA is not dependent on concentration over this range. The extent of DNA orientation was found to be 10–15% by substituting values for the LD and absorbance and using an average DNA base orientation of 86° (Chou and Johnson, 1993).
FIGURE 6.
(a) LD spectrum of ct-DNA (550 μM) in sodium cacodylate buffer (10 mM, pH 7) and NaCl (10 mM); (b) LD259 versus DNA concentration in a capillary cell at voltage 4 V.
Ethidium bromide-DNA systems
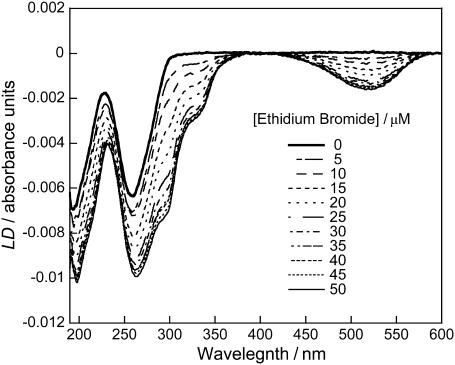
Fig. 7 shows a plot of a titration series of ethidium bromide, a classical DNA intercalator, and DNA. The negative peak at 520 nm is due to π-π* transitions of ethidium bromide; the negative LD signal arises because ethidium bromide intercalates between DNA basepairs in accord with literature (Nordén and Tjerneld, 1976). As the concentration of ethidium bromide is increased, the intensity of this signal increases. Ethidium bromide transitions are also observed below 350 nm in accord with literature expectations.
FIGURE 7.
LD spectra of DNA (200 μM) and different concentrations of ethidium bromide (0–50 μM) using a sodium cacodylate buffer (10 mM, pH 7) and NaCl (10 mM).
Fluorescence LD studies on ligands bound to ct-DNA
Before reporting the experimental data from the FDFLD experiments it is important to consider what signal might be expected. In this experiment we are detecting emitted photons, whose number should be proportional to the number absorbed (the proportionality constant being the quantum yield). Thus, if we ignore the background scattering contribution to the FDFLD signal, when the sample is being flow oriented, assuming the quantum yield from both polarizations of light are proportional to absorbance with the same proportionality constant, the LD90 (the measured FDFLD signal) is expected to be:
 |
(2) |
where  is the intensity of light emitted in the direction of the PMT (which is along the direction of orientation) after absorbance from a perpendicularly polarized light beam and similarly for other terms. By way of contrast, in LD180 (the usual configuration) what is detected are the photons that are not absorbed and that proceed straight through the sample:
 |
(3) |
assuming the ideal situation where both polarizations of light beams have the same incident intensity. Thus in general qualitative terms the LD90 signals are expected to be opposite in sign from those measured in LD180. The more detailed dependence on the angle α the transition moment makes with the orientation direction and the fraction γ of aligned DNA of the LD90 measured on a spinning sample (4 V) and completely unoriented (0 V) is (see Appendix):
 |
(4) |
It should be noted that the final line of this equation is based on the assumptions that: i), the sample can be represented as some fully aligned and some unaligned molecules, ii), γ is small, and iii), the DNA does not rotate significantly between excitation and emission. LD90 is thus expected to be negative for 0 < α < 60° and positive for 60° < α < 90°. By way of contrast, the change-over point is 54.7° for LD180.
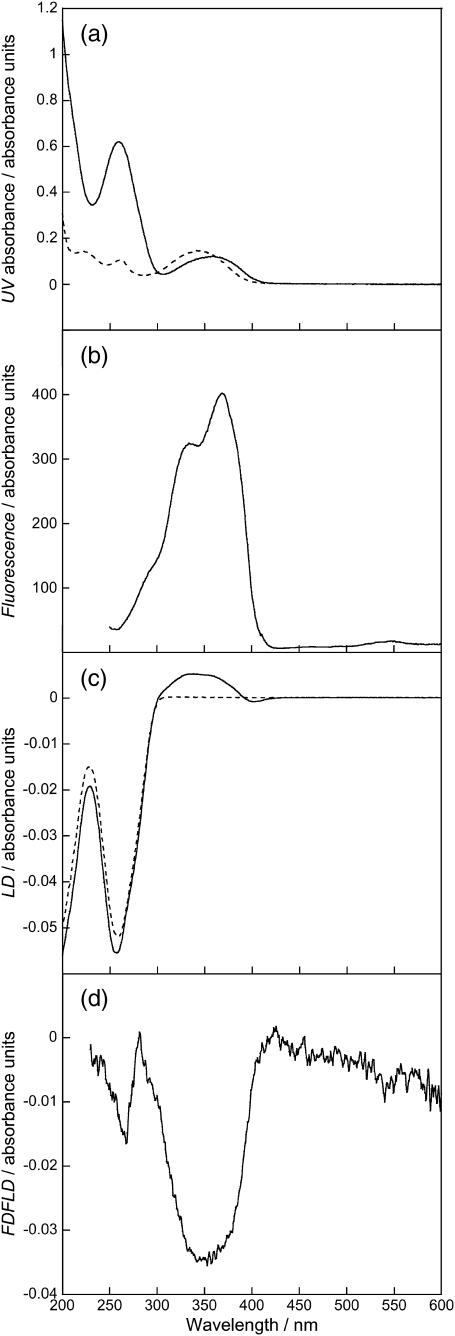
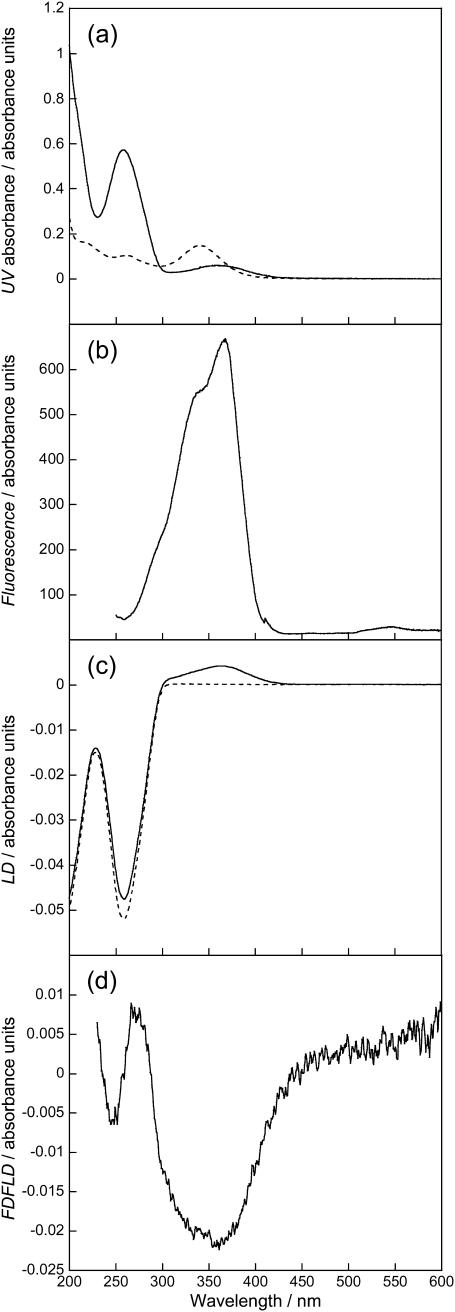
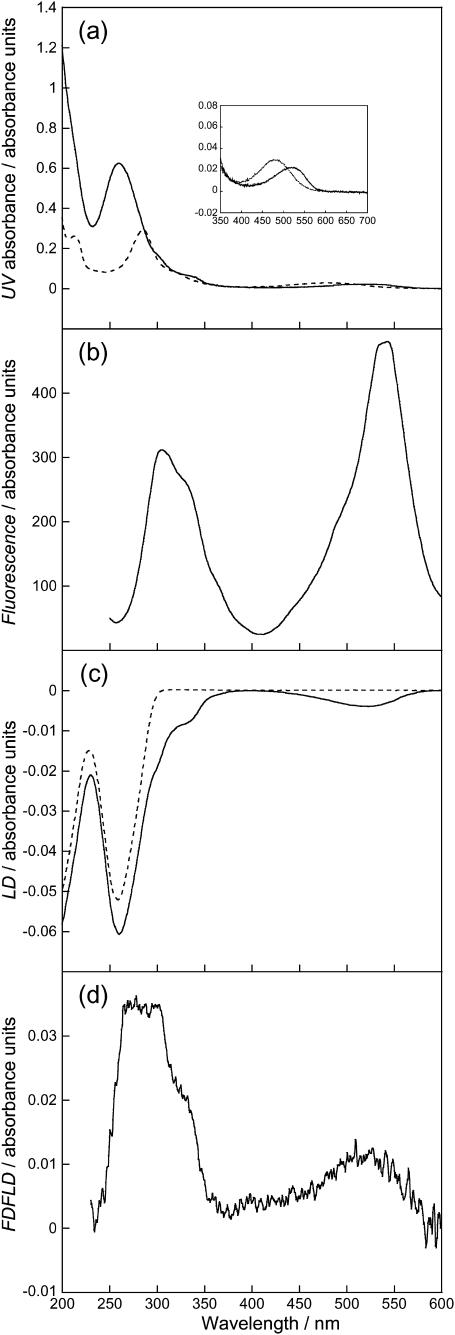
DNA is not expected to have an LD90 signal because it is not fluorescent, as is in fact the case. However, upon adding DAPI, Hoechst, and ethidium bromide, the spectra of Figs. 8–10 were observed. Absorbance, LD180 and standard excitation fluorescence spectra (with wide open emission slit as described above) are also shown.
FIGURE 8.
Spectra of DNA (1000 μM) and DAPI (50 μM). (a) Absorption spectra of DAPI (dashed line) and DAPI-ct-DNA (solid line), (b) fluorescence excitation spectrum of DAPI-ct-DNA with all emitted photons detected, (c) LD spectra of ct-DNA (dashed line) and DAPI-ct-DNA (solid line), and (d) FDFLD spectrum of DAPI-ct-DNA. All solutions prepared using a sodium cacodylate buffer (10 mM, pH 7).
FIGURE 9.
Spectra of DNA (1000 μM) and Hoechst (50 μM). (a) Absorption spectra of Hoechst (dashed line) and Hoechst-ct-DNA (solid line), (b) fluorescence excitation spectrum of Hoechst-ct-DNA with all emitted photons detected, (c) LD spectra of ct-DNA (dashed line) and Hoechst-ct-DNA, and (d) FDFLD spectrum of Hoechst-ct-DNA. All solutions prepared using a sodium cacodylate buffer (10 mM, pH 7).
FIGURE 10.
DNA (1000 μM) and ethidium bromide (50 μM). (a) Absorption spectra of ethidium bromide (dashed line) and ethidium bromide-ct-DNA (solid line). (Inset) Enlarged region of ethidium bromide band. (b) Fluorescence excitation spectra with all emitted photons detected, (c) LD spectra of ct-DNA (dashed line) and ethidium bromide-ct-DNA (solid line), and (d) FDFLD spectra. All solutions prepared using a sodium cacodylate buffer (10 mM, pH 7).
DNA-DAPI interactions
The absorption spectra of free and ct-DNA-bound DAPI (Fig. 8 a) shows, in accord with literature reports, a red shift of the absorbance maximum by ∼15 nm upon binding of DAPI to ct-DNA. There is also a hypochromism of ∼20%. The fluorescence excitation spectrum of ct-DNA-bound DAPI with all emitted photons collected is shown in Fig. 8 b; this shows a maximum at ∼369 nm and a shoulder at ∼335 nm. The LD spectra of ct-DNA and ct-DNA in the presence of DAPI are given in Fig. 8 c. The ct-DNA shows a characteristic negative peak with maximum at 259 nm. When DAPI is present there is a contribution in this region of the spectrum as seen by a wavelength shift of the peak maximum from 259 nm to 257 nm. There is also a small increase in the ct-DNA LD signal intensity. A broad positive peak centered at ∼345 nm is due to the long-axis polarized transition of the groove bound DAPI (where it is expected to bind for AT-rich DNA (Eriksson et al., 1993; Kubista et al., 1987)). There is also a slight negative region at 400 nm due probably to a small population of major groove bound, probably partially intercalated, DAPI at GC-rich regions (Eriksson, 1992; Kim et al., 1993).
The FDFLD spectrum of DAPI bound to ct-DNA is given in Fig. 8 d. There is a large negative peak at ∼350 nm corresponding to the positive LD180 band in Fig. 8 c. There is also a smaller negative peak at ∼265 nm. This feature corresponds to the 262-nm peak in the DAPI absorbance spectrum that is approximately half the intensity of the one at 347 nm. Thus LD90 is able to probe ligand transitions usually masked by the DNA absorbance. It should be noted that the FDFLD intensity will be dependent on the quantum yields of different binding modes and/or different sequences. In addition there is also the possibility of enhanced intensity due to energy transfer from the DNA bases. Given the magnitude of this peak such an effect is not obvious in this spectrum.
DNA-Hoechst interactions
The absorption spectra of free and ct-DNA-bound Hoechst is shown in Fig. 9 a. It can be seen that there is red shift of absorbance maximum of ∼20 nm upon the binding of Hoechst to ct-DNA. There is also a hypochromism of ∼60%. Fig. 9 b shows the fluorescence excitation of Hoechst bound to ct-DNA with all emitted photons collected. A peak maximum is seen at ∼367 nm with a shoulder at ∼338nm. The LD spectra of ct-DNA and ct-DNA in the presence of Hoechst are given in Fig. 9 c. The ct-DNA shows a characteristic negative peak at 259 nm. When Hoechst is present there is a decrease in LD signal intensity compared to ct-DNA alone that could be a Hoechst contribution or a reduction in DNA alignment. It has previously been concluded from studies by Moon et al. (1996) that Hoechst binds in the minor groove of AT-rich regions (though the consensus of opinion is that Hoechst binds in the major groove of GC-rich DNA probably in some kind of partially intercalated binding mode; Colson et al., 1995; Moon et al., 1996), and the positive peak ∼360 nm is due to the Hoechst bound to ct-DNA along the minor groove.
Fig. 9 d shows the FDFLD spectrum of Hoechst bound to ct-DNA. There is a broad negative peak in the 290–440 nm region. This corresponds well with the fluorescence excitation data collected and with the broad positive peak at ∼360 nm in the LD spectrum. The positive FDFLD peak at 273 nm is the red-shifted signal of the 260-nm free Hoechst absorbance, consistent with this being a long-axis polarization transition whose LD signal is usually buried under that of the DNA. The superficial similarity of the DAPI and Hoechst FDFLD in the DNA region is misleading as one should note that the baselines slope so the 260-nm region is an FDFLD maximum for DAPI, whereas for Hoechst the same region is an absorbance minimum so not a signal. Similarly the ∼270-nm positive peak is in fact zero for DAPI and an FDFLD signal for Hoechst.
DNA-ethidium bromide interactions
Fig. 10 a shows the absorption spectra of free and ct-DNA-bound ethidium bromide. The absorption maximum at 525 nm shows a red shift of ∼40 nm upon the binding to ct-DNA. There is also a hypochromism of ∼25%. The fluorescence excitation spectrum of ethidium bromide bound to ct-DNA with all emitted photons collected is shown in Fig. 10 b. A peak maximum at ∼300 nm with a shoulder at ∼330 nm is observed. A more intense peak is also present at ∼530 nm. The LD spectra of ct-DNA and ct-DNA in the presence of ethidium bromide are given in Fig. 10 c. The ct-DNA shows a characteristic negative peak at 259 nm. When ethidium bromide is present there is an increase in LD signal intensity compared to ct-DNA alone. Ethidium bromide is a well-known and well-characterized intercalator. This means that the aromatic rings of ethidium bromide are able to insert between basepairs on the DNA making the DNA more rigid therefore increasing alignment (Nordén and Tjerneld, 1976). There are two negative signals due to the ethidium bromide, one at ∼520 nm and one showing as a shoulder and wavelength shift on the DNA signal at ∼300 nm.
Fig. 10 d shows the FDFLD spectrum of ethidium bromide bound to ct-DNA. There is a broad positive peak with a maximum at 525 nm, corresponding to the negative LD band at that wavelength. There is also a broad positive peak from 250 to 350 nm corresponding to the absorbance peaks in this region. These signals are consistent with an intercalated ethidium bromide and show that it is possible to use absorbance signals that are usually complicated by being masked by DNA spectroscopy. Enhanced signals due to energy transfer from the DNA bases are more likely for an intercalator than for a groove binder. Once again although this possibility cannot be ruled out at this stage, the ethidium FDFLD does not resemble the DNA absorbance shape, so we conclude at least that this is not a dominant effect.
CONCLUSIONS
A micro-volume Couette flow cell has been designed and developed for linear dichroism spectroscopy for applications where sample availability is restricted. This is particularly a relevant issue for biological samples. Flow orientation is achieved by the alignment of linear molecules between a fixed quartz rod and rotating quartz capillary. The capillaries used are optically uniform and have advantages of being cheap and removable, which means that they have the potential of being disposable as well as being significantly easier to clean than other LD cells. Focusing lenses are used to focus the light beam onto the capillary, therefore, maximizing the photon count interacting with the sample. The capillaries do not distort LD, CD, or fluorescence spectra as shown by comparison with data collected using standard sample cells. Method validation using calf thymus DNA and groove binding and intercalating DNA binding ligands has shown sample volumes of ∼25 μL are sufficient to obtain reproducible stable LD spectra, although slightly larger volumes reduce the risk of introducing air bubbles into the capillary upon loading. The ct-DNA has been oriented with an orientation parameter of S = 10–15% assuming an angle of 86° between the macroscopic orientation axis and the DNA base transition moment.
The capillary design of the micro-volume Couette flow LD cell has also enabled a new technique of fluorescence-detected flow linear dichroism to be undertaken. Exit holes from the cell at both 90° and 180° to the incident light enable measurement of fluorescence LD and normal LD, respectively. In both cases lenses have been placed close to the exit hole to capture the maximum amount of the emitted light and focus this toward the PMT. For measurements of fluorescence LD it was also necessary to move the PMT to be at right angles to the incident light beam.
The FDFLD showed the intrinsic contribution to the LD of the bound ligands whose bands lie under the DNA bands thus showing the potential of FDFLD for probing fluorophores in LD independently from other chromophores. The data are of sufficient quality that it has been possible to probe clearly transitions that are usually hidden by overlapping DNA absorbances. The quality of the fluorescence LD data are less good than the standard LD signal, however, due to the configuration of the spectrometer rather than the cell design. The use of filters or a second monochromator would improve the signal/noise in these experiments. Work is in progress to design a new spectrometer with smaller light beams and both fluorescence and linear dichroism capabilities to significantly improve the quality of the FDFLD data. It will be advantageous for this experiment to record actual differences in intensities of emitted light rather than logarithms of ratios.
Acknowledgments
The authors gratefully acknowledge the help of the referees as well as discussions with Y. Dupont and S. Windsor in leading to an understanding of the underlying basis of what had been measured. The technical skill and enthusiasm of Rhoderick Mortimore of Crystal Precision Optics in constructing the LD cells is gratefully acknowledged.
Financial support from the Engineering and Physical Sciences Research Council, UK (GR/M91105) and Syngenta, UK was also essential to the progress of this work.
APPENDIX
Fluorescence detected flow linear dichroism equations
The shear force of the Couette flow gives a preferential orientation direction to the sample. For simplicity in this preliminary analysis let us assume that a fraction, γ of the DNA is perfectly oriented and a fraction, 1 − γ is randomly oriented. Due to this experiment design, which uses a Jasco J-715 spectropolarimeter, our data output is the logarithm of the ratio of the signals from the horizontal and vertical polarizations of linearly polarized light. Thus, following a thought process analogous to that derived by Canet et al. (2001) (for fluorescence polarization anisotropy with a photoelastic modulator and a single monochromator with no filters) our LD90, the signal measured when the J-715 instrument is in LD mode and the photomultiplier tube is at 90°, is:
 |
(A1) |
where Izy denotes light that is polarized along z with propagation direction along x and that is subsequently detected with polarization along the y direction with propagation direction along z, etc. We may thus write,
 |
(A2) |
where k depends on light intensity, pathlength, sample concentration, etc. and  is the y component of the electric dipole transition moment when it emits radiation; similarly ex is for excitation.
If we assume that the molecule does not rotate significantly while it is in the excited state (DNA is large so molecules bound to it rotate slowly), then we can drop the ex and em labels and write
 |
(A3) |
where α is the angle between μ and the z axis and β is the angle between the projection of μ onto xy plane and x axis then, e.g.,
 |
(A4) |
A rotational average with respect to β leads to:
 |
(A5) |
 |
(A6) |
For a randomly oriented sample (0 V on the motor in practice) where we also average over α
 |
(A7) |
 |
(A8) |
Thus we can write the FDFLD on a sample of which a small fraction γ ≪ 1 is oriented as:
 |
(A9) |
So for transitions polarized along the orientation axis:
 |
(A10) |
which after subtraction of the unoriented baseline is zero to first order in γ.
For transitions polarized perpendicular to the orientation axis
 |
(A11) |
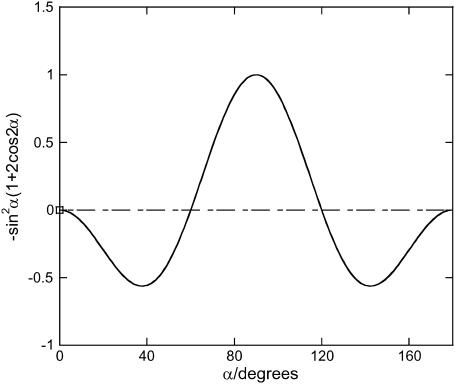
which after subtraction of the unoriented baseline is positive to first order in γ. The sign behavior of the variable term in Eq. A9 that is not removed on baseline subtraction is summarized in Fig. 11.
FIGURE 11.
Plot of  from 0° to 180°, although the plot has symmetry ∼90°.
It is interesting to note that the true sample baseline for all the LD90 spectra is not zero. However, if γ is small then this effect is cancelled out when a nonrotating sample signal is subtracted. Another intriguing feature of this experiment's configuration is that because we take the logarithms of a ratio, rather than a simple difference as in, e.g., fluorescence polarization anisotropy, the absolute magnitude of the signals is independent of concentration, although the signal/noise is affected by concentration and fluorescence intensity.
The zero points in the polarization dependent term of LD90 are at 0°, 60°, 120°, 180°. Thus one expects the data, as presented in this work with the zero rotation spectrum subtracted, to have a negative signal if the transition moment lies between 0° and 60° from the DNA long axis, and a positive sign if it lies from 60° to 90°. This contrasts with standard configuration LD spectra where the change-over point is the magic angle of 54.7° and the sign dependence is the opposite way around. So intercalators are expected to have a positive LD90 signal and long-axis polarized transitions of groove binders to have a negative signal.
References
- Bloemendal, M., and R. Vangrondelle. 1993. Linear-dichroism spectroscopy for the study of structural properties of proteins. Mol. Biol. Rep. 18:49–69. [DOI] [PubMed] [Google Scholar]
- Canet, D., K. Doering, C. M. Dobson, and Y. Dupont. 2001. High-sensitivity fluorescence anisotropy detection of protein-folding events: application to α-lactalbumin. Biophys. J. 80:1996–2003. [DOI] [PMC free article] [PubMed] [Google Scholar]
- Chou, P., and W. C. Johnson. 1993. Base inclinations in natural and synthetic dyes. J. Am. Chem. Soc. 115:1205–1214. [Google Scholar]
- Colson, P., C. Houssier, and C. Bailly. 1995. Use of electric linear dichroism and competition experiments with intercalating drugs to investigate the mode of binding of Hoechst-33258, Berenil and Dapi to Gc sequences. J. Biomol. Struct. Dyn. 13:351–366. [DOI] [PubMed] [Google Scholar]
- Couette, M. 1890. Etudes sur le frottement des liquides. Ann. Chim. Phys. 6:433–510. [Google Scholar]
- Dafforn, T. R., J. Rajendra, D. J. Halsall, L. C. Serpell, and A. Rodger. 2004. Protein fibre linear dichroism for structure determination and kinetics in a low-volume, low-wavelength Couette flow cell. Biophys. J. 86:404–410. [DOI] [PMC free article] [PubMed] [Google Scholar]
- Eriksson, S. 1992. DNA-Ligand Interactions Studied by Optical Spectroscopy. Chalmers University of Technology and University of Goteburg, Goteborg, Sweden.
- Eriksson, S., S. K. Kim, M. Kubista, and B. Nordén. 1993. Binding of 4′,6-diamidino-2-phenylindole (DAPI) to AT regions of DNA: evidence for an allosteric conformational change. Biochemistry. 32:2987–2998. [DOI] [PubMed] [Google Scholar]
- Hofricheter, J., and W. Eaton. 1976. Linear dichroism of biological chromophores. Annual Review of Biophysical Bioengineering. 5:511–560. [DOI] [PubMed] [Google Scholar]
- Houssier, C., B. Hardy, and E. Fredercq. 1974. Interaction of ethidium bromide with DNA. Optical and electrooptical study. Biopolymers. 13:1141–1160. [DOI] [PubMed] [Google Scholar]
- Johansson, L. B. A., and A. Davidsson. 1985. Analysis and application of linear dichroism on membranes - description of a linear-dichroism spectrometer. Journal of the Chemical Society-Faraday Transactions I. 81:1375–1388. [Google Scholar]
- Kim, S. K., S. Eriksson, M. Kubista, and B. Nordén. 1993. Interaction of 4′,6-diamidino-2-phenylindole (DAPI) with poly[d(G-C)2] and poly[d(G-m5C)2]: evidence for major groove binding of a DNA probe. J. Am. Chem. Soc. 115:3441–3447. [Google Scholar]
- Kubista, M., B. Akerman, and B. Nordén. 1987. Characterization of interaction between DNA and 4′,6-diamidino-2-phenylindole by optical spectroscopy. Biochemistry. 26:4545–4553. [DOI] [PubMed] [Google Scholar]
- Lee, C., and N. Davidson. 1968. Flow dichroism of deoxyribonucleic acid solutions. Biopolymers. 6:531–550. [DOI] [PubMed] [Google Scholar]
- Lowry, T. M. 1935. Optical Rotatory Power. F. G. Donnan, editor. Longmans, Green and Co., London, UK. 405–408.
- Miles, A. J., F. Wien, J. G. Lees, A. Rodger, R. W. Janes, and B. A. Wallace. 2003. Calibration and standardisation of synchrotron radiation circular dichroism and conventional circular dichroism spectrophotometers. Spectroscopy. 17:653–661. [Google Scholar]
- Moon, J. H., S. K. Kim, U. Sehlstedt, A. Rodger, and B. Nordén. 1996. DNA structural features responsible for sequence-dependent binding geometries of Hoechst 33258. Biopolymers. 38:593–606. [DOI] [PubMed] [Google Scholar]
- Nordén, B., M. Kubista, and T. Kurucsev. 1992. Linear dichroism spectroscopy of nucleic-acids. Q. Rev. Biophys. 25:51–170. [DOI] [PubMed] [Google Scholar]
- Nordén, B., and T. Kurucsev. 1994. Analysing DNA complexes by circular and linear dichroism. J. Mol. Recognit. 7:141–156. [DOI] [PubMed] [Google Scholar]
- Nordén, B., and F. Tjerneld. 1976. High-sensitivity linear dichroism as a tool for equilibrium analysis in biochemistry. Stability constant of DNA-ethidium bromide complex. Biophys. Chem. 4:191–198. [DOI] [PubMed] [Google Scholar]
- Oriel, P., and J. Schellman. 1966. Studies of the birefringence and birefringence dispersion of polypeptides and proteins. Biopolymers. 4:469–494. [DOI] [PubMed] [Google Scholar]
- Rodger, A. 1993. Linear dichroism. Methods Enzymol. 226:232–258. [DOI] [PubMed] [Google Scholar]
- Rodger, A., J. Rajendra, R. Marrington, M. Ardhammar, B. Nordén, J. D. Hirst, A. T. B. Gilbert, T. R. Dafforn, D. J. Halsall, C. A. Woolhead, et al. 2002. Flow oriented linear dichroism to probe protein orientation in membrane environments. Physical Chemistry Chemical Physics. 4:4051–4057. [Google Scholar]
- Simonson, T., and M. Kubista. 1993. DNA orientation in shear flow. Biopolymers. 33:1225–1235. [Google Scholar]
- Takakuwa, T., T. Konno, and H. Meguro. 1985. A new standard for calibration of circular dichroism: ammonium d-10-camphorsulfonate. Analytical Sciences. 1:215–218. [Google Scholar]
- Wada, A. 1964. Chain regularity and flow dichroism of deoxyribonucleic acids in solution. Biopolymers. 2:361–380. [Google Scholar]
- Wada, A. 1972. Dichroic spectra of biopolymers oriented by flow. Applied Spectroscopy Reviews. 6:1–30. [Google Scholar]
- Wada, A., and S. Kozawa. 1964. Instrument for the studies of differential flow dichroism of polymer solutions. Journal of Polymer Science Part A. 2:853–864. [Google Scholar]
- Wells, R. D., J. E. Larson, R. C. Grant, B. E. Shortle, and C. R. Cantor. 1970. Physicochemical studies on polydeoxyribonucleotides containing defined repeating nucleotide sequences. J. Mol. Biol. 54:465–497. [DOI] [PubMed] [Google Scholar]
- Wilson, R., and J. Schellman. 1978. The flow linear dichroism of DNA: comparison with the bead-spring theory. Biopolymers. 17:1235–1248. [DOI] [PubMed] [Google Scholar]


