Abstract
We describe a unique mitochondrial oscillator that depends on oxidative phosphorylation, reactive oxygen species (ROS), and mitochondrial inner membrane ion channels. Cell-wide synchronized oscillations in mitochondrial membrane potential (ΔΨm), NADH, and ROS production have been recently described in isolated cardiomyocytes, and we have hypothesized that the balance between superoxide anion efflux through inner membrane anion channels and the intracellular ROS scavenging capacity play a key role in the oscillatory mechanism. Here, we formally test the hypothesis using a computational model of mitochondrial energetics and Ca2+ handling including mitochondrial ROS production, cytoplasmic ROS scavenging, and ROS activation of inner membrane anion flux. The mathematical model reproduces the period and phase of the observed oscillations in ΔΨm, NADH, and ROS. Moreover, we experimentally verify model predictions that the period of the oscillator can be modulated by altering the concentration of ROS scavengers or the rate of oxidative phosphorylation, and that the redox state of the glutathione pool oscillates. In addition to its role in cellular dysfunction during metabolic stress, the period of the oscillator can be shown to span a wide range, from milliseconds to hours, suggesting that it may also be a mechanism for physiological timekeeping and/or redox signaling.
INTRODUCTION
Biological systems have evolved to adapt quickly to changes in the environment, and require dynamic control mechanisms that may operate near the edge of instability (Aon and Cortassa, 1997; Aon et al., 2003; Bak et al., 1987; Sornette, 2000). Dynamic control can be manifested as oscillations: physiological examples include bursts of insulin release from pancreatic islets, cytosolic calcium oscillations, and electrical pacemakers in nerve and cardiac cells (Berridge and Galione, 1988; Brown et al., 1984; Longo et al., 1991; Woods et al., 1986). The disadvantage of this type of physiological control is that it may lead to unproductive or destructive outcomes when the system is stressed. Oscillations of energy metabolism under conditions of metabolic stress have been observed (Chance et al., 1965; O'Rourke et al., 1994), but thus far, no detailed explanation for this phenomenon has been given.
The first description of heart mitochondrial oscillations can be traced back to the work of Chance and Yoshioka (1966) and oscillations in ionic currents across mitochondrial membranes were explored in several studies of that era (reviewed in Gooch and Packer, 1974). Subsequent work on mitochondrial suspensions showed that a pulse of Sr2+ (a Ca2+ analog that is efficiently transported across mitochondrial membranes) could trigger sustained oscillations of fluxes of divalent ions (reviewed in Evtodienko, 2000), establishing one mechanism by which mitochondria may function as oscillators.
Our laboratory described spontaneous metabolic oscillations in substrate-deprived cardiac myocytes that were shown to drive oscillations in sarcolemmal K+ currents, action potentials, and Ca2+ transients (O'Rourke, 2000; O'Rourke et al., 1994). An investigation of the subcellular spatiotemporal patterns of this phenomenon revealed heterogeneous mitochondrial polarization and propagated mitochondrial redox waves (Romashko et al., 1998).
More recently, a mechanism underlying synchronization and propagation of mitochondrial oscillation in intact cells was explored in detail by employing localized oxidative stress with two-photon excitation (Aon et al., 2003). Cell-wide synchronized oscillations in mitochondrial NADH levels, ΔΨm, and reactive oxygen species (ROS) production could be reproducibly triggered in the presence of glucose, after laser-flash of a small portion of the mitochondrial network. Oscillations were interrupted or prevented either by inhibiting mitochondrial ROS production, by increasing the ROS scavenging capacity of the cell, or by compounds that block inner membrane anion channels. Importantly, the oscillatory depolarizations of ΔΨm did not involve the classical permeability transition pore or depend on intracellular Ca2+, underscoring the unique features of the mitochondrial oscillator in the intact myocyte (Aon et al., 2003).
The results described above demonstrate that oscillation of the mitochondrial energy state occurs as a consequence of the interplay between mitochondrial ROS production and ROS scavenging systems of the cell. With no prior assumptions other than those suggested by the experimental data, the present study formulates a mathematical model that incorporates mitochondrial ROS production, ROS scavenging, and inner membrane anion channels (IMAC) into a previously developed model of cardiac mitochondrial energetics (Cortassa et al., 2003). These features are shown to be key factors for initiating oscillations in mitochondrial bioenergetic parameters, which closely resemble experimental observations. Furthermore, the model is used to make predictions that are experimentally verified. Strikingly, the model simulations also demonstrate that the period of the mitochondrial oscillator can be modulated over a wide range of timescales (from milliseconds to several hours) by altering a single parameter, the rate of ROS scavenging by superoxide dismutase.
METHODS
Cardiomyocyte isolation
All experiments were carried out at 37°C on freshly isolated adult guinea pig ventricular myocytes prepared by enzymatic dispersion as previously described (O'Rourke et al., 1994). After isolation, cells were stored briefly in a high K+ solution (in mM: 120 Glutamate [K+ salt], 25 KCl, 1 MgCl2, 10 HEPES, 1 EGTA, pH 7.2 with KOH) and either used immediately or transferred to Dulbecco's Modification of Eagle's Medium (10-013 DMEM, Mediatech, Herndon, VA) in laminin-coated petri dishes in a 95% O2, 5% CO2 incubator at 37°C (used within 6–8 h of isolation), as previously described (Aon et al., 2003). Experimental recordings started after exchange of the high K+ or DMEM with an experimental Tyrode's solution containing (in mM): 140 NaCl, 5 KCl, 1 MgCl2, 10 HEPES, 1 CaCl2, pH 7.4 (adjusted with NaOH), supplemented with 10 mM glucose. The dish containing the cardiomyocytes was equilibrated at 37°C with unrestricted access to atmospheric oxygen on the stage of a Nikon E600FN upright microscope (Nikon, Melville, NY).
Fluorescent probes for two-photon laser scanning microscopy
The cationic potentiometric fluorescent dye TMRE (100 nM) or TMRM (60 nM) was used to monitor changes in ΔΨm, and ROS production was monitored with the ROS-sensitive fluorescent probe 5-(-6)-chloromethyl-2′,7′-dichlorohydrofluorescein diacetate (CM-H2DCFDA 2 μM), as previously described (Aon et al., 2003). The production of the fluorescent glutathione adduct GSB (Kosower and Kosower, 1987) from the reaction of cell permeant monochlorobimane (MCB, 50 μM) with reduced glutathione (GSH), catalyzed by glutathione S-transferase, was used to measure intracellular glutathione levels. NADH autofluorescence was also monitored, as described previously (Aon et al., 2003).
Image acquisition and analysis
Images were recorded using a two-photon laser scanning microscope (MRC-1024MP, Bio-Rad, Hercules, CA) with excitation at 740 nm (Tsunami Ti:Sa laser, Spectra-Physics, Mountain view, CA), as described before (Aon et al., 2003). Briefly, owing to the overlap in the cross sections for two-photon excitation of the three fluorophores of interest (TMRE, CM-DCF, and NADH or GSB), this wavelength permitted recording of ΔΨm, ROS production, and NAD(P)H or GSH simultaneously. The red emission of TMRE was collected at 605 ± 25 nm and the green emission of CM-DCF was recorded at 525 ± 25 nm. NADH emission was collected as the total fluorescence <490 nm.
While measuring GSB production in cells, approximately 10 images were recorded to get the cellular background of NADH before acute addition of 50 μM MCB. The GSB signal was collected at its maximal emission (480 nm). Under these conditions the fluorescence intensity of GSB is 2–3-fold higher than NADH (manuscript in preparation).
Mathematical modeling
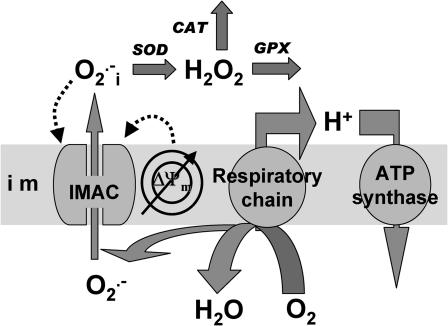
An integrated model of mitochondrial energetics (Cortassa et al., 2003) has been extended to describe the key features of the mechanistic hypothesis, ascertained from experimental findings. These included a shunt of electrons of the respiratory chain toward the generation of  a ROS scavenging system, and a ROS-activated anion efflux pathway across the inner membrane. We follow a modular approach, characterizing each of the processes in isolation to match experimental evidence, before assembling the whole model. The scheme for the integrated model is shown in Fig. 1.
FIGURE 1.
Model of mitochondrial energetics coupled to ROS production, transport, and scavenging. Equations describing the IMAC and the ROS scavenging system (see Appendix, Eqs. A8–A11) were incorporated into an integrated model of mitochondrial energetics and Ca2+ handling (Cortassa et al., 2003). ROS production was modeled as a shunt of electrons from the electron transport chain into the matrix (see Methods and Appendix). The model postulates that superoxide anion ( ) is transported through the IMAC whose opening probability is activated by cytoplasmic (intermembrane) superoxide anion (
 ). Key to abbreviations: im, inner mitochondrial membrane; IMAC, inner membrane anion channel; CAT, catalase; SOD, Cu,Zn superoxide dismutase; GPX, glutathione peroxidase.
Mitochondrial ROS generation
Mitochondrial ROS generation is considered as a side path for electrons diverging from the normal electron transport chain (see Eq. A6). To avoid adding complexity to the overall system of equations, the redox chain was not broken down into individual components; however, this leakage of electrons to free-radical production is akin to  generation by the Q-cycle at complex III (Turrens, 2003; Turrens et al., 1985) at the matrix face of the membrane, as suggested by our previous study (Aon et al., 2003). A detailed explanation of the experimental evidence from our laboratory justifying this formulation is given in the Appendix.
Modeling the inner membrane anion channel (IMAC)
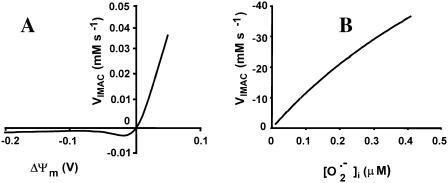
Although the molecular entity carrying anion fluxes in mitochondria has yet to be found, patch-clamp studies have identified a so-called centum picoSiemen conductance anion channel that carries the predominant outwardly rectifying background conductance of the inner membrane (Borecky et al., 1997; Kinnally et al., 1993; Sorgato et al., 1987). This channel is known to be modulated by Mg2+ and pH, and inhibited by benzodiazepines (McEnery et al., 1992) and a number of other amphiphilic compounds (Beavis, 1992; Borecky et al., 1997). Hence, we based our model of IMAC on the current-voltage properties of the ∼100-pS mitochondrial anion channel described by Borecky and co-workers (Fig. 2 A).
FIGURE 2.
Modeling of IMAC. (A) The current-voltage relationship for IMAC was formulated as previously reported (Borecky et al., 1997). The rate of anion flux through IMAC (VIMAC; in mM s−1) is described by Eq. A12. The transport of  across the inner mitochondrial membrane is proportionally coupled to the IMAC rate, driven by the Nernst potential for
  (see Eq. A13). The
  concentration in the plot in A is 0.1 nM. In B, the membrane potential was fixed at −180 mV. The parameters used in the plots are Gl = 0.0782 mM s−1 V−1; Gmax = 7.82 mM s−1 V−1; κ = 70 V−1;
  ; Kcc = 1.0 × 10⁻² mM (A) or 1.0 × 10⁻³ mM (B); a = 1.0 × 10⁻³; and b = 1.0 × 10⁴.
Activation of the IMAC open probability by cytoplasmic (intermembrane)  is included in the model (Fig. 2 B). This feature is based on the experimental observations that:
ROS scavengers suppress the oscillations and preserve ΔΨm polarization (Aon et al., 2003).
Cell-wide ΔΨm depolarizations are blocked by two structurally different ligands of the mitochondrial benzodiazepine receptor, 4′-chlorodiazepam and PK11195, as well as DIDS, whereas localized ROS accumulation is potentiated in the laser-flashed region of the cell (Aon et al., 2003).
IMAC in isolated mitochondria has been shown to be redox-sensitive (Beavis, 1992).
In the model,  transport through the IMAC (the mitochondrial membrane is impermeable to
  ; Takahashi and Asada, 1983) is driven by the electrochemical gradient for anions. Hence, the release of
  from the mitochondrial matrix (
 ) is stimulated by
  (Fig. 2 B) in a positive feedback loop.
Modeling the cytoplasmic ROS scavenging system
The enzymatic activities which degrade or interconvert the principal free-radical species,  and hydrogen peroxide (H2O2), are modeled according to previously published work, with small modifications to incorporate recent experimental evidence. For a detailed description and parameters, see the Appendix.
For simplicity, the mitochondrial matrix ROS scavenging system (MnSOD, matrix glutathione peroxidase) is not included in the model. Incorporation of mitochondrial matrix ROS scavenging would shift the threshold for activation of the positive feedback component of the model (regenerative ROS release), but would not change the fundamental mechanisms described in this study.
Model building and numerical methods
The model has been built using a modular approach, as previously described (Cortassa et al., 2003). Numerical integration of model equations has been performed with MATLAB (Vers. 6.5, Rel. 13, The MathWorks, Natick, MA) until steady-state solutions were obtained (i.e., when the magnitude of each time derivative was ≤10−13). Steady-state values of each state variable are then used as input to software for performing bifurcation and continuation analysis (AUTO 1997, E. Doedel, Concordia University, Montreal, Quebec, Canada). This software is used to determine the dependence of steady-state solution properties (type and stability) on model parameters. The eigenvalues characterizing the bifurcation properties of the model dynamics are also analyzed.
RESULTS
Induction of cell-wide synchronized mitochondrial oscillations in heart cells
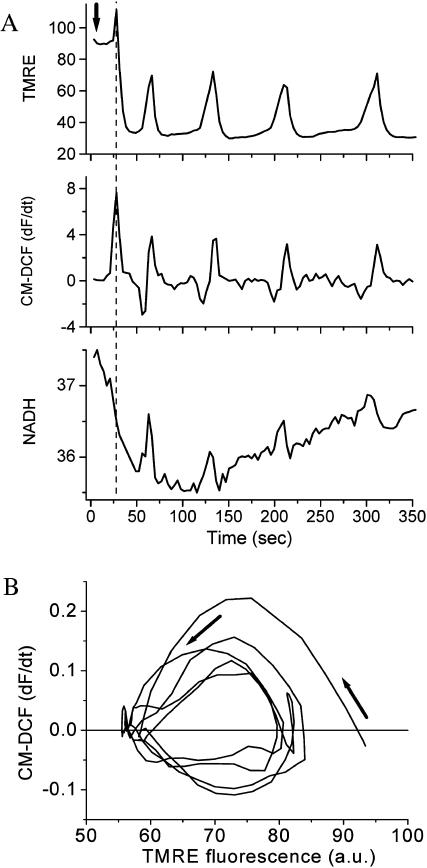
Using two-photon laser scanning microscopy, we triggered cell-wide, synchronized, mitochondrial oscillations in cardiomyocytes with a highly localized laser flash, which depolarizes ΔΨm and generates a spatially confined release of ROS (Aon et al., 2003). Approximately 40 s after a flash, whole-cell oscillations in mitochondrial membrane potential (ΔΨm) (Fig. 3 A, top panel) and NADH levels (Fig. 3 A, bottom panel) were observed, associated with bursts in the rate of mitochondrial ROS production (Fig. 3 A, middle panel). ΔΨm depolarization occurs in concert with oxidation of NADH, with ROS production peaking during the rapid uncoupling of oxidative phosphorylation. A phase-plane plot of ΔΨm versus ROS production shows limit-cycle (Goldbeter, 1996) behavior (Fig. 3 B). The experimentally observed phase relationship between the depolarization of ΔΨm and the rate of ROS production is evident (Fig. 3 B), and is fairly reproduced by the model (Fig. 4 B).
FIGURE 3.
Experimental characterization of mitochondrial oscillations. (A) Simultaneous, whole-cell recordings of the temporal evolution of fluorescence intensity for TMRE, CM-DCF (dF/dt), and the endogenous NADH signals (fluorescence expressed in arbitrary units; a.u.). Oscillations in mitochondrial metabolism were triggered in cardiomyocytes loaded with TMRE (ΔΨm indicator) and CM-H2DCFDA (ROS-sensitive) (37°C) after a local laser flash (arrow), as previously described (Aon et al., 2003). Briefly, an 8.7 × 8.7-μm region of the cell was excited in a single flash resulting in rapid loss of ΔΨm and local generation of ROS. (B) Representative phase-plane plot of the rate of ROS production (first derivative of the CM-DCF signal) versus ΔΨm (TMRE) showing the convergence of the dynamic behavior toward a limit cycle (arrows) after an initial wide excursion of the trajectory corresponding to the first mitochondrial ΔΨm depolarization (see Fig. 3 A, top panel). The negative values of the ROS signal derivative are due to fluorescence resonance energy transfer between TMRE and CM-DCF as previously described (Aon et al., 2003).
FIGURE 4.
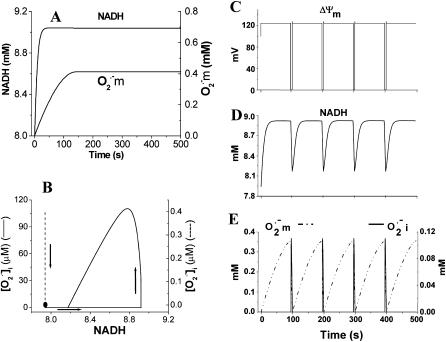
Simulation of sustained mitochondrial oscillations. Simulation of the integrated model of mitochondrial energetics with incorporated IMAC, ROS production, and ROS scavenging. Shown in A and C–E are the evolution of NADH and mitochondrial  toward steady (i.e., a fixed-point attractor) or oscillatory (i.e., limit-cycle) states, respectively. B shows the phase-plane plot of NADH and
  for the steady (dashed) and oscillatory (continuous) solutions. The change from a fixed-point attractor to limit-cycle behavior was achieved simply by increasing the concentration of respiratory chain carriers, ρres (see the model of Cortassa et al., 2003) from 2.0 × 10⁻⁶ mM to 2.5 × 10⁻⁶ mM, while keeping all other parameters constant (shunt = 0.0533;
  = 0.013 μM). The other parameters used in the simulations are described in the legend of Fig. 5.
Consistent with the model formulation that ROS are generated in proportion to the rate of oxidative phosphorylation, the oscillations could be suppressed by compounds that inhibit several complexes of the electron transport chain, or by blocking the adenine nucleotide translocator or the mitochondrial ATP synthase. In addition, the oscillations could be suppressed by inhibition of the transport of ROS to the cytoplasm with anion channel blockers, or enhancing the ROS scavenging capacity with a superoxide dismutase mimetic (Aon et al., 2003) or other scavengers (data not shown).
Simulation of mitochondrial oscillations
Novel dynamic behavior has been introduced into the mitochondrial model by incorporation of the features described above. By changing a single parameter (for example, the respiratory rate; Fig. 4 B), the model simulations either evolve asymptotically to a steady state (Fig. 4 A) or oscillate (Fig. 4, B–E), reproducing the period of the experimentally observed oscillations (∼100 s) as well as the phase relationship between ΔΨm and NADH (Fig. 4, C and D).
Mechanistically, the model simulations show that the burst in cytoplasmic ROS that accompanies ΔΨm depolarization is the result of a mixed process of accelerated  production (as a consequence of a burst in the rate of mitochondrial respiration during uncoupling; Fig. 4 D) and
  release (as a result of the self-amplifying effect on anion transport; Fig. 4 E). The rate of cytoplasmic
  accumulation temporarily exceeds the cytoplasmic buffering capacity of SOD, but falls off with prolonged depolarization of ΔΨm as NADH is consumed.
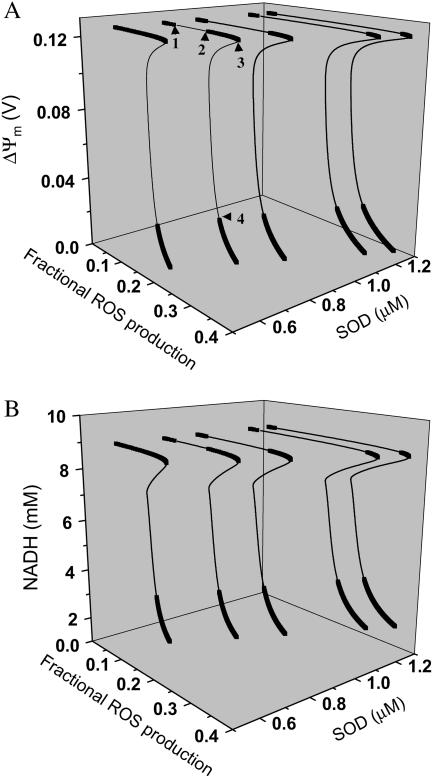
Extensive regions in the parameter space exhibit oscillatory behavior with stable limit cycles, as illustrated by inspection of bifurcation diagrams for two of the 15 state variables, ΔΨm (Fig. 5 A) and NADH (Fig. 5 B), plotted as a function of the ROS production and the concentration of SOD.
FIGURE 5.
Bifurcation diagrams of ΔΨm (A) and NADH (B) state variables as a function of ROS production and scavenging. The behavior of the whole model was studied with the AUTO 97 software, as a function of the fraction of respiratory flux diverted to  production (shunt, see Eq. A8 in the Appendix) and the rate of ROS scavenging, varied through the concentration of Cu,Zn SOD (
 ). The bifurcation diagrams showed an upper branch, in which ΔΨm was predominantly polarized, and a lower branch, in which ΔΨm was mainly depolarized. Thick lines indicate domains of stable steady-state behavior whereas thin lines denote either unstable or oscillatory states. A stable oscillatory domain, embedded within the upper branch, emerged as SOD concentration increased. The eigenvalues obtained from the stability analysis were further analyzed to obtain a detailed description of the transitions at the borders of the steady states. As a representative example, these points are labeled with numbered arrowheads in one of the bifurcation diagrams in A, corresponding to the following state transitions: 1 and 2 of the upper branch indicate Hopf bifurcations delimiting the oscillatory region (thin line), characterized by two pairs of complex conjugates with one pair showing positive real parts. In the stable regions of the diagram (thick lines), all real negative eigenvalues were found, and one or two pairs of complex conjugates, but with negative real parts; 3 and 4 denote limit points. At 3 the system “jumps” to the lower branch and stays there at a ROS production rate shunt value ≥0.231556, whereas at 4 the system dynamics can “jump” back to the upper branch and when the shunt ≤0.179225. Points 3 and 4 delimit an unstable region characterized by at least one or two real-positive eigenvalues and the rest real-negative. From left to right, the SOD concentration was (in μM): 0.5, 0.6, 0.79, 1.18, and 1.28. The simulations were performed with the following set of parameters (see Cortassa et al., 2003, for detailed parameter descriptions): concentration of respiratory chain carriers, ρres = 2.5 × 10⁻⁶ mM; concentration of F1F0 ATPase, ρF1 = 2.03 × 10⁻³ mM; [Ca2+]i = 0.1 μM; Kcc = 0.01 mM;
  = 2.4 × 10⁶ mM−1 s−1;
  = 1.7 × 10⁴ mM−1 s−1; GT = 0.5 mM; maximal rate of the adenine nucleotide translocase, VmaxANT = 5 mM s−1; and maximal rate of the mitochondrial Na-Ca exchanger,
  Remaining parameters were set as described in Table A1 and Cortassa et al. (2003).
The bifurcation diagrams have the typical S-shape that describes the behavior of systems exhibiting bistability (Aon and Cortassa 1997), and show an unstable region (thin lines) between the upper (polarized) and lower (depolarized) branches of steady states (thick lines; see, for example, the leftmost bifurcation plot in Fig. 5 A). Additionally, as the concentration of ROS scavenger increases, an oscillatory domain, flanked by Hopf bifurcations, appears within the upper branch of the curve. This domain gradually expands at higher SOD concentrations (from left to right in Fig. 5), and represents the parameter space in which transient depolarizations occur. Notably, a several-fold higher rate of ROS production is tolerated by the system before there is a transition to the steady depolarized state (Fig. 5). In the region of the diagram at the limits of the upper or lower branch, the model behavior changes precipitously. Regarding ΔΨm, it jumps from polarized to depolarized steady states or vice versa, whereas outside these very small regions it either stays in the upper or lower branch (see Fig. 5 legend). This illustrates the importance of the subtle balance between mitochondrial ROS generation and ROS buffering.
The behavior of the model agrees with experimental evidence that either increasing the concentration of ROS scavengers, or inhibiting respiration to decrease mitochondrial ROS production, inhibits oscillations in ΔΨm by stabilizing the polarized steady state, or by preventing the initial accumulation of ROS to the critical threshold (Aon et al., 2003). Simulated oscillations are annihilated either when the rate of ROS scavenging is high, or when respiration or the ATP synthase rate is low (Fig. 4 B; see also Fig. 7 D).
FIGURE 7.
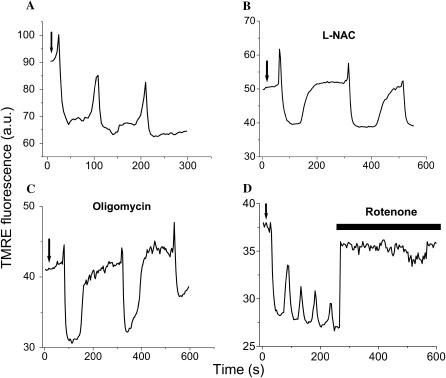
Effects of scavengers or inhibitors of ROS production on mitochondrial oscillations. Conditions are as described in the legend of Fig. 3. Recordings of the TMRE signal of myocytes showing cell-wide mitochondrial oscillations after a laser flash (arrows) in the absence (A) or in the presence of 4 mM n-acetyl-L-cysteine (L-NAC) for 30 min (B), or 10 μg/ml of oligomycin for 60 min (C), or after the acute addition of rotenone (15 μM) (D).
Sequence of events during ROS-triggered mitochondrial oscillations
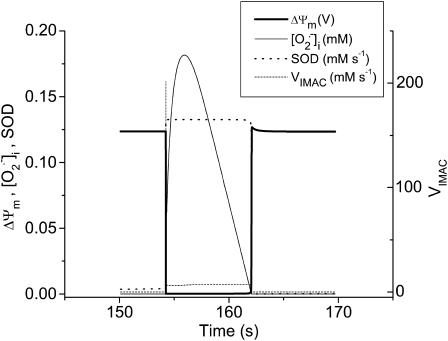
During an oscillatory cycle, the accumulation of  in the mitochondrial matrix and leakage to the cytoplasm leads to an abrupt increase in the open probability of the IMAC, reaching a peak concomitant with the onset of rapid depolarization of ΔΨm (Fig. 6). The current amplitude then decreases as a result of a reduction in the electrochemical driving force as ΔΨm nears the equilibrium potential for anions. A cytoplasmic
  transient occurs as a consequence of
  efflux temporarily overriding the capacity of SOD to dismutate the released
  The phase of self-amplification is terminated by IMAC closure, as
  is consumed to a great extent by the activated SOD (Fig. 6). Restoration of oxidative phosphorylation and ΔΨm then results in the renewed accumulation of
  progressively approaching the threshold for the regenerative response and initiating a new cycle (Fig. 4 C).
FIGURE 6.
Sequence of events occurring during an oscillatory cycle. The time course of changes in ΔΨm, IMAC flux, SOD activity, and cytosolic  during a single cycle of the mitochondrial oscillator. At a critical level of mitochondrial ROS accumulation (see Fig. 4 E) the IMAC channel rapidly opens, denoted by the spike in outward current, provoking the sudden release of
  from the mitochondria into the intermembrane space. The current through IMAC quickly declines due to the loss of ΔΨm (which decreases the driving force for anions; see Eq. A13). The rate of SOD increases in parallel with the burst of available
  and stays high until the
  is consumed, at which point IMAC closes, allowing ΔΨm to repolarize, initiating the next cycle.
Experimental verification of model predictions
Several predictions of the model were directly confirmed by experimental evidence. Short incubations with the ROS scavenger n-acetyl-L-cysteine (L-NAC; Fig. 7 B), or incomplete inhibition of oxidative phosphorylation by oligomycin (Fig. 7 C), prolonged the period of oscillation by approximately twofold (from ∼100 s to ∼200 s; Fig. 7, A–C). Similar results were achieved by incubating myocytes with 2-mercaptopropionyl glycine or reduced glutathione (not shown). These results are consistent with a reduction in the rate of accumulation of ROS to the critical threshold level at the activation site of the channel (Fig. 4 E). In the case of oligomycin, this is due to a decreased rate of  production by the electron transport chain. In the case of the ROS scavengers, the threshold is altered due to the increased oxidant buffering capacity of the cytoplasm. For comparison to the model simulations, these interventions correspond to manipulation of either the rate of ROS production or the rate of ROS scavenging, that is, moving along the x or y axes within the upper branch of the bifurcation diagram in Fig. 5.
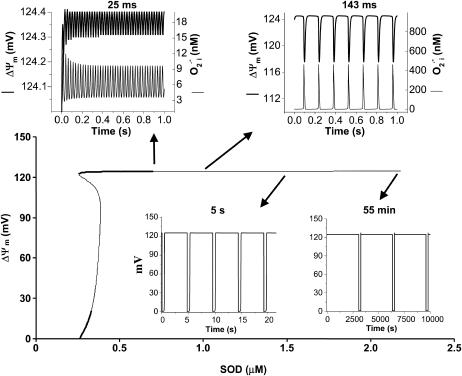
As shown in Fig. 9, periods of the mitochondrial oscillation encompassing ultrafast (ms) to slow (h) time domains are theoretically possible. High frequency oscillations (25 to ∼140 ms period) with very small (μV) or small (10 mV) amplitude oscillations in ΔΨm are associated with oscillatory levels of  that are of potential physiological significance (in the nM range) (Fig. 9). The remarkable temporal modulation can be achieved with only slight changes in the rate of ROS scavenging by SOD concentrations within the micromolar range (see also Fig. 5).
FIGURE 9.
Modulation of the oscillation period through changes in the rate of ROS scavenging. The bifurcation diagram for ΔΨm of the complete model as a function of SOD concentration is depicted. The model parameters used to run the simulations for shunt = 0.0744 were the same as those described in the legend of Fig. 5. Oscillation periods of 25 ms, 143 ms, 5 s, and 55 min were observed for SOD concentrations of 0.75 μM, 1.07 μM, 1.50 μM, and 2.20 μM, respectively.
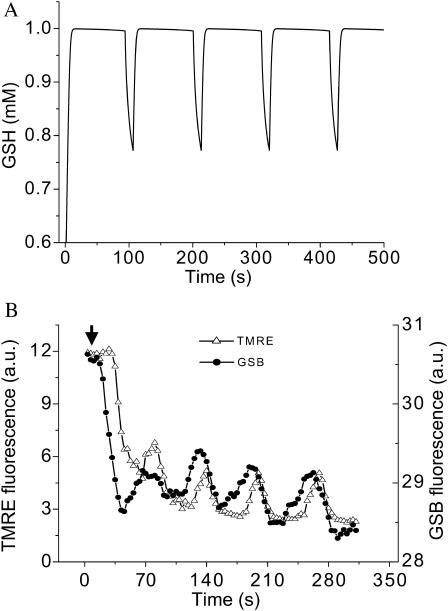
Furthermore, the model predicted oscillations in the reduced glutathione level in phase with ΔΨm (Fig. 8 A and see also Fig. 4 C). This parameter could be measured in myocytes loaded with the indicator monochlorobimane (MCB). The experimental evidence confirmed the model prediction that GSH is transiently oxidized during mitochondrial depolarization (Fig. 8 B). The decrease in the fluorescence signal of glutathione S-bimane (GSB) is due to a displacement to the left of the equilibrium reaction catalyzed by glutathione S-transferase: MCB + GSH ⇔ GSB, as a result of GSH consumption.
FIGURE 8.
Glutathione oscillations. (A) Simulation of glutathione (GSH) oscillations (100-s period) under the same parametric conditions described in Fig. 4, C–E. (B) Experimental demonstration of GSH oscillations (∼70 s period) recorded simultaneously with ΔΨm. Freshly isolated cardiomyocytes were loaded with 100 nM TMRM and 50 μM MCB, as described in Methods. Oscillations were triggered after a localized laser flash, as previously described (Aon et al., 2003). Arrow indicates the timing of the flash. The decrease in the GSB signal corresponds to a drop in the reduced glutathione pool (see text for further explanation).
DISCUSSION
The properties of the mitochondrial oscillator described here, together with the spatial analysis of our experimental observations (Aon et al., 2004), reveal how the organization of mitochondrial metabolism is a quintessential example of a complex dissipative system (Nicolis and Prigogine, 1977) that can display dynamical instabilities when a critical threshold level of a control parameter (e.g., ROS) is reached. In previous work, we showed that criticality in the mitochondrial network of the heart cell is reached when a threshold level of ROS is attained (Aon et al., 2003) and a mitochondrial cluster that spans the whole cell is formed (Aon et al., 2004). Individually, the mitochondria present in the cluster possess a threshold level of ROS that, when crossed, triggers a synchronized depolarization (Aon et al., 2004).
Uniquely, although the mitochondrial network phase transition is continuous in space, mitochondria exhibit self-organized sustained oscillations—implying that a bifurcation (i.e., a discontinuity in time) has taken place. In agreement with the latter, the present model exhibits Hopf bifurcations, a signature of stable limit cycles (see Fig. 5 legend). The experimentally observed oscillations (Fig. 3) could be reproduced in the model of mitochondrial energetics (Fig. 4) by incorporating respiration-dependent ROS production, a ROS scavenging system, and ROS activation of IMAC, illustrating that the balance among production, transport, and scavenging of ROS determines the oscillatory behavior.
The period and phase relationships between mitochondrial depolarization, oxidation of the NADH pool and the bursts of ROS production in model simulations agree remarkably well with experimental data (Figs. 3 and 4). Moreover, model predictions about the effects of ROS scavenging, electron transport inhibition, and oscillations in reduced glutathione were supported by direct experimental tests, demonstrating its predictive power.
Mechanistic features of the mitochondrial oscillator
Our model postulates that the sudden release of ROS through IMAC produces a spike of  in the intermembrane space of mitochondria that is quickly consumed by SOD (Fig. 6). This is in agreement with the recent finding that Cu,Zn SOD is present in the intermembrane space of yeast (Sturtz et al., 2001) and rat liver mitochondria (Okado-Matsumoto and Fridovich, 2001). The concentration of SOD surrounding the mitochondrion will not only be an important determinant of the dynamic behavior of the mitochondrion, but will also set the concentration profile of
  experienced by neighboring mitochondria. We have recently described how such local interactions among mitochondria shape the macroscopic response of the whole cell through percolation in a mitochondrial spanning cluster (Aon et al., 2004). The present findings support the idea that mitochondria are organized as a network of oscillators (O'Rourke, 2000), with varying degrees of functional coupling depending on conditions.
Although our experimental findings (Aon et al., 2004) and modeling implicate the matrix face of the inner mitochondrial membrane as the site where  is released from complex III, other authors have shown that this free radical can be also released on the cytoplasmic side (Han et al., 2003; St. Pierre et al., 2002).
From the point of view of nonlinear dynamics, the mitochondrial oscillator exhibits several interesting (and some unique) features. It behaves as a relaxation oscillator, comprised of both slow (the ROS buildup in the mitochondrial matrix) and fast (the IMAC opening and rapid ROS release) processes (Fig. 4, C, and E, and Fig. 6). The stability analyses (depicted in Figs. 5 and 9) show that the model exhibits a complex bifurcation behavior for a variety of parameter sets. At the borders between stable and oscillatory states, a small input (i.e., a hard excitation; Minorsky, 1962) can trigger self-sustaining oscillations in energy production (Fig. 4, B–D).
At high rates of fractional ROS production, loss of ΔΨm to a stable depolarized state is favored (Fig. 5 A), thus representing, in silico, the progression to necrotic or apoptotic cell death. This balance between stability and instability in a control system optimizes its response to environmental changes, but in the present case, leads to emergent macroscopic behavior. For example, limit-cycle oscillation (temporal organization) and synchronization of the response throughout the entire mitochondrial network of the cell (spatiotemporal organization; Aon et al., 2004) was observed when the balance between ROS production and scavenging pushed the system to a bifurcation point. Indeed, this event represents a defining moment for the cell, the turning point between physiology and pathophysiology.
Physiological implications of mitochondrial oscillations
The delicate balance between ROS production and scavenging is also likely to play a role in normal cell physiology (Droge, 2002; Haddad, 2002; Martin and Barrett, 2002). In this light, the mitochondrial oscillator is remarkable both for its ability to simulate the response of the myocyte to oxidative stress and for the capacity to modulate its period over a wide range, from milliseconds to hours, with relatively small changes in one parameter, e.g., the rate of ROS scavenging by SOD (Fig. 5). Since bursts of ROS are a primary output of the mitochondrial oscillator, and there is widespread evidence that many signaling and transcriptional activation cascades respond to ROS (Droge, 2002; Haddad, 2002), it is tempting to speculate that mitochondrial oscillation may also play a role in intracellular signaling or timekeeping (Lloyd, 1998). Presumably, intracellular signaling will be associated with low-amplitude and high-frequency oscillatory states (Fig. 9) so that catastrophic effects on energy production would not ensue (Fig. 5). Timing exerted by oscillatory mechanisms are found throughout the biological world and their periods span a wide range from milliseconds as in the action potential of neurons and the heartbeat to the slow evolutionary changes that require thousands of generations. Having a frequency-encoded response modulated directly by metabolic demand, substrate availability, ROS, or local antioxidant capacity would provide the cell with an elegant way to mount an adaptive response to its environment by crafting a well-discriminated ROS signal above a variable background, analogous to the behavior of frequency-encoded Ca2+ signaling cascades (Berridge and Galione, 1988; Rooney et al., 1989).
Relevance of mitochondrial oscillations during ischemia-reperfusion
Studies of ischemia-reperfusion injury have unequivocally demonstrated that an increase in mitochondrial ROS generation contributes to the loss of mitochondrial and cellular function (reviewed in Sadek et al., 2003). We propose that the mechanism elaborated here, and in our related studies (Aon et al., 2003, 2004a), describe seminal events occurring upon reperfusion after ischemia, when electron flow is restored, NADH levels are high, and the rate of ROS accumulation accelerates (Marczin et al., 2003; Sadek et al., 2003). The consequences of the critical behavior of the mitochondrial network include dispersion of action potential repolarization (O'Rourke, 2000; O'Rourke et al., 1994), electrical and contractile inexcitability, and, if the transition progresses to the stable depolarized state, cell death. However, the present model suggests that specific interventions could permit stabilization and recovery of mitochondrial function, in contrast with the more severe situation that may be encountered when conditions favor the opening of the large conductance permeability transition pore (Zorov et al., 2000).
Elucidating the mechanism of mitochondrial ROS production, transport, and buffering will be the key to preventing irreversible oxidative damage during ischemia and reperfusion. Several mitochondrial targets are known to be damaged by free radicals, including the activity of electron transport complexes I, III, and IV, ATP synthase, and adenine nucleotide translocase (e.g., Hardy et al., 1991; Lesnefsky et al., 1997; Vuorinen et al., 1995). A number of TCA cycle enzymes are also susceptible, including α-ketoglutarate dehydrogenase (KGDH), succinate dehydrogenase, and aconitase (Sadek et al., 2003).
In Summary, although the role of mitochondrial oscillation in physiological ROS-mediated signaling remains to be determined, it unquestionably contributes to energetic and electrical dysfunction in the cardiomyocyte (Aon et al., 2003; O'Rourke, 2000; O'Rourke et al., 1994), and reveals the inherent balance of the forces involved in mitochondrial oxidative phosphorylation. It is hoped that the analytical framework for this complex system will lead to a better understanding of the mechanisms underlying life and death decisions in the cell, ultimately allowing us to prevent or reverse the pathophysiological consequences of metabolic or oxidative injury.
Acknowledgments
We thank Eric Horvath for his help with the MATLAB code and E. Doedel (Concordia University, Montreal, Quebec, Canada) for advice in the stability analysis using the software AUTO.
Supported by National Institutes of Health (RO1 HL54598) to B.O'R. and National Institutes of Health (RO1 HL60133-01, P50 HL52307), The Whitaker Foundation, and the Falk Medical Trust to R.L.W.
APPENDIX: MODELING SUPEROXIDE PRODUCTION IN THE RESPIRATORY CHAIN
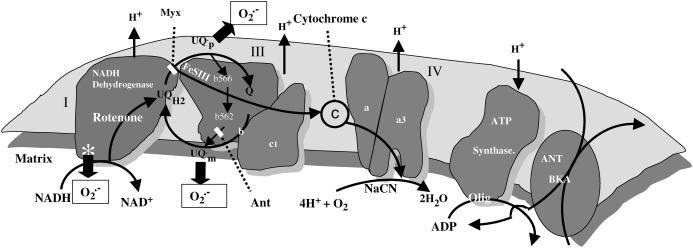
Superoxide production by isolated heart mitochondria can occur at two main sites in the respiratory chain, Complex I (NADH dehydrogenase) or Complex III (cytochrome bc1 complex) (Turrens, 2003; see also Fig. A1, this article). The extent of electron leakage to  at each of these sites is regulated in very different and diametrically opposite ways. In the presence of NADH-linked substrates,
  production by Complex I is favored when the NADH/NAD+ redox couple is almost completely reduced. Indeed, in a recent study by Kushnareva et al. (2002), the redox potential of the site of ROS production by Complex I was estimated to be ∼−392 mV, which is ∼72 mV more negative than the NADH/NAD+ redox couple itself. Hence, ROS production from this thermodynamically unfavorable state is usually promoted by inhibiting respiration, for example, with rotenone, which blocks Complex I at a site distal to the
  generating redox center. Blocking electron flow farther down the chain, e.g., by depleting cytochrome c, can also enhance
  production at Complex I (Kushnareva et al., 2002), by reducing the electron carriers upstream from the inhibited site. Reduction of Complex I and associated ROS production can also be induced by reverse electron flow from succinate to NAD+ (Turrens and Boveris, 1980). Thus,
  generation by Complex I requires a highly reduced electron transport chain and low electron flow (essentially State 4 conditions), as well as a ready supply of oxygen. This has led to the suggestion that a certain level of “mild uncoupling” of oxidative phosphorylation may be a mechanism for inhibiting this source of mitochondrial ROS production (Starkov and Fiskum, 2003).
FIGURE A1.
Scheme of the possible pathway of ROS generation in the electron transport chain. The two possible sites of ROS generation at the level of Complexes I and III in the respiratory chain are shown along with the sites of action of several inhibitors (reproduced from Aon et al., 2003, J. Biol. Chem., with permission).
In contrast, the generation of  by the “Q-cycle” of Complex III, which involves the formation of ubisemiquinone to donate electrons to molecular O2, requires not only a supply of substrates to drive the reduction of coenzyme Q, but also the continuous availability of downstream electron acceptors (Turrens et al., 1985). In other words, there is a positive correlation between electron flow through the respiratory chain and ROS production. In this case, blocking electron flow into the Q-cycle with rotenone or reducing the non-heme FeSIII electron acceptor of Complex III by inhibiting sites downstream (e.g., by inhibiting cytochrome oxidase with CN−, or inducing State 4 by inhibition of the ATP synthase or the adenine nucleotide carrier) will inhibit the production of ROS by Complex III. This was elegantly shown by Turrens et al. (1985), who demonstrated a correlation between electron flow, respiration, and ROS production at Complex III by titration of cytochrome c back into cytochrome c-depleted mitochondria.
Since these models of mitochondrial ROS production are almost exclusively based on data from isolated mitochondria, the question remains as to which site is important in intact myocytes or muscles, and especially, which site is relevant to the oscillatory behavior that we show here. All of the experimental evidence that we have obtained in isolated ventricular myocytes has indicated that  generation occurs at the level of complex III. Inhibiting the electron transport chain either upstream (rotenone) or downstream of Complex III (CN−, oligomycin, bongkrekic acid), or inhibiting the formation of ubisemiquinone (myxothiazol), suppressed oxidant stress-induced mitochondrial matrix ROS production and inhibited the oscillatory phenomenon (Aon et al., 2003). Only when the accumulation of ubisemiquinone was favored by antimycin A treatment, could we see a marked increase (twofold) in ROS production with respect to the control (Aon et al., 2003).
In the presence of the electron transport inhibitors, with the exception of antimycin, mitochondrial ROS production was minimal, despite maintained ΔΨm and reduction of the NADH pool. We found no evidence (either in our experiments or in the literature) that rotenone could increase ROS production in intact heart cells, indicating that although ROS can be generated from Complex I in isolated mitochondria, this site is not an important physiological source of ROS in the heart.
All of the available evidence was consistent with Complex III as the main source of  production in cardiac myocytes. ROS production at this site is proportional to respiration (see Fig. 6 of Turrens et al., 1985), providing the rationale for formulating the production of
  as a fraction of the respiratory rate. Since the rate of respiration (VO2) in the model is a complex function of NADH production, proton pumping, ΔΨm, and ADP (Cortassa et al., 2003),
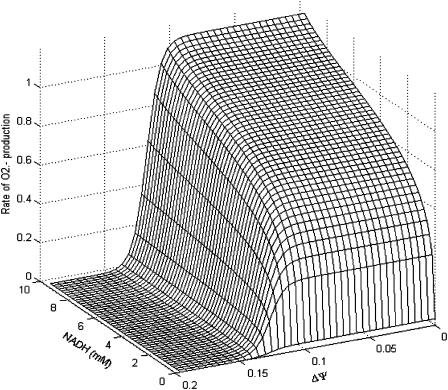
  generation also varies as a function of these parameters. This is illustrated in Fig. A2. Note that the dependence of ROS production on NADH and ΔΨm differs from earlier models (Demin et al., 1998; Kushnareva et al., 2002; Turrens, 2003), in that
  production is minimal in State 4 (when respiration is low, ΔΨm is high, and the NADH pool is reduced). This behavior was completely consistent with our experimental observations of the relationship between ROS production and ΔΨm during metabolic oscillation in intact myocytes (see Fig. 3, this article; see also Aon et al., 2003).
FIGURE A2.
Dependence of the rate of  generation on NADH and ΔΨm. The rate of
  production, modeled as in Eq. A8 (in mM s−1), was studied as a function of the redox potential, varied through the concentration of NADH, and the membrane potential, ΔΨm, expressed in V units. For a more explicit expression of VO2 see Eq. 26 in Cortassa et al. (2003). The parameters used are: ρres = 0.012 mM; ΔpH = −0.6; and shunt = 0.05.
Alternative models of ROS production, based on evidence obtained in isolated mitochondria showing high levels of ROS production in the presence of electron transport inhibitors (e.g., rotenone), could not reproduce the experimental results in intact myocytes. For example, Kushnareva et al. (2002) proposed a simple model of ROS generation at the level of NADH dehydrogenase that is described by the equation
 |
(A1) |
where the level of electron donors to generate superoxide, *ROS·−, is related to the redox potential through the equilibrium constant as
 |
(A2) |
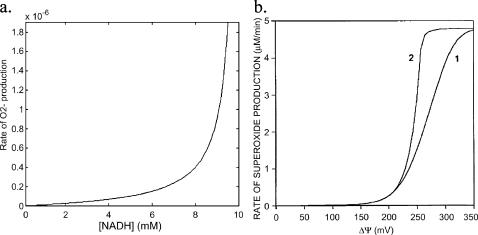
Because of the conservation relationship affecting the redox couple NADH/NAD+, and assuming that most of the electron donor is in the nonreducing state (Eq. A2), the rate of  formation increases exponentially with the concentration of NADH, as shown in Fig. A3 a. Another theoretical model of ROS generation has been reported by Demin et al. (1998). This model correlated high rates of mitochondrial ROS production with high ΔΨm (Fig. A3 b), which may be true for ROS generated at Complex I in isolated mitochondria, but was introduced ad hoc into the model by incorporating a ΔΨm dependence of the equilibrium and rate constants for the steps of electron transport (see Eq. 16 of Demin et al., 1998). This model also could not account for the observed
  production in isolated cardiomyocytes.
FIGURE A3.
Rate of  generation as function of NADH concentration. (a) The rate of
  production at Complex I was modeled according to Kushnareva et al. (2002). In the calculation, we assume that most of the electron donor is in the nonreduced state and that there is an equilibrium relationship between the NADH/NAD+ couple and the electron donor site in its reduced and oxidized state (see Eqs. A1 and A2). The equilibrium constant between NADH and the electron donor was considered equal to 0.01 and the rate constant k′ = 1.0 mM−1 s−1. (b) The rate of
  production was studied as a function of ΔΨm according to the minimal model described in Demin and co-workers (reproduced from Demin et al., 1998, Mol. Cell Biochem., with permission).
Modeling cytosolic superoxide dismutase (Cu,Zn SOD)
The activity of Cu,Zn SOD was modeled according to the kinetic scheme proposed by McAdam et al. (1977; see also Chance et al., 1979). The rate expression for SOD has been modified to account for inhibition of the enzymatic activity by H2O2 (Bray et al., 1974; Liochev and Fridovich, 2002) as
 |
(A3) |
The parameters used in all the model rate equations are those indicated in Table A1.
TABLE A1.
Model parameters
| Symbol | Value | Units | Description | Eq. | Ref. |
|---|---|---|---|---|---|
| GL | 0.0782 | mM s−1 V−1 | Leak conductance for IMAC | A12 | 1 |
| Gmax | 7.82 | mM s−1 V−1 | Integral conductance of IMAC at saturation | A12 | 1 |
| a | 1.0 10−3 | Basal IMAC conductance | A12 | ||
| b | 1.0 104 | Activation factor by cytoplasmic O2·− | A12 | ||
| κ | 70 | V−1 | Steepness factor | A12 | 1 |
 |
0.004 | V | Potential at half saturation | A12 | 1 |
| Kcc | 0.01 | mM | Activation constant of IMAC by O2·− | A12 | |
 |
2.4 106 | mM−1 s−1 | Second-order rate constant of conversion between native oxidized and reduced superoxide dismutase (SOD) | A3 | 2 |
 |
4.8 104 | mM−1 s−1 | Second-order rate constant of conversion between native reduced SOD and its inactive form | A3 | 2 |
 |
5.0 10−1 | s−1 | First-order rate constant for conversion between inactive and active oxidized SOD | A3 | 2 |
 |
0.4 × 10⁻³–2.5 × 10⁻³ | mM | Intracellular concentration of SOD | A3 | 2 |
 |
0.5 | mM | Inhibition constant for H2O2 | A3 | |
 |
1.7 104 | mM−1 s−1 | Rate constant of catalase (CAT) | A4 | 3 |
 |
0.001 | mM | Intracellular concentration of CAT | A4 | 3 |
| fr | 50 | Hydrogen peroxide inhibition factor of CAT | A4 | ||
 |
0.00141 | mM | Intracellular concentration of glutathione peroxidase (GPX) | A4 | 4 |
| Φ1 | 0.15–5.0 | mM s | Constant for GPX activity | A5 | 4 |
| Φ2 | 0.5 | mM s | Constant for GPX activity | A5 | 4 |
 |
1.94 | mM | Michaelis constant for oxidized glutathione of glutathione reductase (GR) | A5 | 5 |
 |
38.7 | mM | Michaelis constant for NADPH of GR | A6 | 5 |
 |
0.0308 | s−1 | Rate constant of GR | A6 | 5 |
 |
1.27 10−3 | mM | Intracellular concentration of GR | A6 | 5 |
| GT | 1–2 | mM | Total intracellular pool of glutathione | A7 | 6 |
| shunt | 0.05 | Fraction of respiration diverted to ROS production | A8 | 37 | |
| j | 0.12 | Fraction of IMAC conductance | A13 |
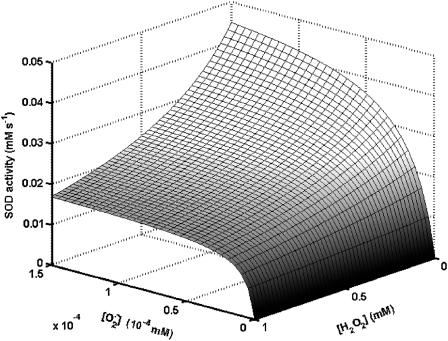
The study of the SOD activity as a function of the concentration of  and H2O2 shows the profile displayed in Fig. A4.
FIGURE A4.
Kinetics of superoxide dismutase (SOD). The activity of SOD in mM s−1 (ruled by Eq. A3) is plotted as a function of the concentration of  and H2O2 (both in mM units). The parameters used in the plot are those indicated in Table A1 and
  is 1.0 μM.
Catalase
The activity of cytosolic catalase (CAT) was modeled as previously described (Chance et al., 1979). We have added an exponential term that depends on the concentration of H2O2, to account for the inhibition of CAT by a large excess of its substrate (Aebi, 1984). The resulting rate expression reads
 |
(A4) |
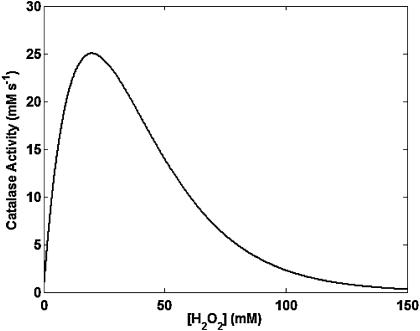
The dependence of CAT activity as a function of H2O2 displays the characteristic profile of an enzyme subject to substrate inhibition (Fig. A5).
FIGURE A5.
Kinetics of catalase activity. Catalase activity (ruled by Eq. A4) is plotted as a function of millimolar concentrations of H2O2. All the parameters in Eq. A5 are as indicated in Table A1.
Glutathione peroxidase (GPX) and glutathione reductase (GR)
These were modeled as indicated below, according to previous reports (Carlberg and Mannervik, 1985; Wendel, 1981).
 |
(A5) |
 |
(A6) |
We have assumed that the total pool of glutathione, GT, is conserved, as indicated by the equation
 |
(A7) |
The ordinary differential equations that were added to the model of cardiac mitochondrial energy metabolism (Cortassa et al., 2003) are
 |
(A8) |
 |
(A9) |
 |
(A10) |
 |
(A11) |
with the rate of transport of  across the inner mitochondrial membrane,
  proportional to the IMAC conductance (see also legend of Fig. 2),
 |
(A12) |
and driven by the Nernst potential for  as indicated in the expression
 |
(A13) |
The dependence of the ∼100-pS mitochondrial channel conductance on ΔΨm (Eq. A12) that takes into account background current at large negative potentials was derived from Borecky et al. (1997). The factor accounting for the activation of the IMAC current on the concentration of extramitochondrial  is an assumption based on an interpretation of several pieces of experimental evidence (see main text). We adjusted factors a and b in Eq. A12 that correspond to the
  -independent term and the activation term by
  respectively.
References
- Aebi, H. 1984. Catalase in vitro. Methods Enzymol. 105:121–126. [DOI] [PubMed] [Google Scholar]
- Aon, M. A., and S. Cortassa. 1997. Dynamic Biological Organization. Fundamentals as Applied to Cellular Systems. Chapman & Hall, London, UK.
- Aon, M. A., S. Cortassa, E. Marban, and B. O'Rourke. 2003. Synchronized whole-cell oscillations in mitochondrial metabolism triggered by a local release of reactive oxygen species in cardiac myocytes. J. Biol. Chem. 278:44735–44744. [DOI] [PubMed] [Google Scholar]
- Aon, M. A., S. Cortassa, and B. O'Rourke. 2004. Percolation and criticality in a mitochondrial network. Proc. Natl. Acad. Sci. USA. 101:4447–4452. [DOI] [PMC free article] [PubMed] [Google Scholar]
- Bak, P., C. Tang, and K. Wiesenfeld. 1987. Self-organized criticality: an explanation of the 1/f noise. Phys. Rev. Lett. 59:381–384. [DOI] [PubMed] [Google Scholar]
- Beavis, A. D. 1992. Properties of the inner membrane anion channel in intact mitochondria. J. Bioenerg. Biomembr. 24:77–90. [DOI] [PubMed] [Google Scholar]
- Berridge, M. J., and A. Galione. 1988. Cytosolic calcium oscillators. FASEB J. 2:3074–3082. [DOI] [PubMed] [Google Scholar]
- Borecky, J., P. Jezek, and D. Siemen. 1997. 108-pS channel in brown fat mitochondria might be identical to the inner membrane anion channel. J. Biol. Chem. 272:19282–19289. [PubMed] [Google Scholar]
- Bray, R. C., S. A. Cockle, E. M. Fielden, P. B. Roberts, G. Rotilio, and L. Calabrese. 1974. Reduction and inactivation of superoxide dismutase by hydrogen peroxide. Biochem. J. 139:43–48. [DOI] [PMC free article] [PubMed] [Google Scholar]
- Brown, H. F., J. Kimura, D. Noble, S. J. Noble, and A. Taupignon. 1984. The ionic currents underlying pacemaker activity in rabbit sino-atrial node: experimental results and computer simulations. Proc. R. Soc. Lond. B Biol. Sci. 222:329–347. [DOI] [PubMed] [Google Scholar]
- Carlberg, I., and B. Mannervik. 1985. Glutathione reductase. Methods Enzymol. 113:484–490. [DOI] [PubMed] [Google Scholar]
- Chance, B., H. Sies, and A. Boveris. 1979. Hydroperoxide metabolism in mammalian organs. Physiol. Rev. 59:527–605. [DOI] [PubMed] [Google Scholar]
- Chance, B., J. R. Williamson, D. Jamieson, and B. Schoener. 1965. Properties and kinetics of reduced pyridine nucleotide fluorescence of the isolated and in vivo rat heart. Biochem. Z. 341:357–377. [Google Scholar]
- Chance, B., and T. Yoshioka. 1966. Sustained oscillations of ionic constituents of mitochondria. Arch. Biochem. Biophys. 117:451–465. [DOI] [PubMed] [Google Scholar]
- Cortassa, S., M. A. Aon, E. Marban, R. L. Winslow, and B. O'Rourke. 2003. An integrated model of cardiac mitochondrial energy metabolism and calcium dynamics. Biophys. J. 84:2734–2755. [DOI] [PMC free article] [PubMed] [Google Scholar]
- Demin, O. V., B. N. Kholodenko, and V. P. Skulachev. 1998. A model of O2·− generation in the Complex III of the electron transport chain. Mol. Cell Biochem. 184:21–33. [PubMed] [Google Scholar]
- Droge, W. 2002. Free radicals in the physiological control of cell function. Physiol. Rev. 82:47–95. [DOI] [PubMed] [Google Scholar]
- Evtodienko, Y. V. 2000. Sustained oscillations of transmembrane Ca2+ fluxes in mitochondria and their possible biological significance. Membr. Cell Biol. 14:1–17. [PubMed] [Google Scholar]
- Gilbert, H. F. 1990. Molecular and cellular aspects of thiol-disulfide exchange. Adv. Enzymol. Relat. Areas Mol. Biol. 63:69–172. [DOI] [PubMed] [Google Scholar]
- Goldbeter, A. 1996. Biochemical Oscillations and Cellular Rhythms. Cambridge University Press, Cambridge, UK.
- Gooch, V. D., and L. Packer. 1974. Oscillatory systems in mitochondria. Biochim. Biophys. Acta. 346:245–260. [DOI] [PubMed] [Google Scholar]
- Haddad, J. J. 2002. Antioxidant and prooxidant mechanisms in the regulation of redox(y)-sensitive transcription factors. Cell. Signal. 14:879–897. [DOI] [PubMed] [Google Scholar]
- Han, D., F. Antunes, R. Canali, D. Rettori, and E. Cadenas. 2003. Voltage-dependent anion channels control the release of the superoxide anion from mitochondria to cytosol. J. Biol. Chem. 278:5557–5563. [DOI] [PubMed] [Google Scholar]
- Hardy, L., J. B. Clark, V. M. Darley-Usmar, D. R. Smith, and D. Stone. 1991. Reoxygenation-dependent decrease in mitochondrial NADH:CoQ reductase (Complex I) activity in the hypoxic/reoxygenated rat heart. Biochem. J. 274:133–137. [DOI] [PMC free article] [PubMed] [Google Scholar]
- Kinnally, K. W., D. B. Zorov, Y. N. Antonenko, S. H. Snyder, M. W. McEnery, and H. Tedeschi. 1993. Mitochondrial benzodiazepine receptor linked to inner membrane ion channels by nanomolar actions of ligands. Proc. Natl. Acad. Sci. USA. 90:1374–1378. [DOI] [PMC free article] [PubMed] [Google Scholar]
- Kosower, N. S., and E. M. Kosower. 1987. Thiol labeling with bromobimanes. Methods Enzymol. 143:76–84. [DOI] [PubMed] [Google Scholar]
- Kushnareva, Y., A. N. Murphy, and A. Andreyev. 2002. Complex I-mediated reactive oxygen species generation: modulation by cytochrome c and NAD(P)+ oxidation-reduction state. Biochem. J. 368:545–553. [DOI] [PMC free article] [PubMed] [Google Scholar]
- Lesnefsky, E. J., B. Tandler, J. Ye, T. J. Slabe, J. Turkaly, and C. L. Hoppel. 1997. Myocardial ischemia decreases oxidative phosphorylation through cytochrome oxidase in subsarcolemmal mitochondria. Am. J. Physiol. 273:H1544–H1554. [DOI] [PubMed] [Google Scholar]
- Liochev, S. I., and I. Fridovich. 2002. Copper, zinc superoxide dismutase and H2O2. Effects of bicarbonate on inactivation and oxidations of NADPH and urate, and on consumption of H2O2. J. Biol. Chem. 277:34674–34678. [DOI] [PubMed] [Google Scholar]
- Lloyd, D. 1998. Circadian and ultradian clock-controlled rhythms in unicellular microorganisms. Adv. Microb. Physiol. 39:291–338. [DOI] [PubMed] [Google Scholar]
- Longo, E. A., K. Tornheim, J. T. Deeney, B. A. Varnum, D. Tillotson, M. Prentki, and B. E. Corkey. 1991. Oscillations in cytosolic free Ca2+, oxygen consumption, and insulin secretion in glucose-stimulated rat pancreatic islets. J. Biol. Chem. 266:9314–9319. [PubMed] [Google Scholar]
- Marczin, N., N. El-Habashi, G. S. Hoare, R. E. Bundy, and M. Yacoub. 2003. Antioxidants in myocardial ischemia-reperfusion injury: therapeutic potential and basic mechanisms. Arch. Biochem. Biophys. 420:222–236. [DOI] [PubMed] [Google Scholar]
- Martin, K. R., and J. C. Barrett. 2002. Reactive oxygen species as double-edged swords in cellular processes: low-dose cell signaling versus high-dose toxicity. Hum. Exp. Toxicol. 21:71–75. [DOI] [PubMed] [Google Scholar]
- McAdam, M. E., R. A. Fox, F. Lavelle, and E. M. Fielden. 1977. A pulse-radiolysis study of the manganese-containing superoxide dismutase from Bacillus stearothermophilus. A kinetic model for the enzyme action. Biochem. J. 165:71–79. [DOI] [PMC free article] [PubMed] [Google Scholar]
- McEnery, M. W., A. M. Snowman, R. R. Trifiletti, and S. H. Snyder. 1992. Isolation of the mitochondrial benzodiazepine receptor. Association with the voltage-dependent anion channel and the adenine-nucleotide carrier. Proc. Natl. Acad. Sci. USA. 89:3170–3174. [DOI] [PMC free article] [PubMed] [Google Scholar]
- Minorsky, N. 1962. Nonlinear Oscillations. Van Nostrand, Princeton, NJ.
- Nicolis, G., and I. Prigogine. 1977. Self-organization in nonequilibrium systems: from dissipative structures to order through fluctuations. Wiley, New York.
- Okado-Matsumoto, A., and I. Fridovich. 2001. Subcellular distribution of superoxide dismutases (SOD) in rat liver: Cu,Zn-SOD in mitochondria. J. Biol. Chem. 276:38388–38393. [DOI] [PubMed] [Google Scholar]
- O'Rourke, B. 2000. Pathophysiological and protective roles of mitochondrial ion channels. J. Physiol. 529:23–36. [DOI] [PMC free article] [PubMed] [Google Scholar]
- O'Rourke, B., B. M. Ramza, and E. Marban. 1994. Oscillations of membrane current and excitability driven by metabolic oscillations in heart cells. Science. 265:962–966. [DOI] [PubMed] [Google Scholar]
- Romashko, D. N., E. Marban, and B. O'Rourke. 1998. Subcellular metabolic transients and mitochondrial redox waves in heart cells. Proc. Natl. Acad. Sci. USA. 95:1618–1623. [DOI] [PMC free article] [PubMed] [Google Scholar]
- Rooney, T. A., E. J. Sass, and A. P. Thomas. 1989. Characterization of cytosolic calcium oscillations induced by phenylephrine and vasopressin in single Fura-2-loaded hepatocytes. J. Biol. Chem. 264:17131–17141. [PubMed] [Google Scholar]
- Sadek, H. A., A. C. Nulton-Persson, P. A. Szweda, and L. I. Szweda. 2003. Cardiac ischemia/reperfusion, aging, and redox-dependent alterations in mitochondrial function. Arch. Biochem. Biophys. 420:201–208. [DOI] [PubMed] [Google Scholar]
- Sorgato, M. C., B. U. Keller, and W. Stuhmer. 1987. Patch-clamping of the inner mitochondrial membrane reveals a voltage-dependent ion channel. Nature. 330:498–500. [DOI] [PubMed] [Google Scholar]
- Sornette, D. 2000. Critical phenomena in natural sciences. In Chaos, Fractals, Self-Organization, and Disorder: Concepts and Tools. Springer, New York, Berlin.
- Starkov, A. A., and G. Fiskum. 2003. Regulation of brain mitochondrial H2O2 production by membrane potential and NAD(P)H redox state. J. Neurochem. 86:1101–1107. [DOI] [PubMed] [Google Scholar]
- St. Pierre, J., J. A. Buckingham, S. J. Roebuck, and M. D. Brand. 2002. Topology of superoxide production from different sites in the mitochondrial electron transport chain. J. Biol. Chem. 277:44784–44790. [DOI] [PubMed] [Google Scholar]
- Sturtz, L. A., K. Diekert, L. T. Jensen, R. Lill, and V. C. Culotta. 2001. A fraction of yeast Cu,Zn-superoxide dismutase and its metallochaperone, CCS, localize to the intermembrane space of mitochondria. A physiological role for SOD1 in guarding against mitochondrial oxidative damage. J. Biol. Chem. 276:38084–38089. [DOI] [PubMed] [Google Scholar]
- Takahashi, M. A., and K. Asada. 1983. Superoxide anion permeability of phospholipid membranes and chloroplast thylakoids. Arch. Biochem. Biophys. 226:558–566. [DOI] [PubMed] [Google Scholar]
- Turrens, J. F. 2003. Mitochondrial formation of reactive oxygen species. J. Physiol. 552:335–344. [DOI] [PMC free article] [PubMed] [Google Scholar]
- Turrens, J. F., A. Alexandre, and A. L. Lehninger. 1985. Ubisemiquinone is the electron donor for superoxide formation by complex III of heart mitochondria. Arch. Biochem. Biophys. 237:408–414. [DOI] [PubMed] [Google Scholar]
- Turrens, J. F., and A. Boveris. 1980. Generation of superoxide anion by the NADH dehydrogenase of bovine heart mitochondria. Biochem. J. 191:421–427. [DOI] [PMC free article] [PubMed] [Google Scholar]
- Vuorinen, K., K. Ylitalo, K. Peuhkurinen, P. Raatikainen, A. Ala-Rami, and I. E. Hassinen. 1995. Mechanisms of ischemic preconditioning in rat myocardium. Roles of adenosine, cellular energy state, and mitochondrial F1F0-ATPase. Circulation. 91:2810–2818. [DOI] [PubMed] [Google Scholar]
- Wendel, A. 1981. Glutathione peroxidase. Methods Enzymol. 77:325–333. [DOI] [PubMed] [Google Scholar]
- Woods, N. M., K. S. Cuthbertson, and P. H. Cobbold. 1986. Repetitive transient rises in cytoplasmic free calcium in hormone-stimulated hepatocytes. Nature. 319:600–602. [DOI] [PubMed] [Google Scholar]
- Zorov, D. B., C. R. Filburn, L. O. Klotz, J. L. Zweier, and S. J. Sollott. 2000. Reactive oxygen species (ROS)-induced ROS release: a new phenomenon accompanying induction of the mitochondrial permeability transition in cardiac myocytes. J. Exp. Med. 192:1001–1014. [DOI] [PMC free article] [PubMed] [Google Scholar]


