

Abstract
Recent algorithmic advances and continual increase in computational power have made it possible to simulate protein folding and dynamics on the level of ensembles. Furthermore, analyzing protein structure by using ensemble representation is intrinsic to certain experimental techniques, such as nuclear magnetic resonance. This creates a problem of how to compare an ensemble of molecules with a given reference structure. Recently, we used distance-based root-mean-square deviation (dRMS) to compare the native structure of a protein with its unfolded-state ensemble. We showed that for small, mostly α-helical proteins, the mean unfolded-state Cα-Cα distance matrix is significantly more nativelike than the Cα-Cα matrices corresponding to the individual members of the unfolded ensemble. Here, we give a mathematical derivation that shows that, for any ensemble of structures, the dRMS deviation between the ensemble-averaged distance matrix and any given reference distance matrix is always less than or equal to the average dRMS deviation of the individual members of the ensemble from the same reference matrix. This holds regardless of the nature of the reference structure or the structural ensemble in question. In other words, averaging of distance matrices can only increase their level of similarity to a given reference matrix, relative to the individual matrices comprising the ensemble. Furthermore, we show that the above inequality holds in the case of Cartesian coordinate-based root-mean-square deviation as well. We discuss this in the context of our proposal that the average structure of the unfolded ensemble of small helical proteins is close to the native structure, and demonstrate that this finding goes beyond the above mathematical fact.
INTRODUCTION
The majority of our knowledge about protein structure and dynamics comes from time- and/or ensemble-averaged experiments (Creighton, 1993). On the other hand, computer simulations give us a microscopic picture on the level of individual atoms and molecules. To meaningfully compare simulation results with the experiment it is essential to simulate protein dynamics on an ensemble level and, furthermore, average the results in a manner that is analogous to what happens experimentally. Recently it has become possible to simulate ensembles of proteins in atomistic detail on relevant timescales (Ferrara and Caflisch, 2000; Fersht and Daggett, 2002; Garcia and Onuchic, 2003; Garcia and Sanbonmatsu, 2001; Mayor et al., 2000; Pande et al., 2002; Shea and Brooks, 2001; Simmerling et al., 2002; Snow et al., 2002a; van Gunsteren et al., 2001; Zagrovic et al., 2001). This advance is due both to a continual increase in computational power, and to improvements in sampling methods. However, dealing with protein ensembles creates a challenge of how to meaningfully compare an ensemble of structures with a given individual molecule or another ensemble. For instance, in folding simulations one obtains several nativelike molecules, and wishes to compare them to the experimental native structure. Or, in the course of NMR structure refinement, one generates an ensemble of plausible structures, and to assess the accuracy and precision of the procedure, wishes to compare them to the average structure or an x-ray structure.
Recently, we have simulated large ensembles of unfolded structures for several small peptides and proteins, and compared them to the respective native structures (Snow et al., 2002b; Zagrovic and Pande, 2003; Zagrovic et al., 2002a). In our analyses, we used a distance-based root-mean-square deviation (dRMS) to carry out the comparison. When using this measure, one represents each structure by its Cα-Cα distance matrix and calculates the root-mean-square deviation between the two matrices. We showed that, in the case of mostly α-helical proteins, the mean unfolded-state distance matrix, averaged over the entire unfolded-state ensemble, is quite similar to the native-state distance matrix. What is more, it is significantly more similar to the native-state distance matrix than most individual unfolded-state matrices. The essence of this finding is shown in Fig. 1, where we plot the distribution of dRMS of the individual members of the simulated unfolded-state ensemble of villin headpiece from the native villin distance matrix. Furthermore, we show the dRMS of the average unfolded-state distance matrix from the native-state distance matrix. Fig. 1 is based on the Cα-dRMS calculations, but a similar conclusion is reached in the case of Cβ-dRMS (Zagrovic et al., 2002a), as well as in the case of all-heavy-atom dRMS (in that case, 〈dRMS〉 = 5.1 ± 0.9 Å, whereas dRMS of the mean unfolded distance matrix is 2.9 Å). Based on such an analysis, we hypothesized that the average structure of the unfolded state of small, mostly α-helical proteins is close to the native structure (“the mean-structure hypothesis”) (Zagrovic et al., 2002a). Finding an average distance matrix over an ensemble of structures is in spirit analogous to what happens in typical distance-based structural experiments such as NMR, FRET, or EPR. In analogy with this, we argued (Zagrovic et al., 2002a) that finding average distance matrices and using dRMS as a metric may be one way to capture the relevant features of ensembles of structures and compare them with other reference structures (Stoycheva et al., 2003).
FIGURE 1.

Distribution of dRMS from the native Cα-Cα distance matrix, dRMS(nat, unf), for all individual unfolded molecules in the villin data set at the 27-ns time point (a total of 5213 structures from as many independent simulations). Similar results are obtained at all other time points sampled in our simulations after the molecules collapse to a compact unfolded state. The arrow marks the dRMS from the native matrix of the mean distance matrix based on the entire unfolded ensemble at 27 ns (dRMS(MM, nat), where MM denotes the mean unfolded matrix and nat denotes the native matrix). The dRMS distribution is binned with 0.1-Å resolution.
The issue of averaging of molecular structures arises in experiments as well. In the context of NMR refinement, it is customary to find the Cartesian coordinates of the average refined structure by linearly averaging the corresponding coordinates of the individual members of the refined ensemble after superposition (Brünger, 1992). This average structure is then typically compared with the individual members of the refined ensemble or some other independent structure, such as an x-ray structure of the same molecule, by calculating Cartesian coordinate-based root-mean-square deviation (RMSD).
In this study we analyze in what way does averaging affect the dRMS or RMSD comparison. We show mathematically that for any ensemble of distance matrices and any choice of a reference matrix, the dRMS between the ensemble-averaged matrix and the reference matrix is always less than or equal to the average dRMS of individual members of the ensemble and the reference matrix:
 |
(1) |
Here  denotes the distance matrices in the ensemble (κ = 1 to N, the total number of structures in the ensemble),
  is the reference distance matrix, and 〈 〉N stands for the ensemble average over all N structures in the ensemble. In other words, in the context of comparing the native state with the unfolded state, the mean unfolded-state distance matrix will always be closer to the native-state distance matrix than the individual unfolded-state distance matrices on average: the position of the arrow in Fig. 1 will always be to the left of (i.e., less than) the mean of the distribution.
Furthermore, we extend the above inequality to the case of Cartesian coordinate-based averaging and the RMSD similarity measure:
 |
(2) |
where Aκ denotes the structures in the ensemble (κ = 1 to N, the total number of structures in the ensemble), B is the reference structure, and 〈 〉N stands for the ensemble average over all N structures in the ensemble. Note that in the case of RMSD calculation all structures need to first be optimally aligned to the same structure.
We conclude by discussing the implications of this result in the context of our findings about the structure of the unfolded state of proteins (Zagrovic et al., 2002a; Snow et al., 2002b; Zagrovic and Pande, 2003). We show that the nativeness of the unfolded-state ensembles in our simulations extends beyond the consequences of the above mathematical fact. Indeed, we show that from a large set of potential reference structures, the native-state structure is the one that is closest in the dRMS sense to the mean unfolded-state distance matrix.
METHODS
Using a heterogeneous computer cluster we have generated thousands of tens of nanoseconds long, independent trajectories for the villin headpiece molecule (McKnight et al., 1997; Zagrovic et al., 2002b). The folding simulations were initiated from fully extended conformations (φ = −135°, ψ = 135°) with N-acetyl and C-amino caps. The equilibrium simulations were started from the experimental NMR structure of the molecules (PDB code 1VII, average structure) (McKnight et al., 1997). The simulations, run using Tinker biomolecular simulation package, involved Langevin dynamics in implicit GB/SA solvent (Qiu et al., 1997) (velocity damping parameter of γ = 91 ps−1, to match that of water) with a 2-fs integration step, at 300 K. Bond lengths were constrained using RATTLE (Andersen, 1983). No cutoffs were used for electrostatics. The protein was modeled using the OPLSua force field (Jorgensen and Tirado-Rives, 1988). Using the same approach, we have also simulated the equilibrium behavior of the experimental villin headpiece structure. The molecule was stable with respect to both secondary and tertiary structure (Zagrovic et al., 2002a,b). Therefore, in our comparison with the unfolded-state ensemble (see Fig. 1), we have used the ensemble-averaged distance matrix from the ensemble of structures at 20 ns in our native state, equilibrium simulations, as our representation of the native structure. The structures were output for analysis every 1 ns of simulated time. The simulations were carried out on ∼10,000 processors as a part of our ongoing Folding@Home distributed computing project, and involved a total of about a quarter of a trillion (2.5 × 10¹¹) integration steps. This corresponds to ∼1000 single CPU years (500 MHz).
To compare structures (i.e., distance matrices) we have used dRMS, distance root-mean-square deviation, defined as:
 |
(M1) |
where  refers to the Euclidean distance between atoms i and j in structure A (i.e.,
  is the element of the distance matrix
  indexed by i and j), and the same for B. n is the total number of atoms included within each structure. We also use RMSD, Cartesian coordinate-based root-mean-square deviation, defined as:
 |
(M2) |
where  are the Cartesian coordinates of the i-th atom in structure A, and the same for structure B, after the two structures have been optimally superimposed. ‖ ‖ refers to the Euclidean norm
  Again, n is the total number of atoms included within each structure.
Comparison of the unfolded villin ensemble with other reference structures
To test to what extent is the similarity of the average unfolded state and the native state in our simulations just a consequence of the averaging procedure, we have compared the same unfolded ensemble with all other nonredundant structures in the PDB database of proteins with the same length (36 residues), for a total of 26 structures. The results of the comparison are given in Fig. 3 A. There the structures are indexed by the increasing dRMS from the average unfolded villin distance matrix, according to the following order (the standard PDB code is given; Berman et al., 2000): 1), 1VII (the native villin structure, all α); 2), 1JN7 (α/β); 3), 1IYC (α/β); 4), 1QJK (α); 5), 1CHL (α/β); 6), 1KOZ (β); 7), 1J5J (α/β); 8), 1AZ6 (β); 9), 1LGL (α/β); 10), 1E4S (α/β); 11), 1KJ5 (α/β); 12), 1PPT (α/β); 13), 1Q3J (β); 14), 1QBF (α); 15), 1MM0 (α/β); 16), 1CBH (β); 17), 1FU9 (α); 18), 1PMC (β); 19), 1BBA (α); 20), 1K81 (β); 21), 1NIY (β); 22), 1RYG (β); 23), 1SIS (α/β); 24), 1RKL (α); 25), 1PI7(α); 26), 1BY6 (α); 27), 1ZWB (α). The predominant secondary structural category of a given molecule is given in the parenthesis (α, α-helix; β, β-sheet; α/β, mixed α-helix and β-sheet). In all cases, for the purposes of structural comparison we have used the first structure in the NMR ensemble or the average structure, where available.
FIGURE 3.

(A) Comparison between the unfolded villin ensemble and 27 other unrelated reference structures from different structural classes, including the native villin structure (1VII). For each reference structure, we show its dRMS from the mean unfolded villin Cα-Cα distance matrix (red), as well as the ensemble average with standard deviation of the dRMS between the same structure and the individual members of the unfolded villin ensemble (black). The reference structures are indexed as given in the Methods section. (B) Relative improvement in structural similarity due to averaging is given for the reference structures in Fig. 3 A. It is defined as:  , where unf denotes the individual members of the unfolded ensemble, ref denotes the reference distance matrix, and MM denotes the mean unfolded-state distance matrix. The structures are indexed as given in the Methods section.
RESULTS
Averaging and the distance-based root-mean-square deviation
In this section we prove inequality (Eq. 1) for all distance matrices  and any
  In fact, this inequality is valid for all possible n × n matrices with real or complex entries, and not just distance matrices.
Given an ensemble of distance matrices  (κ = 1 to N, the total number of structures in the ensemble), and a reference matrix
  , we want to compare the two using dRMS as a metric. If we calculate the dRMS between each member of the ensemble
  and the reference matrix
  , this will result in a distribution of dRMS values. The mean of this distribution is denoted as
  However, we can first linearly average all of the matrices
  , and obtain one mean distance matrix, denoted as
  Its dRMS from the reference matrix will then be
  The inequality (Eq. 1) claims that the latter is strictly less than or equal to the former, regardless of the choice of matrices
  or
or 
The native-state distance matrix, or any reference matrix  for that matter, can be represented in columnar form as a vector
  Similarly, each unfolded-state distance matrix, or each member of a given ensemble
  for that matter, can be converted into vector
  , where index κ goes from 1 to N, the total number of individual molecules comprising the ensemble. One way of mapping a given matrix into a vector is to concatenate all columns of the matrix sequentially into one long vector (i.e.,
  where n is the number of rows in the matrix). The exact way of performing the mapping is not at all critical, as long as all matrices are converted in the same manner. Using this notation and the definition of dRMS (Eq. M1), we can represent the inequality (Eq. 1) as:
 |
(3) |
where n × n is the size of the original matrices (i.e., in case of Cα-Cα distance matrices, n is the length of the peptide).
The normalization factor  is the same on both sides of inequality (Eq. 3), so it can be canceled. Therefore, proving inequality (Eq. 1) is equivalent to proving the following inequality:
 |
(4) |
Now, to simplify the notation, we can use the following substitution:
 |
(5) |
where elements of the vector  are
are  , where M in the case of Cα-Cα distance matrices is equal to n2.
From Eq. 5 it follows:
 |
(6) |
Using Eqs. 5 and 6, and the definition of the Euclidean norm, we can rewrite inequality (Eq. 4) as:
 |
(7) |
We proceed by squaring both sides and canceling  :
:
 |
(8) |
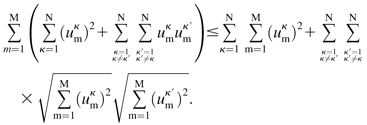
Upon expansion, cancellation, and rearrangement of the sums we get:
 |
(9) |
From the well-known Cauchy-Swartz inequality, which can easily be proven by squaring both sides and grouping the terms, it follows:
 |
(10) |
By summing both sides over all κ and κ′ indices, we obtain inequality (Eq. 9), which completes the proof.
Averaging and the Cartesian coordinate-based root-mean-square deviation
Note that the above derivation using the vector representation applies to all possible real or complex-valued matrices. Furthermore, note that in calculating Cartesian coordinate-based RMSD, after the alignment of structures, the calculation is conceptually equivalent to calculating dRMS. Therefore, the above derivation can be used as a proof of inequality (Eq. 2), after a minor change in notation. It is important to emphasize that inequality (Eq. 2) is valid only in the case where all of the structures in question have been aligned to the same structure. In other words, both sides of the inequality should be evaluated on the same set of structures. To demonstrate this fact, we have compared the ensemble of structures from the native equilibrium simulations of villin (see Methods) with the experimental villin structure in the two ways. Comparing one structure at a time gives a distribution of Cα-RMSD values with mean of 3.6 ± 1.5 Å. On the other hand, if one first finds the average Cα coordinates over the entire ensemble and then calculates their RMSD from the native structure, the value one gets is 2.6 Å, in agreement with the above inequality. The reason we have chosen the native ensemble of structures for this comparison is that structural alignment, which is required when calculating RMSD, gives physically more meaningful results in the case of geometrically similar structures. Nevertheless, the above inequality holds for any ensemble of structures and any reference structure whatsoever.
DISCUSSION
How does the above inequality affect our conclusions about the unfolded state of small α-helical proteins? We have shown that the mean unfolded-state Cα-Cα distance matrices of several small mostly α-helical peptides are close to the respective native-state distance matrices (Zagrovic et al., 2002a; Snow et al., 2002b; Zagrovic and Pande, 2003). Is it possible that this finding is just a consequence of the above mathematical property of matrix averaging? Inequality (1) suggests that no matter what the reference structure is, averaging of the unfolded-state matrices gives one improvement over the individual unfolded-state members on average. Is this mathematical fact perhaps sufficient to make the mean unfolded-state distance matrix close to any given reference matrix?
A decisive test of this possibility is to use other reference structures instead of the real native structure, and ask how close are these structures to the mean unfolded-state distance matrix. Indeed, if the low dRMS from the native structure is just a consequence of averaging with no physical meaning, one should obtain such low dRMS even for nonnative reference structures. We have carried out this test in two ways. First, we have used the members of the unfolded-state ensemble as reference structures instead of the native structure. In other words, we have used the individual members of the unfolded-state ensemble as “mock” native structures, and calculated their dRMS from the mean unfolded-state distance matrix. The result is shown in Fig. 2: on average these molecules are 3.9 ± 1.0 Å dRMS away from the mean unfolded-state matrix. More importantly, the native-state distance matrix is the closest individual distance matrix to the mean unfolded-state matrix at 2.4 Å dRMS. In other words, for villin we could use dRMS to pick out the native-state structure from a pool of decoys comprised of the unfolded-state members.
FIGURE 2.

Distribution of dRMS from the mean unfolded Cα-Cα distance matrix at the 27-ns time point in the villin data set for all individual unfolded molecules at that time point, dRMS(MM, unf). Similar results are obtained at all other time points sampled in our simulations after the molecules collapse to a compact unfolded state. The arrow marks the dRMS of the native-state distance matrix from the mean unfolded distance matrix (dRMS(MM, nat), where MM denotes the mean unfolded matrix and nat denotes the native matrix). The dRMS distribution is binned with 0.1 Å resolution.
Second, we have used native structures of other, unrelated proteins as reference structures and performed a similar comparison. For this purpose, we have chosen all nonredundant, 36-residue proteins in the Protein Data Bank database (Berman et al., 2000) (a total of 26 structures from different structural categories) as “mock” native structures and compared them with our simulated villin unfolded-state ensemble. The results are shown in Fig. 3. The mean villin unfolded-state distance matrix is more similar to the native villin structure than to any of the “mock” native structures. Moreover, the spread in dRMS values between the most similar and the least similar structure to the mean villin unfolded-state matrix (i.e., the native villin structure and the 1ZWB structure) is >10 Å, suggesting that the average unfolded-state distance matrix contains significant information that enables it to sensitively discriminate between different structures and select the native villin structure over others. Finally, the analysis given in Fig. 3 A suggests a new feature that was not observed before: among all the reference structures we looked at, the native structure of villin is closest to the unfolded-state ensemble of villin even when it comes to individual structures on average. The average dRMS of the individual unfolded molecules from different reference structures (black dots in Fig. 3 A) is lowest when the reference structure is the native villin structure (4.6 Å). This suggests that some information about the native structure is hidden in each individual member of the unfolded-state ensemble as well. Here, it should also be noted that, as implied by the inequality (Eq. 1), the average unfolded-state distance matrix is in all cases closer to a given reference structure than are the individual unfolded molecules on average. However, the discrepancy between the two values is both absolutely and relatively greatest in the case of the native villin structure (Fig. 3 B).
In analyzing the results given in Fig. 3 one should take into account the intrinsic similarity or dissimilarity of the reference structures used and the native villin structure. Therefore, it is not surprising that some structures are closer to the mean villin unfolded-state distance matrix than others: these are the ones that were more similar to the native villin structure to begin with. Indeed, one can actually use the dRMS from villin's mean unfolded-state distance matrix to estimate how similar a given reference structure is to the native structure of villin (results not shown). Finally, the structures that are most dissimilar to villin give one an opportunity to gauge how much averaging actually lowers the dRMS in the absence of any intrinsic structural similarity, compared to one-to-one values. On the basis of the results in Fig. 3 A, this improvement accounts for 0.5 Å or so for a molecule of this size.
The two examples given in Figs. 2 and 3 suggest that the mathematical properties of matrix averaging are only a component of the result displayed in Fig. 1, and that the topology of the unfolded state of the villin molecule indeed is significantly nativelike. There are several other results speaking in favor of this. First, we have shown that in the case of predominately β-sheet-containing structures, the mean unfolded-state distance matrix is not significantly more nativelike than the individual members of the unfolded-state ensemble (Zagrovic et al., 2002a). In fact, the mean distance matrix based on the unfolded-state ensemble of the β-sheet tryptophan zipper is closer in the dRMS sense to a 12-residue α-helix than to its native β-sheet conformation (1.7 Å vs. 2.6 Å). If the sole contributor to the “mean-structure hypothesis” were the above mathematical fact, one would get equal improvement by averaging for both α-helical- and β-sheet-containing structures. Second, we have demonstrated that “the mean-structure hypothesis” can be used as a structure prediction scheme with significant filtering capability (Zagrovic et al., 2002a). Finally, we have shown that over short stretches the α-helix is the closest structural motif to the average interresidue distances in a random-flight chain with persistence length of one amino acid, which in turn is a good model for our unfolded-state ensemble (Zagrovic and Pande, 2003).
Although it has no bearing on the mathematical derivation in this work, the nature of the villin unfolded-state ensemble analyzed here merits comment. The ensemble was generated by running thousands of short independent trajectories started from the fully extended state for a short time (27 ns) compared to the relevant folding time (4.3 μs) (Kubelka et al., 2003). Based on this we argued that our ensemble corresponds to the kinetically defined unfolded state: we capture what happens early on in the folding process, and as such our ensemble may or may not differ from chemically or thermally denatured states (Zagrovic et al., 2002a). Recently, Paci et al. (2003) argued that relatively short simulations in a distributed computing paradigm such as ours do not capture the relevant aspects of the folding process due to lack of convergence. We fully agree that our simulated ensembles are out of global equilibrium and do not sample the entire folding free-energy surface; because only a small fraction reach the folded state, the native-state basin is clearly not sampled well. However, our characterization of these simulations (see below) shows that they do capture the relevant features of the unfolded-state free-energy well.
The simulated ensembles are out of equilibrium globally, but they can still be in equilibrium locally (i.e., within the unfolded-state well). In the case of the villin unfolded-state ensemble, most geometrical and energetic descriptors of the ensemble reach their steady-state values in ∼10–20 ns, suggesting local equilibration (Zagrovic et al., 2002a,b). Furthermore, the average interresidue distances in the ensemble conform extremely well to the statistics of the ideal random-flight chain with persistence length of one amino acid, again suggesting that the unfolded state is adequately sampled (Zagrovic and Pande, 2003). One dominant characteristic of the unfolded ensembles that we have simulated is their almost nativelike degree of compaction. This may partly be due to the generalized Born/surface area solvation model used in our simulations and its overstabilizing of electrostatics. However, compactness of the unfolded state has been observed both theoretically and experimentally in many proteins, and may be a general feature of the folding process (Duan and Kollman, 1998; Fersht and Daggett, 2002; Millett et al., 2002; Pande et al., 2002). But, the fact that a highly heterogeneous ensemble such as our simulated unfolded state has certain nativelike properties on average is intriguing in any case.
What is the significance of the above results in the broader context of protein simulation and experiment? As more and more theoretical groups reach the capability to simulate ensembles of molecules, the issues of conformational averaging and structure comparison on an ensemble level will become increasingly more relevant. The above result provides a useful reference point for such studies. Secondly, in the context of NMR refinement and especially for the purpose of assessing precision and accuracy of the procedure, it is useful to know that the average refined structure will always be closer to any reference structure compared with the average individual refined structure, even if the ensemble to be averaged contains highly unstructured or poorly constrained regions.
Acknowledgments
We especially thank the thousands of Folding@Home contributors, without whom this work would not be possible. A complete list of contributors can be found at http://folding.stanford.edu.
B.Z. acknowledges support from a Howard Hughes Medical Institute predoctoral fellowship. This work was supported by grants from the National Institutes of Health (R01GM62868), as well as by gifts from Google Inc.
Bojan Zagrovic's present address is Laboratory of Physical Chemistry, ETH Hönggerberg, HCI, CH-8093 Zürich, Switzerland.
Abbreviations used: dRMS, distance-based root-mean-square deviation; NOE, nuclear Overhauser enhancement; FRET, fluorescence resonance energy transfer; EPR, electron paramagnetic resonance; GB/SA, generalized Born/surface area.
References
- Andersen, H. C. 1983. Rattle: a “velocity” version of the Shake algorithm for molecular dynamics calculations. J. Comp. Phys. 52:24–34. [Google Scholar]
- Berman, H. M., J. Westbrook, Z. Feng, G. Gilliland, T. N. Bhat, H. Weissig, I. N. Shindyalov, and P. E. Bourne. 2000. The Protein Data Bank. Nucleic Acids Res. 28:235–242. [DOI] [PMC free article] [PubMed] [Google Scholar]
- Brünger, A. T. 1992. X-PLOR, Version 3.1: A System for X-Ray Crystallography and NMR. Yale University Press, New Haven, CT.
- Creighton, T. E. 1993. Proteins: Structure and Molecular Properties. W. H. Freeman, New York, NY.
- Duan, Y., and P. A. Kollman. 1998. Pathways to a protein folding intermediate observed in a 1-microsecond simulation in aqueous solution. Science. 282:740–744. [DOI] [PubMed] [Google Scholar]
- Ferrara, P., and A. Caflisch. 2000. Folding simulations of a three-stranded antiparallel β-sheet peptide. Proc. Natl. Acad. Sci. USA. 97:10780–10785. [DOI] [PMC free article] [PubMed] [Google Scholar]
- Fersht, A. R., and V. Daggett. 2002. Protein folding and unfolding at atomic resolution. Cell. 108:573–582. [DOI] [PubMed] [Google Scholar]
- Garcia, A. E., and J. N. Onuchic. 2003. Folding a protein in a computer: an atomic description of the folding/unfolding of protein A. Proc. Natl. Acad. Sci. USA. 100:13898–13903. [DOI] [PMC free article] [PubMed] [Google Scholar]
- Garcia, A. E., and K. Y. Sanbonmatsu. 2001. Exploring the energy landscape of a beta hairpin in explicit solvent. Proteins. 42:345–354. [DOI] [PubMed] [Google Scholar]
- Jorgensen, W. L., and J. Tirado-Rives. 1988. The OPLS potential functions for proteins: energy minimizations for crystals of cyclic peptides and crambin. J. Am. Chem. Soc. 110:1666–1671. [DOI] [PubMed] [Google Scholar]
- Kubelka, J., W. A. Eaton, and J. Hofrichter. 2003. Experimental tests of villin subdomain folding simulations. J. Mol. Biol. 329:625–630. [DOI] [PubMed] [Google Scholar]
- Mayor, U., C. M. Johnson, V. Daggett, and A. R. Fersht. 2000. Protein folding and unfolding in microseconds to nanoseconds by experiment and simulation. Proc. Natl. Acad. Sci. USA. 97:13518–13522. [DOI] [PMC free article] [PubMed] [Google Scholar]
- McKnight, C. J., P. T. Matsudaira, and P. S. Kim. 1997. NMR structure of the 35-residue villin headpiece subdomain. Nat. Struct. Biol. 4:180–184. [DOI] [PubMed] [Google Scholar]
- Millett, I. S., S. Doniach, and K. W. Plaxco. 2002. Toward a taxonomy of the denatured state: small angle scattering studies of unfolded proteins. Adv. Protein Chem. 62:241–262. [DOI] [PubMed] [Google Scholar]
- Paci, E., A. Cavalli, M. Vendruscolo, and A. Caflisch. 2003. Analysis of the distributed computing approach applied to the folding of a small beta peptide. Proc. Natl. Acad. Sci. USA. 100:8217–8222. [DOI] [PMC free article] [PubMed] [Google Scholar]
- Pande, V. S., I. Baker, J. Chapman, S. Elmer, S. Khaliq, S. Larson, Y. M. Rhee, M. R. Shirts, C. Snow, E. J. Sorin, and B. Zagrovic. 2002. Atomistic protein folding simulations on the hundreds of microsecond timescale using worldwide distributed computing. Biopolymers. 68:91–109. [DOI] [PubMed] [Google Scholar]
- Qiu, D., P. S. Shenkin, F. P. Hollinger, and W. C. Still. 1997. The GB/SA continuum model for solvation. A fast analytical method for the calculation of approximate Born radii. J. Phys. Chem. 101:3005–3014. [Google Scholar]
- Shea, J. E., and C. L. Brooks, III. 2001. From folding theories to folding proteins: a review and assessment of simulation studies of protein folding and unfolding. Annu. Rev. Phys. Chem. 52:499–535. [DOI] [PubMed] [Google Scholar]
- Simmerling, C., B. Strockbine, and A. E. Roitberg. 2002. All-atom structure prediction and folding simulations of a stable protein. J. Am. Chem. Soc. 124:11258–11259. [DOI] [PubMed] [Google Scholar]
- Snow, C. D., H. Nguyen, V. S. Pande, and M. Gruebele. 2002a. Absolute comparison of simulated and experimental protein-folding dynamics. Nature. 420:102–106. [DOI] [PubMed] [Google Scholar]
- Snow, C. D., B. Zagrovic, and V. S. Pande. 2002b. The Trp cage: folding kinetics and unfolded state topology via molecular dynamics simulations. J. Am. Chem. Soc. 124:14548–14549. [DOI] [PubMed] [Google Scholar]
- Stoycheva, A. D., J. N. Onuchic, and C. L. Brooks, III. 2003. Effect of gatekeepers on the early folding kinetics of a model beta-barrel protein. J. Chem. Phys. 119:5722–5729. [Google Scholar]
- van Gunsteren, W. F., R. Burgi, C. Peter, and X. Daura. 2001. The key to solving the protein-folding problem lies in an accurate description of the denatured state. Angew. Chem. Int. Ed. Engl. 40:352–355. [DOI] [PubMed] [Google Scholar]
- Zagrovic, B., and V. S. Pande. 2003. Structural correspondence between the alpha-helix and the random-flight chain resolves how unfolded proteins can have native-like features. Nat. Struct. Biol. 10:955–961. [DOI] [PubMed] [Google Scholar]
- Zagrovic, B., C. Snow, S. Khaliq, M. Shirts, and V. Pande. 2002a. Native-like mean structure in the unfolded ensemble of small proteins. J. Mol. Biol. 323:153–164. [DOI] [PubMed] [Google Scholar]
- Zagrovic, B., C. D. Snow, M. R. Shirts, and V. S. Pande. 2002b. Simulation of folding of a small alpha-helical protein in atomistic detail using worldwide-distributed computing. J. Mol. Biol. 323:927–937. [DOI] [PubMed] [Google Scholar]
- Zagrovic, B., E. J. Sorin, and V. Pande. 2001. Beta-hairpin folding simulations in atomistic detail using an implicit solvent model. J. Mol. Biol. 313:151–169. [DOI] [PubMed] [Google Scholar]