

Abstract
Identification of the molecular interaction governing ion conduction through biological pores is one of the most important goals of modern electrophysiology. Grand canonical Monte Carlo Brownian dynamics (GCMC/BD) and three-dimensional Poisson-Nernst-Plank (3d-PNP) electrodiffusion algorithms offer powerful and general approaches to study of ion permeation through wide molecular pores. A detailed analysis of ion flows through the staphylococcal α-hemolysin channel based on series of simulations at different concentrations and transmembrane potentials is presented. The position-dependent diffusion coefficient is approximated on the basis of a hydrodynamic model. The channel conductance calculated by GCMC/BD is ∼10% higher than (electrophysiologically measured) experimental values, whereas results from 3d-PNP are always 30–50% larger. Both methods are able to capture all important electrostatic interactions in equilibrium conditions. The asymmetric conductance upon the polarity of the transmembrane potential observed experimentally is reproduced by GCMC/BD and 3d-PNP. The separation of geometrical and energetic influence of the channel on ion conduction reveals that such asymmetries arise from the permanent charge distribution inside the pore. The major determinant of the asymmetry is unbalanced charge in the triad of polar residues D127, D128, and K131. The GCMC/BD or 3d-PNP calculations reproduce also experimental reversal potentials and permeability rations in asymmetric ionic solutions. The weak anionic selectivity of the channel results from the presence of the salt bridge between E111 and K147 in the constriction zone. The calculations also reproduce the experimentally derived dependence of the reversible potential to the direction of the salt gradient. The origin of such effect arises from the asymmetrical distribution of energetic barriers along the channel axis, which modulates the preferential ion passage in different directions.
INTRODUCTION
Staphylococcal α-hemolysin (α-HL) is a toxin protein involved in a number of human diseases. Available experimental studies show that this toxin is a major determinant of a bacterial pathogenicity for Staphylococcus aureus (Bhakdi and Tranum-Jensen, 1991; Alouf and Freer, 1999), which causes different urinary tract infections (Gentschev et al., 2002) and pyelonephritis (Laestadius et al., 2002). It is also known that the toxin is an important virulence factor due to its cytolytic and cytotoxic activity against a wide range of mammalian cell types such as erythrocytes, granulocytes, monocytes, and endothelial cells (Menestrina et al., 2001). The cytotoxic properties of α-HL are mediated by the formation of a wide heptameric channel of 234 kDa. The α-HL monomers insert into the membrane of susceptible cell such as blood monocytes, human platelets, or endothelial cells, and then oligomerize to form a heptameric transmembrane pore, inducing the release of interleukin-1 in vivo (Song et al., 1996; May et al., 1996). The primary mechanism of cell damage and death is a leakage of ions, water, and low molecular weight molecules in and out the cell (Alouf and Freer, 1999; Menestrina et al., 2001).
The high resolution x-ray structure (1.9 Å) shows that one α-HL subunit is composed of 16 β-strands, four turns of α- or 310-helix, and substantial non α- or non β-elements of the polypeptide structure for protomer (Song et al., 1996). The mushroom-shaped heptamer of α-HL is ∼100 Å in diameter and height (see Fig. 1). The size of the aqueous pore ranges from 15 to 46 Å (Gouaux, 1998; Song et al., 1996). The channel displays a weak anion selectivity, with rapid fluctuations to a higher conduction state at acidic pH (Kasianowicz and Bezrukov, 1995). Slow, reversible, voltage-dependent channel closure can be induced by the presence of di- and trivalent cations (Kasianowicz et al., 1999). Site-directed mutations in the channel interior such as K147N or M113P make the channel moderately cation selective (Gu et al., 2001a,b). The features of this wide aqueous pore make it possible to use α-HL for construction of biosensors, i.e., detecting elements that could become part of a stable device. To modulate the selectivity of the pore, suitable molecules (adaptors) have been used to create a narrow constriction with specific selectivity (Bayley and Martin, 2000; Gu et al., 2001a, 1999).
FIGURE 1.
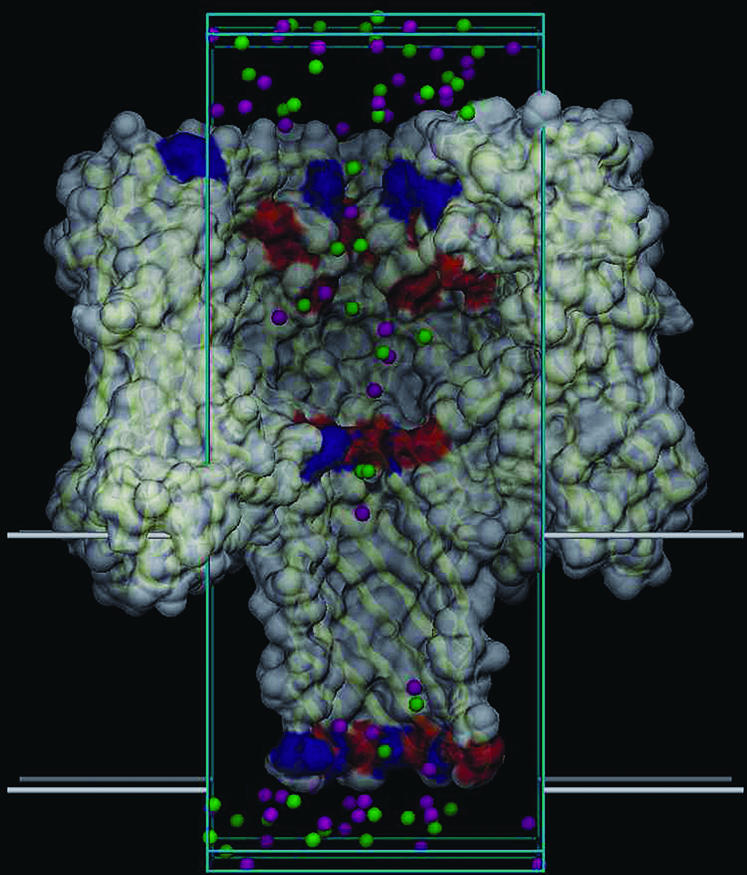
Molecular graphics view of the GCMC/BD simulation of the α-hemolysin pore bathed in 1.0 M KCl solution. Saggital section of the channel along the Z axis. The orthorhombic simulation box and the 3.0 Å regions corresponding to the buffer areas are drawn as cyan lines. The membrane is delimited by thick white lines. K+ (magenta) and Cl− (green) ions are located in the pore and in the buffer regions.
The availability of a high resolution crystal structure (Song et al., 1996) and wealth of electrophysiological experimental data (Alouf and Freer, 1999) make α-HL an ideal system to investigate the microscopic interactions governing ion flow and selectivity in wide aqueous molecular pores. A deeper understanding of the molecular determinants for ion permeation can be achieved by combining the available experimental information on the transport and structural properties of this toxin with detailed theoretical studies (for a recent review, see Roux et al., 2004). The size of the α-HL channel (more than 30,000 atoms including hydrogens for protein itself) renders studies of the permeation process using all-atom molecular dynamics (MD) simulations extremely challenging. Shilov and Kurnikova (2003) have recently carried out MD simulations of the cyclic oligosaccharide β-cyclodextrin dynamics in the confined environment of the α-HL channel, freezing the channel atoms to restrict the size of the system. A trajectory of 8 ns was generated to address important questions about the fast dynamical motions of the ligand bound to the channel. Nonetheless the simulation of ion permeation requires much longer trajectories, on the microsecond timescale.
Brownian dynamics (BD) simulation, in which the solvent is represented implicitly, provides an attractive theoretical approach for the modeling of permeation process in wide and medium sized pores over long timescales (Chung et al., 1998; Roux et al., 2004). In this approach, the channel and ions are represented explicitly at the atomic level, but the influence of the surrounding solvent is incorporated implicitly via stochastic random forces and a multi-ion potential of mean force (PMF) approximated on the basis of a continuum dielectric solvent. Recently, a grand canonical Monte Carlo Brownian dynamics (GCMC/BD) algorithm was developed and implemented for simulations of ion channels under various conditions of transmembrane potential and ion concentration (Im et al., 2000; Im and Roux, 2001, 2002a,b). In the case of BD as well as for MD simulation, the properties of the system are extracted from time averages taken over atomistic trajectories. Alternative to simulations is the use of Poisson-Nernst-Plank electrodiffusion theory in three dimension (3d-PNP) based on a mean-field continuum electrostatic approximation (Kurnikova et al., 1999). The theory solves self-consistently for the nonequilibrium ion density (from Fick's law) and the electrostatic potential (from Poisson's equation). Using OmpF porin as a benchmark system, the results from a variety of computational approaches were extensively compared (Im and Roux, 2002b). It was found that equilibrium spatial ion distribution calculated from all-atom MD, GCMC/BD, Poisson-Boltzman (PB), and that nonequilibrium ion fluxes calculated from GCMC/BD and 3d-PNP, were in good agreement (though the analysis showed that PNP theory systematically overestimates the ion fluxes relative to BD). This confirms that GCMC/BD, PB, and 3d-PNP are valuable tools for computational studies of wide aqueous biological channels (Roux et al., 2004).
The purpose of this article is to elucidate the microscopic factors governing ion flow through the α-HL channel. One additional motivation of this work is to further compare BD and 3d-PNP in the case of a very large bacterial pore such as α-HL to establish their range of applicability. The outline of the article is as follows. In the next section (Methodology), we will describe the details of simulations and provide the theoretical background. This section is followed by detailed discussions of ion flow through the α-HL at symmetric and asymmetric ionic (KCl) solutions (Results and Discussion). In the last section of the article (Conclusion), we will summarize the main results of the work.
METHODOLOGY
Atomic model and GCMC/BD simulation
The theoretical foundation for the treatment presented here can be found in Roux et al. (2004). The three-dimensional structure for α-HL was taken from Protein Data Bank (Berman et al., 2000) (Protein Data Bank entry: 7ahl). The protonation was chosen on the basis of pKa calculations (Bashford and Karplus, 1990; Bashford and Gerwert, 1992). All aspartic acid and glutamic acid residues as well as C-terminal groups were deprotonated; arginine, lysine, and N-terminal groups were protonated. Histidine 35 and 259 are protonated on NE2, histidine 144 is protonated on ND1, and histidine 48 is protonated at both NE2 and ND2. The atomic charges were taken from the CHARMM PARAM22 force field (MacKerell et al., 1998). The resulting net charge for α-HL was +14 e. The protein was treated as a rigid structure with a dielectric constant of 2 surrounded by a high dielectric solvent (εw = 80) and embedded in a 28.2 Å thick membrane (εm = 2). The choice of dielectric constant for the aqueous region was motivated by the large size of the pore, which can be safely assumed to be well-represented by a bulk continuum value (Partenskii and Jordan, 1992a). The value for εp = 2 is a canonical value in many theoretical studies, though typical values often ranged from 2 to 5 depending on the situation (Simonson and Brooks, 1996; Pitera et al., 2001; Schutz and Warshel, 2001). Recently, it was shown that an increase in εp value can cause a small effect on ion profile (Bastug and Kuyucak, 2003) in large and medium sized pores. The value of εp is more critical for studies of permeation through narrow pores, where the application of continuum models is questionable anyway (Corry et al., 2003; Nadler et al., 2003).
The channel was positioned along the Z axis with the center of the membrane at Z = 0. An atomic system was constructed to perform GCMC/BD simulations using an orthorhombic simulation region (60.5 × 60.5 × 128.5 Å3). This system is depicted in Fig. 1. The salt concentrations of interest were maintained by two 3 Å buffers positioned from −26.75 to −23.75 Å and from 99.75 to 102.75 Å along the Z axis. The stochastic trajectory of the ions with nonuniform diffusion constant profile was generated using the algorithm of Ermak and McCammom (1978),
 |
(1) |
where  is the velocity and ri is the position of ith ion, Di(ri) is the diffusion coefficient at a given ion position,
  is a multi-ion PMF, and ζi(t) is a Gaussian random noise with 〈ζi(t)·ζj(0)〉 = 6Di(ri)δij(t). Based on continuum electrostatics, the multi-ion PMF (𝒲) becomes (Im et al., 2000; Im and Roux, 2001)
 |
(2) |
where the Cartesian coordinates of the ith ion are represented by ri, uij is the direct ion-ion interaction, Ucore is a repulsive potential preventing core-core overlap of the ions with the channel and membrane,  is the shielded static field coming from the permanent protein charge distribution and the transmembrane potential, and
  is the reaction field arising from the electrostatic polarization of the various dielectric boundaries and the implicit salt in the outer region (Im and Roux, 2002a).
The static-field electrostatic potential  was computed first on a coarse grid (2053 points with a grid spacing of 1.5 Å) centered on the origin of the membrane region followed by a second calculation on a finer grid (205 × 205 × 261 points with a grid spacing of 0.5 Å). The transmembrane potential contribution was calculated with a modified version of PB equation (Roux, 1997). This grid completely covers the atomic structure of the α-HL channel.
  is calculated using a generalized basis-set expansion with Legendre polynomials of 5, 5, and 9 order in X, Y, and Z directions, respectively. A singular value decomposition with optimal cutoff eigenvalue of 0.003 was used to regularize the basis sets (Im and Roux, 2001). The same grid as for
  was used for the calculation of the reaction field matrix. The GCMC/BD simulation trajectories were generated with a time step of 15 fs using the algorithm described by Im and Roux (2002a). One step of GCMC was performed for each step of BD. The step of GCMC essentially adds no computational cost to the BD itself. To examine the current-voltage relation (I-V curve) 1.0 M (symmetric), KCl solutions were maintained in both buffer regions with a transmembrane potential of Vmp = −150, −100, −40, 40, 100, and 150 mV. For conductance-concentration relation, the single-channel conductance was calculated at Vmp = ±150 mV in 0.1, 0.2, 0.3, 0.5, 1.0, and 2.0 M KCl solutions. The total length of the simulation was 6 μs (0.1 M), 3.6 μs (0.15 M and 0.2 M), 1.8 μs (0.3 M), 0.9 μs (0.5 M), 0.45 μs (1.0 M), and 0.225 μs (2.0 M) for various symmetric solutions of KCl, and 0.9 μs for asymmetric solutions of KCl. To obtain statistical convergence on the ion currents at given condition, 10 independent GCMC/BD simulations were generated with both different initial configurations and different seed number for the random number generator. All computations have been done using the GCMC/BD program package, which is freely available at http://thallium.med.cornell.edu/RouxLab/gcmc.html.
The same protein model and ion diffusion coefficient profile as used in the GCMC/BD simulation were used for all 3d-PNP computations. One cycle of a 3d-PNP iteration consists of solving the Poisson equation for the electrostatic potential, and the steady-state Nernst-Plank equation for concentration of each ion type. (For details and algorithm of 3d-PNP computations, see Kurnikova et al., 1999, and Im and Roux, 2002a.) Both equations were solved completely for each iterative step of 3d-PNP with tolerance of 4 × 10⁻⁶ for the potential and 1 × 10⁻¹⁰ for the concentrations. Different mixing factors were applied to the potential and concentrations due to high sensitivity of the NP equation for a small changes in potential. All computations were done using the PB/PNP program package, which is freely available at http://thallium.med.cornell.edu/RouxLab/pbpnp.html.
Position-dependent diffusion coefficient
One of the inputs for GCMC/BD simulation is the position-dependent (nonuniform) ion diffusion coefficient. It is generally accepted that the mobility of ions in a confined environment and in bulk solution are different (Allen et al., 1999). The diffusion coefficient of ions insid a water-filled pore is expected to be influenced by complex effects, including hydrodynamic and electrostatics. MD simulations of hydrophobic channels done by Allen et al. (1999) and Im and Roux (2002a) showed a dependence of ion motion on the channel size. Hydrodynamic effects on ion diffusion are expected to provide a reasonably accurate approach for studies of the ion flow in large pore complexes (for a review, see Peters, 1986).
According to the Stokes-Einstein theory, the diffusion coefficient of a spherical particle (ion) with a radius of Rion in a bulk liquid with viscosity η is
 |
(3) |
where kB is the Boltzmann constant, T is the temperature, and η is the viscosity of media.
An approximate approach to introduce the dependence of the channel size on the diffusion coefficient of a spherical particle using continuum hydrodynamics were formulated by Paine and Scherr (1975), and was used for calculations of ion transport through cylindrical pores of different size (Paine et al., 1975; Peters, 1986; Keminer and Peters, 1999). The position-dependent diffusion coefficient of the particle inside the cylindrical pore can be written as
 |
(4) |
where the component friction coefficient k1 is a function of Rion, the radius of the cylindrical pore Rpore, and the radial distance of the particle from the central axis of the pore d. Combining Eqs. 3 and 4, we can write the position-dependent diffusion constant with respect to the bulk value as
 |
(5) |
The magnitude of k1 was tabulated as a function of β = Rion/Rpore (Paine and Scherr, 1975). To simply incorporate k1(β) into the BD algorithm we use an analytical expression such as
 |
(6) |
The best fit to the tabulated values was obtained with A = 0.64309, B = 0.00044, C = 0.06894, D = 0.35647, and E = 0.19409.
The channel radius, Rpore, used in Eq. 5 was extracted from the representation of the channel as a series of ideal cylinders with a different radius. To obtain the cross-sectional area of such cylinders, we used an algorithm similar to that proposed by Smart et al. (1993). The position of an uncharged sphere with minimal van der Waals radius of 0.5 Å was initially optimized at the point of interest inside the channel with a strong harmonic restraint to hold the sphere along the main channel axis. Energy minimization was performed while the van der Waals radius of the sphere was gradually increased by 0.01 Å until the interaction energy between the channel and the sphere reached the value of kBT. Assuming the spherical symmetry of the pore, the radius of the sphere is then taken as the pore radius. To examine the validity of the diffusion coefficient calculated by the simple hydrodynamic model, the position-dependent diffusion constant of ion through OmpF biological channel calculated by Eq. 5 was first compared with that extracted from the MD simulation (Im and Roux, 2002b). As shown in Fig. 2, the simple hydrodynamic model indicates that there is a slight reduction of the diffusion constant in the pore relative to the bulk value, in reasonable agreement with available results from all-atom MD simulation (Im and Roux, 2002b). The agreement is far from perfect, but it should be noted that the value of the ion diffusion coefficient computed from MD is also burdened by some uncertainty (Im and Roux, 2002b). Using the estimated diffusion constant profile for α-HL does improve the results by 10–15%. Since ion conduction properties are generally dominated by the multi-ion PMF rather than the diffusion coefficient profile (Roux et al., 2004), the simple hydrodynamic approximation allows a rough and inexpensive estimate for BD simulations in the case of wide pores of complex geometries. Fig. 3 a shows the cross-sectional area of α-HL calculated by the aforementioned method and a grid search method. The representation of the channel as a set of cylinders slightly underestimates the cross-sectional area, though the agreement between the two different approaches remains acceptable. Finally, Fig. 3 b shows the fractional (nonuniform) diffusion constant profile for the spherical particle with a mean radius of K+ and Cl− inside the α-HL pore calculated from the hydrodynamic approximation, and smoothed one for the GCMC/BD and PNP computations. For the sake of simplicity, the variation of the diffusion constant in the x,y plane as well as its small dependence on a salt concentration are neglected in the simulation presented here.
FIGURE 2.

Relative diffusion coefficient of Cl− ion along OmpF channel axis from MD simulations (solid line) and hydrodynamic approximation (dotted line). The results for the K+ diffusion coefficient profile are similar and not shown here.
FIGURE 3.

(a) Cross-sectional area of α-HL computed by a grid search (dotted line) and evaluated using a variable probe sphere moving along the channel axis (solid line). (b) Diffusion coefficient relative to a bulk value estimated by a hydrodynamic approximation (dots) and used in the BD and PNP computations (solid line). The center of the membrane is located at Z = 0.0. Å.
RESULTS AND DISCUSSION
In the following section, we present the results of the equilibrium and nonequilibrium ion flows in the α-HL channel, and compare those with available experimental data. The purpose of this comparison is to ascertain the reliability of the GCMC/BD and PNP results and to draw a meaningful picture of ion permeation and selectivity through large and medium sized pores with a high level of details.
Equilibrium ion distribution
Fig. 4 shows the equilibrium distribution of K+ and Cl− along the pore axis obtained from the GCMC/BD simulation and the PB calculation. The agreement between the two approaches is remarkable, indicating that the mean-field approximation used in PB is sufficiently good for the description of the equilibrium ion distribution in the wide pore. The distributions for both ions inside the channel are very similar except for minor differences near the wide region in the extracellular part (from 40 to 60 Å) and the narrow end of the stem near the intracellular region (from −14 to 0 Å) (see also Figs. 1 and 2). The average number of ions inside the pore is 22.9 and 23.2 from GCMC/BD, and 21.4 and 23.0 from PB for K+ and Cl−, respectively. In accord with experimental observations (Menestrina, 1986), the channel is very weakly selective for anions. The weak anion selectivity arises from the permanent charge distribution inside the pore. In the wide extracellular part of the channel, both GCMC/BD and PB show a higher propensity for Cl−, whereas the narrow intracellular end displays a preference for K+. A peak in Cl− density (slightly separated from that for K+) is observed near the wide extracellular part around 78–85 Å along the Z axis. The position of this peak is correlated with two positively charged lysine residues (K8 and K21) in the channel interior (see Fig. 1). There is a significant decrease in the ion accessible area on the extracellular region, which results in some loss of the ionic densities there. A high K+ density peak is observed near the outer rim of the β-barrel above the two acidic residues (D127 and D128) located between 0 and −12 Å along the Z axis. Because of the heptameric symmetry, there is no significant lateral separation of the anionic and cationic permeation pathways, such as observed for OmpF porin (Im and Roux, 2002a,b).
FIGURE 4.

Average number of ions inside the channel pore along the Z axis from PB (dotted line) and BD (solid line). Three major regions can be distinguished: the wide and irregularly shaped extracellular vestibule (87–40 Å), the narrow constriction zone located at the stem neck (40–36 Å) and the long intracellular stem part of the channel (36 to −13.5 Å) formed by β-strands. The center of the membrane is located at Z = 0.0 Å.
Nonequilibrium ion flow: channel conductance
The current-voltage (I-V) relation in the symmetric 1.0 M KCl solution from GCMC/BD and 3d-PNP is shown in Fig. 5. The error bars in the figure represent the root mean-square deviation of 10 independent GCMC/BD runs and numerical errors of the 3d-PNP computations. The I-V relation appears to be asymmetric, i.e., both IK and ICl are always larger at positive potential than at the corresponding negative potential. The experimentally measured conductance of the protein inserted into a planar lipid bilayer with a 1.0 M KCl solution is 0.775 nS (Miles et al., 2002), 0.651 nS (Gu and Bayley, 2000) at −40 mV, and 1.01 nS (Menestrina, 1986), and 0.721 nS at +40 mV (Gu and Bayley, 2000). The corresponding values from GCMC/BD simulation at −40 and +40 mV are 0.839 nS and 1.11 nS, with inclusion of hydrodynamic correction in Eq. 5, and 0.946 nS and 1.22 nS, using the bulk diffusion coefficient. In all experimental measurements and theoretical computations cited above, the same transmembrane potential convention was used. The cis compartment was connected to the virtual ground and the sign was defined accordingly. Introducing the diffusion coefficient correction does not change the form of the I-V function but only decreases the magnitudes of the flux. The predicted conductance from GCMC/BD is slightly higher than the experimental data. Nonetheless the agreement is remarkable given the fact that no parameters were specifically adjusted to reproduce the experimental values. The corresponding values calculated by 3d-PNP theory are 1.71 ± 0.026 nS and 2.34 ± 0.047 nS. Although the GCMC/BD and PB are in reasonable agreement for the equilibrium ion density distributions (see Fig. 4), Fig. 5 shows that the ionic currents calculated from 3d-PNP are significantly larger than those from GCMC/BD and experiment by 30–60%. It was shown previously that BD and PNP could yield qualitatively similar results in the case of large pores with simple cylindrical geometries (Moy et al., 2000; Corry et al., 2000), overestimated fluxes by PNP were observed in a study of the OmpF porin (Im and Roux, 2002a). Given that the microscopic model and all input parameters are identical in our GCMC/BD and 3d-PNP calculations, this demonstrates that the origin of such overestimation must arise from the lack of some dynamical ion-ion correlations in the mean-field 3d-PNP theory.
FIGURE 5.

Current-voltage relation in a 1.0 M KCl symmetric solution from GCMC/BD simulation and 3d-PNP computations. The total current (solid line) is the sum of K+ (dashed line) and Cl− (dotted line) currents. Experimental data (▪) corresponding to the total current at V = 40mV and V = −40mV were taken from Menestrina (1986) and Miles et al. (2002), respectively.
The calculated channel conductance (G = I/V) and ion current ratio (IK/ICl) in various KCl solutions with the transmembrane potentials of Vmp = ±150 mV are summarized in Table 1. Fig. 6 a illustrates the conductance-concentration relation at Vmp = 150 mV. The relation drastically changes from a nonlinear behavior to a linear one at high concentration. This is normally interpreted as indicative of the importance of electrostatics at low concentrations. The single-channel conductance normalized by salt concentration (G/c) is shown in Fig. 6 b. It appears that (G/c) function is well correlated with the average number of ions inside the channel normalized by salt concentration (Npore/c), as shown in Fig. 6 c.
TABLE 1.
Conductance (nS) and current ratios from GCMC/BD simulations and PNP calculations of α-HL in various KCl symmetric solutions
|
Vmp = +150 mV
|
Vmp = −150 mV
|
||||||
|---|---|---|---|---|---|---|---|
| Concentration (M) | G+ | IK/ICl | G− | IK/ICl | G+/G− | ||
| GCMC/BD | |||||||
| 2.00 | 2.02 ± 0.060 | 0.98 | 1.45 ± 0.042 | 0.69 | 1.39 | ||
| 1.00 | 1.15 ± 0.041 | (1.00*) | 0.91 | 0.66 ± 0.029 | (0.77†) | 0.59 | 1.74 |
| (0.721‡) | (0.651‡) | ||||||
| 0.50 | 0.66 ± 0.008 | (0.45*) | 0.94 | 0.27 ± 0.011 | 0.64 | 2.44 | |
| 0.30 | 0.45 ± 0.015 | (0.37*) | 0.98 | 0.13 ± 0.008 | 0.56 | 3.46 | |
| 0.20 | 0.35 ± 0.007 | 0.94 | 0.075 ± 0.004 | 0.52 | 4.66 | ||
| 0.10 | 0.19 ± 0.002 | (0.14*) | 1.09 | 0.031 ± 0.002 | (0.06*) | 0.47 | 6.12 |
| (0.18§) | (0.1¶) | ||||||
| PNP | |||||||
| 2.00 | 4.08 ± 0.029 | 0.90 | 3.22 ± 0.037 | 0.89 | 1.26 | ||
| 1.00 | 2.38 ± 0.048 | 0.89 | 1.49 ± 0.012 | 0.81 | 1.59 | ||
| 0.50 | 1.19 ± 0.026 | 0.91 | 0.58 ± 0.010 | 0.77 | 2.05 | ||
| 0.30 | 0.79 ± 0.009 | 0.82 | 0.31 ± 0.007 | 0.71 | 2.54 | ||
| 0.20 | 0.55 ± 0.012 | 1.01 | 0.12 ± 0.011 | 0.73 | 4.58 | ||
| 0.10 | 0.31 ± 0.035 | 1.11 | 0.04 ± 0.004 | 0.69 | 7.75 | ||
All numbers representing the experimental conductances are shown in the following potential convention: the cis compartment of the experimental chamber was connected to the virtual ground.
Experimental channel conductance is in parentheses:
Measurements done at applied voltage of 40 mV and different salt solution compositions (Menestrina, 1986).
Applied voltage of −40mV and 1.0 M of KCl solution (Miles et al., 2002).
Applied voltage Vmp = +40 mV and 1.0M of KCl solution (Gu and Bayley, 2000).
Applied voltage of 15 mV and 0.1 M of KCl solutions (Walker et al., 1992).
Applied voltage of −40 mV and 0.1 M of KCl solutions (Krasilnikov et al., 2000).
FIGURE 6.

(a) Conductance-concentration (G-c) relation (solid line) from GCMC/BD at Vmp = 150 mV with contribution from K+ (dashed line) and Cl− (dotted line) currents. (b) Channel conductances normalized by a salt concentration. (c) Number of ions K+ (dashed line) and Cl− (dotted line) inside the pore normalized by salt concentration from BD simulation without transmembrane potential.
Table 1 also shows the variation of the asymmetry in the channel conductance upon the polarity of the applied potential, G+/G−, as a function of the concentration. It appears that the asymmetry decreases with an increase of salt concentration. Similar observations were made in the GCMC/BD simulations of the OmpF porin (Im and Roux, 2002a). This result correlates well with experiment. The experimental conductance asymmetry (G+/G−) of α-HL is 2–3 in 0.1 M KCl (Menestrina, 1986; Walker et al., 1992) and 1.1–1.4 in 1.0 M KCl (Menestrina, 1986; Miles et al., 2002; Gu and Bayley, 2000), respectively. The corresponding values in 0.1 M from GCMC/BD (6.33) and 3d-PNP (7.45) appear to be strongly overestimated. The origin of this effect is unclear. Increasing the salt concentration from 0.1 to 1.0M KCl yields improvement in the computed conductance asymmetries from GCMC/BD (1.74) and PNP (1.59), compared with the experimental value (1.3). An additional cause for the slightly overestimated asymmetry is the transmembrane potential. For instance, the asymmetry computed in 1M of KCL at Vmp = ±40 mV is 1.32, which is the same as the experimental estimate, while increasing the applied potential from 40 mV to 150 mV increases computed asymmetry by 30–50%. Larger values of the transmembrane potential were used here to get better statistics on the ion crossings events from the BD simulations. This is more critical for small concentrations (<0.5 M of KCL). Interestingly, the large bacterial channels such as meningococcal PorA/C1 (Song et al., 1999), MscS (Sukharev, 2002) display also an asymmetric current. Experimental studies of the antibody binding to the meningococcal PorA/C1 suggested that the rectification of the current could be explained in the terms of the protein shape (Song et al., 1999).
One possible explanation for the asymmetric conductance is the static charge distribution in the channel interior. This is exemplified by the strong dependence of the asymmetry upon salt concentration. An additional factor may be the specific geometry of the pore. To elucidate the origin of the conductance asymmetry of α-HL, we performed GCMC/BD simulations of the channel bathed in 1.0 M KCl solutions with all protein charges turned off at two opposite voltages (Vmp = ±150 mV). The results are 0.98 nS and 0.96 nS at positive and negative voltage, respectively, showing that the shape of the pore has no significant effect on the asymmetric conduction in α-HL.
To elucidate the molecular determinants of the asymmetric channel conductance, we examined the effect of a step-by-step neutralization of different parts of the channel on ion flow. A 0.5M KCl symmetric solution was simulated at ±150 mV with GCMC/BD because the computed and experimentally measured conductances agree reasonably, and asymmetric effects in the ion conductance are well-pronounced in comparison to higher salt concentrations. First, it appears that the neutralization of the wide cap domain of the α-HL does not change significantly the ion permeation properties except for some increase in the ion currents. The cap domain sequence used for neutralization contains up to 80% of all amino acid residues except those forming the transmembrane domain from Lys-110 to Tyr-148 (Song et al., 1996). The channel conductances computed by the GCMC/BD simulations are 0.79 nS at +150 mV and 0.39 nS at −150 mV, which corresponds to a G+/G− ratio of 2.02 compared to 2.44 for the fully charged channel. The complete neutralization of the transmembrane stem domain formed by β-barrels clearly shows more pronounced effects on the channel conductance making it almost symmetric at different voltages with a G+/G− of 0.98. Assuming that the geometry does not have any significant influence on the asymmetric conductance, we further explored the contributions of different residues located in the stem domain on the channel conductance. Misakian and Kasianowics (2003) suggested that the asymmetric conductance can be attributed to the side chains of E111, which introduces a barrier for the anion passage in the constriction zone of the channel, or to the charges located in or near channel entrances (D127-D128-K131). All results on the ionic currents through the α-HL channel and its partially neutralized forms are collected in Table 2. The complete neutralization of E111 or the E111-K147 ion pair in the constriction zone does not eliminate the asymmetric conduction through the channel but affects its magnitude, i.e., the conduction ratio G+/G− is 3.34 and 1.98 for neutralized E111 and E111-K147, respectively. Furthermore, a close examination reveals that the cation current with and without the neutralization of E111 remains almost unchanged at ±150 mV (within the statistical error of the GCMC/BD simulation), but the anion current increases significantly for both voltages in comparison to the wild-type. Our findings suggest that E111 and K147 are essential for the ion selectivity but not for the rectification of the ion current. As shown in Fig. 7 a, an energy barrier due to the presence of E111 exists, but it is not rate-determining. Fig. 7 a rather suggests that the asymmetry arises from the presence of the potential barrier near the intracellular end of the stem domain, between 0 and −12 Å along the Z axis. It also depends on the direction of the salt gradient. The one-dimensional free-energy profiles summarized with the positive (Fig. 7 b) and negative (Fig. 7 c) transmembrane potential contributions reveal the origins of the asymmetric conduction phenomenon. At negative applied voltage, the barrier located at the end of the transmembrane region is partially compensated by the contribution from the transmembrane potential. Three charged residues (D127, D128, and K131) are located between the 0 and −12 Å zone along the Z axis corresponding to the potential barrier discussed above. D127 and K131 form an ionic pair, and D128 provides an additional negative charge. This affects the shape of the I-V curve and introduces the asymmetries in the ionic conduction through α-HL. The acceleration of the cation is the result of the electric field from the D128 in addition to the ionic pair formed by D127 and K131, i.e., D128 makes the intracellular entrance of the channel attractive for cations and introduces the asymmetry in the conductance. To test these ideas, additional simulations were performed in which the side chains of D127, D128, and K131 were neutralized. The calculated G+/G− for neutralized side chains of D127, D128, and K131 are 0.48, 0.99, and 2.61 respectively. These results demonstrate conclusively that the presence of D128 near the intracellular end is the molecular determinant of the asymmetric channel conductance in α-HL.
TABLE 2.
Ion currents (pA) and conductance (nS) from GCMC/BD simulations of α-hemolysin channel and its partially neutralized forms in 0.5M KCl symmetric solutions
| Protein | Vmp = +150mV | Vmp = −150mV | |||||||
|---|---|---|---|---|---|---|---|---|---|
| IK(+) | ICl(–) | IK/ICl | G+ | IK(–) | ICl(+) | −IK/ICl | G− | G+/G− | |
| Wild-type | 47.97 | 51.03 | 0.94 | 0.66 | −15.81 | −24.69 | 0.64 | 0.27 | 2.44 |
| E111 | 54.47 | 136.17 | 0.40 | 1.27 | −10.68 | −46.46 | 0.22 | 0.38 | 3.34 |
| K147 | 83.31 | 18.69 | 4.45 | 0.68 | −93.46 | −33.11 | 2.82 | 0.84 | 0.81 |
| E111-K147 | 89.67 | 40.83 | 2.2 | 0.87 | −27.38 | −39.72 | 0.68 | 0.44 | 1.98 |
| D127 | 29.90 | 66.24 | 0.45 | 0.64 | −37.41 | −103.31 | 0.36 | 0.93 | 0.48 |
| D128 | 42.99 | 77.42 | 0.55 | 0.80 | −33.61 | −85.20 | 0.39 | 0.79 | 0.99 |
| K131 | 91.25 | 89.36 | 1.02 | 1.2 | −28.94 | −40.72 | 0.71 | 0.46 | 2.61 |
| D127-D128-K131 | 34.96 | 91.61 | 0.38 | 0.84 | −33.82 | −94.34 | 0.35 | 0.85 | 0.99 |
Iα(+) and Iα(−) are outward and inward currents of the ion type α, respectively.
FIGURE 7.

(a) Effective one-dimensional free-energy profile of K+ (dashed line), Cl− (dotted line), and the transmembrane potential (solid line) in a 1.0 M KCl symmetric solution. The center of the membrane is located at Z = 0.0 Å. The same profile combined with contribution from transmembrane potential of (b) +150mV and (c) −150mV.
Nonequilibrium ion flow: channel selectivity
A generally accepted framework to characterize the selectivity of ion channels is the Goldman-Hodgkin-Katz voltage equation for the reversal potential Vrev (Hodgkin and Katz, 1949),
 |
(7) |
where [C]i and [C]o are the intracellular and extracellular KCl concentrations.
Im and Roux (2002a) suggested that the current ratio IK/ICl can be used as an indicator for the selectivity at a given concentration. As shown in Table 1, the distribution of IK/ICl suggests that ion concentrations have no visible influence on channel selectivity, though selectivity depends on the direction of the salt gradient. This agrees qualitatively with the experimental observations reported by Gu et al. (2001a,b), where the permeability ratio (PK/PCl) is 0.34–0.55 for [C]I = 0.2:[C]o = 1.0 M KCl and 0.79 for 1.0:0.2M KCl. Those values correspond to a normal range of pH 5.5 to 7.5 (Gu et al., 2001a,b). According to experiments, the pore displays a very similar preference in the case of NaCl, with measured permeability ratio of 0.78 (Gu et al., 2003). For a more rigorous analysis, the permeability ratio is extracted from the reversible potentials in Figs. 8 and 9. As shown in Table 3, the results are 0.515 (GCMC/BD) and 0.553 (3d-PNP) for 0.2:1.0 M KCl, and 0.971 (GCMC/BD) and 1.322 (3d-PNP) for 1.0:0.2M KCl, which are in excellent accord with the experimental values.
FIGURE 8.

Current-voltage relation in KCl asymmetric solution from GCMC/BD simulations. The total current (solid line) is the sum of K+ (dashed line) and Cl− (dotted line) currents.
FIGURE 9.

Current-voltage relation in KCl asymmetric solution from PNP computations. The total current (solid line) is the sum of K+ (dashed line) and Cl− (dotted line) currents.
TABLE 3.
The reversal potential (Vrev in mV) and permeability ratio (PK/PCl)* of the α-hemolysin channel
| Composition | GCMC/BD | PNP | Experiment |
|---|---|---|---|
| 0.2M:1.0M | 11.20 (0.51) | 10.05 (0.55) | 9.2 (0.55) |
| 1.0M:0.2M | −0.50 (0.97) | 4.60 (1.32) | −3.7 (0.79) |
Corresponding permeability ratios are in parentheses.
Both computations and experimental observations show that the direction of the salt gradient has a significant effect on the permeability ratio. This might be attributed to a nonsymmetric free energy profile of ions inside the channel. As discussed above, there is a moderate separation in the magnitude of the energetic barriers for anions and cations near the narrow stem region, which favors cation passage due to D128. An additional barrier at the wide extracellular part opposes extracellular-to-intracellular cation passage when [C]I = 0.2M and [C]o = 1.0 M KCl. The extracellular anion-attractive side has an average radius twice larger than that of the narrow stem part (Fig. 3). This results in an increase of the number of anions, which is not completely compensated by the changes of the salt gradient from 1.0:0.2 M to 0.2:1.0 M KCl. The delicate balance between these two effects results in the decrease or even reverse of channel selectivity to a nonselective (GCMC/BD) or weak-cation selective (3d-PNP) form with the change of the salt gradient directions from 1.0:0.2 M to 0.2:1.0 M KCl. It should be noted that the standard error in the reversal potential extracted from GCMC/BD simulation or 3d-PNP computations at the small voltages is generally high, and it is difficult to define small reversal potentials more accurate than ±2–3 mV. A similar uncertainty exists for the experiments.
The free energy profiles in Fig. 7 clearly show that the effective free-energy barriers are smaller by 0.5–1 kcal/mol for anions compared to cations except near the narrow intracellular end of the channel, which makes the channel anion-selective. The highest energetic barrier is located near 35–40 Å, i.e., in the narrowest part of the channel (the constriction zone) formed by the pair of two charged residues E111 and K147.
The results on the current ratio IK/ICl as an indicator for selectivity accumulated in Table 2 suggest that the ion pair of E111 and K147 is causing the weak anion selectivity. To test this, we performed a series of GCMC/BD simulations in the asymmetric 0.2:1.0 M KCl solution with the charges of those side chains turned off. The neutralization of E111 resulted in high anion selectivity, with a reversal potential extracted from an I-V relation of 25.6 mV and a permeability ratio of 0.185. Similar computations done with a neutralized K147 result in a moderate cation selectivity, with a reversal potential of −17.8 mV and permeability ratio of 2.975. The neutralization of E111 and K147 result in a nonselective channel, with a reversal potential of 0.5 mV and a permeability ratio of 0.971. Wild-type channel at similar conditions displays a reversal potential of 9.2 mV with a permeability ratio of 0.515. Experimentally, an increase of anion selectivity is observed in low pH values (Menestrina, 1986). This may be attributed to the possible protonation of E111, which affects the cumulative positive charge on E111-K147 salt bridge and makes the pore more attractive to anions.
The crystal structure shows that the positively charged side chain of K147 points toward the lumen of the pore, whereas the negatively charged side chain of E111 located along the channel axis form a salt bridge with K147. The average distance between the NZ amide group of K147 and the central axis of the channel is 7 Å. The corresponding distance for the carboxylate group of E111 is 9 Å. The specific position of K147 in the constriction zone makes the channel surface more attractive for anions than for cations, but this effect is moderated by the presence of E111 located next to K147. This finding is in excellent agreement with experimental studies of the single amino-acid replacement in the α-HL channel, where the single mutation K147N made the channel moderately cation selective, whereas the double mutation E111N/K147N did not show any ion selectivity (Gu et al., 2001a,b). It was shown that these residues are not conserved in the hemolysin-like proteins and their simultaneous replacement by cysteines does not affect the function of the protein significantly (Gouaux, 1998). It can be concluded that the small charge separation presented by the salt bridge in the constriction zone of the channel is the reason of the weak anion selectivity.
CONCLUSION
We have performed extensive computations of ion permeation through the α-HL channel to elucidate the origins of the asymmetric conductance and the structural basis of the weak anion selectivity of the channel. It was found that the molecular determinant of the asymmetry in the conduction is the presence of the potential barrier located at the intracellular side of the β-barrel. This barrier is caused by the unpaired negatively charged residue D128 located near the intracellular entrance to the channel. Together with the direction of the applied transmembrane potential, it provides a significant acceleration for cation flow through the channel and therefore affects the symmetry in ion conduction. In addition, the charged separation in the constriction zone of the channel due to the presence of E111 and K147 was identified as the structural feature at the origin of the anion selectivity.
From a methodological point of view, this study demonstrates the overall validity of computational models to simulate ion flow in medium and large aqueous channels. The results obtained using GCMC/BD and 3d-PNP are consistent with available experimental data. This indicates that both methods are able to capture the important electrostatic interactions among ions, solvent, and protein. However, although 3d-PNP reproduces experimentally measured reversal potentials and permeability ratios fairly well, the channel conductance is typically overestimated by 30–50%. Because 3d-PNP (or PB) reproduces the results of GCMC/BD under equilibrium conditions, in the absence of ion flow, the main reason for inaccuracies in PNP is a lack of dynamical ion-ion correlations. How to fix such deficiency is, however, unclear (Roux et al., 2004).
The channel conductances and selectivities from GCMC/BD simulations are in excellent accord with the experimental data. This is particularly satisfying since all inputs for BD such as ionic exclusion hydration layers, water-mediated short-range ionic interactions wsr(r), were extracted from previous MD simulations of the OmpF channel (Im and Roux, 2001, 2002a) and were used without any specific adjustments to reproduce the experimental data for α-HL.
Acknowledgments
Useful discussions with Toby Allen are gratefully acknowledged.
This work was supported by National Institutes of Health grant GM 62342. This project was also funded by a fellowship from the Epilepsy Foundation through the generous support of the American Epilepsy Society and UCB Pharma (Sergei Noskov).
S.N. is on leave from the Institute of Solution Chemistry, Russian Academy of Sciences, Ivanovo 153045, Russian Federation.
References
- Allen, T. W., S. Kuyucak, and S. H. Chung. 1999. The effect of hydrophobic and hydrophilic channel walls on the structure and diffusion of water and ions. J. Chem. Phys. 111:7985–7999. [Google Scholar]
- Alouf, J. E., and J. H. Freer. 1999. Comprehensive Sourcebook of Bacterial Protein Toxins. Academic Press, London.
- Bashford, D., and K. Gerwert. 1992. Electrostatic calculation of the pKa values of ionizable groups in bacteriorhodopsin. J. Mol. Biol. 224:473–486. [DOI] [PubMed] [Google Scholar]
- Bashford, D., and M. Karplus. 1990. pKa's of ionizable groups in proteins: atomic detail from a continuum electrostatic model. Biochemistry. 29:10219–10225. [DOI] [PubMed] [Google Scholar]
- Bastug, T., and S. Kuyucak. 2003. Role of the dielectric constants of membrane proteins and channel water in ion permeation. Biophys. J. 84:2871–2882. [DOI] [PMC free article] [PubMed] [Google Scholar]
- Bayley, H., and C. R. Martin. 2000. Resistive-pulse sensing-from microbes to molecules. Chem. Rev. 100:2575–2594. [DOI] [PubMed] [Google Scholar]
- Berman, H. M., Z. Westbrook, G. Feng, T. N. Gilliland, H. Bhat, I. N. Weissig, I. N. Shindyalov, and P. E. Bourne. 2000. The protein data bank. Nucl. Acid. Res. 28:235–242. [DOI] [PMC free article] [PubMed] [Google Scholar]
- Bhakdi, S., and J. Tranum-Jensen. 1991. Alpha-toxin of staphylococcus aureus. Microbiol. Rev. 55:733–759. [DOI] [PMC free article] [PubMed] [Google Scholar]
- Chung, S. H., M. Hoyles, T. Allen, and S. Kuyucak. 1998. Study of ionic currents across a model membrane using Brownian dynamics. Prog. Biophys. Mol. Biol. 46:51–96. [DOI] [PMC free article] [PubMed] [Google Scholar]
- Corry, B., S. Kuyucak, and S. H. Chung. 2003. Dielectric self-energy in Poisson-Boltzmann and Poisson-Nernst-Planck models of ion channels. Biophys. J. 84:3594–3606. [DOI] [PMC free article] [PubMed] [Google Scholar]
- Corry, B., S. Kuyucak, and S. H. Chung. 2000. Tests of continuum theories as models of ion channels. II. Poisson-Nernst-Plank theory versus Brownian dynamics. Biophys. J. 78:2364–2381. [DOI] [PMC free article] [PubMed] [Google Scholar]
- Ermak, D., and J. A. McCammom. 1978. Brownian dynamics with hydrodynamic interaction. J. Chem. Phys. 69:1352–1360. [Google Scholar]
- Gentschev, I., G. Dietrich, and W. Goebel. 2002. The E. coli alpha-hemolysin secretion system and its use in vaccine development. Trends Microbiol. 10:39–45. [DOI] [PubMed] [Google Scholar]
- Gouaux, E. 1998. Alpha-hemolysin from staphylococcus aureus: an archetype of beta-barrel, channel-forming toxins. J. Struct. Biol. 121:110–122. [DOI] [PubMed] [Google Scholar]
- Gu, L. Q., and H. Bayley. 2000. Interaction of the noncovalent molecular adapter, beta-cyclodextrin, with the staphylococcal alpha-hemolysin pore. Biophys. J. 79:1967–1975. [DOI] [PMC free article] [PubMed] [Google Scholar]
- Gu, L. Q., O. Braha, S. Conlan, S. Cheley, and H. Bayley. 1999. Stochastic sensing of organic analytes by a pore-forming protein containing a molecular adapter. Nature. 398:686–690. [DOI] [PubMed] [Google Scholar]
- Gu, L. Q., M. Dalla Serra, J. B. Vincent, G. Vigh, S. Cheley, O. Braha, and H. Bayley. 2001a. Reversal of charge selectivity in transmembrane protein pores by using noncovalent molecular adapters. Proc. Natl. Acad. Sci. USA. 97:3959–3964. [DOI] [PMC free article] [PubMed] [Google Scholar]
- Gu, L. Q., S. Cheley, and H. Bayley. 2001b. Prolonged residence time of a noncovalent molecular adapter, beta-cyclodextrin, within the lumen of mutant alpha-hemolysin pores. J. Gen. Physiol. 118:481–494. [DOI] [PMC free article] [PubMed] [Google Scholar]
- Gu, L. Q., S. Cheley, and H. Bayley. 2003. Electroosmotic enhancement of the binding of a neutral molecule to a transmembrane pore. Proc. Natl. Acad. Sci. USA. 100:15498–15503. [DOI] [PMC free article] [PubMed] [Google Scholar]
- Hodgkin, A., and B. Katz. 1949. The effect of sodium ions on the electrical activity of the giant axon of the squid. J. Physiol. 108:37–77. [DOI] [PMC free article] [PubMed] [Google Scholar]
- Im, W., and B. Roux. 2001. Brownian dynamics simulations of ion channels: a general treatment of electrostatic reaction fields for molecular pores of arbitrary geometry. J. Chem. Phys. 115:4850–4861. [Google Scholar]
- Im, W., and B. Roux. 2002a. Ion permeation and selectivity of OmpF porin: a theoretical study based on molecular dynamics, Brownian dynamics, and continuum electrodiffusion theory. J. Mol. Biol. 322:851–869. [DOI] [PubMed] [Google Scholar]
- Im, W., and B. Roux. 2002b. Ions and counterions in a biological channel: a molecular dynamics simulation of OmpF porin from Escherichia coli in an explicit membrane with 1 m kcl aqueous salt solution. J. Mol. Biol. 319:1177–1197. [DOI] [PubMed] [Google Scholar]
- Im, W., S. Seefeld, and B. Roux. 2000. Grand canonical Monte Carlo-Brownian dynamics algorithm for simulating ion channels. Biophys. J. 79:788–801. [DOI] [PMC free article] [PubMed] [Google Scholar]
- Kasianowicz, J. J., and S. M. Bezrukov. 1995. Protonation dynamics of the alpha-toxin ion channel from spectral analysis of ph-dependent current fluctuations. Biophys. J. 69:94–105. [DOI] [PMC free article] [PubMed] [Google Scholar]
- Kasianowicz, J. J., D. L. Burden, S. Han, L. C. Cheley, and H. Bayley. 1999. Genetically engineered metal ion binding sites on the outside of a channel's transmembrane beta-barrel. Biophys. J. 76:837–845. [DOI] [PMC free article] [PubMed] [Google Scholar]
- Keminer, O., and R. Peters. 1999. Permeability of single nuclear pores. Biophys. J. 77:217–228. [DOI] [PMC free article] [PubMed] [Google Scholar]
- Krasilnikov, O. V., P. G. Merzlyak, L. N. Yuldasheva, C. G. Rodrigues, S. Bhakdi, and A. Valeva. 2000. Electrophysiological evidence for heptameric stoichiometry of ion channels formed by staphylococcus aureus alpha-toxin in planar lipid bilayers. Mol. Microbiol. 37:1372–1378. [DOI] [PubMed] [Google Scholar]
- Kurnikova, M., R. Coalson, P. Graf, and A. Nitzan. 1999. A lattice relaxation algorithm for three-dimensional Poisson-Nernst-Planck theory with application to ion transport through the gramicidin a channel. Biophys. J. 76:642–656. [DOI] [PMC free article] [PubMed] [Google Scholar]
- Laestadius, A., A. Richter-Dahlfors, and A. Aperia. 2002. Dual effects of Escherichia coli alpha-hemolysin on rat renal proximal tubule cells. Kidney Int. 62:2035–2042. [DOI] [PubMed] [Google Scholar]
- MacKerell, A. D., D. Bashford, M. Bellott, R. L. Dunbrack, J. D. Evanseck, M. J. Field, S. Fischer, J. Gao, H. Guo, S. Ha, D. Joseph-McCarthy, L. Kuchnir, K. Kuczera, F. T. K. Lau, C. Mattos, S. Michnick, T. Ngo, D. T. Nguyen, B. Prodhom, W. E. Reiher, B. Roux, M. Schlenkrich, J. C. Smith, R. Stote, J. Straub, M. Watanabe, J. Wiorkiewicz-Kuczera, D. Yin, and M. Karplus. 1998. All-atom empirical potential for molecular modeling and dynamics studies of proteins. J. Phys. Chem. B. 102:3586–3616. [DOI] [PubMed] [Google Scholar]
- May, A. K., R. G. Sawyer, T. Gleason, A. Whitworth, and T. L. Pruett. 1996. In vivo cytokine response to Escherichia coli alpha-hemolysin determined with genetically engineered hemolytic and nonhemolytic E. coli variants. Infect. Immun. 64:2167–2171. [DOI] [PMC free article] [PubMed] [Google Scholar]
- Menestrina, G. 1986. Ionic channels formed by staphylococcus aureus alpha-toxin: voltage-dependent inhibition by divalent and trivalent cations. J. Membr. Biol. 90:177–190. [DOI] [PubMed] [Google Scholar]
- Menestrina, G., M. D. Serra, and G. Prevost. 2001. Mode of action of beta-barrel pore-forming toxins of the staphylococcal alpha-hemolysin family. Toxicon. 39:1661–1672. [DOI] [PubMed] [Google Scholar]
- Miles, G., H. Bayley, and S. Cheley. 2002. Properties of Bacillus cereus hemolysin II: a heptameric transmembrane pore. Protein Sci. 11:1813–1824. [DOI] [PMC free article] [PubMed] [Google Scholar]
- Misakian, M., and J. J. Kasianowics. 2003. Electrostatic influence on ion transport through the hl channel. J. Membr. Biol. 195:137–146. [DOI] [PubMed] [Google Scholar]
- Moy, G., B. Corry, S. Kuyucak, and S. H. Chung. 2000. Tests of continuum theories as models of ion channels. I. Poisson-Boltzmann theory versus Brownian dynamics. Biophys. J. 78:2349–2363. [DOI] [PMC free article] [PubMed] [Google Scholar]
- Nadler, B., U. Hollerbach, and R. S. Eisenberg. 2003. Dielectric boundary force and its crucial role in gramicidin. Phys. Rev. E. 68:021905. [DOI] [PubMed] [Google Scholar]
- Paine, P. L., L. C. Moore, and S. B. Horowitz. 1975. Nuclear-envelope permeability. Nature. 254:109–114. [DOI] [PubMed] [Google Scholar]
- Paine, P. L., and P. Scherr. 1975. Drag coefficients for the movement of rigid spheres through liquid-filled cylindrical pores. Biophys. J. 15:1087–1091. [DOI] [PMC free article] [PubMed] [Google Scholar]
- Partenskii, M. B., and P. C. Jordan. 1992a. Nonlinear dielectric behavior of water in transmembrane ion channels: Ion energy barriers and the channel dielectric constant. J. Phys. Chem. 96:3906–3910. [Google Scholar]
- Peters, R. 1986. Fluorescence microphotolysis to measure nucleocytoplasmic transport and intracellular mobility. Biochim. Biophys. Acta. 864:305–359. [DOI] [PubMed] [Google Scholar]
- Pitera, J. W., M. Falta, and W. F. van Gunsteren. 2001. Dielectric properties of proteins from simulation: the effects of solvent, ligands, pH, and temperature. Biophys. J. 80:2546–2555. [DOI] [PMC free article] [PubMed] [Google Scholar]
- Roux, B. 1997. The influence of the membrane potential on the free energy of intrinsic protein. Biophys. J. 73:2980–2989. [DOI] [PMC free article] [PubMed] [Google Scholar]
- Roux, B., T. Allen, S. Berneche, and W. Im. 2004. Theoretical and computational models of biological ion channels. Quart. Rev. Biophys. 37:15–103. [DOI] [PubMed] [Google Scholar]
- Schutz, C. N., and A. Warshel. 2001. What are the dielectric “constants” of proteins and how to validate electrostatic models? Proteins. 44:400–417. [DOI] [PubMed] [Google Scholar]
- Shilov, I. Y., and M. G. Kurnikova. 2003. Energetics and dynamics of cyclic oligosaccharide molecule in confined protein pore environment. a molecular dynamics study. J. Phys. Chem. B. 107:7189–7201. [Google Scholar]
- Simonson, T., and C. L. Brooks. 1996. Charge screening and the dielectric constant of proteins: insights from molecular dynamics. J. Am. Chem. Soc. 118:8452–8458. [Google Scholar]
- Smart, O. S., J. M. Goodfellow, and B. A. Wallace. 1993. The pore dimensions of gramicidin A. Biophys. J. 65:2455–2460. [DOI] [PMC free article] [PubMed] [Google Scholar]
- Song, J., A. S. A. Conceição, M. Minetti, M. S. Blake, and M. Colombini. 1999. Meningococcal pora/c1, a channel that combines high conductance and high selectivity. Biophys. J. 76:804–813. [DOI] [PMC free article] [PubMed] [Google Scholar]
- Song, L., M. R. Hobaugh, C. Shustak, L. Cheley, H. Bayley, and E. Gouaux. 1996. Structure of staphylococcal alpha-hemolysin, a heptameric transmembrane pore. Science. 274:1859–1866. [DOI] [PubMed] [Google Scholar]
- Sukharev, S. 2002. Purification of the small mechanosensitive channel of Escherichia coli (MscS): the subunit structure, conduction, and gating characteristics in liposomes. Biophys. J. 83:290–298. [DOI] [PMC free article] [PubMed] [Google Scholar]
- Walker, B. J., M. Krishnasastry, L. Zorn, J. J. Kasianowicz, and H. Bayley. 1992. Functional expression of the alpha-hemolysin of staphylococcus-aureus in intact Escherichia coli and in cell lysates—deletion of 5 C-terminal amino-acids selectively impair hemolytic-activity. J. Biol. Chem. 267:10902–10909. [PubMed] [Google Scholar]