Abstract
The strong specific binding of streptavidin (SA) to biotin is utilized in numerous biotechnological applications. The SA tetramer is also known to exhibit significant stability, even in the presence of sodium dodecylsulfate (SDS). Despite its importance, relatively little is known about the nature of the thermal denaturation pathway for SA. This work uses a homogeneous SA preparation to expand on the data of previous literature reports, leading to the proposal of a model for temperature induced structural changes in SA. Temperature dependent data were obtained by SDS and native polyacrylamide gel electrophoresis (PAGE), differential scanning calorimetry (DSC), and fluorescence and ultraviolet (UV)-visible spectroscopy in the presence and absence of SDS. In addition to the development of this model, it is found that the major thermal transition of SA in 1% SDS is reversible. Finally, although SA exhibits significant precipitation at elevated temperatures in aqueous solution, inclusion of SDS acts to prevent SA aggregation.
INTRODUCTION
For more than two decades, streptavidin (SA) has been an important reagent for clinical diagnostics, biochemistry, and biotechnology (Schetters, 1999; Skerra and Schmidt, 1999). SA has a strong (KD ∼ 10−15 M) and specific binding affinity with biotin (vitamin H) and high structural stability (Gonzalez et al., 1997; Weber et al., 1989). This structural stability is further enhanced upon binding of biotin, which has been attributed to improvement of intersubunit interactions and an increase in structural order (Gonzalez et al., 1997; Weber et al., 1989).
Native SA is a homotetramer, with a molecular mass of ∼60 kDa, containing no cysteine residues and six tryptophans per monomer. Although other proteins gain structural stability and rigidity via the formation of disulfide bonds, SA derives its unusual stability in other ways. The SA dimer is held together by extensive interactions, predominantly hydrogen bonds and salt bridges between monomer units (Katz, 1997; Weber et al., 1987, 1989). The dimer-dimer interface is held together more weakly by hydrophobic interactions (Coussaert et al., 2001). Upon the binding of biotin, Trp-120 from an adjacent dimer interacts with the ligand, leading to enhancement of the tetramer stability (Gonzalez et al., 1997; Sano et al., 1997). The dimer-dimer interaction has been calculated to be ∼50 kBT (124 kJ/mol) (Coussaert et al., 2001; Sano et al., 1997).
Previous work by Bayer et al. and others have shown that the native monomer is a 159-residue chain (16.5 kDa), but commercial preparations vary in length (Aragana et al., 1986; Bayer et al., 1989). Full length SA is produced by Streptomyces avidinii, but the bacterium also contains intrinsic proteases that can cleave residues 1–14 and 139–159. SA that is fully cleaved by these naturally occurring proteases consists of residues 13–139 (13.3 kDa), referred to as core-SA. Depending on production and purification protocols followed, one typically finds something closer to core-SA in commercial preparations, though heterogeneous mixtures of chains are also observed (Bayer et al., 1989). This puts the molecular mass of most commercial preparations in the 53–55-kDa range for the tetramer. The pI is variable between 5 and 6 (Green, 1990).
SA is widely used in laboratory and clinical diagnostic test kits (Schetters, 1999). The strong SA-biotin interaction is used as a molecular “hook” for detection of biotin-labeled biomolecules such as DNA, RNA, and proteins (Hsu et al., 1981; Matthews et al., 1985). These interactions are detected by covalently linked SA-enzyme conjugates that catalyze the reaction of nonchromophoric substrates to fluorescent (Gruber et al., 1997; Marek et al., 1997; Wiese, 2003) or chemiluminescent (Hsu et al., 1981; Matthews et al., 1985) products. These methods typically involve immobilizing the biomolecule on a solid support such as nylon or nitrocellulose membranes and probing with an SA-enzyme conjugate. The conditions may sometimes require denaturing agents such as sodium dodecylsulfate (SDS) that may alter the SA structure and function. Another use of SA that is becoming more common is as an anchoring agent in optical tweezer experiments (Kuo and Sheetz, 1993).
Prior work has shown that SA is structurally quite stable with respect to thermal denaturation or melting (Bayer et al., 1990, 1996; Gonzalez et al., 1997, 1999). At neutral pH, SA has a high Tm (≥75°C) (Gonzalez et al., 1999), which is reduced in the presence of denaturing agents such as sodium dodecylsulfate (Bayer et al., 1996) and urea (Gonzalez et al., 1999). At 25°C, SA retains its tetrameric state in 9% (315 mM) SDS (Bayer et al., 1996) and in 7 M urea for at least 66 days (Kurzban et al., 1991). A number of groups have begun to examine the structural changes accompanying thermal denaturation, though a full picture of the thermal unfolding process has not yet been obtained. Bayer et al. (1996) have examined the effect of SDS on the quaternary structure of SA and its animal kingdom relative, avidin. Kurzban et al. (1991) examined the influence of urea on the quaternary structure of SA. With respect to SA, urea does not act as a simple denaturant. The role of urea appears to be twofold, binding as a biotin analog (Ka ∼ 1.3 M−1), as well as altering quaternary structure (Kurzban et al., 1991). Others have engineered mutants of SA that are dimeric in form (Sano et al., 1997). Part of the motivation for the preceding work was to examine the seemingly linked role of tetramer stability and biotin binding strength. The Tm of SA has been shown to increase significantly in the presence of biotin (112 vs. 75°C for apostreptavidin) (Gonzalez et al., 1999). Because it has been uncertain whether the Tm represents dissociation of tetramers into smaller units or unfolding of individual subunits, this work seeks to better define these steps by use of several complementary techniques. A major goal of this study was to propose a pathway for the thermally induced unfolding of SA in the presence and absence of SDS.
The application of differential scanning calorimetry (DSC) to protein folding and stability represents a rapidly growing field. Despite this increase, little effort has focused on the examination of SA using this technique. Gonzalez et al. (1997, 1999) have reported DSC measurements for SA solutions with varying molar ratios of biotin. In that work, an increase in SA stability was observed upon biotin binding. Weber et al. (1994) also examined SA by DSC. The focus of their work was examination of synthetic 2-(4′-hydroxyazobenzene)benzoic acid (HABA) analog binding within the biotin binding site of SA. Each of these two groups used commercial SA preparations, without further purification, and whereas the former found Tm = 75°C, the latter group reported an observed Tm = 84.1°C for apo-SA (Gonzalez et al., 1997, 1999; Weber et al., 1994). In the work here, an attempt was made to obtain a relatively homogeneous commercial preparation of SA and examine the effect of SDS on its thermal stability.
The six tryptophans per SA subunit are useful spectroscopic environmental probes, since each tryptophan is located in a unique position, and steady-state fluorescence yields a composite of the total. Tryptophans exposed to aqueous solvent typically fluoresce with a peak excitation of 280 nm and an emission of 350 nm. Tryptophans that are buried within the hydrophobic protein core generally have a significantly lower peak emission wavelength. Native SA is no exception, as its peak emission is 333–335 nm (Kurzban et al., 1990, 1991). Upon denaturation by heat or chemical denaturants, buried tryptophans typically become exposed to aqueous solvent that causes the fluorescence emission maximal wavelength to increase (red shift) (Lakowicz, 1983).
This study carefully examines the thermal stability of SA in both the presence and absence of SDS. This is done using a variety of tools that offer the ability to independently assess the structure and behavior of SA. The primary techniques employed are DSC, fluorescence spectroscopy, and polyacrylamide gel electrophoresis (PAGE). Detection of thermally induced precipitation by ultraviolet (UV)-visible spectroscopy helps to link together observations made using the three primary techniques. The system is further controlled by using a highly homogeneous preparation of SA that shows lot-to-lot consistency.
MATERIALS AND METHODS
Materials
Streptavidin (SA 10) was obtained from Prozyme (San Leandro, CA) and used without further purification. An additional sample of SA was purchased from Gibco-BRL, Life Technologies (Gaithersburg, MD). The results of this work are based solely on analysis of Prozyme SA. The Prozyme SA was chosen due to the high degree of homogeneity, whereas the Gibco brand SA shows the presence of multiple tetrameric forms and higher aggregates (data provided as Supplementary Material). Stock solutions (1–8 mg/mL) of protein were prepared in 10 mM triethanolamine (TEA) at a pH = 7.3. Type I, 18 MΩ water was used for preparation of all solutions.
A 10% (350 mM) solution of sodium dodecylsulfate in water (microselect grade) was obtained from Fluka (Buchs, Switzerland). 2-(4′-Hydroxyazobenzene)benzoic acid (Sigma, St Louis, MO), (+)-biotin Fluka, and a 0.2 M sodium phosphate buffer at pH = 7, were used to prepare reagents for the dye binding activity assay modified from that of Green (1970; Prozyme, 2002).
Differential scanning calorimetry
Differential scanning calorimetry was performed using a Calorimetry Sciences Corporation (CSC, American Fork, UT) multicell (MC)-DSC instrument with three reusable Hastalloy sample ampoules and a reference ampoule. Data was obtained typically over a range of 15–110°C at 1°C/min. Samples were degassed using an oil-free mechanical pump before loading into the sealed ampoules. A reference scan was performed using a blank containing all reagents except SA. The sample data were then obtained using SA concentrations ranging from 0.25 to 6 mg/mL. The mass of solution in each ampoule was matched to within 0.5 mg for each run. The CpCalc 2.1 software package from CSC was used to convert the raw data into heat capacity. Data were then imported into Origin 6.0 (Microcal, Northampton, MA) for baseline subtraction and fitting.
Fluorescence spectroscopy
A Photon Technology International (PTI, Lawrenceville, NJ) QuantaMaster Dual-Emission Spectrofluorimeter with a thermostatted single sample cell was used for all fluorescence analysis. Temperature was controlled using a Lauda RE106 recirculating water bath (Lavda, Lavda-Königshofen, Germany). Data were obtained using 280 nm excitation and 335-, 350-nm emission wavelengths. Excitation illumination was provided by a xenon arc lamp with ∼73–74 W output power. Bandpasses were 1.5 and 8 nm for excitation and emission, respectively. Photomultiplier tube (PMT) voltages were 970 V for channel A (335 nm) and 1000 V for channel B (350 nm). Emission data were collected as a function of time, with 1 s per point signal averaging. Buffer solutions were preequilibrated at a given temperature for minimum of 10 min, followed by injection of protein solution to give a protein concentration of ∼285 nM. Throughout each experiment, the samples were under constant stirring by magnetic stirrer.
UV-visible spectroscopy
UV-visible spectroscopy used a Hewlett-Packard (Palo Alto, CA) 8453 diode array spectrophotometer and a 1-mL quartz microcuvette. SA solution concentration was determined using A280 with  (Suter et al., 1988).
Polyacrylamide gel electrophoresis
Gels used either a mini-Protean 2 or 3 gel rig (Bio-Rad Laboratories, Hercules, CA). A quantity of 1.0–1.5-mm thick, 10–12% gels were prepared using the basic procedure outlined in the mini-Protean instructions. SDS-PAGE was done incorporating 1% (35 mM) SDS into the gel matrix and running buffer, whereas native PAGE was done in the absence of SDS. Benchmark prestained protein ladder (Invitrogen, Carlsbad, CA) samples served as the molecular weight markers for each gel. Gels were run in constant current mode, generally 20 mA. When finished, gels were rinsed in deionized (DI) water, stained using GelCode Blue stain solution (Pierce, Rockford, IL), and then destained with deionized water. Documentation and quantitation were performed by epiillumination of the stained gels using a UVP GDS-8000 cooled charge-coupled device camera with LabWorks software (UVP, Upland, CA). Gels were also dried in a typical commercial gel dryer for long-term data archives.
RESULTS
Polyacrylamide gel electrophoresis
Both the Gibco and Prozyme preparations show major bands consistent with the tetrameric state (provided as Supplementary Material). The Prozyme brand, however, shows essentially one band (∼95%), which is significantly tighter than the major band in the Gibco preparation. One additional band is observed at an apparent molecular mass of ∼40 kDa. This may be a small amount of dimeric SA that runs anomalously slow (potentially due to hydrodynamic friction caused by the less spherical shape of the dimer). Consistent with the observations of various commercial SA preparations by Bayer et al. (1989), it is assumed that the major band in each case is tetrameric core-SA. For clarity throughout the Results and Discussion, the term oligomer will be used to refer to defined subunit association states of the type: monomer, dimer, tetramer, etc., whereas aggregate will be used to describe disordered, high molecular mass protein assemblies.
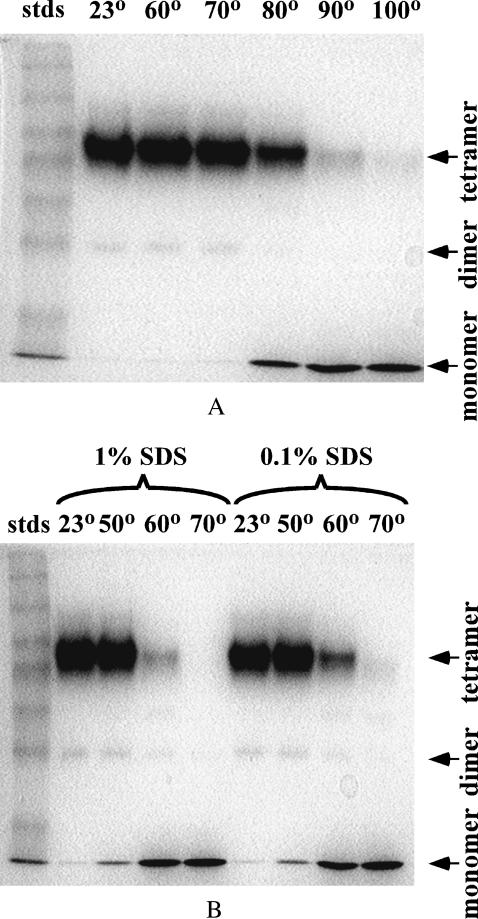
The temperature dependence of apparent SA oligomerization was first studied by SDS-PAGE. Shown in Fig. 1 A are data obtained by treating 1-mg/mL SA solutions at temperatures of 60, 70, 80, 90, 100°C for 3 min then cooling to room temperature by rapid immersion in room temperature water. A room temperature (∼20°C) sample was used as the control sample for predominantly tetrameric SA. After treatment, the samples were added to SDS-containing PAGE sample buffer and immediately loaded onto the gel. Up to a temperature of 70°C, the oligomerization state appears predominantly tetrameric, with a small amount of dimer observed. Above 70°C, the dimer band was not detected, and the tetramer band became weaker with increasing temperature. At 100°C, there is essentially complete conversion to monomeric SA. In this gel, ∼3.3 μg SA was loaded in each lane. With higher loading levels, decreased resolution of the tetramer band was observed, but a small amount of monomer was observed for untreated SA. This could be due to either weaker Coomassie dye binding to monomer or a loss of overall soluble protein.
FIGURE 1.
SDS-PAGE gels examining the effect of temperature and SDS on apparent oligomerization state of SA. (A) SA treated 3 min at indicated temperatures (°C). (B) Lanes 1–4, SA in 1% SDS; lanes 5–8, SA with 0.1% SDS at indicated temperatures (°C), respectively.
The data in Fig. 1 B examine the effect of SDS on the temperature induced changes in quaternary structure. Lanes 1–4 illustrate the effect of temperature on solutions containing 1 mg/mL SA and 1% (35 mM) SDS, for temperatures of 20, 50, 60, 70°C, respectively. Lanes 5–8 repeat this temperature series using a 1 mg/mL SA solution containing only 0.1% (3.5 mM) SDS. SA treated at 70°C for 3 min exhibits essentially no dimer bands for either 0.1 or 1.0% SDS. These same samples exhibit ∼30% tetramer. The only difference apparent for 1.0 vs. 0.1% SDS is a lower tetramer/monomer midpoint temperature. In 1% (35 mM) SDS, there were no significant differences in our results from those of Bayer et al. (1996), who examined SA in 9.0% (315 mM) SDS treated at 25 and 100°C, so higher concentrations were not investigated. We briefly examined lower concentrations of SDS by PAGE. We saw no substantial difference in behavior between SA and SA treated with 0.01% (0.35 mM) (data not shown). Electrophoretic behavior began to change at 0.06–0.08% (2.1–2.8 mM) SDS (data not shown). The selection of 0.1% (3.5 mM) SDS was chosen to be consistent with standard PAGE protocols that use this concentration of SDS in the gel matrix and sample buffer.
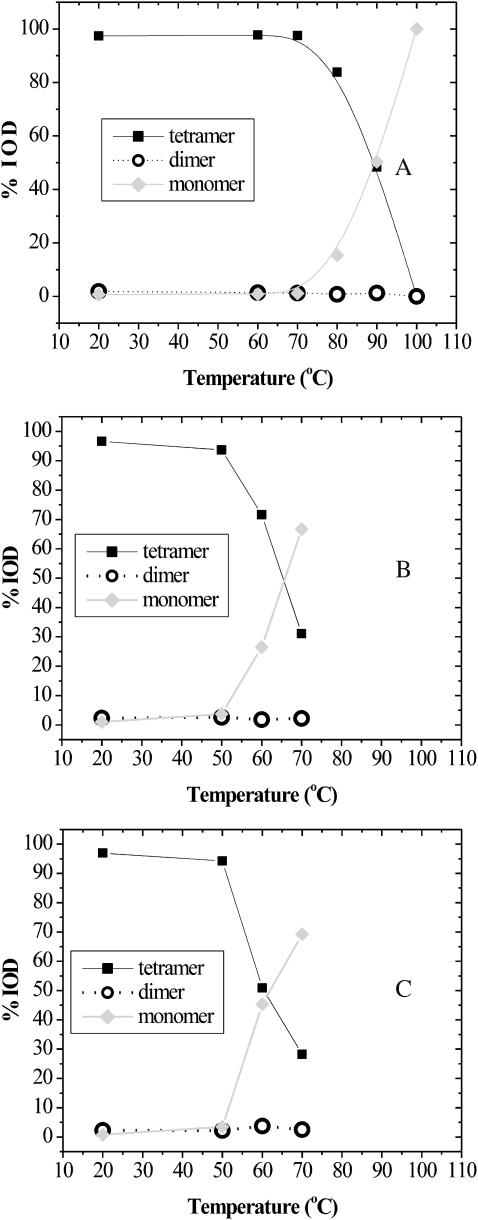
Fig. 2 presents a quantitative analysis of the data presented in Fig. 1. This analysis was done using the 1-D lane analysis function in the LabWorks software package to calculate the integrated optical density of each band in each lane. Fig. 2 A indicates that the midpoint for tetramer to monomer occurs at nearly 90°C, which is significantly above the 75°C Tm reported in the literature (Gonzalez et al., 1997, 1999). An explanation for this difference will be addressed in the Discussion section. The midpoint observed in 0.1% (3.5 mM) SDS (Fig. 2 C) and 1% (35 mM) SDS appears to be ∼65 and 61°C, respectively. Regardless of temperature or SDS concentration, very little dimer is present.
FIGURE 2.
Quantitative analysis of apparent oligomerization as a function of temperature, with and without SDS. (A) 1 mg/mL SA, (B) SA with 0.1% SDS, and (C) SA with 1.0% SDS. Integrated optical densities were obtained from gels shown in Fig. 1.
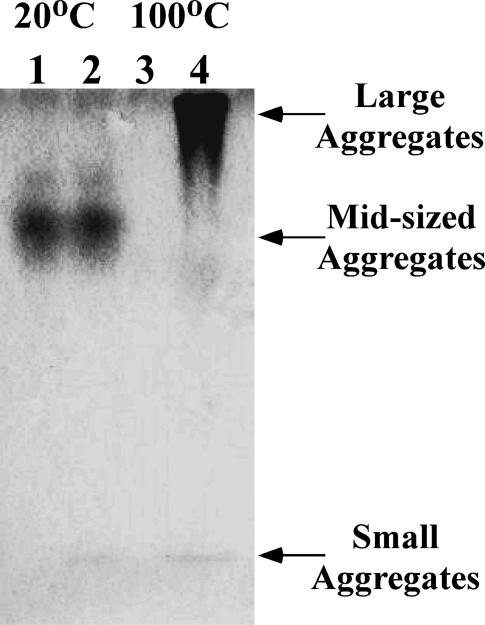
The thermal behavior of SA was also examined by native PAGE. The analysis of these data is complicated by the fact that separation occurs based on size, shape, and charge; thus bands will be discussed in terms of their mobilities and by comparison to similar samples run on SDS-PAGE, where separation is primarily related to molar mass. The data in Fig. 3 show that, at 20°C, SA in 1% (35 mM) SDS (lane 2) has the same mobility as native SA (lane 1). When a 1-mg/mL SA sample is treated at 100°C for 3 min (Fig. 3, lane 3) no bands appear on the gel. In the presence of 1% (35 mM) SDS, however, a slow migrating band showing significant tailing on the faster mobility side is observed. This may be indicative of a large complex or aggregate that may dissociate in SDS-PAGE, but not native PAGE. To further examine this effect, experiments were performed at intermediate temperatures (shown in Fig. 4).
FIGURE 3.
Native-PAGE gel illustrating effect of SDS on SA. Lanes 1 and 3 are SA alone, whereas lanes 2 and 4 are SA in 1% SDS.
FIGURE 4.
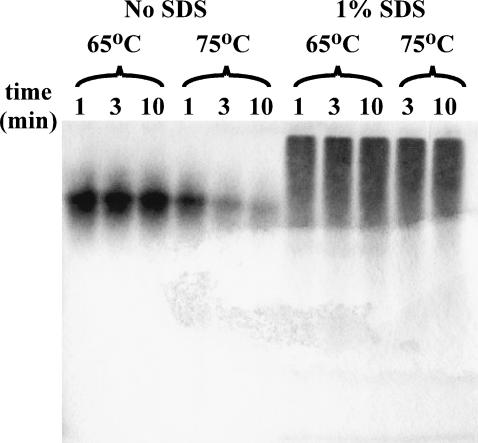
Native-PAGE gel examining the effect of temperature (65 and 75°C) and SDS on SA.
In Fig. 4 the behavior of SA on native PAGE at 65 and 75°C, in the presence and absence of 1% (35 mM) SDS, is shown. The data show that the major band observed for SA at 65 and 75°C is of similar mobility to untreated native SA. The 75°C data, however, show a significant reduction in band intensity as the time of treatment is increased from 1 to 10 min. Correspondingly, samples in the DSC ampoules were observed to be turbid after completion of a complete thermal cycle, indicating significant aggregation. Bayer et al. (1989) have shown that SA can form higher-order oligomers, though only relatively small amounts at room temperature. Aggregation of SA was further examined using UV-visible spectroscopy and will be described later in the Results. The decrease in band intensity with heat treatment is consistent with the formation of aggregates that are too large to enter the stacking gel. When treated at these same temperatures in 1% (35 mM) SDS, a very broad, slow moving band with significant tailing is observed. Although slow moving species are observed, they are small enough to get into the stacking and resolving gel. Since migration of proteins in native PAGE is a function of size, shape, and charge, the slowly migrating species likely represent large aggregates, due to the observation that SA treated with SDS at room temperature migrates even faster toward the positive pole. We hypothesize that the ill-defined bands that appear for SA treated with SDS can be explained primarily by diffusion of some weakly bound SDS from the SDS-SA complex during the electrophoresis process. The shedding of SDS from the complex apparently leads to further aggregation of SA and/or a less negatively charged complex with a slower mobility. It is also possible that electrophoretic differences between weakly bound SDS and SA might further contribute to this shedding of detergent. Despite showing species of relatively low mobility, the samples treated in the presence of SDS do not show a significant decrease in total band intensity upon heat treatment. It would appear that SDS somehow inhibits the formation of precipitable aggregates seen in SA that is heat treated in the absence of SDS.
Comparing Figs. 3 and 4 with Fig. 1, the reader may note that SDS-PAGE gels of SA treated in the presence or absence of SDS show similar band broadening and equivalent mobilities, whereas the same samples run on native PAGE show significant difference in their behavior. An explanation for this behavior will be elaborated further in the Discussion section.
Differential scanning calorimetry
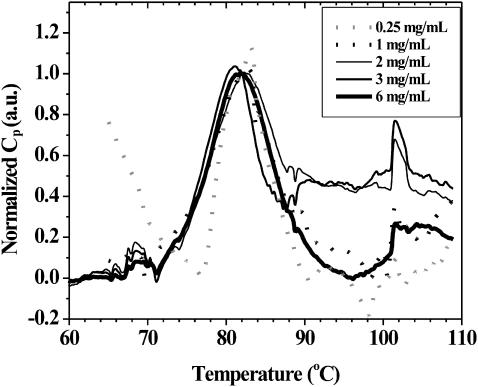
Fig. 5 presents DSC thermograms collected for SA solutions of varying concentration. The data were normalized to have a heat capacity of 1 at a temperature of 82°C. If Tm is taken to be the temperature at which Cp is maximized (Sturtevant, 1987), then the Tm = 82.3 ± 0.8°C for the data in Fig. 5, regardless of concentration. Some of the variability in the apparent Tm is probably due to the manual removal of baselines, whereas variation at the lower concentrations is also due to the signal/noise ratio of the data.
FIGURE 5.
DSC of SA as a function of concentration. Data were obtained at 1°C/min for samples between 0.25- and 6-mg/mL concentrations.
Apparent in Fig. 5 is the presence of a low ΔH transition at 69°C, the dominant transition centered at 82°C, and a second low energy transition occurring around 102°C. After the experiment was finished, the ampoules were opened for cleaning and significant precipitation was observed.
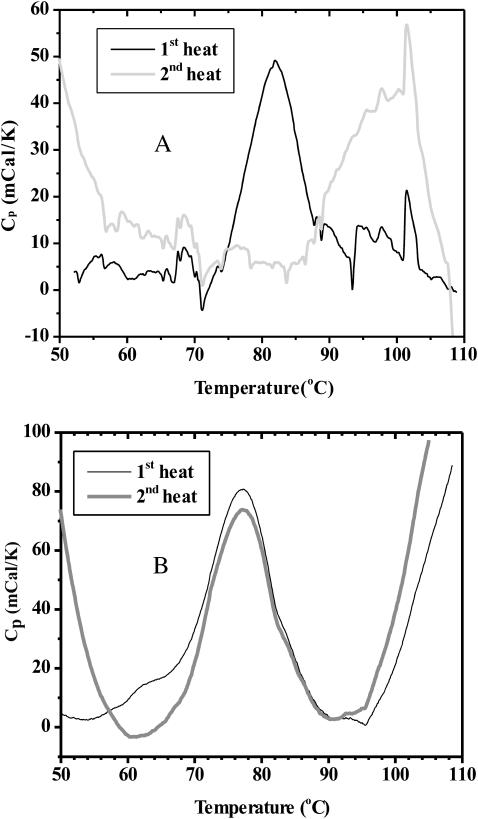
The extent of reversibility of the calorimetric transitions of SA was then examined. Fig. 6 A clearly shows that the major calorimetric transition of SA upon heating is not reversible. On the other hand, the smaller transitions at 69 and 102°C occur again during the second heat cycle. Furthermore, upon reheating there appear to be other high temperature transitions occurring, in addition to the narrow transition around 102°C. Once precipitation occurs, the small transitions at 69 and 102°C are still observed, but the major melting event is not. The reversibility of the very small transition at 69°C could be attributed to a minor structural rearrangement within one subunit. This subunit might be either a native monomer, a subunit of a tetramer, or a nonnative monomer, which would explain why it is reversible. The signal observed around 102°C could be a transition within the larger aggregates observed at elevated temperatures in the absence of SDS (see Bayer et al., 1989; Figs. 3 and 4; and UV-Visible Spectroscopy: Aggregation and Activity section below).
FIGURE 6.
DSC thermograms for (A) 2 mg/mL SA and (B) 1 mg/mL SA in 1% SDS collected over two consecutive heating cycles.
When SA is examined by DSC in the presence of 1% (35 mM) SDS, a Tm of 77°C is observed, as compared to 82°C in the absence of SDS. There is also a small transition at ∼63°C, similar to the 69°C transition observed in the absence of SDS. The sample is then cooled at a rate of 1°C/min (to 25°C in this case), followed by another heat cycle. The more interesting result shown in Fig. 6 B is that upon reheating the major transition at 77°C occurs again, with nearly the same enthalpy change. This shows that the major thermal transition of SA occurs irreversibly, but in the presence of 1% (35 mM) SDS the transition occurs in a reversible way. This reversibility is also observed for SA in 0.5% (17.5 mM) SDS (data not shown). On the other hand, the minor transition that precedes this is reversible in the absence of SDS, but not when it is present. After these samples were examined in the DSC, no precipitation was apparent by visual inspection. The prevention of aggregation and induction of reversibility to the thermal transition of a protein has a precedent in the literature. Blaber et al. (1999) have shown that guanidine hydrochloride prevents aggregation and leads to thermal reversibility for the monomeric human fibroblast growth factor (FGF)-1.
Steady-state fluorescence
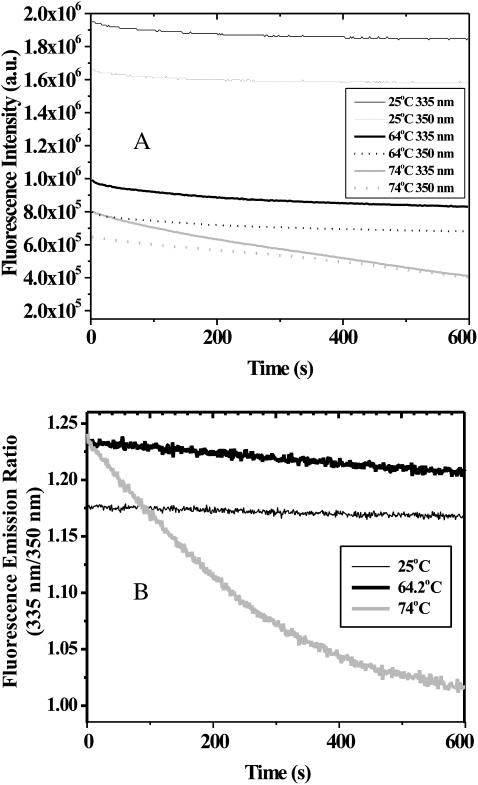
To complement the DSC and PAGE results, the time dependence of intrinsic fluorescence emission at different temperatures in the absence and presence of SDS was examined. This allows for the observation of microstructural changes that may precede or coincide with the transitions observed in the techniques previously described, as well as the precipitation studies described below. In these experiments, the possibility of SA adhesion to the quartz cuvette was a possible concern. By monitoring the fluorescence as a function of concentration, a plot of fluorescence emission versus concentration was constructed. This yielded a linear response with a y intercept of zero, indicative of completely soluble SA (data not shown). Since the samples were illuminated for extended periods of time (>10 min), photobleaching was another potential concern. Fig. 7 A shows that at room temperature, in the absence of SDS where no structural rearrangements have ever been reported, there is a small and reproducible loss of fluorescence emission intensity at both 335 and 350 nm. This signal loss is interpreted to be the background rate of photobleaching. The fluorescence signal, however, was observed to recover after allowing the sample to sit in the dark, indicating reversible photobleaching. Therefore, fluorescence intensity changes as a function of time under different conditions were compared relative to this background. It may also be noted in Fig. 7 A that at 25°C the intensity of both the 335 nm emission as well as the 350 nm emission change with almost perfect synchrony. This provides extra evidence that the effect is photobleaching and not structural rearrangement.
FIGURE 7.
(A) Intrinsic fluorescence emission at 335 and 350 nm and (B) 335:350-nm fluorescence emission ratio of SA from 25 to 74°C.
Fig. 7 A also shows that, at higher temperatures, the emission intensity at 335 nm decreases more rapidly than the intensity of the 350 nm emission. At room temperature, SA exhibits an emission maximum of 335 nm with no apparent shoulder at 350 nm, consistent with the known structural features of SA where all of the tryptophan residues are buried (Weber et al., 1987, 1989). Therefore, the more rapid decrease in the 335 nm emission indicates a red shift in the emission maximum, consistent with exposure of tryptophan residues to aqueous solvent. This red shifting of the tryptophan emission is not quite apparent in the dual wavelength emission data, especially at 64.2°C. However, if one plots the ratio of emission at 335 nm to that at 350 nm as a function of time, one sees a marked difference at elevated temperatures (Fig. 7 B). Therefore, we take this ratio to indicate the relative degree of tryptophan solvent exposure. This effect is so pronounced at 74°C that by 10 min the ratio is nearly 1:1. The data at 74°C were collected for longer times, and the intensity at both wavelengths continued to decrease substantially (see below). This is taken as a further indication of SA precipitation in the absence of SDS. The slopes of the initial linear range (first 3–7 min, shown in Fig. 7 B) are taken to reflect the rate of the transition. Data were collected at several temperatures, though only three temperatures are shown for clarity.
Intrinsic fluorescence data obtained for SA in 1% (35 mM) SDS shows that, at higher temperatures, the time dependence of fluorescence emission decay increases but only slightly when compared to the data presented in Fig. 7 A (data provided as Supplementary Material). Again, the changes are not quite apparent to the naked eye, even at 74°C. However, if one measures the rate of red shifting of the tryptophan emission by plotting the ratio of emission at 335:350 nm as a function of time, a slightly sharper time dependence of the 335:350-nm ratio at elevated temperatures is seen (data not shown). The very small decrease of this ratio as a function of time at higher temperatures indicates substantially less red shift of the emission peak. This could be reconciled as SDS-bound, solvent-exposed tryptophans that provide a partially compensating hydrophobic environment similar to that found in the hydrophobic core of native SA. Again, the slope of the initial line observed for the 335:350-nm ratio as a function of time is taken to reflect the rate of the transition.
The effect of an intermediate SDS concentration (3.5 mM, 0.1%) on the time dependence of SA fluorescence was also studied by fluorescence spectroscopy. Results were obtained at three different temperatures (data provided as Supplementary Material). As expected, the 0.1% (3.5 mM) SDS results are intermediate between the no SDS and 1% (35 mM) SDS cases. The most interesting variation occurred at ∼64.2°C where both 335 and 350 nm emissions appeared to be almost time independent.
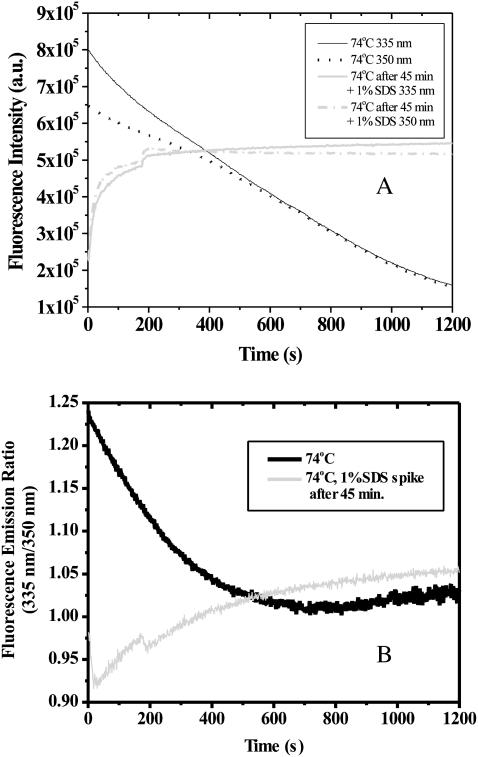
The data provided thus far indicate an apparent precipitation of SA in the absence of SDS. To further examine the role of SDS, a sample of SA was treated at 74°C for 45 min while monitoring the 335 and 350 nm fluorescence emission. After 45 min, SDS was added to the sample to bring it to 1% (35 mM) detergent. Results of that experiment are shown in Fig. 8. The fluorescence intensity increased immediately. Furthermore, the 335:350-nm emission ratio rose above one. Taken together, these observations lead to the conclusion that the SDS caused the SA aggregates to resolubilize and that the newly SDS-bound SA monomers and/or small aggregates exhibit fluorescence properties similar to native, buried, tryptophan residues.
FIGURE 8.
(A) Intrinsic fluorescence at 335 and 350 nm and (B) 335:350-nm fluorescence emission ratio of SA held at 74°C for 45 min, followed by addition of SDS to rapidly bring the solution to 1% SDS.
Since the DSC results indicated a reversible process occurring at ∼77°C in the presence of SDS, fluorescence spectroscopy was applied to samples of SA treated with 1% (35 mM) SDS at elevated temperature and then cooled to room temperature. To accomplish this, a 10-min fluorescence emission trace was collected at 74°C, after which the sample was cooled to room temperature and held for 2 h (approximately equal to the time lag between the heat traces shown in Fig. 6 B). The sample was then reequilibrated to 74°C for 10 min, and another fluorescence trace was collected. Although bubble formation became a difficult issue, the fluorescence emission intensity was almost completely regained, and the time dependence of the fluorescence intensity was similar to that of the first fluorescence emission trace (data not shown). This provides additional evidence for the reversible transition in 1% (35 mM) SDS centered within the 70–80°C range.
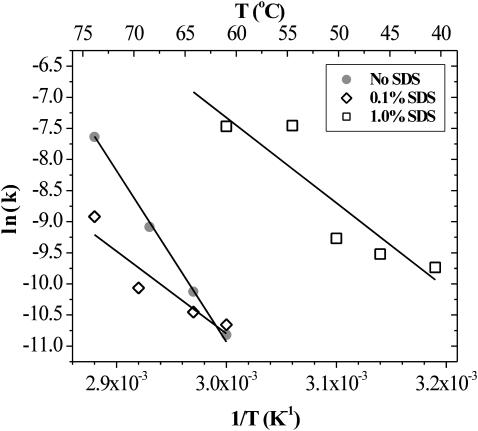
The temperature dependence of the initial slopes from the 335:350-nm emission ratio versus time plots was measured at different SDS concentrations. The slopes of those plots were taken to be quasi-first-order rate constants (k) for the unfolding process. Arrhenius plots of these data yielded straight lines whose slopes were indicative of the activation energy (Ea) of unfolding. Fig. 9 shows the results of this analysis. The observed Ea values are given in Table 1. Clearly the magnitude of Ea decreases upon the addition of SDS. The difference in activation energy between the 0 and 1.0% (35 mM) SDS case (120 ± 40 kJ/mol) is taken to be the effect of SDS on the unfolding transition. These values are consistent with the known high thermal stability of SA. In comparison to typical unfolding activation energies reported in the recent literature, the 229 ± 16 kJ/mol observed for SA is relatively average (Arnould et al., 1998; Baier and McClements, 2001; Banerjee and Kishore, 2004; Baptista et al., 2000; Bell et al., 1995; Das et al., 1998; Fang et al., 2003; Kar et al., 2002; Kaushik et al., 2002; Kidric et al., 2002; Mehta et al., 2003a,b; Shin et al., 1998). This survey of literature values finds that native proteins generally exhibit activation energies of unfolding in the range of 100–500 kJ/mol.
FIGURE 9.
Arrhenius plot for SA structural changes, as indicated by 335:350-nm fluorescence emission ratio, obtained for SA, and SA in the presence of 0.1 and 1.0% SDS.
TABLE 1.
Apparent activation energy of unfolding for SA as a function of SDS concentration
| SDS concentration (mM) | Observed Ea (kJ/mol) |
|---|---|
| 0.0 | 229 ± 16 |
| 3.5 | 110 ± 34 |
| 35 | 110 ± 32 |
The indicated uncertainties are based on the SE of the slope of the linear regression analysis of Arrhenius plot data.
Otzen examined the effect of SDS concentration on the unfolding of the 101-residue S6 protein (Otzen, 2002). In that work, the apparent activation energy lowering for 1% (35 mM) SDS versus no SDS is ∼50 kJ/mol. However, although the difference in activation energy in this work is more than twice as large, the magnitude of the activation energy for SA is also higher by more than a factor of two.
UV-visible spectroscopy: aggregation and activity
The aggregation of SA was further explored by treating samples at different temperatures for varying amounts of time, centrifuging at 12,000 × g for 5 min to pellet out any precipitate, then examining the SA concentration in the supernatant via measurement of A280. Initially samples were examined after collection of DSC data. The scan program for these trials was two complete heat-cool cycles from 25 to 110°C at 1°C/min. Examination of DSC treated samples showed that there was 81 ± 6% aggregation of SA in the absence of SDS, whereas there was 38 ± 19% aggregation in the presence of 1% (35 mM) SDS.
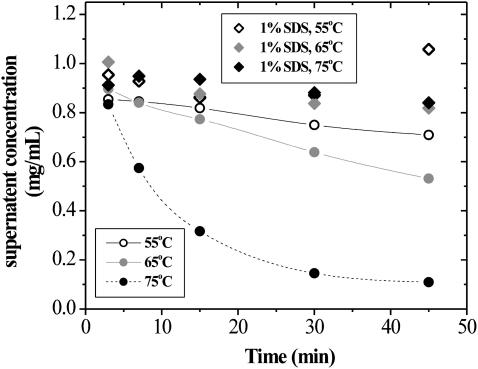
The fluorescence data (Figs. 7 and 8) clearly show that structural changes are occurring at temperatures well below the observed Tm of 77 and 82°C for SA in the presence and absence of 1% (35 mM) SDS, respectively. This prompted the study of aggregation at temperatures between 55 and 75°C and as a function of treatment time. These data are presented in Fig. 10. The concentration of soluble SA in 1% (35 mM) SDS drops very gradually as treatment time increases to 45 min. The data obtained for solutions containing no SDS clearly show that significant precipitation is occurring even at temperatures of 55°C. At 55 and 65°C, concentration as a function of time is essentially linear (r2 = 0.991 and 0.994, respectively). The apparent rate is clearly seen to increase, more than doubling with this 10°C increase in temperature. At 75°C, the data show an exponential decrease in soluble protein concentration with time. The steady state is reached when 80% of the SA has precipitated. This significant change in behavior occurring between 65 and 75°C corresponds to the behavior seen by fluorescence, where a significant change is also observed. The DSC data (Figs. 5 and 6 A) show a small transition occurring at ∼69°C, which may indicate a necessary structural change that precedes the aggregation. One explanation for the aggregation behavior is that at lower temperature the rate-limiting step is a structural change in SA, whereas at higher temperatures the rate is limited by collisions of SA molecules and aggregates to form larger aggregates. This would make sense if, at higher temperatures, the activation barrier for this initial preaggregation structural change is low relative to the Boltzmann factor.
FIGURE 10.
Effect of temperature and time on concentration of soluble protein for SA and SA in 1% SDS.
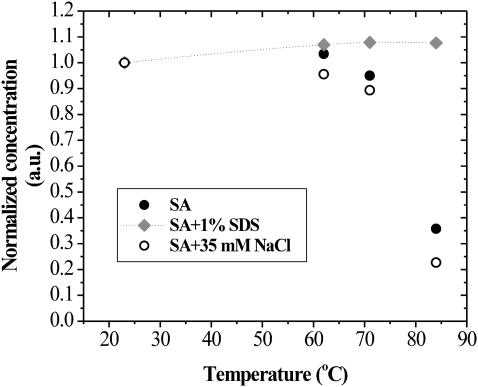
In Fig. 11, the effect of temperature on the apparent solution concentration of SA is presented. Concentration is based on the measurement of A280, with an extinction coefficient of 3.2 mL mg−1 cm−1. This data was collected to examine whether the effect of SDS seen in Fig. 10 could be partially explained by the ionic strength of the solution. In these experiments, all samples were treated for 3 min at the indicated temperature and then brought back to room temperature by holding the ∼1-mL samples under tap water for 30 s. A total of 35 mM NaCl was used to be isotonic to the 1% w/v (35 mM) SDS. The data show that the presence of sodium chloride only enhances the precipitation of SA. This shows that the role of SDS in preventing aggregation is not based on a simple salt or ionic strength effect. Although the observed concentration of SA in 1% (35 mM) SDS appears to increase by ∼8%, it is thought to be due to experimental uncertainties and/or alteration of the extinction coefficient at 280 nm due to the binding of SDS. By 84°C, however, there is a 64% decrease in concentration of SA in 10 mM TEA and a 77% decrease in the presence of 35 mM NaCl.
FIGURE 11.
Concentration of soluble SA as a function of temperature for solutions containing 1% SDS or 35 mM NaCl. All treatments were for 3 min. The spline curve through the 1% SDS data is merely to guide the eye.
Although this work and that of Bayer et al. (1996) has shown that SA maintains its tetrameric state even in 1–9% (35–315 mM) SDS at room temperature, the activity of the protein has not been examined. Though careful studies have not been done to examine how SDS or other denaturants may interfere with the competitive dye binding assay (Green, 1970; Prozyme, 2002), a HABA competitive binding assay shows that there is greater than 75% retention of measured activity with SA in 1% (35 mM) SDS (data provided as Supplementary Material). It is possible that the SDS may also partially compete for binding sites with the HABA, though perhaps not with the strong, more specific binding of biotin. If this is the case, then the measured activity is probably lower than the actual activity. What these data show is that at room temperature there is conservation of both the quaternary structure and biotin binding ability of SA in the presence of SDS commonly used in SDS-PAGE applications.
Density gradient ultracentrifugation
To corroborate the data presented (i.e., aggregation, activity, PAGE, and fluorescence studies), density gradient ultracentrifugation was applied to SA samples treated at different temperatures in the absence and presence of SDS (data not shown). This technique gives excellent hydrodynamic information regarding the aggregation state in the absence of electrophoretic effects. When SA was examined at room temperature, primarily tetrameric SA was observed, whether or not SDS was present at the 1% (35 mM) level. When SA was treated at 57°C in the absence of SDS for 3 min, there was a redistribution of almost half of the SA from tetrameric to monomeric forms. When SA was heated to 80°C in the absence of SDS for 3 min, a measurable amount of very large aggregates were present at the bottom of the gradient, indicating that significant precipitation had occurred. When a sample treated similarly was subsequently treated with 1% (35 mM) SDS for an additional 3 min at 80°C, all the apparent precipitate disappeared, and the smaller species behaved almost entirely as monomers. Also, SA boiled in the presence of (1%) SDS for 3 min exhibited hydrodynamic properties consistent with monomer formation. Thus, the ultracentrifugation sedimentation equilibrium studies agree well with the aggregation, PAGE, and fluorescence studies presented in this work.
DISCUSSION
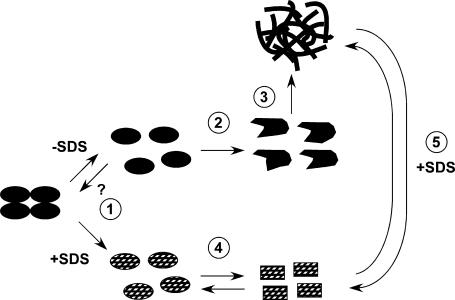
The data presented have led to the development of a model to describe the structural effects of thermal treatment on SA in the presence and absence of SDS. A schematic version of this model is presented in Fig. 12. This pathway has similarities to one presented by Sacchettini and Kelly (2002) for transthyretin amyloid fibril formation. This section will focus on establishing the connection of the data to steps in the proposed pathway.
FIGURE 12.
Schematic representation of postulated model for SA thermal behavior.
Step 1 is posited to be the dissociation of the native tetramer to essentially native monomers. Though dimer is also a possible intermediate, this is omitted from this model pathway. Although the PAGE data presented showed its presence in small quantities (see Figs. 1 and 2 and Supplementary Material), the quantity of dimer was quite low (1.9 ± 0.9%) regardless of the temperature or presence of SDS. Although it is possible that step 1 is reversible, no evidence to support or refute this has been presented. Step 2 describes an unfolding of monomer to a nonnative state. Support for the proposal of steps 1 and 2 comes primarily from the DSC data. Specifically, since there is no concentration dependence of Tm (see Fig. 5), either the SA has already dissociated into monomers or the thermodynamically observed transition involves no dissociation or association (Sturtevant, 1987). Clearly, however, the temperature-dependent PAGE results (see Figs. 1 and 2) show that the tetramer does dissociate primarily into monomer units. For these reasons, step 1 has been posited, though it appears to occur without a significant enthalpic change. It is possible that the small DSC transition observed at 69°C might be attributed to step 1 (see Figs. 5 and 6). Alternatively, it is possible that step 1 might involve merely a structural rearrangement of an intact tetramer, occurring before the major unfolding step. Finishing out the pathway for SA in the absence of SDS, step 3 is proposed to involve the association of SA into large, precipitable aggregates. This occurs readily in the absence of SDS, as illustrated by native PAGE and aggregation studies (see Figs. 3, 4, 10, and 11). The small DSC peaks observed near ∼110°C for SA are consistent with transitions within these larger aggregates (see Figs. 5 and 6)
Although there are clearly significant and interesting changes in the thermal properties and behavior of SA when SDS is present at the 0.1–1.0% (3.5–35 mM) level, there are also some key similarities. Step 1 is also posited to occur in the presence of SDS, but, again, there is no evidence that this step is reversible. Although the DSC thermograms of SA in the presence of 1% (35 mM) SDS are similar in shape, there is an anticipated shift to lower temperature due to the normal destabilizing effects of a denaturant, like SDS (see Fig. 6). Besides the previously reported lowering of the SA Tm by SDS (Bayer et al., 1996; Gonzalez et al., 1999), this work has shown the major enthalpically active transition to be reversible (Fig. 3). This result was quite unexpected, since SDS is usually used as a strongly binding denaturant. Unlike urea, which is sometimes used to unfold a protein, which is later refolded by dialysis or dilution, SDS is often used to irreversibly unfold proteins (Pierce Biotechnology, 2004). There is precedent, however, for removal of SDS from some proteins by dialysis (Bozzi et al., 2001) or via complexation of SDS by α-cyclodextrins (Otzen and Oliveberg, 2001; Rozema and Gellman, 1996a,b). Step 4 is proposed to describe the reversible behavior observed in this work. This step is proposed to involve a transition between two nonnative monomeric states. Both of these unfolded monomeric states are thought to be similar enough in geometry so that there is no apparent change in the electrophoretic mobility of these distinct states. Another possibility is that upon cooling to room temperature (where the electrophoresis was carried out), there may be reequilibration to the preferred structure found at lower temperatures.
The presence of SDS may make the kinds of structural transitions seen in steps 1 and 2 happen much more readily, perhaps even concertedly and with a relatively small enthalpy change. We believe that the prevention of aggregation is due to the saturation of outer surface binding sites of the SA by SDS, which precludes the contact and binding of these SA subunits. Examination of the SA structure shows that there are a number of hydrophobic residues lining the biotin binding site, as well as the dimer-dimer interface. The unfolding of outer surface flexible loops or dissociation of the tetramer into dimers would expose some hydrophobic residues to solvent. Since the dimer-dimer interface is predominantly held together by hydrophobic interactions, dissociation of the tetramer would lead to exposure of hydrophobic residues that could interact with SDS. At the 1% w/v (35 mM) level, there are 462 SDS molecules per SA monomer or more than three SDS molecules per residue.
At 25°C, the critical micelle concentration (cmc) of SDS is 0.2% (7 mM) in water (Otzen, 2002; Pierce Biotechnology, 2004). The cmc decreases with increasing salt concentration, 3.5 mM (0.1%) in 10 mM NaCl and 1.4 mM (0.04%) in 100 mM NaCl (Pierce Biotechnology, 2004). In this work, 10 mM TEA buffer was added to lyophilized protein containing a small amount of NaCl (10% by mass according to the supplier), and thus 0.1% (3.5 mM) and 1.0% (35 mM) SDS correspond to values near the cmc and well above it, respectively. We do not believe, however, that the SA is merely encapsulated by SDS micelles for two reasons. One point is that, at the elevated temperatures required to unfold or dissociate SA, these micelles could be disrupted to bind the SA more readily than near room temperature. Additionally, similar behavior was observed for SA on SDS-PAGE using 0.1% (3.5 mM) SDS, which is below the cmc.
The role of SDS appears to be twofold. As a denaturant, it acts to lower the activation barrier for steps 1 and 2, thereby offering a new unfolding pathway. This alternate unfolding pathway occurs at a reduced Tm but is reversible. The other role is to act as a cosolvent that solvates the monomeric subunits and shields them from interactions that would otherwise lead to aggregate formation. This prevention of aggregation is a likely explanation why the major unfolding transition is found to be reversible.
Finally a fifth step in the pathway is offered to explain observations made by fluorescence (see Fig. 8) and density gradient ultracentrifugation studies (data not shown). In these experiments, a significant quantity of aggregated SA was resolubilized upon addition of SDS after initial heat treatment in the absence of SDS. This indicates that the activation barrier to disassembly of the aggregates is sufficiently low such that SDS can bind to, and saturate, the newly liberated monomers. Pathway 5 is apparently reversible if SDS is removed from the unfolded monomers. This is the explanation for the behavior of SA in the presence of SDS on native-PAGE gels (see Figs. 3 and 4). In those data, the observed bands had low mobility and showed substantial tailing, consistent with structural changes accompanying the electrophoresis. As previously described, it is thought that this is explained by shedding of SDS, which is driven by both diffusion and electrostatic factors.
OTHER ISSUES
Transition temperature versus Tm
Subjected to native PAGE, room temperature SA migrates as a single band consistent with the expected tetramer form (Fig. 3). Upon heating, the SA disappears from the gel indicating irreversible aggregation in the reaction tube (Fig. 4). Since all monomeric forms of SA appear the same by SDS-PAGE, the ∼90°C apparent transition temperature can be interpreted as reflecting primarily the tetramer to monomer transition. By DSC analysis, however, a Tm of 82°C is observed for native SA that is significantly higher than the 75°C observed by Gonzalez et al. (1997, 1999) but similar to the 84.2°C observed by Weber et al. (1994). The results of Gonzalez et al. were obtained by DSC performed at a similar scan rate (0.9°C/min) but examined SA obtained from Life Technologies (which purchased Gibco-BRL). As described in the Materials and Methods section, the Gibco brand SA obtained for this work exhibited significant heterogeneity, relative to the Prozyme product used in this work.
The observed difference between the transition temperature observed by SDS-PAGE and the Tm observed by DSC can be understood by noting the differences in the events measured by each technique. In the case of SDS-PAGE, the populations of various oligomeric states are monitored without any information about possible heterogeneity within a particular form. Thus, native monomer versus nonnative monomer would likely migrate at the same rate. DSC, however, examines any structural changes that result in a heat capacity change. As seen in Fig. 10, at temperatures near the Tm, SA exhibits significant precipitable aggregation in the absence of SDS but very little in the presence of 1% (35 mM) SDS. This would have a more significant effect on the SDS-PAGE results, since the precipitable aggregates would not even enter the gel matrix. So in the SDS-PAGE estimation of the transition temperature, only the soluble SA fraction that has not undergone thermally induced aggregation is examined. If the monomeric form of SA had a higher affinity to form aggregates, then its population observed in the SDS-PAGE would be diminished, leading to a higher transition temperature.
Global versus local transitions
Although electrophoresis is useful for assessing global macromolecular assembly states and calorimetry is useful for determining heats associated with structural transitions, the changes in local tryptophan environment observed by fluorescence spectroscopy may be related to small, local rearrangements and/or to larger transitions. Taken together with the electrophoresis and calorimetry data, it appears that the SA tryptophan fluorescence is perturbed both at the local and global levels. First, there are measurable fluorescence emission changes at 40°C, which is well below the Tm measured by either electrophoresis or calorimetry. This is likely due to local rearrangements. However, major changes in fluorescence intensity and peak emission wavelength occur near the Tm values measured by both electrophoresis and calorimetry. This is likely due to a larger global transition where the tryptophan residues act as a probe of those transitions.
Effect of SDS on apparent Tm
In 1% (35 mM) SDS, the SDS-PAGE transition temperature and DSC Tm values are ∼60 and 77°C, respectively. The lowering of the SDS-PAGE transition temperature relative to the Tm seems to present an apparent paradox. This behavior, however, can again be explained in terms of the features probed by each technique and SA behavior. When SDS is present during the thermal treatment step, aggregation is inhibited (see Fig. 10), thus more of the total SA protein is soluble and, therefore, examined by SDS-PAGE, as well as by DSC. The lower Tm for SA in 1% (35 mM) SDS observed by SDS-PAGE versus DSC may be explained by a tetramer to monomer transition involving little enthalpic change, followed by a conformational change in the monomer that results in a significant change in heat capacity. Upon heating SA in 1% (35 mM) SDS, the DSC data show a small transition centered at 63°C that might be the tetramer to monomer transition. This is quite close to the 61°C transition temperature determined by SDS-PAGE, consistent with this line of reasoning. This 63°C DSC transition is irreversible (Fig. 6 B), whereas the major melting transition is found to be reversible.
CONCLUSIONS
Though we believe these results to be of direct use to those using SA as a biotin anchor or studying new applications of SA, we have also found some literature that point to the potential of a broader audience for the results and the approaches of this work. Several human and animal diseases are thought to be caused by aberrant aggregation of proteins. Among these are the so-called prion diseases such as Creutzfeld-Jacob disease, bovine spongiform encephalopathy (mad cow disease), and scrapie (Aguzzi and Haass, 2003; Harper and Lansbury, 1997). The uncontrolled aggregation of β-amyloid protein is heavily implicated in neurofibrillary plaque formation in Alzheimer's disease (Harper and Lansbury, 1997). Others are related to CAG expansions in the genomic DNA that lead to polyglutamine insertions into different proteins. Among these is Huntington's disease, which is caused by polyglutamine insertion into the Huntingtin protein. Polyglutamine insertions occur in spinocerebelar ataxias such as SCA1, SCA2, SCA3/Machado-Joseph disease (MJD), SCA6, and SCA7. The pathogenicity of these complexes is thought to arise from recruitment of necessary cellular proteins, such as transcription factors, into the fibrillary tangle (Perez et al., 1998) or disrupting proteasome function (Bence et al., 2001). Models have been proposed to quantitatively explain the kinetics of prion aggregation phenomena (Eigen, 1996). These involve an equilibrium between at least two differently folded states. At least one of these states is referred to as comprising a preprion state (Eigen, 1996; Sacchettini and Kelly, 2002). Though not appearing to form fibrillary aggregates, the unfolding of streptavidin in the absence of SDS may follow a similar mechanism, as outlined above.
This work offers a comprehensive look at thermal stability of SA in the absence of biotin. To better understand the thermal behavior of SA, this work has brought together SDS and native PAGE, fluorescence and UV-visible spectroscopy, and DSC results. Unlike some commercially available forms of SA, which are found to be relatively inhomogeneous with respect to their primary structure, the SA used in this work was characterized and found to be quite homogeneous. The data obtained by these various techniques has led to the proposal of a new model pathway for thermal treatment of SA in the absence and presence of SDS. Additionally, there were, to our knowledge, two new findings of this work, namely, the role of SDS in the prevention of thermally induced aggregation and imparting reversibility to the major enthalpically active melting transition of SA.
SUPPLEMENTARY MATERIAL
An online supplement to this article can be found by visiting BJ Online at http://www.biophysj.org.
Supplementary Material
Acknowledgments
We thank students in the molecular methods laboratory course at John Carroll University (Josh Czerwinski, Amanda Leonberg, Roselyn Linsenmayer, Mark McDowell, Angela Orovets, and Benjamin Somerlot) for sharing their data on the gradient sedimentation equilibrium experiments. We acknowledge Zachary Coleman for technical assistance during manuscript preparation. Finally, we acknowledge Michael Zagorski for his helpful critique of our draft manuscript.
We thank the Camille and Henry Dreyfus Foundation Special Grant Program (SG-01-056) for purchase of the fluorimeter and the National Science Foundation Major Research Instrumentation Program (0116054) for purchase of the DSC used in this work. Student stipends were provided by the National Science Foundation Chemistry-Research Experience for Undergraduates program (9987897) and the John Carroll University Graduate School. The John Carroll University College of Arts and Sciences provided matching funds on the above grants and funds to purchase reagents and supplies.
References
- Aguzzi, A., and C. Haass. 2003. Games played by rogue proteins in prion disorders and Alzheimer's disease. Science. 302:814–818. [DOI] [PubMed] [Google Scholar]
- Aragana, C. E., I. D. Kuntz, S. Birchen, R. Axel, and C. R. Cantor. 1986. Molecular cloning and nucleotide sequence of the streptavidin gene. Nucleic Acids Res. 14:1871–1882. [DOI] [PMC free article] [PubMed] [Google Scholar]
- Arnould, S., M. Takahashi, and J. M. Camadro. 1998. Stability of recombinant yeast protoporphyrinogen oxidase: effects of diphenyl ether-type herbicides and diphenyleneiodonium. Biochemistry. 37:12818–12828. [DOI] [PubMed] [Google Scholar]
- Baier, S., and J. McClements. 2001. Impact of preferential interactions on thermal stability and gelation of bovine serum albumin in aqueous sucrose solutions. J. Agric. Food Chem. 49:2600–2608. [DOI] [PubMed] [Google Scholar]
- Banerjee, T., and N. Kishore. 2004. A differential scanning calorimetric study on the irreversible thermal unfolding of concanavalin A. Thermochim. Acta. 411:195–201. [Google Scholar]
- Baptista, R. P., J. M. S. Cabral, and E. P. Melo. 2000. Trehalose delays the reversible but not the irreversible thermal denaturation of cutinase. Biotechnol. Bioeng. 70:699–703. [DOI] [PubMed] [Google Scholar]
- Bayer, E. A., H. Ben-Hur, Y. Hiller, and M. Wilchek. 1989. Postsecretory modifications of streptavidin. Biochem. J. 259:369–376. [DOI] [PMC free article] [PubMed] [Google Scholar]
- Bayer, E. A., H. Ben-Hur, and M. Wilchek. 1990. Isolation and properties of streptavidin. In Methods in Enzymology, Vol. 184. M. Wilchek and E. A. Bayer, editors. Academic Press, San Diego. 80–89. [DOI] [PubMed]
- Bayer, E. A., S. Ehrlich-Rogozinski, and M. Wilchek. 1996. Sodium dodecyl sulfate-polyacrylamide gel electrophoretic method for assessing the quaternary state and comparative thermostability of avidin and streptavidin. Electrophoresis. 17:1319–1324. [DOI] [PubMed] [Google Scholar]
- Bell, L. N., M. J. Hageman, and J. M. Bauer. 1995. Impact of moisture on thermally-induced denaturation and decomposition of lyophilized bovine somatotropin. Biopolymers. 35:201–209. [DOI] [PubMed] [Google Scholar]
- Bence, N. F., R. M. Sampat, and R. R. Kopito. 2001. Impairment of the ubiquitin-proteasome system by protein aggregation. Science. 292:1467–1468. [DOI] [PubMed] [Google Scholar]
- Blaber, S. I., J. F. Culajay, A. Kuhurana, and M. Blaber. 1999. Reversible thermal denaturation of human FGF-1 induced by low concentrations of guanidine hydrochloride. Biophys. J. 77:470–477. [DOI] [PMC free article] [PubMed] [Google Scholar]
- Bozzi, M., A. Battistoni, M. Sette, S. Melino, G. Rotilio, and M. Paci. 2001. Unfolding and inactivation of monomeric superoxide dismutase from E. coli by SDS. Int. J. Biol. Macromol. 29:99–105. [DOI] [PubMed] [Google Scholar]
- Coussaert, T., A. R. Volkel, J. Noolandi, and A. P. Gast. 2001. Streptavidin tetramerization and 2D crystallization: a mean-field approach. Biophys. J. 80:2004–2010. [DOI] [PMC free article] [PubMed] [Google Scholar]
- Das, T. K., S. Mazumdar, and S. Mitra. 1998. Characterization of a partially unfolded structure of cytochrome c induced by sodium dodecyl sulphate and the kinetics of its refolding. Eur. J. Biochem. 254:662–670. [DOI] [PubMed] [Google Scholar]
- Eigen, M. 1996. Prionics or the kinetic basis of prion diseases. Biophys. Chem. 63:A1–18. [DOI] [PubMed] [Google Scholar]
- Fang, Y. L., O. Gursky, and D. Atkinson. 2003. Lipid-binding studies of human apolipoprotein A-I and its terminally truncated mutants. Biochemistry. 42:13260–13268. [DOI] [PubMed] [Google Scholar]
- Gonzalez, M., C. E. Aragana, and G. D. Fidelio. 1999. Extremely high thermal stability of streptavidin and avidin upon biotin binding. Biomol. Eng. 16:67–72. [DOI] [PubMed] [Google Scholar]
- Gonzalez, M., L. A. Bagatolli, I. Echabe, J. L. R. Arrondo, C. E. Aragana, C. R. Cantor, and G. D. Fidelio. 1997. Interaction of biotin with streptavidin thermostability and conformational changes upon binding. J. Biol. Chem. 272:11288–11294. [DOI] [PubMed] [Google Scholar]
- Green, N. M. 1970. Spectrophotometric determination of avidin and biotin. In Methods in Enzymology, Vol. 18. D. B. McCormick and L. D. Wright, editors. Academic Press, New York. 418–424.
- Green, N. M. 1990. Avidin and streptavidin. In Methods in Enzymology, Vol. 184. M. Wilchek and E. A. Bayer, editors. Academic Press, San Diego. 51–67. [DOI] [PubMed]
- Gruber, H. J., M. Marek, H. Schindler, and K. Kaiser. 1997. Biotin-fluorophore conjugates with poly(ethylene glycol) spacers retain fluorescence after binding to avidin and streptavidin. Bioconjug Chem. 8:552–559. [DOI] [PubMed] [Google Scholar]
- Harper, J. D., and P. T. Lansbury, Jr. 1997. Models of amyloid seeding in Alzheimer's disease and scrapie: mechanistic truths and physiological consequences of the time-dependent solubility of amyloid proteins. Annu. Rev. Biochem. 66:385–407. [DOI] [PubMed] [Google Scholar]
- Hsu, S. M., L. Raine, and H. Fanger. 1981. A comparative study of the peroxidase-antiperoxidase method and an avidin-biotin complex method for studying polypeptide hormones with radioimmunoassay antibodies. Am. J. Clin. Pathol. 75:734–738. [DOI] [PubMed] [Google Scholar]
- Kar, K., B. Alex, and N. Kishore. 2002. Thermodynamics of the interactions of calcium chloride with alpha-chymotrypsin. J. Chem. Thermodyn. 34:319–336. [Google Scholar]
- Katz, B. A. 1997. Binding of biotin to streptavidin stabilizes intersubunit salt bridges between Asp61 and His87 at low pH. J. Mol. Biol. 274:776–800. [DOI] [PubMed] [Google Scholar]
- Kaushik, J. K., K. Ogasahara, and K. Yutani. 2002. The unusually slow relaxation kinetics of the folding-unfolding of pyrrolidone carboxyl peptidase from a hyperthermophile, Pyrococcus furiosus. J. Mol. Biol. 316:991–1003. [DOI] [PubMed] [Google Scholar]
- Kidric, M., H. Fabian, J. Brzin, T. Popovic, and R. H. Pain. 2002. Folding, stability, and secondary structure of a new dimeric cysteine proteinase inhibitor. Biochem. Biophys. Res. Commun. 297:962–967. [DOI] [PubMed] [Google Scholar]
- Kuo, S. C., and M. P. Sheetz. 1993. Force of single kinesin molecules measured with optical tweezers. Science. 260:169–170. [DOI] [PubMed] [Google Scholar]
- Kurzban, G. P., E. A. Bayer, M. Wilchek, and P. M. Horowitz. 1991. The quaternary structure of streptavidin in urea. J. Biol. Chem. 266:14470–14477. [PubMed] [Google Scholar]
- Kurzban, G. P., G. Gitlin, E. A. Bayer, M. Wilchek, and P. M. Horowitz. 1990. Biotin binding changes the conformation and decreases tryptophan accessibility of streptavidin. J. Protein Chem. 9:673–682. [DOI] [PubMed] [Google Scholar]
- Lakowicz, J. R. 1983. Principles of Fluorescence Spectroscopy. Plenum Press, New York.
- Marek, M., K. Kaiser, and H. J. Gruber. 1997. Biotin-pyrene conjugates with poly(ethylene glycol) spacers are convenient fluorescent probes for avidin and streptavidin. Bioconjug Chem. 8:560–566. [DOI] [PubMed] [Google Scholar]
- Matthews, J. A., A. Batki, C. Hynds, and L. J. Kricka. 1985. Enhanced chemiluminescent method for the detection of DNA dot-hybridization assays. Anal. Biochem. 151:205–209. [DOI] [PubMed] [Google Scholar]
- Mehta, R., D. L. Gantz, and O. Gursky. 2003a. Effects of mutations in apolipoprotein C-1 on the reconstitution and kinetic stability of discoidal lipoproteins. Biochemistry. 42:4751–4758. [DOI] [PubMed] [Google Scholar]
- Mehta, R., A. Kundu, and N. Kishore. 2003b. A mechanistic study on the thermal unfolding of cytochrome c in presence of 4-chlorobutan-1-ol: differential scanning calorimetric and spectroscopic approach. Phys. Chem. Chem. Phys. 5:5514–5522. [Google Scholar]
- Otzen, D. E. 2002. Protein unfolding in detergents: effect of micelle structure, ionic strength, pH, and temperature. Biophys. J. 83:2219–2230. [DOI] [PMC free article] [PubMed] [Google Scholar]
- Otzen, D. E., and M. Oliveberg. 2001. A simple way to measure protein refolding rates in water. J. Mol. Biol. 313:479–483. [DOI] [PubMed] [Google Scholar]
- Perez, M. K., H. L. Paulson, S. J. Pendse, S. J. Saionz, N. M. Bonini, and R. N. Pittman. 1998. Recruitment and the role of nuclear localization in polyglutamine-mediated aggregation. J. Cell Biol. 143:1457–1470. [DOI] [PMC free article] [PubMed] [Google Scholar]
- Pierce Biotechnology. 2004. Detergent Removal from Protein Samples. Pierce Biotechnology, Rockford, IL.
- Prozyme. 2002. Streptavidin Technical Data. ProZyme, San Leandro, CA.
- Rozema, D., and S. H. Gellman. 1996a. Artificial chaperone-assisted refolding of carbonic anhydrase B. J. Biol. Chem. 271:3478–3487. [DOI] [PubMed] [Google Scholar]
- Rozema, D., and S. H. Gellman. 1996b. Artificial chaperone-assisted refolding of denatured-reduced lysozyme: modulation of the competition between renaturation and aggregation. Biochemistry. 35:15760–15771. [DOI] [PubMed] [Google Scholar]
- Sacchettini, J. C., and J. W. Kelly. 2002. Therapeutic strategies for human amyloid diseases. Nat. Rev. Drug Discov. 1:267–275. [DOI] [PubMed] [Google Scholar]
- Sano, T., S. Vajda, C. L. Smith, and C. R. Cantor. 1997. Engineering subunit association of multisubunit proteins: a dimeric streptavidin. Proc. Natl. Acad. Sci. USA. 94:6153–6158. [DOI] [PMC free article] [PubMed] [Google Scholar]
- Schetters, H. 1999. Avidin and streptavidin in clinical diagnostics. Biomol. Eng. 16:73–78. [DOI] [PubMed] [Google Scholar]
- Shin, I., I. Silman, C. Bon, and L. Weiner. 1998. Liposome-catalyzed unfolding of acetylcholinesterase from Bungarus fasciatus. Biochemistry. 37:4310–4316. [DOI] [PubMed] [Google Scholar]
- Skerra, A., and T. G. M. Schmidt. 1999. Applications of a peptide ligand for streptavidin: the Strep-tag. Biomol. Eng. 16:79–86. [DOI] [PubMed] [Google Scholar]
- Sturtevant, J. M. 1987. Biochemical applications of differential scanning calorimetry. Annu. Rev. Phys. Chem. 38:463–488. [Google Scholar]
- Suter, M., J. Cazin, Jr., J. E. Butler, and D. M. Mock. 1988. Isolation and characterization of highly purified streptavidin obtained in a two-step purification procedure from Streptomyces avidinii grown in a synthetic medium. J. Immunol. Methods. 113:83–91. [DOI] [PubMed] [Google Scholar]
- Weber, P. C., M. J. Cox, F. R. Salemme, and D. H. Ohlendorf. 1987. Crystallographic data for Streptomyces avidinii streptavidin. J. Biol. Chem. 262:12728–12729. [PubMed] [Google Scholar]
- Weber, P. C., D. H. Ohlendorf, J. J. Wendoloski, and F. R. Salemme. 1989. Structural origins of high-affinity biotin binding to streptavidin. Science. 243:85–88. [DOI] [PubMed] [Google Scholar]
- Weber, P. C., M. W. Pantoliano, D. M. Simons, and F. R. Salemme. 1994. Structure-based design of synthetic azobenzene ligands for streptavidin. J. Am. Chem. Soc. 116:2717–2724. [Google Scholar]
- Wiese, R. 2003. Analysis of several fluorescent detector molecules for protein microarray use. Luminescence. 18:25–30. [DOI] [PubMed] [Google Scholar]
Associated Data
This section collects any data citations, data availability statements, or supplementary materials included in this article.


