Abstract
The distribution of divalent ions in semidilute solutions of high-molecular-mass DNA containing both sodium chloride and strontium chloride in near-physiological conditions is studied by small-angle x-ray scattering and by small-angle neutron scattering. Both small-angle neutron scattering and small-angle x-ray scattering reveal a continuous increase in the scattering intensity at low q with increasing divalent ion concentration, while at high q the scattering curves converge. The best fit to the data is found for a configuration in which DNA strands of cross-sectional radius 10 Å are surrounded by a counterion sheath of outer radius ∼13.8 Å, independent of the strontium chloride concentration. When the strontium chloride is replaced by calcium chloride, similar results are obtained, but the thickness of the sheath increases when the divalent salt concentration decreases. These results correspond in both cases to partial localization of the counterions within a layer that is thinner than the effective Debye screening length.
INTRODUCTION
DNA is a charged polyelectrolyte that exhibits a variety of structures both in vivo and in free solution. Long-range interactions between the charged groups stabilize the DNA strands in solution. Monovalent counterions form a cloud surrounding the chain, and at higher ion concentration (i.e., when the distance between neighboring charged groups is smaller than the Bjerrum length, 7.1 Å), a fraction of these ions is believed to adsorb on to the macroion (Manning, 1969). Many studies indicate that the distribution of monovalent ions can be approximated by the Poisson-Boltzmann theory (Oosawa, 1971; van der Maarel et al., 1992), but this theory does not describe the counterion atmosphere in the presence of divalent ions (Kjellander and Marcelja, 1984).
The long-range Coulomb repulsion in highly charged polymers favors an extended conformation that, for DNA, would cause it to exceed the size of a biological cell. In its biological functions, however, the DNA morphology is governed by the counterion environment, which can modify the electrostatic interactions at many levels of distance-scale. A knowledge of the counterion distribution is therefore essential to the understanding of the biological function of this molecule. In particular, the effect of multivalent ions on the chain conformation is poorly understood.
Much of the current understanding of the effect of ions is based on molecular dynamics modeling. These simulations have shown that in the presence of divalent counterions, short-range attractive interactions generate aggregation of the DNA strands, resulting in the formation of bundles and other partially ordered arrangements (Stevens, 1999, 2001). Present molecular dynamics approaches do not explicitly address the localization of multivalent cations along the backbone of the polymer.
In this article we present an experimental approach combining small-angle x-ray scattering (SAXS) and small-angle neutron scattering (SANS) to determine the distribution of small divalent counterions around high-molecular-mass DNA under physiological conditions, i.e., where monovalent counterions are also present. Strontium is used to mimic the physiological divalent ion, calcium. In DNA solutions of high molecular mass, increasing the concentration of alkali earth-metal ions such as calcium or strontium leads to replacement of the sodium counterions and ultimately causes reversible phase separation. In principle, varying the wavelength of the incident beam in the vicinity of the absorption edge of the counterion (anomalous SAXS) yields information simultaneously on the distribution of ions and on the polymer (Williams, 1991; Sabbagh et al., 1999; Guilleaume et al., 2002; Goerigk et al., 2004; Das et al., 2003). In practice, however, the relative variation in electronic contrast explored in an anomalous SAXS measurement on a single resonant atomic species is small, making it difficult to determine structures unequivocally. By virtue of the significant differences between neutron and x-ray scattering, contrast SANS measurements can provide valuable complementary information on the structural contributions of the polymer and of the surrounding ions (van der Maarel et al., 1992; van der Maarel and Kassapidou, 1998; Zakharova et al., 1999; Morfin et al., 2003). At high values of the transfer wave vector q, however, where scattering techniques are sensitive to the local structure of the polymer and the counterion distribution, the signal/noise ratio in SANS experiments becomes poor. For this reason it is desirable to combine observations both of SAXS and SANS. This article reports a SAXS and SANS investigation of semidilute DNA solutions in near-physiological salt conditions at different concentrations of strontium chloride.
THEORY
In polyelectrolyte solutions, the scattering intensity contains a contribution from the structure factor of the polymer as well as from that of the associated counterions (Chang et al., 1990; Sabbagh et al., 1999; Das et al., 2003; Morfin et al., 2003; Dingenouts et al., 2003, Goerigk et al., 2004). Unlike the case of polyelectrolytes formed of low-molecular-weight monomers (e.g., polyacrylic acid), however, in large molecules such as DNA the number of counterions is a small fraction of the total atoms present. Therefore, a fortiori, anomalous scattering from these counterions, which in turn involves only a small fraction of their electrons, contributes only marginally to the total scattering power.
To determine the counterion distribution, three approaches can be envisioned:
Enhancing the signal by investigating concentrated solutions of DNA (Das et al., 2003).
Comparing SAXS with SANS measurements on the same sample (Morfin et al., 2003), knowing that the relative contribution from the counterions in SANS is generally significantly smaller than in SAXS.
Modeling the counterion cloud to fit the scattering data.
The first of these approaches is not pursued here owing to the high ionic strength needed in the solvent to compensate the polyion. The second approach provides useful information, although it calls for high accuracy in the measurements of absolute intensity. The route we adopt here is a combination of the second and third approaches.
The total scattering as a function of transfer wave vector q ( where λ is the incident wavelength and θ the scattering angle) can be defined in terms of the difference in electron density Kα between the solvent and each component α of the solution
 |
(1) |
where r0 (2.818 × 10⁻¹³ cm) is the radius of the electron, and Sα,β(q) is the partial structure factor in which α and β represent either the polymer or the divalent ion cloud. Thus,
 |
(2) |
and
 |
(3) |
where NA is Avogadro's number,  is the concentration (in moles) of strontium ions,
  is the volume of a strontium ion, dH2O is the density of water, and Zp = 320 and Mp = 615.4 are the number of electrons and the molar mass of the polymer basepair unit, respectively, whereas 10 and 18 are those of the solvent, water. At the physiological conditions investigated here, the electron density of the sodium and chlorine ions in the solution contribute negligibly to the electronic density of the bulk solvent. On increasing the energy of the incident photons below the absorption threshold (16.104 keV), the effective electron number f(E) of the strontium decreases. The contrast
  between the strontium atoms and the solvent thus varies, whereas that between polymer and solvent remains constant.
For SANS, an expression similar to Eq. 1 holds, but the contrast factors depend on the difference in neutron scattering length density ρ between the solvent and the polymer or the counterion environment (Sears, 1992). In this case, however, the scattering intensity is dominated by the first term in Eq. 1, because the contribution from the divalent nuclei is weak. The SANS and SAXS techniques thus complement each other, thereby in principle permitting a comparison between the signals arising, on the one hand, from the polymer structure and, on the other hand, from the counterion cloud.
It has been found previously (Horkay et al., 2002) that the scattering response of semidilute high-molecular-weight neutralized polyelectrolyte solutions behaves in an analogous manner to a set of interconnected rods of length L and of cross-sectional radius r. The observed value of L, which is shorter than the persistence length of the individual polymer chain in dilute solution and which depends both on the polymer concentration and on the divalent salt content, is the characteristic length describing the amplitude of the osmotic fluctuations. In addition to this thermodynamic signal, the response at small values of q is dominated by surface scattering from a few large aggregates. Thus, in the q-range explored in a SANS observation, it is found experimentally that the scattering intensity can be described by the expression
 |
(4) |
where Δρ is the difference in neutron scattering length density between polymer and solvent, χ is the osmotic susceptibility of the solution, J1(x) the Bessel function of order 1, a is a constant, and m (3 < m ≤ 4) is related to the surface-scattering properties of the aggregates. For smooth surfaces (Porod, 1982), m = 4, whereas for fractal surfaces (Pfeiffer and Avnir, 1983) of dimension Ds, m = 6–Ds.
The foregoing discussion suggests three distinct situations:
In the first (Model 1), the counterions are condensed on the polymer; the structure factor of the counterions is then indistinguishable from that of the DNA.
In the second situation (Model 2), the counterion cloud forms a diffuse sheath around the DNA rods; in this case, owing to the greater sensitivity of the SAXS measurements to the strontium ions, the apparent radius r of the DNA should be greater than that measured by SANS.
A third configuration may be invoked in which the counterions are uniformly distributed in the surrounding solution: the structure factor of the counterions is again identical to that of the DNA, but the electron density contrast is weaker. Owing to its unphysical nature, however, the third configuration is not considered further.
MATERIALS AND METHODS
DNA samples were prepared from a sodium salt of DNA (salmon testes, Mw = 1.3 106; Sigma, St. Louis, MO) dissolved in 100 mM NaCl aqueous solution. The concentration of the solutions, 3% wt, was such that the DNA molecules strongly overlapped, corresponding to the semidilute regime (de Gennes, 1979). The G-C content of this DNA was 41.2%. Different amounts of calcium chloride or strontium chloride were added to the solutions. Two salt concentrations were studied, cSrCl2 = 30 and 80 mM. Phase separation occurs in this system at divalent ion concentrations >100 mM (Horkay and Basser, 2004).
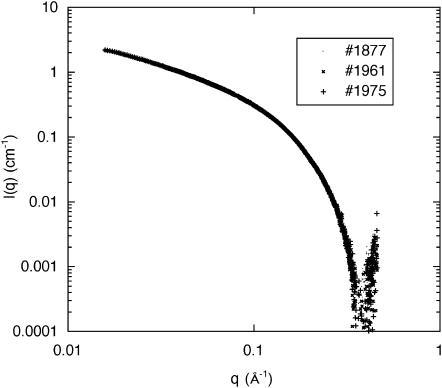
The SAXS measurements were made on the BM2 beam line at the European Synchrotron Radiation Facility (Grenoble, France). The sample-to-detector distance was 0.78 m, the detector being a two-dimensional charge-coupled device camera (Princeton Instruments, Roper Scientific, Evry, France) with a resolution of 50 μm. Corrections were made for dark counts and camera distortion. The measured intensities were normalized using a standard polyethylene sample (lupolen) of known scattering cross section. The transfer wave vector range explored was 0.015 Å−1 ≤ q ≤ 0.8 Å−1. Sequences of exposure times of 50 s were programmed. To minimize radiation damage in the polymer, the position of the beam in the sample was successively changed for each energy measured. Fig. 1 shows that successive exposures without changing the sample position leaves the scattering response practically unchanged, i.e., the effect of radiation damage in this transfer vector range is small. The effects of radiation damage cannot, however, be ignored at smaller values of q (not shown here), since radiation-induced cross-linking affects the polymer distribution predominantly at large length scales.
FIGURE 1.
Scattering intensity at E = 15.8 keV from a 3 wt % DNA solution containing 80 mM strontium chloride, in three successive exposures of 50 s at the same position in the sample. In this q-range, the responses are indistinguishable.
At the high values of q explored in this investigation, solvent background corrections are of paramount concern. Ideally, it should be sufficient to subtract the signal of pure water and then to solve Eq. 1, using a knowledge of the effective number of electrons contributing to the signal for each incident energy. As mentioned above, however, this approach is not realistic in the present case. A further consideration, generally overlooked in small-angle scattering, is that subtraction of the background from the pure solvent does not fully remove the signal from the atomic structure of the polymer. The incomplete correction tends to leave a small residual baseline that is independent of the anomalous signal. The background correction procedure followed here consisted in 1), subtracting the signal from a solution having the same ionic composition and concentration as the sample and 2), subtracting a further small constant term such that the corrected signal is zero at the first minimum, as defined in Eq. 4. The value of the extra constant was found to be one order-of-magnitude smaller than the signal of pure water. It should, however, be mentioned here that the physical origin of the residual baseline may equally be due to a small degree of polydispersity in the radius of the DNA strands, which would give rise to a similar effect. The approach adopted here of treating it as a constant simplifies the calculations but does not alter the overall results.
The SANS measurements were made on the NG3 instrument at the National Institute of Standards and Technology, using an incident wavelength 8 Å. The sample-detector distances used were 1.3 m, 4 m, and 13.1 m, with an explored wave vector range 0.003 Å−1 ≤ q ≤ 0.15 Å−1. The DNA was dissolved in 100 mM NaCl solutions in a mixture of 8% D2O and 92% H2O, and containing appropriate amounts of SrCl2. The reason for the choice of heavy/light water mixture is that its scattering length density is zero, thereby eliminating contributions to the signal from hydration layers of unknown thickness around either the polymer or the ions. A second reason for this choice is that, in pure D2O, the response at low q is dominated by scattering from clusters; as these are more soluble in H2O, their contribution is greatly reduced. After azimuthal averaging of the SANS spectra, corrections for detector response and cell windows were applied. The incoherent background was subtracted using the signal from the solvent, following the method described in Horkay et al. (1991). The agreement between the SAXS and SANS signals indicates that this correction was adequate. Contrast variation measurements, performed at 0.01 Å−1 with solutions of 100 mM NaCl and 15 mM CaCl2 at five different H2O/D2O ratios, found that the contrast match point occurs at D2O content D = 0.68. It follows that the value of the mass density of this DNA is dp = 2.01 g cm−3 if the divalent ion is in solution. If, however, the divalent ions are condensed on the polyion, the value of dp is higher. For the case of strontium, assuming one divalent ion per basepair, the value of dp would be 2.13 g cm−3.
SANS measurements were made on two sets of DNA solutions with 100 mM sodium chloride and containing either calcium chloride or strontium chloride. The SAXS measurements were made at six energies below the absorption edge of strontium (15.800, 15.984, 16.056, 16.085, 16.097, and 16.102 keV).
RESULTS
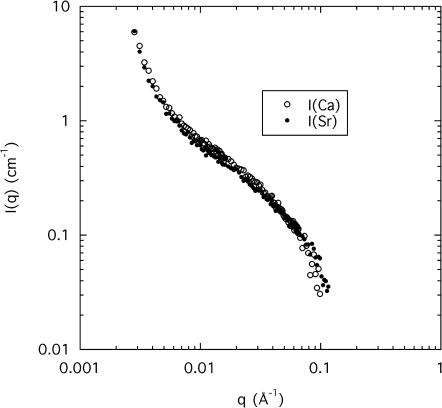
In general, alkali earth-metal ions induce phase separation in solutions of charged polymers. In DNA the phase separation associated with both calcium and strontium ions corresponds to a reversible conformational change. Fig. 2 shows the SANS response of the same 3% DNA solution in solvents composed of 100 mM NaCl and either 80 mM CaCl2 or 80 mM SrCl2. Within experimental error, mainly associated with sample preparation, the two curves are identical. They exhibit the three characteristic regions described in Eq. 4. At low q the intensity varies according to a power law aq−m, where the value of the exponent m, ∼4, corresponds to scattering from smooth interfaces. At intermediate q (0.01 Å−1 ≤ q ≤ 0.05 Å−1), a different power law is observed with a slope of −1, indicative of linearly correlated regions. Finally, at higher q, a shoulder appears, with a curvature that depends on the radius r of the DNA strands. As the phase separation is approached at ∼100 mM strontium chloride concentration, the osmotic susceptibility χ in Eq. 4 and the amplitude of the concentration fluctuations both increase.
FIGURE 2.
SANS response from a 3 wt % DNA solution containing 100 mM NaCl and 80 mM CaCl2 (open symbols) or 80 mM SrCl2 (solid symbols) in a 8% D2O/92% H2O mixture.
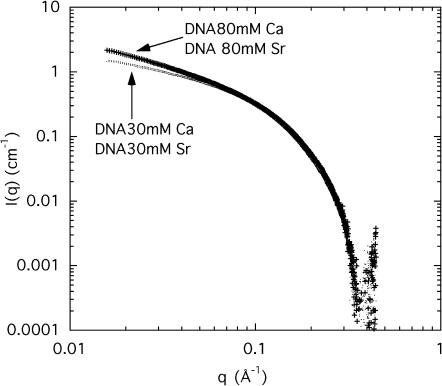
Fig. 3 shows the SAXS spectra at 15.8 keV (well below the absorption edge of strontium) for samples at the same concentration of CaCl2 or SrCl2 (80 mM), together with two additional spectra from solutions containing 30 mM of CaCl2 or SrCl2, respectively. At low q the scattering intensity from the 80-mM samples exceeds that of the 30-mM samples, whereas all the curves tend to converge with increasing q. In this representation no significant difference is observed between the calcium- and strontium-containing samples at the same ion concentration. The latter result is consistent with the small change in electron density expected when calcium is replaced by strontium, although the total number of electrons increases.
FIGURE 3.
SAXS scattering from a 3 wt % DNA aqueous solution containing 100 mM NaCl and 30 mM CaCl2 or 30 mM SrCl2 (lower curves), and 80 mM CaCl2 or 80 mM SrCl2 (upper curves).
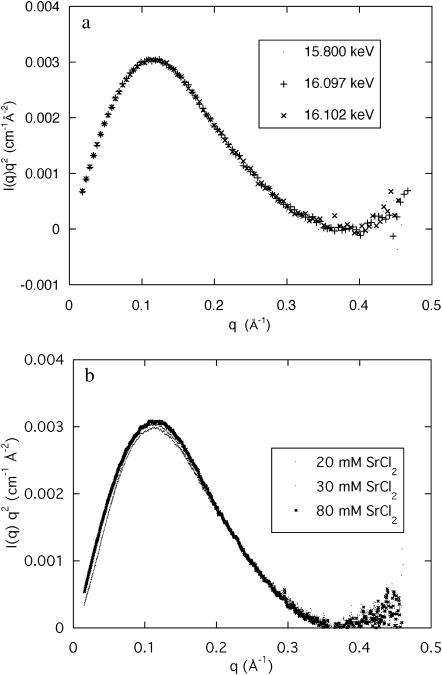
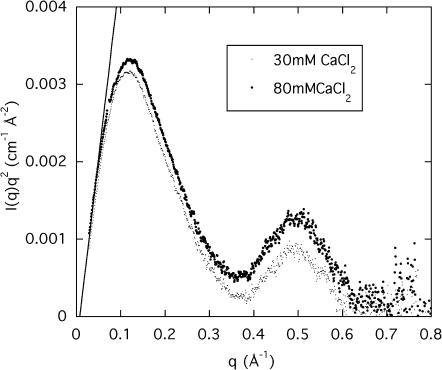
A sensitive way to reveal differences between the curves at high q is provided by the Kratky representation, q2I(q), used in Fig. 4 a, which shows the effect of changing the incident energy. The three measurements shown, at 15.800, 16.097, and 16.102 keV, are practically indistinguishable. This result illustrates the insensitivity of the shape of the curves in this q-range to the energy change, as well as the smallness of the anomalous contribution of strontium compared to the scattering intensity from the electron-rich DNA. More surprisingly, Fig. 4 b shows that the intensity of the scattering curves in this q-range (i.e., not at low q) is practically insensitive to the concentration of SrCl2. The same is not true for CaCl2. Fig. 5 shows a Kratky plot for the calcium-containing samples measured over a wider q-range, in which the first and second zeros of the scattering function are visible at 0.369 Å−1 and at 0.67 Å−1, respectively corresponding to the values 3.83 and 7.01 in the argument of the Bessel function. These results are those expected of a cylinder of apparent radius 10.4 ± 0.1 Å. The resolution of these measurements, however, is not sufficient to detect the presence of fine structure (e.g., grooves) in the surface of the cylinders. Fig. 5 also contains information on the mass distribution in the DNA molecule. In the high q-approximation for the scattering from rigid rods (Higgins and Benoît, 1994),
 |
(5) |
where  is the electron density contrast between polymer and solvent, μL the mass per unit length, and 〈L〉 is the average rod length. The straight line shown in Fig. 5 is the least-squares fit through the initial points of the curve. Setting dp = 2.01 g cm−3 into Eq. 3 gives 6.90 × 1021 cm−4 for the value of
  , yielding μL = 194 ± 20 g/Å and 〈L〉 = 204 ± 20 Å. This value of μL is in agreement with that determined by SANS (Borsali et al., 1998), namely 194.1 g/Å. However, insofar as this result depends on
  , and hence on the degree of condensation of the counterions, the estimated error is evaluated to be 10%. The value found for 〈L〉 is significantly shorter than the persistence length in dilute solution (Borsali et al., 1998), 〈L〉 = 500 Å. The discrepancy is due to the screening effect of neighboring DNA chains in these semidilute samples (de Gennes, 1979).
FIGURE 4.
(a) Kratky plot of the SAXS signals from a 3 wt % DNA solution containing 100 mM NaCl and 80 mM SrCl2 at 15.800 keV (▪), 16.097 keV (+), and 16.102 keV (×). For clarity, only 10% of the data from each spectrum are plotted; (b) Kratky plot of the SAXS signals at 15.800 keV from three DNA solutions (3 wt %) containing 100 mM NaCl and 20 mM, 30 mM, and 80 mM SrCl2 respectively.
FIGURE 5.
Kratky plot of the SAXS signals from a 3 wt % DNA solution containing 100 mM NaCl and either 30 mM CaCl2 or 80 mM CaCl2 at 14.900 keV. The straight line shown is the least-squares fit through the low q-data points, as described by Eq. 5.
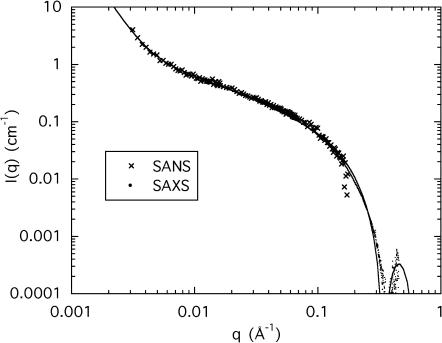
Fig. 6 shows the spectrum obtained from SANS for a DNA sample at concentration cSrCl2 = 80 mM, together with the SAXS signal for the same sample at 15.8 keV. In this figure, the curves are expressed in the same scattering units, i.e., the SAXS data have been multiplied by the ratio (Δρ/r0Kp)2 = 0.186. For the calculation both of Kp in Eq. 3 and of Δρ, the assumptions of Model 1 have been adopted, i.e., the complement of strontium ions lies on the surface of the DNA chain. The alternative case of Model 2, where the ions form an extended cloud around the chain, is discussed below. No adjustable factor has been used in Fig. 6, both sets of measurements having been made on independent absolute scales. It can be seen that the two different measurements are in good agreement both in shape and intensity throughout the overlapping q-range. The model in which the strontium counterions occupy the same space as the DNA chain justifies using Eq. 4 for the total scattering function. The continuous line in Fig. 6 shows this fit through all the data points, with r = 11.1 Å and L = 200 Å, in moderate agreement with the values of L and of the radius of cross section estimated from Fig. 5. The fit, however, is not fully satisfactory in the region q > 0.1 Å−1. More particularly, the position of the minimum does not coincide with the observed value.
FIGURE 6.
Normalized curves from SAXS at 15.8 keV and SANS for a 3% DNA solution in water containing 100 mM NaCl and 80 mM SrCl2. The SAXS data are converted to SANS contrast by multiplying the intensities by (Δρ/r0Kp)2 = 0.187, corresponding to Model 1. The continuous line is Eq. 4 where L = 200 Å, r = 11.1 Å, and I(0) = 1.76 cm−1.
Considering now the alternative configuration of Model 2 where the counterions form an extended ion cloud, we make the following simplification: the polymer chain is modeled as a naked DNA core of cross-sectional radius r1, clad in a uniform cylindrical sheath of outer radius r2 that encompasses the positive counterions. Scattering from the Cl− ions is negligible. From the expression for the diffraction pattern from an annular diaphragm (Born and Wolf, 1975), the scattering function can be written
 |
(6) |
where the low-q power law term has been omitted and where Kp is now the electron density of the naked DNA polyion. The outer radius of the cylindrical sheath, r2, may be defined by the mean-square radius of the counterion distribution,
 |
(7) |
where ΛD is the Debye screening length, and
 |
(8) |
thus
 |
(9) |
where
 |
For the DNA sample containing 100 mM NaCl and 80 mM SrCl2, the value of ΛD is close to 3.7 Å. Thus, if r1 = 10 Å, then r2 = 15.2 Å. At 15.8 keV the number of electrons contributing to the scattering of the bare Sr2+ ion is f(E) = 32.5 (Cromer and Liberman, 1970). According to Eq. 2, this value must be reduced by the number of electrons belonging to the water molecules that are displaced by the effective volume of the ion,  . Owing to electrostriction,
  is negative (Burgess, 1978), as
 |
(10a) |
whereas for calcium,
 |
(10b) |
The electron contrast factor for the counterions in Model 2 is then defined by the number of electrons from the counterions located in the annular space between r1 and r2 = p r1,
 |
(11) |
In Eq. 6, the ratio of the amplitude of the second to the first term then becomes
 |
(12) |
where b = 3.4 Å is the spacing between basepairs in DNA. In this model the electron cloud increases the total contrast factor of the DNA, from  for the bare polyion to 7.6 × 1021 cm−4 for the decorated molecule. The neutron scattering contrast, however, is less affected, decreasing from 1.56 × 1021 cm−4 to 1.42 × 1021 cm−4.
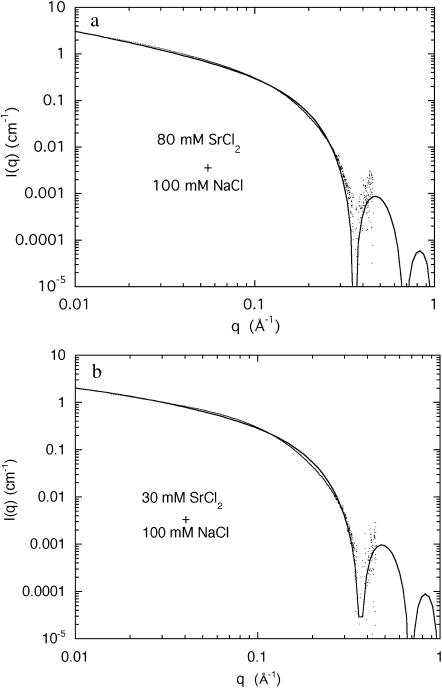
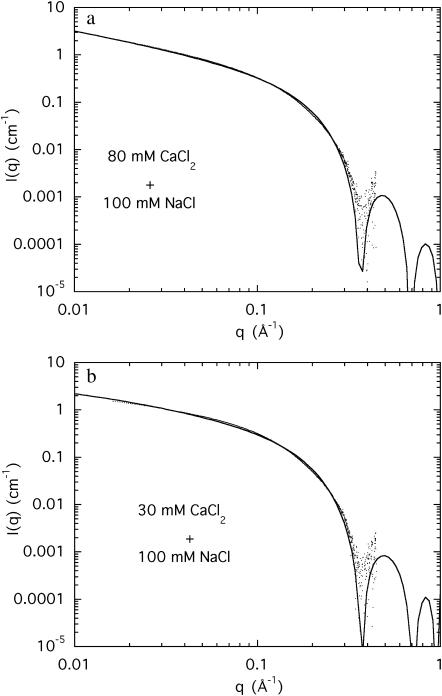
Comparison of the intensities of the SAXS and the SANS data in Fig. 6 shows that although the agreement is good for Model 1, the accuracy in the measurements of the amplitude (∼10%) is insufficient to choose between the two models, particularly in view of the uncertainty of the effective density of DNA in the presence of the divalent counterions. The selection must therefore be based on the relative merits of Eqs. 4 and 6. In fitting Eq. 6 to the SAXS data, it was found that the quality of the fit is improved if r1 is taken to be 10.0 Å rather than 11.1 Å. The choice of the outer radius r2 is constrained by relation 12. The resulting fits of Eq. 6 to the SAXS data of the strontium and calcium containing solutions are displayed in Figs. 7 and 8. (It should be mentioned that if the constraint of Eq. 12 is ignored, the quality of the fits obtained for Eq. 6 is enhanced, but the large values of r2 (≥20 Å) have no physical interpretation in the present model.) It is found that for the two strontium ion concentrations 30 mM and 80 mM, the counterions are confined to a sheath of inner radius 10 Å and outer radius = 13.8 Å, i.e., of thickness 3.8 Å. In both cases, this thickness is smaller than the effective Debye screening length calculated from Eq. 9, namely 7.8 and 5.4 Å, respectively. A similar result was found for the 80 mM calcium sample, but the 30 mM calcium sample displayed a thicker sheath, 5.5 Å, a value, however, that is tighter than that calculated from Eq. 9. These findings indicate that in physiological conditions the divalent counterions are not chemisorbed on the surface of the DNA molecule but are confined in a narrow sheath. Under conditions of high ionic strength, however, such as those explored in Das et al. (2003), it is expected that the short Debye screening length confines the divalent counterion cloud so tightly that it cannot be distinguished from surface condensation.
FIGURE 7.
(a) SAXS spectrum from a 3% DNA solution containing an aqueous solution of 100 mM NaCl and 80 mM SrCl2. The fit is Eq. 6, with χ = 4.3 cm−1, r1 = 10.0 Å, r2 = 13.8 Å, h = 0.40, and L = 200 Å; (b) SAXS spectrum from a 3% DNA solution containing an aqueous solution of 100 mM NaCl and 30 mM SrCl2. The parameters to the fit of Eq. 6 are I(0) = 2.4 cm−1, r1 = 10.0 Å, r2 = 13.8 Å, h = 0.265, and L = 90 Å.
FIGURE 8.
(a) SAXS spectrum from a 3% DNA solution in water containing 100 mM NaCl and 80 mM CaCl2. The fit is Eq. 6, with χ = 5.9 cm−1, r1 = 10.0 Å, r2 = 13.8 Å, h = 0.25, and L = 200 Å; (b) SAXS spectrum from a 3% DNA solution in water containing 100 mM NaCl and 30 mM CaCl2. The parameters to the fit of Eq. 6 are χ = 2.7 cm−1, r1 = 10.0 Å, r2 = 15.5 Å, h = 0.24, and L = 90 Å.
CONCLUSIONS
SAXS and SANS are used to study the distribution of divalent ions in semidilute solutions of DNA containing sodium chloride together with either strontium chloride or calcium chloride at physiological concentrations. Increasing the divalent ion concentration causes both the apparent persistence length L and the low-angle scattering intensity to increase, as the condition for phase separation is approached. Analysis of the shape of the SAXS spectra shows that the divalent counterions are not adsorbed on the surface of the DNA molecule, but rather are partially localized in a compact cloud around it of thickness less than the effective Debye screening length in the solution. The scattering response of the system is not identical for calcium and strontium.
Acknowledgments
We are grateful to the European Synchrotron Radiation Facility for access to the BM2 beam line and to the National Institute of Standards and Technology, U.S. Department of Commerce in providing the neutron research facilities used in this experiment. We extend our warm thanks to Derek Ho and Jean-François Bérar for their invaluable help.
This work is based upon activities supported by the National Science Foundation under Agreement No. DMR-9423101.
References
- Borsali, R., H. Nguyen, and R. Pecora. 1998. Small angle neutron scattering and dynamic light scattering from a polyelectrolyte solution. DNA Macromol. 31:1548–1555. [Google Scholar]
- Born, M., and E. Wolf. 1975. Principles of Optics, 5th Ed. Pergamon Press, Oxford, UK.
- Burgess, J. 1978. Metal Ions in Solution. Ellis Horwood, Chichester, UK.
- Chang, S.-L., S.-H. Chen, R. L. Rill, and J. S. Lin. 1990. Measurements of monovalent and divalent counterion distributions around persistence length DNA fragments in solution. J. Phys. Chem. 94:8025–8028. [Google Scholar]
- Cromer, D. T., and D. Liberman. 1970. Relativistic calculation of anomalous scattering factors for x-rays. J. Chem. Phys. 53:1891–1898. [Google Scholar]
- Das, R., T. T. Mills, L. W. Kwok, G. S. Maskel, I. S. Millet, S. Doniach, K. D. Finkelstein, D. Herschlag, and L. Pollack. 2003. Counterion distribution around DNA probed by solution x-ray scattering. Phys. Rev. Lett. 90:188103. [DOI] [PubMed] [Google Scholar]
- Dingenouts, N., R. Merkle, X. Guo, T. Narayanan, G. Goerigk, and M. Ballauff. 2003. Use of anomalous small-angle x-ray scattering for the investigation of highly charged colloids. J. Appl. Crystallogr. 36:578–582. [Google Scholar]
- de Gennes, P. G. 1979. Scaling Concepts in Polymer Physics. Cornell University Press, Ithaca, NY .
- Goerigk, G., R. Schweins, K. Huber, and M. Ballauff. 2004. The distribution of Sr++ counterions around polyacrylate chains analyzed by anomalous small angle x-ray scattering. Europhys. Lett. 66:331–337. [Google Scholar]
- Guilleaume, B., J. Blaul, M. Ballauff, M. Wittemann, M. Rehahn, and G. Goerigk. 2002. The distribution of counterions around synthetic rod-like polyelectrolytes in solution. Eur. Phys. J. E. 8:299–309. [DOI] [PubMed] [Google Scholar]
- Higgins, J. S., and H. C. Benoît. 1994. Polymers and Neutron Scattering. Clarendon Press, Oxford, UK.
- Horkay, F., A.-M. Hecht, S. Mallam, E. Geissler, and A. R. Rennie. 1991. Macroscopic and microscopic thermodynamic observations in swollen poly(vinyl acetate) networks. Macromolecules. 24:2896–2902. [Google Scholar]
- Horkay, F., A.-M. Hecht, I. Grillo, P. J. Basser, and E. Geissler. 2002. Experimental evidence for two thermodynamic length scales in neutralized polyacrylate gels. J. Chem. Phys. 117:9103–9106. [Google Scholar]
- Horkay, F., and P. J. Basser. 2004. Osmotic observations on chemically cross-linked DNA gels in physiological salt solutions. Biomacromolecules. 5:232–237. [DOI] [PubMed] [Google Scholar]
- Kjellander, R., and S. Marcelja. 1984. Correlation and image charge effects in dielectric double layers. Chem. Phys. Lett. 112:49–53. [Google Scholar]
- Manning, G. S. 1969. Limiting laws and counterion condensation in polyelectrolyte solutions. II. Self diffusion of the small ions. J. Chem. Phys. 51:934–938. [Google Scholar]
- Morfin, I., F. Horkay, P. J. Basser, F. Bley, F. Ehrburger-Dolle, A.-M. Hecht, C. Rochas, and E. Geissler. 2003. Ion condensation in a polyelectrolyte gel. Macromol. Symp. 200:227–233. [Google Scholar]
- Oosawa, F. 1971. Polyelectrolytes. Marcel Dekker, New York.
- Pfeiffer, P., and D. Avnir. 1983. Chemistry in non-integer dimensions between 2 and 3. I. Fractal theory of heterogeneous surfaces. J. Chem. Phys. 79:3558–3571. [Google Scholar]
- Porod, G. 1982. General theory. In Small Angle X-Ray Scattering. O. Glatter and O. Kratky, editors. Academic Press, London, UK.
- Sabbagh, I., M. Delsanti, and P. Lesieur. 1999. Ionic distribution and polymer conformation, near phase separation, in sodium polyacrylate/divalent cations mixtures: small angle x-ray and neutron scattering. Eur. Phys. J. B. 12:253–260. [Google Scholar]
- Sears, V. F. 1992. Neutron scattering lengths and cross sections. Neutron News. 3:26–37. [Google Scholar]
- Stevens, M. J. 1999. Bundle binding in polyelectrolyte solutions. Phys. Rev. Lett. 82:101–104. [Google Scholar]
- Stevens, M. J. 2001. Simple simulations of DNA condensation. Biophys. J. 80:130–139. [DOI] [PMC free article] [PubMed] [Google Scholar]
- van der Maarel, J. R. C., L. C. A. Groot, M. Mandel, W. Jesse, G. Jannink, and V. Rodriguez. 1992. Partial and charge structure functions of monodisperse DNA fragments in salt-free aqueous solution. J. Phys. II (Fr.). 2:109–122. [Google Scholar]
- van der Maarel, J. R. C., and K. Kassapidou. 1998. Structure of short DNA fragment solutions. Macromolecules. 31:5734–5739. [DOI] [PubMed] [Google Scholar]
- Williams, C. E. 1991. Contrast variation in x-ray and neutron scattering. In Neutron, X-Ray and Light Scattering. P. Lindner and T. Zemb, editors. Elsevier BV, Amsterdam, The Netherlands.
- Zakharova, S. S., S. U. Egelhaaf, L. B. Bhuiyan, C. W. Outhwaite, D. Bratko, and J. R. C. van der Maarel. 1999. Multivalent ion-DNA interaction: neutron scattering estimates of polyamine distribution. J. Chem. Phys. 111:10706–10716. [Google Scholar]


