

Abstract
Pancreatic islets of Langerhans produce bursts of electrical activity when exposed to stimulatory glucose levels. These bursts often have a regular repeating pattern, with a period of 10–60 s. In some cases, however, the bursts are episodic, clustered into bursts of bursts, which we call compound bursting. Consistent with this are recordings of free Ca2+ concentration, oxygen consumption, mitochondrial membrane potential, and intraislet glucose levels that exhibit very slow oscillations, with faster oscillations superimposed. We describe a new mathematical model of the pancreatic β-cell that can account for these multimodal patterns. The model includes the feedback of cytosolic Ca2+ onto ion channels that can account for bursting, and a metabolic subsystem that is capable of producing slow oscillations driven by oscillations in glycolysis. This slow rhythm is responsible for the slow mode of compound bursting in the model. We also show that it is possible for glycolytic oscillations alone to drive a very slow form of bursting, which we call “glycolytic bursting.” Finally, the model predicts that there is bistability between stationary and oscillatory glycolysis for a range of parameter values. We provide experimental support for this model prediction. Overall, the model can account for a diversity of islet behaviors described in the literature over the past 20 years.
INTRODUCTION
Insulin secretion from pancreatic islets is oscillatory and multimodal. The fastest component of these oscillations has a period of tens of seconds, and in vitro studies show that these fast oscillations are in phase with oscillations in the intracellular free Ca2+ concentration of β-cells, the insulin-secreting cells of the islet (Bergsten, 1995; Gilon et al., 1993). A second component of the oscillatory insulin signal has a period of 5–10 min (Bergsten and Hellman, 1993; Pørksen et al., 2002, 1995). This component appears to play a physiological role, and is lost in patients with type II diabetes and their near relatives (Matthews et al., 1983; O'Rahilly et al., 1988). Still slower ultradian rhythms, with a period of 2 h (Simon et al., 1987), and circadian rhythms have also been observed (Peschke and Peschke, 1998). The focus of this report is on the mechanisms governing the two faster components of oscillatory insulin secretion.
In mouse islets, Ca2+ oscillations are driven by bursting electrical activity at stimulatory glucose levels (Atwater et al., 1989; Dean and Matthews, 1968), as shown by dual recordings of Ca2+ concentration and membrane potential (Santos et al., 1991; Zhang et al., 2003). Much progress has been made in recent years in understanding bursting in islets. There is strong evidence that Ca2+, which enters during action potentials, provides negative feedback onto the membrane through the activation of K+ channels, hyperpolarizing the membrane, and ultimately terminating the burst of electrical activity (Atwater et al., 1980; Goforth et al., 2002; Göpel et al., 1999; Kennedy et al., 2002; Larsson et al., 1996). An active spiking phase restarts after Ca2+ has been cleared from the cytosol by plasma membrane and endoplasmic reticulum (ER) Ca2+ ATPases. Ca2+ may act directly to activate Ca2+-activated K+ channels (Ämmälä et al., 1991; Goforth et al., 2002; Göpel et al., 1999; Kozak et al., 1998), or indirectly by lowering the ratio of adenosine triphosphate (ATP) to adenosine disphosphate (ADP) concentrations (Kennedy et al., 2002; Krippeit-Drews et al., 2000; Magnus and Keizer, 1998b; Nunemaker et al., 2004), thus in turn activating ATP-sensitive K+ channels (K(ATP) channels) (Ashcroft et al., 1984; Henquin, 1988). A recent mathematical model, called the “phantom bursting model,” illustrates how these mechanisms can interact to produce bursting with diverse periods ranging from seconds to minutes (Bertram et al., 2000; Bertram and Sherman, 2004).
An alternative hypothesis is that electrical activity is exclusively driven by slow oscillations in glycolysis, due to the allosteric enzyme phosphofructokinase (PFK) (Longo et al., 1991; Tornheim, 1997). Glycolytic oscillations have been observed in muscle extracts (Tornheim and Lowenstein, 1974), and the muscle isoform of PFK is the subtype that dominates the activity in pancreatic β-cells (Yaney et al., 1995). In addition, there is evidence for glycolytic oscillations in β-cells and clonal insulin-secreting cells (Tornheim, 1997). It is likely that the rhythmical production of glycolytic products, which serve as substrates for mitochondrial metabolism, is amplified by the mitochondria. Glycolytic oscillations would then be expected to lead to oscillations in ATP/ADP that drive bursting electrical activity due to their effects on β-cell K(ATP) channels. Thus, rather than driving the oscillations in electrical activity, the Ca2+ oscillations that are observed are in this scenario a byproduct of the rhythmic electrical activity that is driven by oscillations in fuel metabolism.
We demonstrate that these two mechanisms for oscillations in islets, a mechanism based on electrical activity and a glycolytic mechanism, are not contradictory or mutually exclusive. Instead, we show via modeling that they can work cooperatively to produce rhythmical insulin secretion with a period of ∼5 min, which is observed in vivo. Our hypothesis is that bursting in β-cells is typically driven by Ca2+-dependent processes (Bertram and Sherman, 2004; Zhang et al., 2003). However, independent glycolytic oscillations also occur, and these act to modulate the bursting pattern. The modulated pattern is more complex, and may consist of episodes of bursts clustered together into what we call “compound bursting”. We propose here that compound bursting is responsible for insulin oscillations that have a period of ∼5 min. Evidence for compound bursting has been provided by previous measurements of membrane potential (Barbosa et al., 1998; Cook, 1983; Henquin et al., 1982), intracellular Ca2+ (Bergsten et al., 1994; Krippeit-Drews et al., 2000; Valdeolmillos et al., 1989; Zhang et al., 2003), oxygen consumption (Bergsten et al., 2002; Jung et al., 1999), mitochondrial membrane potential (Krippeit-Drews et al., 2000), and intraislet glucose levels (Jung et al., 2000). In the model, glycolytic oscillations can also drive the bursting itself, rather than modulating Ca2+-driven bursting. This “glycolytic bursting” is characterized by a long-lasting burst of impulses followed by a long silent phase, with total oscillation period appropriate for 5-min insulin oscillations.
We illustrate the interaction of Ca2+-driven bursting with glycolytic oscillations using computer simulations of a mathematical model. The model is based in part on an earlier model for Ca2+-dependent bursting (Bertram and Sherman, 2004), extended to include equations for glycolysis and its concomitant impact on mitochondrial ATP production. A previous study employed minimal models for electrical activity and glycolysis to demonstrate how compound bursting can be produced (Wierschem and Bertram, 2004). The simplicity of this model facilitated our mathematical analysis of compound oscillations. In this study, we use more realistic models for both the electrical and the glycolytic components, and include the participation of mitochondria, allowing us to demonstrate the joint control of respiration by both Ca2+ and glycolysis. Also, in this model the electrical component feeds back onto the glycolytic component through the actions of Ca2+ on metabolism. This pathway is weaker than the pathway from the glycolytic to the electrical component.
Analysis of the new model shows that for a range of parameter values there is bistability in the glycolytic subsystem. That is, for identical parameter values, glycolysis may oscillate or it may be stationary, depending on the initial conditions of the system. We test this prediction experimentally in islets in vitro, by removing glucose and later adding it back to the bath to reset the initial conditions. This maneuver can convert slow Ca2+ oscillations (presumably driven by glycolysis) into much more rapid oscillations (presumably with stationary glycolysis), as predicted by the new model.
MATERIALS AND METHODS
Modeling
The electrical and Ca2+ handling components of the model are based on an earlier β-cell model in which bursting is driven by Ca2+-dependent oscillations in the K(Ca) current and the K(ATP) current (Bertram and Sherman, 2004). The K(Ca) current is directly activated by Ca2+. The K(ATP) current conductance is dependent on the concentrations of adenosine diphosphate and adenosine triphosphate; the conductance is lower for higher values of the ratio ATP/ADP. It is assumed that increases/decreases in the mitochondrial Ca2+ concentration follow those of cytosolic Ca2+, and that elevated levels of mitochondrial Ca2+ reduce the rate of ATP production, possibly by reducing the mitochondrial transmembrane potential (Krippeit-Drews et al., 2000; Magnus and Keizer, 1998b; Nunemaker et al., 2004). Changes in the cytosolic Ca2+ concentration (Ca) take place on a moderately slow timescale (a few seconds), whereas changes in ADP and ATP occur on a slower timescale (tens of seconds to minutes). The interaction of these two slow processes with disparate timescales can give rise to bursting with periods ranging from a few seconds to a few minutes. This is an example of a “phantom bursting model” (Bertram et al., 2000; Bertram and Sherman, 2004).
The equation for the membrane potential (V) is
 |
(1) |
where Cm is the membrane capacitance, IK is a V-dependent K+ current, ICa is a V-dependent Ca2+ current, IK(Ca) is a Ca2+-activated K+ current, and IK(ATP) is an ATP-sensitive K+ current.
 |
(2) |
 |
(3) |
 |
(4) |
 |
(5) |
where
 |
(6) |
The equation for the IK activation variable is
 |
(7) |
where τn is a time constant and  is the equilibrium value of n as a function of V,
 |
(8) |
Activation of Ca2+ current is assumed to be instantaneous, with equilibrium function
 |
(9) |
The K(Ca) conductance is an increasing sigmoidal function of the cytosolic Ca2+ concentration. The K(ATP) conductance adjusts instantaneously to the concentrations of ADP and ATP, and the form of the conductance function (o∞) is described in detail in Magnus and Keizer (1998a). This is based on findings that either in the absence of nucleotide or with a single MgADP− bound the K(ATP) channel is open with a relative conductance of 0.08, whereas with two MgADP− bound the relative channel conductance is 0.89 (Hopkins et al., 1992). We use the Magnus-Keizer expression for o∞ without modification:
 |
(10) |
As discussed in Magnus and Keizer (1998a), the nucleotide concentrations are related to the total concentrations of ADP and ATP by
 |
(11) |
The equation for the free cytosolic Ca2+ concentration is
 |
(12) |
where fcyt is the fraction of free to total cytosolic Ca2+, Jmem is the Ca2+ flux across the plasma membrane, and Jer is the Ca2+ flux out of the endoplasmic reticulum. The plasma membrane flux term is given by
 |
(13) |
where α converts current to flux, and kPMCA is the Ca2+ pump rate. In this report we do not consider the actions of IP3-generating muscarinic agonists, so flux out of the ER is due only to leakage (Jleak), and Ca2+ flux into the ER is through SERCA pumps (JSERCA):
 |
(14) |
where
 |
(15) |
 |
(16) |
and pleak is the leakage permeability and kSERCA is the SERCA pump rate. For simplicity, we omit the effects of Ca2+ flux from mitochondria into the cytosol and influx into the mitochondria through Ca2+ uniporters colocalized with IP3 channels in the ER (Rizzuto et al., 1993). At the simplest level of modeling, the mitochondria behave similarly to the ER. That is, mitochondrial Ca2+ concentration rises when ER Ca2+ rises and falls when ER Ca2+ falls, so adding terms for mitochondrial uptake and export would be similar to multiplying the ER fluxes by a scaling factor.
The differential equation for the Ca2+ concentration in the ER is
 |
(17) |
where fer is analogous to fcyt, and Vcyt and Ver are the volumes of the cytosolic and ER compartments, respectively.
The glycolytic component of the model is modified from an earlier model for glycolytic oscillations in muscle extracts (Smolen, 1995). The key player in glycolysis for the production of oscillations is the allosteric enzyme phosphofructokinase (PFK). The enzyme isoform found in muscle (PFK-M) is activated by micromolar (physiological) concentrations of its product fructose 1-6-bisphosphate (FBP) (Tornheim and Lowenstein, 1976), and PFK-M is the most active PFK isoform in islet cells (Yaney et al., 1995). The substrate, product, and feedback pathways for PFK-M are illustrated in Fig. 1. The Smolen model for PFK activity incorporates the activation by FBP and AMP and the inhibition by ATP. A more recent model for glycolytic oscillations in β-cells, in combination with the electrical component of the model, could have produced the results described below, although it does not include the activation/inhibition by AMP/ATP (Westermark and Lansner, 2003).
FIGURE 1.
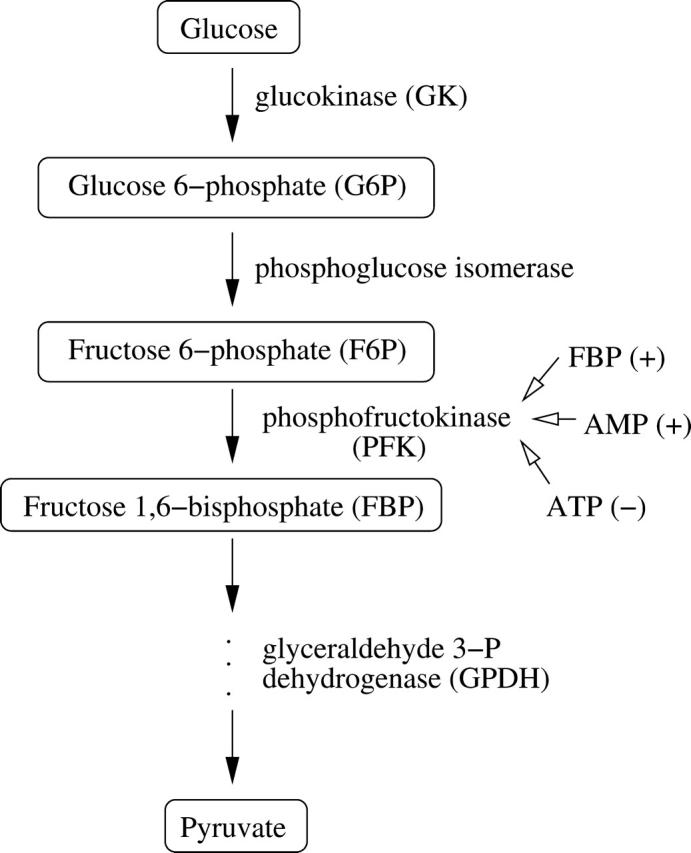
Illustration of a portion of the glycolytic pathway, highlighting the allosteric enzyme PFK and its positive and negative regulators.
The glycolysis model consists of equations for glucose 6-phosphate (G6P) and FBP:
 |
(18) |
 |
(19) |
The concentrations of G6P and fructose 6-phosphate (F6P) are assumed to be in equilibrium through rapid catalytic activity of the enzyme phosphoglucose isomerase. They satisfy the equilibrium relation:
 |
(20) |
The parameter λ = 0.005 in Eqs. 18 and 19 converts milliseconds to seconds and increases the frequency of glycolytic oscillations by a factor of 5 with respect to the earlier Smolen model (1995). RGK is the constant glucokinase reaction rate, and  is the GPDH reaction rate (Tornheim, 1979). The PFK reaction, RPFK, reflects the binding of activators (adenosine monophosphate (AMP) and FBP), an inhibitor (ATP), and the substrate F6P (= 0.3G6P). ATP is both a substrate and an inhibitor of PFK. As substrate, it is assumed to be saturating, so is not explicitly included in the model. The PFK reaction rate function, as well as other details of the glycolytic model, can be found in Smolen (1995). In particular, Eqs. 3 and 12 of Smolen (1995) are used to describe the PFK reaction.
We assume that the total concentration of adenine nucleotides is conserved,
 |
(21) |
Glycolysis provides input to the mitochondria and responds to changes in the nucleotide concentrations (AMP and ATP are activators and inhibitors of PFK, respectively). The AMP concentration is set by adenylate kinase, which converts two molecules of ADP to one molecule of AMP and one of ATP. We assume that this process is at equilibrium, so that
 |
(22) |
Keizer and Magnus (1989) developed a model for the mitochondrial production of ATP, in which the production rate decreases with the concentration of free cytosolic Ca2+. A more detailed model was developed later (Magnus and Keizer, 1998a), but the simpler model used here is sufficient for our purposes. Keizer and Magnus suggested that the negative effect of Ca2+ on ATP production was due to mitochondrial Ca2+ flux depolarizing the mitochondrial membrane potential, thus short-circuiting metabolism. Experiments later verified that the mitochondrial membrane potential does indeed depolarize when the cytosolic Ca2+ concentration is increased (Krippeit-Drews et al., 2000; Nunemaker et al., 2004).
The Keizer-Magnus model omits the relatively minor contribution of glycolysis to ATP production. Instead, a steady-state flux through the glycolytic pathway is assumed to provide a constant driving force for mitochondrial ATP production. We modify the Keizer-Magnus model by including the time dynamics of glycolysis, and use the GPDH reaction rate (RGPDH; defined above) as a measure of the time-varying flux through the glycolytic pathway. Specifically, we write a differential equation for the ADP concentration that includes the effects of cytosolic Ca2+ and the effects of glycolysis:
 |
(23) |
The Ca2+ effect is through the factor  increases in Ca2+ concentration lead to increases in ADP. The total substrate-dependent rate is r + γ. Input from glycolysis is incorporated through the function γ, which depends on the GPDH rate. We describe this with a sigmoidal function of Michaelis-Menten form:
 |
(24) |
where νγ and kγ are constants, and  The dependence of ADP on γ (and thus on FBP) is the pathway through which glycolytic oscillations are transduced into oscillations in nucleotide production. In the earlier Keizer-Magnus model the factor γ was not included (Keizer and Magnus, 1989). The parameter
  min is a slow time constant.
Values of all parameters used in the model are given in Table 1. Details of the model not described here and discussion of parameters can be found in Bertram and Sherman (2004), Keizer and Magnus (1989), Magnus and Keizer (1998a), or Smolen (1995). The differential equations were integrated numerically with the CVODE solver in the software package XPPAUT (Ermentrout, 2002). The computer code for the model can be downloaded from www.math.fsu.edu/∼bertram or mrb.niddk.nih.gov/sherman.
TABLE 1.
Values of parameters used in the model
| pleak = 0.0002 ms−1 | Vcyt/Ver = 31 | kSERCA = 0.4 ms−1 | VK = −75 mV |
| VCa = 25 mV | gK = 2700 pS | gCa = 1000 pS | Cm = 5300 fF |
| vm = −20 mV | vn = −16 mV | sm = 12 mV | sn = 5 mV |
| τn = 20 ms | KD = 0.5 μM | gK(Ca) = 600 pS | α = 4.5 × 10⁻⁶ fA−1μM ms−1 |
| kPMCA = 0.2 ms−1 | fcyt = 0.01 | fer = 0.01 | gK(ATP) = 25 nS |
| Atot = 3000 μM | νγ = 2.2 | kγ = 10 μM s−1 | RGK = 0.2 s−1 |
| Kdd = 17 μM | Ktd = 26 μM | Ktt = 1 μM | τa = 300,000 ms |
| r = 1 | r1 = 0.35 μM | Vmax = 1 μM s−1 | λ = 0.06 |
| K1 = 30 μM | K2 = 1 μM | K3 = 50,000 μM | K4 = 1000 μM |
| K5 = 1000 μM | f13 = 0.02 | f23 = 0.2 | f41 = 20 |
| f42 = 20 | f43 = 20 | f53 = 20 | – |
Islet preparation and culture
Mouse islets were isolated from the pancreases of Swiss-Webster mice by collagenase digestion (Zhang et al., 2003). Islets were cultured on glass coverslips in petri plates and cultured in RPMI-1640 medium containing fetal bovine serum, l-glutamine, and penicillin/streptomycin (Gibco, Grand Island, NY). All cultures were kept at 37°C in an air/CO2 incubator for 1–2 days.
Ca2+ concentration measurements
Cultured islets were loaded with the Ca2+-sensitive dye fura-2/AM (Molecular Probes, Eugene, OR). Fura-2-AM (2 μmol/l) and 1 μl of 2.5% pluronic acid were added to islets in 35-mm culture dishes containing 1 cc of medium and islets were incubated for 30 min at 37°C. After this fura-2 loading, the islets were washed and then incubated in standard external solution for 20 min. The Ca2+ concentration (Ca) was measured by placing the islets in a small recording chamber mounted on the stage of an Olympus IX-50 inverted epifluorescence microscope (Olympus, Tokyo, Japan). Fura-2 was excited at 340 and 380 nm using a high-speed photometry system employing a galvanometer-driven mirror to alternate light from a xenon light source between two prisms (HyperSwitch, IonOptix, Milton, MA). A photomultiplier and photon counting were used to quantify fura-2 emission at 510 nm (Ionoptix). Fluorescence data were acquired and analyzed using IonWizard software (IonOptix).
Absolute Ca was determined from the fluorescence ratio (R) of Ca2+-bound fura-2 (excited at 340 nm) to unbound fura-2 (excited at 380 nM). The Ca levels of individual islets were determined using a standard equation for calibration (Grynkiewicz et al., 1985). Rmax and Rmin were obtained by adding ionomycin (10 μM) or EGTA (1 mM), respectively, to fura-2 loaded islets at the end of each experiment, and the Kd of fura-2 was assumed to be 224 nM (see Zhang et al., 2003 for details).
Solutions were applied to islets using a gravity-driven perifusion system with flow rates of 1 ml/min. The experimental bath solution was exchanged within 30 s. All experiments were carried out at 32–35°C using a feedback controller (CellMicro Controls, Virginia Beach, VA).
Data analysis and graphics were implemented using IgorPro Software (Wavemetrics, Lake Oswego, OR).
Electrophysiology
Islets were continuously superfused with an external solution that contained (in mM) 115 NaCl, 3 CaCl2, 5 KCl, 2 MgCl2, 10 HEPES, and 11.1 glucose (pH 7.2). Membrane potential was monitored using the perforated patch method. Pipettes were filled with an internal solution containing (in mM) 28.4 K2SO4, 63.7 KCl, 11.8 NaCl, 1 MgCl2, 20.8 HEPES, 0.5 EGTA, 0.3 mg/ml amphotericin B (pH 7.2). Seal resistances were 1–5 GΩ. An Axopatch-200B patch-clamp amplifier (Axon Instruments, Union City, CA) was used in the standard tight-seal current-clamp mode to record membrane potentials. Islet electrical activity was recorded from superficial cells in the islet, which were identified as β-cells by their characteristic bursting activity in 11.1 mM glucose. For additional experimental details, see Zhang et al. (2003).
RESULTS
The glycolytic subsystem is a conditional oscillator
The glycolytic component of the model, the G6P and FBP equations, has the ability to oscillate independently. That is, if the nucleotide concentrations are held constant (normally they are determined according to Eqs. 21–23), then it is possible for the glycolytic subsystem to oscillate. This is shown in Fig. 2 A. We show F6P rather than G6P, using the equilibrium relation Eq. 20. At the beginning of an oscillation the substrate F6P (solid line) rises, eventually reaching a level high enough to produce a pulse of PFK activity, leading to a rapid rise in the concentration of the product FBP (dashed line) and a decline in the substrate level as it is utilized by PFK. With the depletion of substrate, PFK activity is reduced, resulting in a reduction in product FBP concentration and an elevation of substrate F6P concentration. This completes one cycle of the oscillation, which has a period of ∼5 min.
FIGURE 2.

The glycolytic subsystem (Eqs. 18–20) isolated from other model components by holding the nucleotide concentrations fixed, with Atot = 3000 μM, ATP = 2000 μM, and ADP and AMP determined by Eqs. 21–23. (A) Oscillations are produced when RGK = 0.2 s−1. (B) After an initial transient, glycolysis is steady with the higher rate RGK = 0.4 s−1.
Although the glycolytic subsystem has the ability to oscillate, it will do so only if its parameter values are in the correct range. One parameter of particular interest is the glucokinase rate (RGK), which depends on the glucokinase concentration, the catalytic rate of the enzyme, and the glucose (substrate) concentration. An increase in the value of this parameter corresponds to an increase in the glucose concentration. When RGK is too small no oscillations in glycolysis are produced. Oscillations are produced at the larger value RGK = 0.2 s−1 (Fig. 2 A). However, when RGK is increased further, to 0.4 s−1, the glycolytic subsystem stops oscillating because the substrate level (F6P) cannot be sufficiently depleted (Fig. 2 B). From initial values of F6P = 81 μM and FBP = 5 μM the system settles into a steady state after a single transient oscillation. Thus, the glycolytic subsystem is a conditional oscillator, with oscillations produced only for intermediate values of RGK (the critical values of RGK between which oscillations occur depend on the parameter values of the PFK rate function). The ramifications of this are the focus of this article.
Bursting can occur without glycolytic oscillations
In our model, bursting electrical activity is typically driven by Ca2+-dependent processes, and can occur in the absence of glycolytic oscillations. This is illustrated in Fig. 3, where the full model is integrated (i.e., no variables are held fixed) and RGK = 0.4 s−1 so that the glycolytic subsystem is in a nonoscillatory mode. The bursting shown in Fig. 3 A is due to the combined effects of the two slowly changing conductances, gK(Ca) and gK(ATP) (Fig. 3, C and E). The K(Ca) conductance follows the time course of Ca, which is elevated during the active phase of spiking due to Ca2+ influx through Ca2+ channels, and low during the silent phase due to Ca2+ removal by plasma membrane pumps (Fig. 3 B). The K(ATP) conductance follows the time course of ADP (Fig. 3 D). This variable changes more slowly than Ca, reflected in the slow rise in gK(ATP) during the active phase and the slow fall during the silent phase. Spiking is terminated and the membrane enters the silent phase when the combined K+ conductances reach a sufficiently high level.
FIGURE 3.

Bursting driven by the interaction of Ca2+-dependent mechanisms. The glycolytic subsystem is put into a nonoscillatory mode by setting RGK = 0.4 s−1. Oscillations in ADP are due to oscillations in Ca and are in phase with Ca. The nucleotide oscillations produce rapid, small-amplitude oscillations in glycolytic variables such as FBP.
In this example, nucleotide oscillations are due entirely to activity-dependent oscillations in Ca. During the active phase, the elevation of Ca causes the levels of ADP to rise and ATP to fall (Magnus and Keizer, 1998a). During the silent phase Ca falls, causing ADP to decline and ATP to rise. Thus, the ADP concentration is in phase with Ca. The Ca2+-dependent nucleotide oscillations then feed back onto the glycolytic subsystem (because PFK activity is regulated by AMP and ATP), which by itself would be stationary. The nucleotide feedback causes the glycolytic variables to exhibit small-amplitude oscillations (Fig. 3 F). Notice that these oscillations are much more rapid (period ≈ 30 s) than the larger-amplitude oscillations observed when glycolysis is in an oscillatory mode (period ≈ 5 min). Although the oscillations in FBP affect the nucleotide time course (via RGPDH), this effect is negligible.
Glycolytic oscillations can convert regular bursting to compound bursting
The burst pattern illustrated in Fig. 3 A is similar to the “regular” periodic bursting often observed in electrical recordings from islets in vitro (Beigelman et al., 1977; Dean and Matthews, 1968) and in vivo (Sánchez-Andrés et al., 1995). In our model, this is “phantom bursting”, produced by the interaction of Ca2+-dependent mechanisms. Some electrical recordings, however, exhibit a multimodal, compound bursting pattern, composed of episodes of bursts or bursts having a slowly modulated plateau fraction (the ratio of active phase duration to the burst period) (Barbosa et al., 1998; Cook, 1983; Henquin et al., 1982). An example of compound bursting that we have recorded is shown in Fig. 4 A. Compound oscillations in cytosolic Ca2+ concentration have also been reported, with fast oscillations superimposed on slower oscillations (Krippeit-Drews et al., 2000; Valdeolmillos et al., 1989; Zhang et al., 2003). One example of this is shown in Fig. 4 B. Presumably, the compound Ca2+ oscillations reflect compound bursting patterns (Zhang et al., 2003).
FIGURE 4.
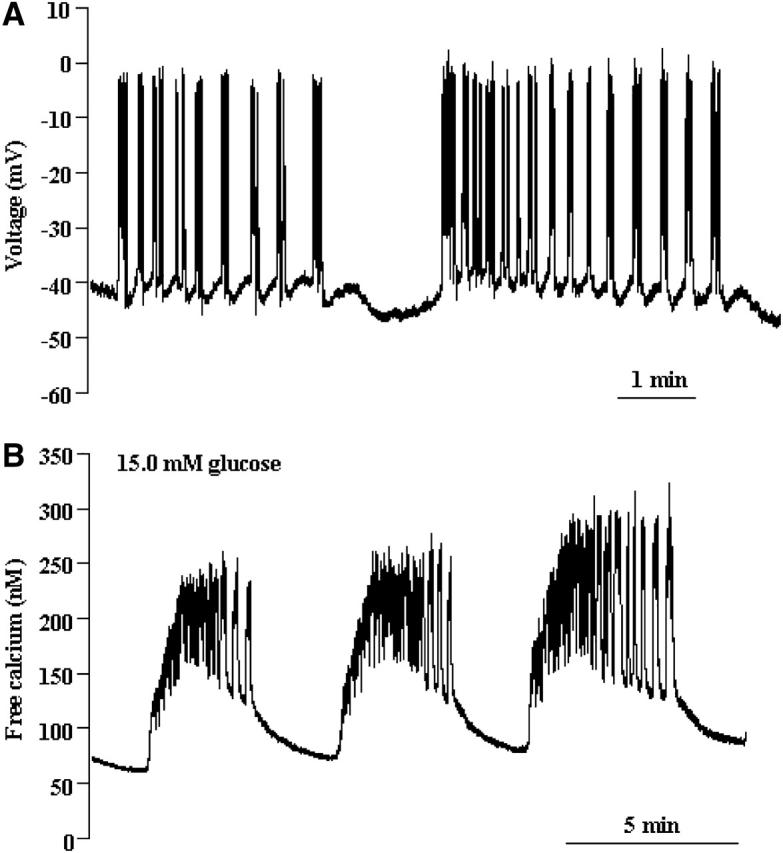
(A) Compound bursting recorded from a pancreatic islet. Two episodes of the compound burst are shown. (B) Compound oscillations in the intracellular Ca2+ concentration recorded from an islet. This pattern, composed of rapid oscillations superimposed on much slower oscillations, presumably reflects episodes of bursts in the electrical activity.
Fig. 5 illustrates one mechanism that can account for such compound patterns. In this example, RGK = 0.2 s−1 so that the glycolytic subsystem is in an oscillatory mode. Thus, periodic pulses of FBP are produced, with a period of ≈5 min (Fig. 5 B). Unlike the low-amplitude oscillations in FBP produced when the glycolytic subsystem is in a stationary mode (Fig. 3 F), these pulses are much slower and much larger in amplitude. Each FBP pulse leads to a pulse in GPDH, increasing mitochondrial ATP production at the expense of ADP (Fig. 5 C). The resulting increase in the ATP/ADP ratio reduces gK(ATP), and in turn depolarizes the cell. Once depolarized, the model cell produces bursts of impulses, driven by the Ca2+-dependent mechanisms described earlier. The final result is that bursts of impulses are clustered together into episodes of bursts (Fig. 5 A), and the cytosolic Ca2+ exhibits corresponding compound oscillations (Fig. 5 D). Each episode of bursts is initiated and terminated by FBP-induced changes in the ATP/ADP ratio, and the period of the slower component of the compound oscillation is set by the period of the glycolytic oscillation. The slow ADP oscillations are out of phase with the episodes of Ca2+ oscillations.
FIGURE 5.

Compound bursting produced by the interaction of Ca2+-dependent burst mechanisms and slower glycolytic oscillations. (A) A compound burst pattern consists of an episode of bursts followed by a long silent phase. (B) The slow rhythm responsible for initiating and terminating the bursting episode is provided by oscillations in the glycolytic subsystem. (C) Large, slow oscillations in ADP reflect oscillations in mitochondrial ATP production driven by glycolytic oscillations, and are out of phase with Ca. However, small deflections that occur in the trough are in phase with Ca and are due to negative effects of Ca2+ on respiration. (D) Compound Ca2+ oscillations parallel the compound bursting pattern. RGK = 0.2 s−1, 
Glycolytic oscillations can provide the slow mode for “accordion bursting”
One striking islet electrical pattern reported in the literature, but never fully accounted for, consists of 15-s bursts with a slowly modulated plateau fraction (Cook, 1983). This pattern, which we call “accordion bursting”, was produced by an earlier model (Wierschem and Bertram, 2004) and can be produced by this model when glycolytic oscillations are present, but when K(ATP) current does not reach a sufficiently high level to shut off electrical activity between the pulses of FBP. An example of this mode of bursting is illustrated in Fig. 6. Each pulse of FBP lowers the ADP level and increases the plateau fraction of the bursts. Between FBP pulses the ADP level rises and lowers the plateau fraction. However, because the maximum conductance of the K(ATP) current is lower than in the example shown in Fig. 5, bursting never shuts off, but continues until the next FBP pulse. Interestingly, in this electrical pattern the fast Ca2+ oscillations continue during all phases of the slow glycolytic oscillation (Fig. 6 D). Similar behavior has also been reported in recordings of free Ca2+ from islets (Bergsten et al., 1994; Kulkarni et al., 2004).
FIGURE 6.

A simulation of “accordion bursting”. The K(ATP) conductance is too low to terminate bursting between FBP pulses. (A) Accordion bursting is characterized by a slowly modulated plateau fraction. (B) Glycolytic oscillations provide the slow component. (C) The ADP concentration slowly rises and falls, with small deflections due to the effects of Ca2+ on ATP production. (D) Ca2+ oscillations occur during all phases of the slow glycolytic oscillation. RGK = 0.2 s−1, gK(ATP) = 23 nS, gK(Ca) = 600 pS.
Glycolytic oscillations can also drive slow “glycolytic bursting” and subthreshold oscillations
In addition to providing the slow waves responsible for compound and accordion bursting, glycolytic oscillations can also drive a slow form of bursting that we call “glycolytic bursting.” This is illustrated in Fig. 7, where RGK = 0.2 s−1 to induce glycolytic oscillations and K(Ca) conductance is reduced to  As in the previous examples, pulses of FBP are produced at 5-min intervals (Fig. 7 B), leading to declines in the ADP concentration due to mitochondrial ATP production from ADP (Fig. 7 C). However, unlike Fig. 5, the spiking initiated by the reduction in K(ATP) conductance cannot be terminated by IK(Ca) in this case because the K(Ca) conductance is too small. Thus, rather than a series of bursts, a single long burst is produced that terminates only when elevated Ca (Fig. 7 D) drives the ADP concentration (and thus the K(ATP) conductance) to a level sufficiently high to repolarize the membrane. Note that Ca is larger in amplitude and more rounded than that in Fig. 3 B, and is similar in shape and period to some free Ca2+ measurements reported in the literature (Bergsten et al., 1994; Dryselius et al., 1999). The glycolytic bursting that is produced has a very long period, and the active phase is initiated by the FBP-induced decline in ADP and terminated by the Ca2+-induced rise in ADP (Fig. 7 C). We propose that the slow Ca2+ oscillations produced through glycolytic (Fig. 7 D) or compound bursting (Fig. 5 D) are responsible for the insulin oscillations that have been observed to occur with a period of 5–10 min (Cunningham et al., 1996; Longo et al., 1991; Pørksen et al., 2002).
FIGURE 7.

Slow “glycolytic bursting” is driven by glycolytic oscillations. The active phase of the burst is initiated by the FBP-induced fall in ADP and is terminated by the Ca2+-induced rise in ADP. RGK = 0.2 s−1, 
Because in our model the glycolytic subsystem can generate oscillations independently of the other model components, it is possible for glycolytic oscillations to occur even in the absence of electrical activity. To observe this, we increased K(ATP) conductance to ensure that the model cell cannot reach the threshold for impulse initiation. Then, with RGK = 0.2 s−1 to induce glycolytic oscillations, the model cell generates slow subthreshold oscillations in membrane potential and Ca2+ concentration (Fig. 8). Experimental evidence for such oscillations is discussed later.
FIGURE 8.

Slow subthreshold oscillations in membrane potential and Ca2+ concentration produced by glycolytic oscillations, which can persist in the absence of electrical activity. RGK = 0.2 s−1, gK(ATP) = 30 nS, gK(Ca) = 100 pS.
ADP is out of phase with Ca2+ during glycolytic oscillations, but in phase during Ca2+-driven bursting
To determine whether Ca2+ oscillations drive or are driven by nucleotide oscillations, one obvious procedure is to compare the time courses of the Ca2+ concentration and, for example, the ADP concentration. Indeed, determining the phase relationships between Ca2+ and various metabolic variables has been the goal of several recent experimental studies (Deeney et al., 2001; Jung et al., 2000; Nilsson et al., 1996; Porterfield et al., 2000). Such comparisons can be helpful in distinguishing cause and effect, but they can also be misleading. To illustrate these points, we normalized and replotted the Ca2+ (solid line) and ADP (dashed line) concentrations from Figs. 3, 5, 7, and 8 to facilitate time-course comparison (Fig. 9). The normalized time courses taken from Fig. 8, where glycolytic oscillations produce subthreshold voltage and Ca2+ oscillations, are shown in Fig. 9 A. Here Ca2+ and ADP are clearly out of phase, with ADP rising while Ca2+ declines, and declining while Ca2+ rises. One could conclude from this that an increase in Ca2+ concentration causes the ADP concentration to decline (and ATP to rise), as would be expected from the effect of Ca2+ to stimulate mitochondrial dehydrogenases (Rutter et al., 1993). However, this conclusion is incorrect for this model, because we know that this behavior is produced by glycolytic oscillations, which result in oscillations in Ca2+ concentration.
FIGURE 9.

Normalized Ca2+ and ADP time courses. Time is scaled to show one complete oscillation period in each case. (A) From Fig. 8, where glycolysis drives subthreshold Ca2+ oscillations. (B) From Fig. 3, where glycolysis is stationary and bursting is produced through Ca2+-dependent mechanisms. (C) From Fig. 7, where bursting is driven by glycolytic oscillations. (D) From Fig. 5, one period of compound bursting.
Although this example illustrates the potential danger of time-course comparison, Fig. 9, B–D, shows that such a comparison can also be revealing. The normalized time courses taken from Fig. 3, where Ca2+-driven bursting produces oscillations in the nucleotide concentrations, are shown in Fig. 9 B. In this case, Ca and ADP are in phase, but Ca reaches its plateau level long before ADP has significantly accumulated. Thus, one may (correctly) conclude that Ca2+ drives the nucleotide oscillation. In Fig. 9 C, with time courses taken from Fig. 7 where glycolytic oscillations drive bursting, the ADP concentration declines before the rise in Ca2+, so one may (correctly) conclude that the Ca2+ rise is brought about by the decline in ADP and the rise in ATP that accompany glycolytic oscillations. The rise in ADP concentration during the active phase of bursting in Fig. 9 C reflects the negative effect of Ca2+ on the mitochondrial production of ATP from ADP. Fig. 9 illustrates that, in our model, the ADP concentration is out of phase with the Ca2+ concentration during glycolytic oscillations, but in phase with Ca when the cell is electrically active. For example, Fig. 9 D exhibits an overall decline in ADP during an episode of compound bursting due to a glycolytic pulse in the FBP concentration (ADP and Ca2+ out of phase), with small increases during each burst (ADP and Ca2+ in phase). These small increases are also observed in accordion bursting (Fig. 6 C). Simultaneous measurements of oxygen and Ca2+ concentration in islets show patterns similar to those in Fig. 9 D: an episode of Ca2+ oscillations accompanies a decline in O2, and within an episode each Ca2+ elevation precedes a small rise in O2 (Fig. 8 of Jung et al., 2000). This is consistent with our model if O2 concentration rises (or falls) when the ADP concentration rises (or falls), as would be expected because mitochondrial respiration consumes oxygen.
The glycolytic subsystem exhibits bistability
Thus far, we have examined the behavior of the model using two values of the glucokinase rate, RGK = 0.2 s−1 and RGK = 0.4 s−1, which yield glycolytic oscillations or stationary glycolysis, respectively. We now demonstrate that in a third case, with RGK = 0.3 s−1, the glycolytic subsystem can either be stationary or oscillatory. That is, the glycolytic subsystem is bistable for this value of the glucokinase rate. This bistability is illustrated in Fig. 10, where we isolate the glycolytic subsystem from the other model components by fixing the nucleotide concentrations as in Fig. 2. Fig. 10 A shows FBP time courses starting from two different values of F6P. In one case (dashed line), the system is started with the initial condition F6P = 75 μM, FBP = 8 μM and comes to rest at the equilibrium F6P ≈ 64 μM, FBP ≈ 9.1 μM after some damped oscillations. In the other case (solid line), the system is started at F6P = 78 μM, FBP = 8 μM, but does not come to rest. Instead it oscillates with a period of ∼5 min. These divergent behaviors are best viewed in the F6P-FBP plane (Fig. 10 B). Although the trajectories start close together, they quickly diverge as one (dashed line) spirals into a steady state while the other (solid line) spirals out to a stable oscillation. Thus, for the same value of the RGK parameter, the glycolytic subsystem can either approach a stable steady state or can produce stable periodic oscillations. The values of the initial conditions determine which of these two long-term behaviors will prevail.
FIGURE 10.

The glycolytic subsystem is bistable when RGK = 0.3 s−1. Nucleotide concentrations are fixed as in Fig. 2. (A) The FBP time courses started from identical values of FBP, but slightly different values of F6P (75 μM and 78 μM for dashed and solid curves, respectively). (B) The two trajectories in the F6P-FBP plane. One trajectory (dashed line) spirals into a steady state, whereas the other (solid line) produces a stable oscillation.
The bistability of the glycolytic subsystem leads to an interesting model prediction: under conditions where bistability occurs, it should be possible to perturb the system from one type of behavior to the other if the basin of attraction of each stable solution is sufficiently large. For example, if the system is initially oscillatory and parameter values are changed but later returned to their earlier values, it should be possible for the system to become attracted to the steady state rather than the periodic oscillation. Thus, the transient change in the parameter values resets the initial conditions, and could be sufficient to convert oscillatory glycolysis to stationary glycolysis. In terms of the full system, oscillatory glycolysis produces compound, accordion, or glycolytic bursting, whereas with stationary glycolysis regular bursting is produced. Thus, the prediction is that a transient change of parameter values could be sufficient to convert compound, accordion, or glycolytic bursting to a regular bursting pattern.
This prediction was tested using isolated mouse pancreatic islets by transiently removing stimulatory glucose (11.1 mM) from the bath, and then adding it back several minutes later. This is illustrated with free Ca2+ recordings made with fura-2 loaded islets in Fig. 11. In Fig. 11 A slow oscillations in Ca were present in 11.1 mM glucose, likely corresponding to glycolytic bursting. Indeed, the Ca2+ recording is similar in shape and period to that produced by the model during glycolytic bursting (Fig. 7 D). After 18 min glucose is removed from the bath, and is added back 5 min later at the original 11.1 mM concentration. Upon glucose reapplication the oscillations in Ca are much faster, with a period of ∼25 s. These oscillations likely correspond to a regular, Ca2+-dependent bursting pattern, where glycolysis is nonoscillatory. (There is a small-amplitude slow oscillation in the Ca2+ recording that may be due to transient ringing of the glycolytic subsystem.) A Ca2+ recording from another islet is shown in Fig. 11 B. With glucose at 11.1 mM this islet exhibited a compound oscillation in Ca, likely reflecting compound bursting. Glucose was then removed from the bath and added back (at the same concentration) 5 min later. Upon reapplication, the islet no longer exhibited compound oscillations, but instead produced fast oscillations, likely corresponding to fast bursting oscillations. Thus, the data in Fig. 11 are consistent with our model prediction that, for some region in parameter space, the glycolytic system is bistable and therefore can be perturbed from an oscillatory state (resulting in compound, accordion, or glycolytic bursting) to a stationary state (resulting in a much faster and regular burst pattern).
FIGURE 11.
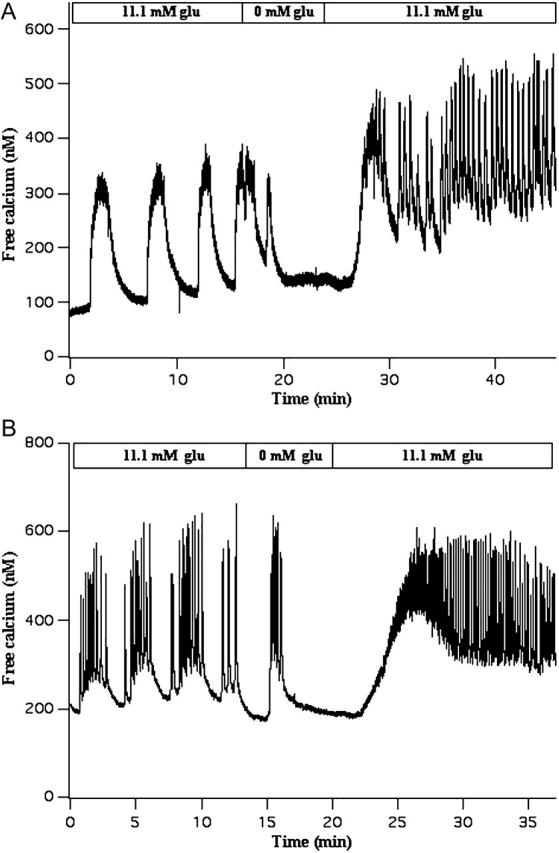
Experimental test of the model prediction that, for some region in parameter space, the glycolytic subsystem is bistable and can potentially be perturbed from an oscillatory state to a stationary state. Glucose is transiently removed from the bath, and then added back at the same concentration. (A) Slow Ca2+ oscillations that likely reflect glycolytic bursting are converted into much faster oscillations that likely reflect Ca2+-driven bursting. (B) Compound Ca2+ oscillations that likely reflect compound bursting are converted to very fast Ca2+ oscillations that likely reflect fast Ca2+-driven bursting.
DISCUSSION
Using mathematical modeling, we have illustrated how glycolytic oscillations can interact with Ca2+-driven nucleotide oscillations to produce a wide repertoire of rhythmic behaviors in pancreatic islets. Thus, when the glycolytic subsystem is stationary, activity-dependent Ca2+ oscillations produce regular (and typically faster) bursting patterns (Fig. 3). However, when the glycolytic subsystem is oscillatory, compound bursting (Figs. 4 and 5), accordion bursting (Fig. 6), or glycolytic bursting (Fig. 7) can be produced. If the membrane is tonically hyperpolarized, as can be achieved after the application of Ca2+ channel blockers or K+ channel agonists, glycolytic oscillations can result in subthreshold oscillations in membrane potential and Ca2+ concentration (Fig. 8). Comparing the time courses of the concentrations of Ca2+ and nucleotides may be useful in determining which component drives the oscillations and which follows (Fig. 9). An important prediction made by the model is that the ADP concentration is out of phase with the Ca2+ concentration during glycolytic oscillations, but in phase with Ca2+ when the cell is electrically active (Fig. 9). This is particularly evident in the cases of compound bursting and accordion bursting. In these cases, slow rhythmic ADP oscillations are driven by glycolysis. Superimposed on these slow rhythms are more rapid ADP increases during the active phase of each burst (Figs. 6 C and 9 D). In the case of compound bursting, the multimodal nucleotide oscillation of the model has similar appearance to oxygen oscillations recorded from mouse islets, and has the correct phase with respect to the intracellular Ca2+ concentration (Jung et al., 2000).
Another model prediction is that there is a parameter range in which the glycolytic subsystem is bistable: for the same set of parameter values the system may oscillate or be stationary (Fig. 10). This leads to the prediction that it should be possible to perturb the system from a slow glycolytic or compound burst pattern to a faster Ca2+-driven burst pattern by transiently altering the value of one or more parameters and then resetting it to its original value. This prediction was tested experimentally by removing glucose from the bath and then adding it back at the same concentration. This maneuver converted slow or compound Ca2+ oscillations into much more rapid oscillations (Fig. 11), as predicted by the model.
The primary goal of this study was to reconcile various experimental data about the role of oscillatory glycolysis in islet activity. One set of experiments shows oscillations in oxygen consumption, a marker for metabolic activity, that parallel oscillations in Ca2+ concentration and insulin secretion (Tornheim, 1997). Oscillations in oxygen consumption can persist in the absence of external Ca2+, demonstrating that in at least some cases oxygen oscillations do not require Ca2+ influx (Porterfield et al., 2000). Oscillations in the glycolytic variable G6P have also been reported in β-cells (Nilsson et al., 1996), and oscillations in insulin secretion have been observed in islets that are tonically depolarized (Cunningham et al., 1996). Two studies performed in low glucose also support the presence of glycolytic oscillations in β-cells. In one study, oscillations were observed in patch-clamp recordings of K(ATP) channel activity (Dryselius et al., 1994). In another, oscillations in the cytosolic Ca2+ concentration were observed in islets at a subthreshold glucose level (Longo et al., 1991). Because the β-cells were not electrically active at the low glucose concentrations used in these experiments, rhythmic glycolysis is a likely mechanism for the oscillations.
We next consider examples in the literature that at first glance do not appear to support glycolytic oscillations as a basis for islet nucleotide oscillations, but may be compatible on closer examination. For example, Kennedy and co-workers observed that slow islet oxygen oscillations were abruptly terminated when islets were exposed to the K(ATP) channel agonist diazoxide, apparently arguing for a Ca2+-driven mechanism for metabolic oscillations (Kennedy et al., 2002). This observation also seems to contradict our model hypothesis that slow nucleotide oscillations can persist when the islet is hyperpolarized (Fig. 8). However, on further examination, there may be no contradiction. Thus, when the cell's electrical activity is inhibited by diazoxide the intracellular concentration of Ca2+ is known to decline significantly. We would predict that this should in turn lead to an increase in the ATP level, for two reasons. First, the low Ca2+ concentration observed in the presence of diazoxide would reduce the Ca2+-dependent inhibition of ATP production (the Keizer-Magnus mechanism included in our model; Eq. 23). Second, the amount of work required by plasma membrane and SERCA pumps to handle elevated intracellular Ca would be reduced, decreasing ATP utilization (Detimary et al., 1998). The resulting increase in ATP could then terminate glycolytic oscillations because PFK is inhibited by ATP (Malaisse et al., 1976). Indeed, a modified version of our model that incorporates ATP utilization (e.g., by pumps) confirms this behavior (simulation not shown). Thus, depending on the amount of ATP utilized by Ca2+ pumps and the sensitivity of PFK to inhibition by ATP, it is possible for nucleotide oscillations either to continue (as in Fig. 8) or be terminated (as in Fig. 5 of Kennedy et al., 2002) when the membrane is hyperpolarized. Indeed, in other experimental studies, slow oscillations were found to persist (with reduced amplitude, but similar period) when islets were hyperpolarized by blocking Ca2+ channels with nifedipine (Jung et al., 1999) or when Ca2+ was removed from the bathing medium (Porterfield et al., 2000).
Our hypothesis, supported by mathematical modeling, is that the regular bursting patterns typically observed in islets in vitro are driven by Ca2+ through a direct effect on K(Ca) ion channels and an indirect effect, through the ATP/ADP ratio, on K(ATP) channels (Bertram and Sherman, 2004). However, glycolytic oscillations also occur, and they can have a dramatic effect on islet electrical activity, leading to compound bursting, accordion bursting, or glycolytic bursting. There is ample evidence for compound bursting and accordion bursting in islets (Barbosa et al., 1998; Bergsten et al., 1994; Cook, 1983; Henquin et al., 1982; Kulkarni et al., 2004), and a role for glycolytic oscillations in this type of bursting is compelling. However, it is not apparent whether the very slow oscillations in Ca2+ concentration that have been reported (Fig. 11; Valdeolmillos et al., 1989; Zhang et al., 2003) are due to a Ca2+-dependent mechanism or due to glycolytic oscillations. One way to determine the mechanism is to attempt to reset the islet by injecting a brief current pulse (Cook et al., 1981). With this maneuver it should be possible to reset the burst from active phase to silent phase or vice versa if the bursting is driven by Ca2+-dependent mechanisms (Smolen and Sherman, 1994), but not if the bursting is driven by glycolytic oscillations (Zimliki, 2001). It has been shown that one type of slow bursting oscillation in islets, that is produced when epinephrine is added to a bath containing a stimulatory level of glucose, can be reset from the silent to the active phase by depolarization with a pulse of potassium chloride, suggesting that this type of bursting is driven by a Ca2+-dependent process or processes (Zimliki, 2001). We predict that in the case of compound bursting the fast, inner oscillation can be reset, but not the slow outer oscillation.
There is considerable synchronization within an islet and between islets. Electrical recordings from different cells within an islet, both in vitro and in vivo, have shown that regular bursting occurs in near synchrony throughout the islet (although individual action potentials are not synchronized) (Meissner, 1976; Valdeolmillos et al., 1996). In addition, Ca2+ recordings from islets measure the average Ca2+ concentration throughout the outer layer of the islet, and oscillations in these recordings could only be observable if the cells were synchronized (Santos et al., 1991; Valdeolmillos et al., 1993). Otherwise, phase differences among the cells would average out any oscillatory signal. There is also interislet synchronization in vivo. Oscillations in blood insulin concentration are reliably observed in healthy animals and humans (Pørksen, 2002). Again, if the rhythmic secretion from different islets were not synchronized, then phase shifts between the islets would average out the oscillations and no oscillatory signal could be measured. How can glycolytic oscillations be synchronized within an islet and between islets? This question will be addressed elsewhere (M. G. Pedersen, R. Bertram, and A. Sherman, unpublished data).
Given synchrony, the model of compound oscillations suggests a way in which to resolve a longstanding discrepancy between the responses to glucose of electrical activity and insulin secretion. A vast literature (Atwater et al., 1989; Beigelman et al., 1977; Santos et al., 1991) indicates that glucose modulates the temporal characteristics (i.e., increases the plateau fraction) of electrical and Ca2+ oscillations with little or no change in amplitude. On the other hand, insulin oscillations are reported to increase in amplitude with little or no change in frequency as glucose is increased (Bergsten, 1998; Bergsten and Hellman, 1993; Cunningham et al., 1996; Westerlund et al., 1996). We point out that the electrical and Ca2+ measurements have mostly considered the faster, “inner oscillation”, whereas the secretion measurements have mostly considered the slower, “outer oscillation”. The fast and slow oscillations in our model have precisely the glucose response characteristics found in those disparate sets of experiments (not shown). That is, a simulated increase in glucose concentration increases the plateau fraction of the bursts (the inner oscillations), but has little effect on the frequency of the glycolytic outer oscillations. Because of the increased plateau fraction of the inner oscillations, the amount of insulin secreted during an episode of bursts is increased. As the exception that proves the rule, some studies of very slow Ca2+ or Ba2+ oscillations found little or no change in frequency when the glucose concentration was varied, although oscillations were abolished by both very low and very high glucose (Bergsten, 1998; Bergsten et al., 1994; Liu et al., 1994). These properties parallel those of the slow glycolytic bursting in our model (not shown).
We propose that the increase in plateau fraction of the fast electrical oscillations may contribute to the increase in insulin secretion amplitude by raising the mean cytosolic Ca2+ level during the oscillatory episodes. Thus, the glycolytic oscillator would act as a metronome that paces the electrical oscillations, and the secretory machinery would count up the calcium entry that accumulates during each episode. Insulin “burst mass” would then increase accordingly as glucose increased.
The model also unifies the so-called K(ATP)-dependent and K(ATP)-independent (amplifying) pathways of insulin secretion, because respiration slowly oscillates in phase with Ca2+ (Fig. 9, A, C, and D). Thus, along with ATP, any mitochondrially derived amplifying signal (Gembal et al., 1993; Maechler and Wollheim, 1999) would likely be increased at the same time that calcium is elevated, when it could do the most good. This appealing feature would not hold for a purely electrical oscillation (Fig. 9 B), although such a model is also capable of generating slow oscillations in metabolism through the inhibitory effect of Ca2+ on respiration (Bertram and Sherman, 2004).
Acknowledgments
This work was partially supported by National Science Foundation grant DMS-0311856 to R.B. and National Institutes of Health grant R01 DK-46409 to L.S. The research of P.S. was supported by National Institutes of Health grant P01NS38310.
References
- Ämmälä, C., P.-O. Larsson, P.-O. Berggren, K. Bokvist, L. Juntti-Berggren, H. Kindmark, and P. Rorsman. 1991. Inositol trisphosphate-dependent periodic activation of a Ca2+-activated K+ conductance in glucose-stimulated pancreatic β-cells. Nature. 353:849–852. [DOI] [PubMed] [Google Scholar]
- Ashcroft, F. M., D. E. Harrison, and S. J. H. Ashcroft. 1984. Glucose induces closure of single potassium channels in isolated rat pancreatic β-cells. Nature. 312:446–448. [DOI] [PubMed] [Google Scholar]
- Atwater, I., P. Carroll, and M. X. Li. 1989. Electrophysiology of the pancreatic β-cell. In Insulin Secretion. B. Drazin, S. Melmed, and D. LeRoith, editors. Alan R. Liss, New York, NY. 49–68.
- Atwater, I., C. M. Dawson, A. Scott, G. Eddlestone, and E. Rojas. 1980. The nature of the oscillatory behavior in electrical activity for the pancreatic β-cell. In Biochemistry and Biophysics of the Pancreatic β-Cell. G. Thieme, editor. Verlag, New York, NY. 100–107. [PubMed]
- Barbosa, R. M., A. M. Silva, A. R. Tomé, J. A. Stamford, R. M. Santos, and L. M. Rosário. 1998. Control of pulsatile 5-HT/insulin secretion from single mouse pancreatic islets by intracellular calcium dynamics. J. Physiol. 510:135–143. [DOI] [PMC free article] [PubMed] [Google Scholar]
- Beigelman, P. M., B. Ribalet, and I. Atwater. 1977. Electrical activity of mouse pancreatic β-cells. II. Effects of glucose and arginine. J. Physiol. 73:201–217. [PubMed] [Google Scholar]
- Bergsten, P. 1995. Slow and fast oscillations of cytoplasmic Ca2+ in pancreatic islets correspond to pulsatile insulin release. Am. J. Physiol. 268:E282–E287. [DOI] [PubMed] [Google Scholar]
- Bergsten, P. 1998. Glucose-induced pulsatile insulin release from single islets at stable and oscillatory cytoplasmic Ca2+. Am. J. Physiol. 274:E796–E800. [DOI] [PubMed] [Google Scholar]
- Bergsten, P., E. Grapengiesser, E. Gylfe, A. Tengholm, and B. Hellman. 1994. Synchronous oscillations of cytoplasmic Ca2+ and insulin release in glucose-stimulated pancreatic islets. J. Biol. Chem. 269:8749–8753. [PubMed] [Google Scholar]
- Bergsten, P., and B. Hellman. 1993. Glucose-induced amplitude regulation of pulsatile insulin secretion from individual pancreatic islets. Diabetes. 42:670–674. [DOI] [PubMed] [Google Scholar]
- Bergsten, P., J. Westerlund, P. Liss, and P.-O. Carlsson. 2002. Primary in vivo oscillations of metabolism in the pancreas. Diabetes. 51:699–703. [DOI] [PubMed] [Google Scholar]
- Bertram, R., J. Previte, A. Sherman, T. A. Kinard, and L. S. S atin. 2000. The phantom burster model for pancreatic β-cells. Biophys. J. 79:2880–2892. [DOI] [PMC free article] [PubMed] [Google Scholar]
- Bertram, R., and A. Sherman. 2004. A calcium-based phantom bursting model for pancreatic islets. Bull. Math. Biol. 66:1313–1344. [DOI] [PubMed] [Google Scholar]
- Cook, D. L. 1983. Isolated islets of Langerhans have slow oscillations of electrical activity. Metabolism. 32:681–685. [DOI] [PubMed] [Google Scholar]
- Cook, D., D. J. Porte, and W. E. Crill. 1981. Voltage dependence of rhythmic plateau potentials of pancreatic islet cells. Am. J. Physiol. 240:E290–E296. [DOI] [PubMed] [Google Scholar]
- Cunningham, B. A., J. T. Deeney, C. R. Bliss, B. E. Corkey, and K. Tornheim. 1996. Glucose-induced oscillatory insulin secretion in perifused rat pancreatic islets and clonal β-cells (HIT). Am. J. Physiol. 271:E702–E710. [DOI] [PubMed] [Google Scholar]
- Dean, P. M., and D. R. Matthews. 1968. Electrical activity in pancreatic islet cells. Nature. 219:389–390. [DOI] [PubMed] [Google Scholar]
- Deeney, J. T., M. Köhler, K. Kubik, G. Brown, V. Schultz, K. Tornheim, B. E. Corkey, and P.-O. Berggren. 2001. Glucose-induced metabolic oscillations parallel those of Ca2+ and insulin release in clonal insulin-secreting cells. J. Biol. Chem. 276:36946–36950. [DOI] [PubMed] [Google Scholar]
- Detimary, P., P. Gilon, and J. C. Henquin. 1998. Interplay between cytoplasmic Ca2+ and the ATP/ADP ratio: a feedback control mechanism in mouse pancreatic islets. Biochem. J. 333:269–274. [DOI] [PMC free article] [PubMed] [Google Scholar]
- Dryselius, S., E. Grapengiesser, B. Hellman, and E. Gylfe. 1999. Voltage-dependent entry and generation of slow Ca2+ oscillations in glucose-stimulated pancreatic β-cells. Am. J. Physiol. 276:E512–E518. [DOI] [PubMed] [Google Scholar]
- Dryselius, S., P.-E. Lund, E. Gylfe, and B. Hellman. 1994. Variations in ATP-sensitive K+ channel activity provide evidence for inherent metabolic oscillations in pancreatic β-cells. Biochem. Biophys. Res. Commun. 205:880–885. [DOI] [PubMed] [Google Scholar]
- Ermentrout, G. B. 2002. Simulating, Analyzing, and Animating Dynamical Systems: A Guide to XPPAUT for Researchers and Students. SIAM, Philadelphia, PA.
- Gembal, M., P. Detimary, P. Gilon, Z. Y. Gao, and J. C. Henquin. 1993. Mechanisms by which glucose can control insulin release independently from its action on adenosine triphosphate-sensitive K+ channels in mouse β-cells. J. Clin. Invest. 91:871–880. [DOI] [PMC free article] [PubMed] [Google Scholar]
- Gilon, P., R. M. Shepherd, and J. C. Henquin. 1993. Oscillations of secretion driven by oscillations of cytoplasmic Ca2+ as evidenced in single pancreatic islets. J. Biol. Chem. 268:22265–22268. [PubMed] [Google Scholar]
- Goforth, P. B., R. Bertram, F. A. Khan, M. Zhang, A. Sherman, and L. S. Satin. 2002. Calcium-activated K+ channels of mouse β-cells are controlled by both store and cytoplasmic Ca2+: experimental and theoretical studies. J. Gen. Physiol. 114:759–769. [DOI] [PMC free article] [PubMed] [Google Scholar]
- Göpel, S. O., T. Kanno, S. Barg, L. Eliasson, J. Galvanovskis, E. Renström, and P. Rorsman. 1999. Activation of Ca2+-dependent K+ channels contributes to rhythmic firing of action potentials in mouse pancreatic β-cells. J. Gen. Physiol. 114:759–769. [DOI] [PMC free article] [PubMed] [Google Scholar]
- Grynkiewicz, G., M. Poenie, and R. Y. Tsien. 1985. A new generation of Ca2+ indicators with greatly improved fluorescence properties. J. Biol. Chem. 260:3440–3450. [PubMed] [Google Scholar]
- Henquin, J. C. 1988. ATP-sensitive K+ channels may control glucose-induced electrical activity in pancreatic β-cells. Biochem. Biophys. Res. Commun. 156:769–775. [DOI] [PubMed] [Google Scholar]
- Henquin, J. C., H. P. Meissner, and W. Schmeer. 1982. Cyclic variations of glucose-induced electrical activity in pancreatic B cells. Pflugers Arch. 393:322–327. [DOI] [PubMed] [Google Scholar]
- Hopkins, W., S. Fatherazi, B. Peter-Riesch, B. Corkey, and D. Cook. 1992. Two sites for adenine-nucleotide regulation of ATP-sensitive potassium channels in mouse pancreatic β-cells and HIT cells. J. Membr. Biol. 129:287–295. [DOI] [PubMed] [Google Scholar]
- Jung, S.-K., C. A. Aspinwall, and R. T. Kennedy. 1999. Detection of multiple patterns of oscillatory oxygen consumption in single mouse islets of Langerhans. Biochem. Biophys. Res. Commun. 259:331–335. [DOI] [PubMed] [Google Scholar]
- Jung, S.-K., L. M. Kauri, W.-J. Qian, and R. T. Kennedy. 2000. Correlated oscillations in glucose consumption, oxygen consumption, and intracellular free Ca2+ in single islets of Langerhans. J. Biol. Chem. 275:6642–6650. [DOI] [PubMed] [Google Scholar]
- Keizer, J., and G. Magnus. 1989. The ATP-sensitive potassium channel and bursting in the pancreatic β-cell. Biophys. J. 56:229–242. [DOI] [PMC free article] [PubMed] [Google Scholar]
- Kennedy, R. T., L. M. Kauri, G. M. Dahlgren, and S.-K. Jung. 2002. Metabolic oscillations in β-cells. Diabetes. 51:S152–S161. [DOI] [PubMed] [Google Scholar]
- Kozak, J. A., S. Misler, and D. E. Logothetis. 1998. Characterization of a Ca2+-activated K+ current in insulin-secreting murine beta TC-3 cells. J. Physiol. 509:355–370. [DOI] [PMC free article] [PubMed] [Google Scholar]
- Krippeit-Drews, P., M. Dufer, and G. Drews. 2000. Parallel oscillations of intracellular calcium activity and mitochondrial membrane potential in mouse pancreatic β-cells. Biochem. Biophys. Res. Commun. 267:179–183. [DOI] [PubMed] [Google Scholar]
- Kulkarni, R. N., M. G. Roper, G. M. Dahlgren, D. Q. Shih, L. M. Kauri, J. L. Peters, M. Stoffel, and R. T. Kennedy. 2004. Islet secretory defect in insulin receptor substrate 1 null mice is linked with reduced calcium signaling and expression of sarco(endo)plasmic reticulum Ca2+-ATPase (SERCA)-2b and -3. Diabetes. 53:1517–1525. [DOI] [PubMed] [Google Scholar]
- Larsson, O., H. Kindmark, R. Bränström, B. Fredholm, and P.-O. Berggren. 1996. Oscillations in KATP channel activity promote oscillations in cytoplasmic free Ca2+ concentration in the pancreatic beta cell. Proc. Natl. Acad. Sci. USA. 93:5161–5165. [DOI] [PMC free article] [PubMed] [Google Scholar]
- Liu, Y.-J., E. Grapengiesser, E. Gylfe, and B. Hellman. 1994. Glucose-induced oscillations of Ba2+ in pancreatic β-cells occur without involvement of intracellular mobilization. Arch. Biochem. Biophys. 315:387–392. [DOI] [PubMed] [Google Scholar]
- Longo, E. A., K. Tornheim, J. T. Deeney, B. A. Varnum, D. Tillotson, M. Prentki, and B. E. Corkey. 1991. Oscillations in cytosolic free Ca2+, oxygen consumption, and insulin secretion in glucose-stimulated rat pancreatic islets. J. Biol. Chem. 266:9314–9319. [PubMed] [Google Scholar]
- Maechler, P., and C. B. Wollheim. 1999. Mitochondrial glutamate acts as a messenger in glucose-induced insulin exocytosis. Nature. 402:685–689. [DOI] [PubMed] [Google Scholar]
- Magnus, G., and J. Keizer. 1998a. Model of β-cell mitochondrial calcium handling and electrical activity. I. Cytoplasmic variables. Am. J. Physiol. 274:C1158–C1173. [DOI] [PubMed] [Google Scholar]
- Magnus, G., and J. Keizer. 1998b. Model of β-cell mitochondrial calcium handling and electrical activity. II. Mitochondrial variables. Am. J. Physiol. 274:C1174–C1184. [DOI] [PubMed] [Google Scholar]
- Malaisse, W. J., A. Sener, and J. Levy. 1976. The stimulus-secretion coupling of glucose-induced insulin release: fasting-induced adaptation of key glycolytic enzymes in isolated islets. J. Biol. Chem. 251:1731–1737. [PubMed] [Google Scholar]
- Matthews, D. R., D. A. Lang, M. Burnett, and R. C. Turner. 1983. Control of pulsatile insulin secretion in man. Diabetologia. 24:231–237. [DOI] [PubMed] [Google Scholar]
- Meissner, H. P. 1976. Electrophysiological evidence for coupling between beta cells of pancreatic islets. Nature. 262:502–504. [DOI] [PubMed] [Google Scholar]
- Nilsson, T., V. Schultz, P.-O. Berggren, B. E. Corkey, and K. Tornheim. 1996. Temporal patterns of changes in ATP/ADP ratio, glucose 6-phosphate and cytoplasmic free Ca2+ in glucose-stimulated pancreatic β-cells. Biochem. J. 314:91–94. [DOI] [PMC free article] [PubMed] [Google Scholar]
- Nunemaker, C. S., M. Zhang, and L. S. Satin. 2004. Insulin feedback alters mitochondrial activity through an ATP-sensitive K+ channel-dependent pathway in mouse islets and β-cells. Diabetes. 53:1765–1772. [DOI] [PubMed] [Google Scholar]
- O'Rahilly, S., R. C. Turner, and D. R. Matthews. 1988. Impaired pulsatile secretion of insulin in relatives of patients with non-insulin-dependent diabetes. N. Engl. J. Med. 318:1225–1230. [DOI] [PubMed] [Google Scholar]
- Peschke, E., and D. Peschke. 1998. Evidence for a circadian rhythm of insulin release from perifused rat pancreatic islets. Diabetologia. 41:1085–1092. [DOI] [PubMed] [Google Scholar]
- Pørksen, N. 2002. The in vivo regulation of pulsatile insulin secretion. Diabetologia. 45:3–20. [DOI] [PubMed] [Google Scholar]
- Pørksen, N., M. Hollingdal, C. Juhl, P. Butler, J. D. Veldhuis, and O. Schmitz. 2002. Pulsatile insulin secretion: detection, regulation, and role in diabetes. Diabetes. 51:S245–S254. [DOI] [PubMed] [Google Scholar]
- Pørksen, N., S. Munn, J. Steers, S. Vore, J. Veldhuis, and P. Butler. 1995. Pulsatile insulin secretion accounts for 70% of total insulin secretion during fasting. Am. J. Physiol. 269:E478–E488. [DOI] [PubMed] [Google Scholar]
- Porterfield, D. M., R. F. Corkey, R. H. Sanger, K. Tornheim, P. J. S. Smith, and B. E. Corkey. 2000. Oxygen consumption oscillates in single clonal pancreatic β-cells (HIT). Diabetes. 49:1511–1516. [DOI] [PubMed] [Google Scholar]
- Rizzuto, R., M. Brini, M. Murgia, and T. Pozzan. 1993. Microdomains with high Ca2+ close to IP3-sensitive channels that are sensed by neighboring mitochondria. Science. 262:744–747. [DOI] [PubMed] [Google Scholar]
- Rutter, G. A., J.-M. Theler, M. Murgia, C. B. Wollheim, T. Pozzan, and R. Rizzuto. 1993. Stimulated Ca2+ influx raises mitochondrial free Ca2+ to supramicromolar levels in a pancreatic β-cell line. J. Biol. Chem. 268:22385–22390. [PubMed] [Google Scholar]
- Sánchez-Andrés, J., A. Gomis, and M. Valdeolmillos. 1995. The electrical activity of mouse pancreatic β-cells recorded in vivo shows glucose-dependent oscillations. J. Physiol. 486:223–228. [DOI] [PMC free article] [PubMed] [Google Scholar]
- Santos, R. M., L. M. Rosario, A. Nadal, J. Garcia-Sancho, B. Soria, and M. Valdeolmillos. 1991. Widespread synchronous [Ca2+]i oscillations due to bursting electrical activity in single pancreatic islets. Pflugers Arch. 418:417–422. [DOI] [PubMed] [Google Scholar]
- Simon, C., G. Brandenberger, and M. Follenius. 1987. Ultradian oscillations of plasma glucose, insulin, and C-peptide in man during continuous enteral nutrition. J. Clin. Endocrinol. Metab. 64:669–674. [DOI] [PubMed] [Google Scholar]
- Smolen, P. 1995. A model for glycolytic oscillations based on skeletal muscle phosphofructokinase kinetics. J. Theor. Biol. 174:137–148. [DOI] [PubMed] [Google Scholar]
- Smolen, P., and A. Sherman. 1994. Phase independent resetting in relaxation and bursting oscillators. J. Theor. Biol. 169:339–348. [DOI] [PubMed] [Google Scholar]
- Tornheim, K. 1979. Oscillations of the glycolytic pathway and the purine nucleotide cycle. J. Theor. Biol. 79:491–541. [DOI] [PubMed] [Google Scholar]
- Tornheim, K. 1997. Are metabolic oscillations responsible for normal oscillatory insulin secretion? Diabetes. 46:1375–1380. [DOI] [PubMed] [Google Scholar]
- Tornheim, K., and J. M. Lowenstein. 1974. The purine nucleotide cycle. IV. Interactions with oscillations of the glycolytic pathway in muscle extracts. J. Biol. Chem. 249:3241–3247. [PubMed] [Google Scholar]
- Tornheim, K., and J. M. Lowenstein. 1976. Control of phosphofructokinase from rat skeletal muscle: effects of fructose diphosphate, AMP, ATP, and citrate. J. Biol. Chem. 251:7322–7328. [PubMed] [Google Scholar]
- Valdeolmillos, M., A. Gomis, and J. V. Sánchez-Andrés. 1996. In vivo synchronous membrane potential oscillations in mouse pancreatic β-cells: lack of co-ordination between islets. J. Physiol. 493:9–18. [DOI] [PMC free article] [PubMed] [Google Scholar]
- Valdeolmillos, M., A. Nadal, B. Soria, and J. Garcia-Sancho. 1993. Fluorescence digital image analysis of glucose-induced [Ca2+]i oscillations in mouse pancreatic islets of Langerhans. Diabetes. 42:1210–1214. [DOI] [PubMed] [Google Scholar]
- Valdeolmillos, M., R. M. Santos, D. Contreras, B. Soria, and L. M. Rosario. 1989. Glucose-induced oscillations of intracellular Ca2+ concentration resembling electrical activity in single mouse islets of Langerhans. FEBS Lett. 259:19–23. [DOI] [PubMed] [Google Scholar]
- Westerlund, J., B. Hellman, and P. Bergsten. 1996. Pulsatile insulin release from mouse islets occurs in the absence of stimulated entry of Ca2+. J. Clin. Invest. 97:1860–1863. [DOI] [PMC free article] [PubMed] [Google Scholar]
- Westermark, P. O., and A. Lansner. 2003. A model of phosphofructokinase and glycolytic oscillations in the pancreatic β-cell. Biophys. J. 85:126–139. [DOI] [PMC free article] [PubMed] [Google Scholar]
- Wierschem, K., and R. Bertram. 2004. Complex bursting in pancreatic islets: a potential glycolytic mechanism. J. Theor. Biol. 228:513–521. [DOI] [PubMed] [Google Scholar]
- Yaney, G. C., V. Schultz, B. A. Cunningham, G. A. Dunaway, B. E. Corkey, and K. Tornheim. 1995. Phosphofructokinase isozymes in pancreatic islets and clonal β-cells (INS-1). Diabetes. 44:1285–1289. [DOI] [PubMed] [Google Scholar]
- Zhang, M., P. Goforth, A. Sherman, R. Bertram, and L. Satin. 2003. The Ca2+ dynamics of isolated mouse β-cells and islets: implications for mathematical models. Biophys. J. 84:2852–2870. [DOI] [PMC free article] [PubMed] [Google Scholar]
- Zimliki, C. L. 2001. Experimental and Theoretical Investigations of the Phantom Bursting Model for Pancreatic β-Cell Electrical Activity. PhD thesis. Johns Hopkins University, Baltimore, MD.