Abstract
In ether-à-go-go K+ channels, voltage-dependent activation is modulated by ion binding to a site located in an extracellular-facing crevice between transmembrane segments S2 and S3 in the voltage sensor. We find that acidic residues D278 in S2 and D327 in S3 are able to coordinate a variety of divalent cations, including Mg2+, Mn2+, and Ni2+, which have qualitatively similar functional effects, but different half-maximal effective concentrations. Our data indicate that ions binding to individual voltage sensors in the tetrameric channel act without cooperativity to modulate activation gating. We have taken advantage of the unique phenotype of Ni2+ in the D274A channel, which contains a mutation of a nonbinding site residue, to demonstrate that ions can access the binding site from the extracellular solution when the voltage sensor is in the resting conformation. Our results are difficult to reconcile with the x-ray structure of the KvAP K+ channel, in which the binding site residues are widely separated, and with the hydrophobic paddle model for voltage-dependent activation, in which the voltage sensor domain, including the S3–S4 loop, is near the cytoplasmic side of the membrane in the closed channel.
INTRODUCTION
In ether-à-go-go (eag) K+ channels, voltage-dependent activation is modulated by extracellular Mg2+, which binds to a site in the voltage sensor (Silverman et al., 2000). The main effect of Mg2+ is to slow activation kinetics (Terlau et al., 1996; Tang et al., 2000; Schönherr et al., 1999, 2002; Silverman et al., 2000). Measurements of ionic and gating currents indicate that ion binding directly affects movement of the voltage sensor, including forward and backward transitions in the activation pathway (Tang et al., 2000). We have previously shown that two acidic residues, D278 and D327, located in transmembrane segments S2 and S3, respectively, contribute to the Mg2+ binding site (Fig. 1 A) (Silverman et al., 2000). Neutralization mutations of these residues dramatically reduce or abolish the effect of Mg2+ on activation kinetics, and mimic the slowing of activation seen in Mg2+-bound wild-type channels. The results suggest that Mg2+ slows activation in part by shielding the charged side chains of D278 and D327. We have also obtained evidence that the analogous residues in HERG channels contribute to an ion-binding site (M. A. Lin and D. M. Papazian, unpublished data). Thus, an ion-binding site appears to be a common structural feature in the voltage sensor of members of the eag family of voltage-gated K+ channels. This binding site is likely to be located in a crevice of the protein that also contains a highly conserved acidic residue in S2, which corresponds to D274 in eag (Silverman et al., 2000).
FIGURE 1.
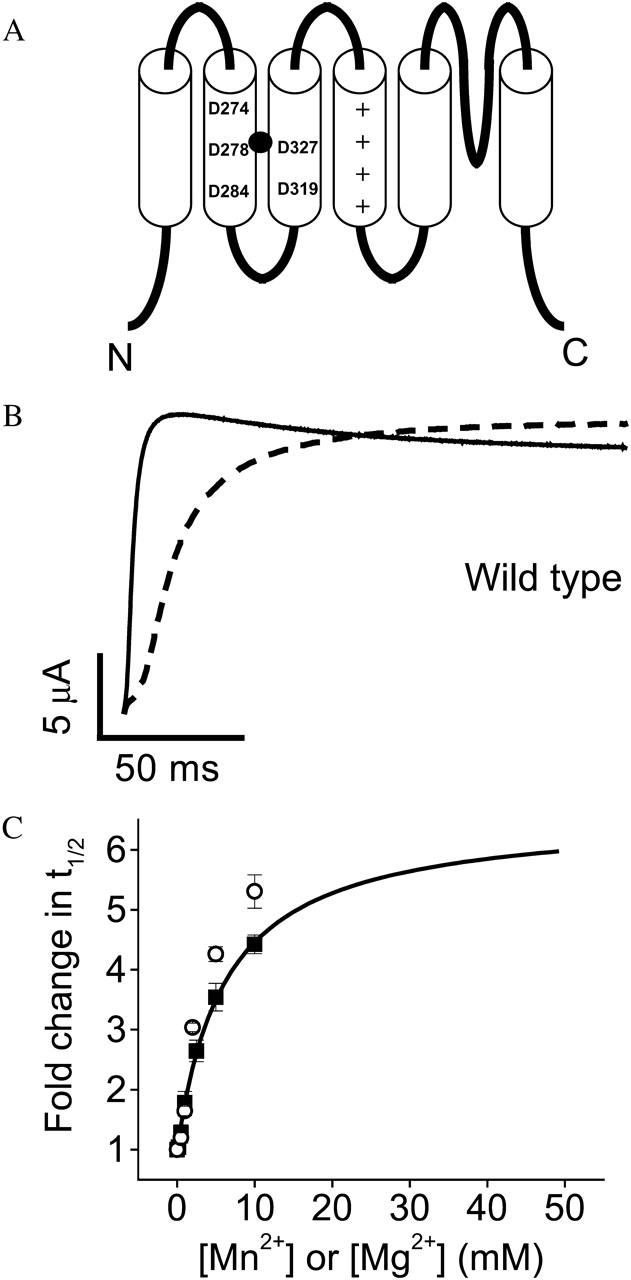
Extracellular Mn2+ slows activation of wild-type eag channels. (A) Cartoon of the membrane topology of the eag protein, including six transmembrane segments, S1–S6, and a re-entrant P-loop that forms the selectivity filter. The approximate positions of eag-specific acidic residues D278 in S2 and D327 in S3 are shown. These residues interact with a bound Mg2+ ion (solid circle) (Silverman et al., 2000). The approximate positions of D274 and D284 in S2 and D319 in S3 are also shown. These acidic residues are conserved throughout the superfamily of voltage-gated K+ channels (Chandy and Gutman, 1995). Symbols (+) denote conserved positively charged residues in S4. (B) From a holding potential of −80 mV, test pulses to +60 mV were applied in the absence (solid trace) or presence (dashed trace) of 10 mM Mn2+. (C) Values of t½ at +60 mV were measured in various concentrations of Mn2+ (▪), or Mg2+ (○), expressed as fold change in t½, and plotted as a function of concentration. Data are shown as mean ± SE, n = 4. The Mn2+ data were fitted with a rectangular hyperbola (solid curve) to estimate the maximal fold-change in t½ and the half-maximal effective concentration (see Table 1). The fitted curve has been extended beyond the data points to illustrate the predicted maximal effect of Mn2+. Mg2+ data are taken from Silverman et al. (2000).
A variety of divalent cations slow activation gating in eag channels (Terlau et al., 1996). We have presented evidence that Ni2+ binds in the same pocket as Mg2+ (Silverman et al., 2003). Interestingly, however, the action of Ni2+ differs from that of Mg2+ in at least two ways. First, neutralization of D327 to alanine, which eliminates Mg2+ sensitivity, does not eliminate Ni2+ sensitivity. Second, although channels containing a mutation of a nonbinding site residue, D274 in S2, to alanine, are sensitive to both Mg2+ and Ni2+, Ni2+ has a unique functional effect in the D274A mutant. Rather than slowing channel opening, Ni2+ decreases the current amplitude with no detectable change in activation kinetics (Silverman et al., 2003). Thus, Ni2+ blocks voltage-dependent activation in this mutant. We have presented evidence that this novel effect of Ni2+ in D274A derives from preventing the movement of a particular S4 charged residue, R353, into the binding site crevice where it would normally interact electrostatically with D274 in an intermediate closed conformation along the activation pathway (Silverman et al., 2003).
To further characterize the ion-binding site in the eag voltage sensor, we have compared the properties of three ions, Mn2+, Mg2+, and Ni2+. All three have qualitatively similar effects on activation kinetics. Ions binding to individual voltage sensors in the channel act without cooperativity to slow activation. Analysis of mutant channels indicates that Mn2+, Mg2+, and Ni2+ interact with D278 in S2 and D327 in S3, confirming that these residues are in proximity and form the ion-binding site in the voltage sensor. Taking advantage of the novel effect of Ni2+ on D274A channels, we have also demonstrated that extracellular cations can access the binding site in closed channels. Our results are incompatible with the x-ray structure of the KvAP channel, in which the binding site residues are widely separated, but are somewhat more compatible with the x-ray structure of its isolated voltage sensor (Jiang et al., 2003a). Furthermore, the finding that ions can access the site in closed channels is difficult to reconcile with the proposal by MacKinnon and co-workers that the S3–S4 loop is near the cytoplasmic surface of the membrane when the channel is closed (Jiang et al., 2003b).
MATERIALS AND METHODS
Molecular biology
Mutations were generated by polymerase-chain-reaction-based mutagenesis using either three or four primer strategies (Landt et al., 1990; Sarkar and Sommer, 1990). Polymerase-chain-reaction products were digested with the restriction enzymes EcoRV and SacII and ligated into a similarly digested pGEMHE subclone of wild-type eag as previously described (Tang and Papazian, 1997). The sequences of transferred regions were confirmed by dideoxy sequencing or Big Dye terminator sequencing (University of California at Los Angeles Sequencing Core Facility).
Constructs were linearized with NotI before in vitro transcription, using either the mMessage mMachine or MegaScript kits according to the manufacturer's protocols (Ambion, Austin, TX). RNA encoding wild-type or mutant eag was injected into stage V and VI Xenopus oocytes 24–48 h before electrophysiological analysis (Timpe et al., 1988; Tang and Papazian, 1997). The amount of RNA injected was titrated to give between 2 and 20 μA of current at a test potential of +60 mV.
Electrophysiology and data analysis
Currents from wild-type or mutant channels were recorded using a two-electrode voltage-clamp at room temperature (21–23°C) as described previously (Timpe et al., 1988; Papazian et al., 1991). The extracellular solution contained 118 mM NaCl, 1.8 mM CaCl2, and 10 mM HEPES, pH 7.2, except for the experiments shown in Figs. 8–11, where the bath contained 89 mM KCl, 29 mM NaCl, 1.8 mM CaCl2, and 10 mM HEPES, pH 7.2. Various concentrations of MgCl2, MnCl2, or NiCl2 were added to the bath solution as indicated. All experiments were performed in the presence of 1.8 mM CaCl2 to reduce possible surface charge effects due to added Mg2+, Mn2+, or Ni2+. Electrodes were filled with 3 M KCl and had resistances of 0.3–0.8 MΩ.
FIGURE 8.
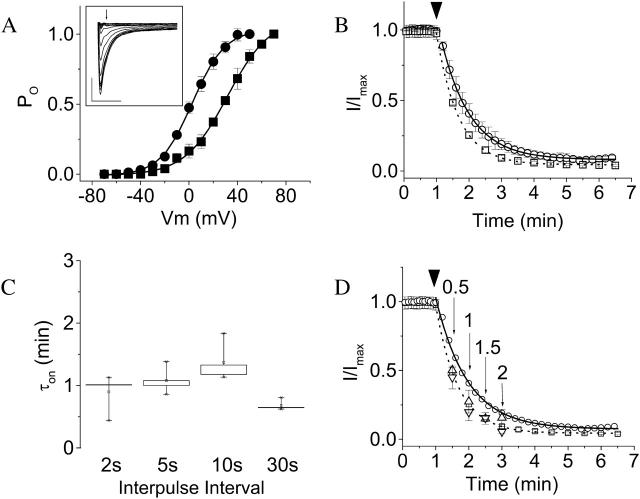
Ni2+ binds to the closed channel. (A) The probability of opening (Po) as a function of voltage for wild-type (•) and D274A (▪) channels was determined from normalized isochronal tail current amplitudes. Each data set was fitted with a single Boltzmann function (solid curves), providing estimates for the midpoint potential (V½) of 2 ± 0.4 mV and 28 ± 0.5 mV for wild-type and D274A, respectively. Apparent slope factors (z) for wild-type and D274A were 12 ± 0.4 and 16 ± 0.5, respectively. (Inset) D274A tail currents are shown. Arrow denotes isochronal point used to calculate Po. Scale bars represent 1 μA and 5 ms. (B) Effects of pulse frequency on the on rate of the Ni2+ effect in D274A. The membrane potential was held at −80 mV and pulsed to +60 mV for 50 ms at intervals of 2, 5, 10, or 30 s. Data shown are for interpulse intervals of 2 (○) and 30 (□) s. For clarity, only every sixth data point is shown for an interpulse interval of 2 s. Arrowhead indicates time at which 20 μM Ni2+ was added. The time course of decline of the current amplitude after addition of Ni2+ was fitted with a single exponential function (solid curve, 2-s interval; dashed curve, 30-s interval) to obtain values for τon. In this panel, fits to the averaged data are shown. (C) Box plot of the distribution of τon values in D274A channels obtained in individual experiments for the indicated interpulse intervals are shown (n = 4). Onset kinetics do not differ significantly at the P = 0.05 level. (D) The membrane potential was held at −80 (▵) or −120 (∇) mV for 0.5, 1, 1.5, or 2 min during application of 20 μM Ni2+ to D274A channels. Subsequently, pulsing for 50 ms to +60 mV at 5-s intervals was resumed. The peak current amplitude during the first pulse in the presence of Ni2+ was normalized to the mean baseline peak current amplitude obtained before addition of Ni2+. Data are presented as mean ± SE, n = 3–4. For comparison, the rate of decline during continuous pulsing from −80 to +60 mV at intervals of 2 (○) or 30 (□) s is also shown; for clarity, error bars are omitted and only every sixth data point is shown for an interpulse interval of 2 s.
FIGURE 9.
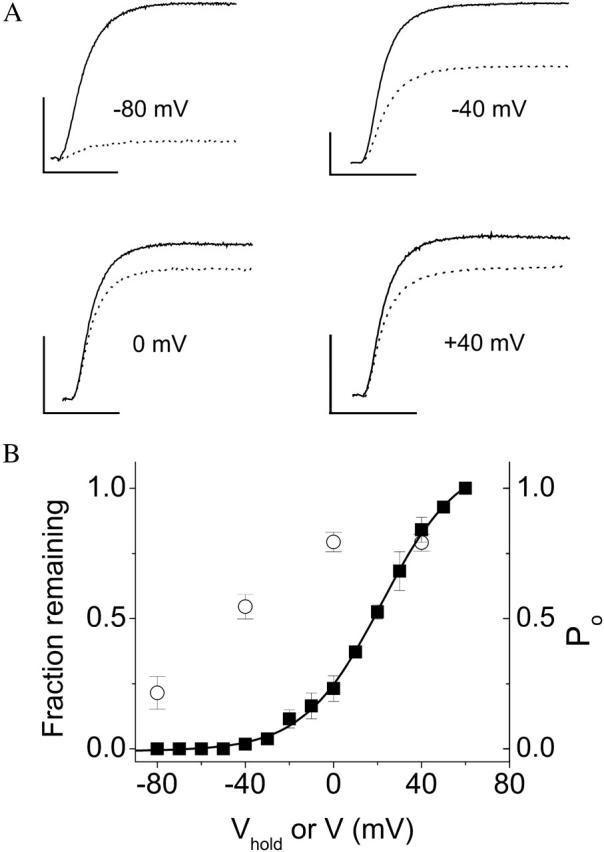
Ni2+ must bind to closed D274A channels to prevent opening. The membrane potential was held at −80 mV and pulsed for 50 ms to +60 mV at intervals of 5 s to establish a baseline of current amplitude in the absence of Ni2+. The membrane was then held without pulsing for 2 min at −80, −40, 0, or +40 mV during application of 20 μM Ni2+. Subsequently, pulsing from −80 to +60 mV for 50 ms at 5-s intervals was resumed. (A) Representative currents obtained before (solid traces) and after (dotted traces) a 2-min application of Ni2+ at −80, −40, 0, or +40 mV, as indicated. The dotted traces were evoked by the first pulse after the 2-min Ni2+ application period. Scale bars represent 5 μA (vertical) and 20 ms (horizontal). (B) The peak current amplitude during the first pulse after Ni2+ application has been normalized to the baseline established in the same cell before addition of Ni2+ and plotted versus holding potential (Vhold) during Ni2+ application (○). Data are presented as mean ± SE, n = 4. For comparison, the probability of opening (Po) as a function of test voltage (V) for D274A is shown on the same axes (▪, same data as in Fig. 8 A).
FIGURE 10.
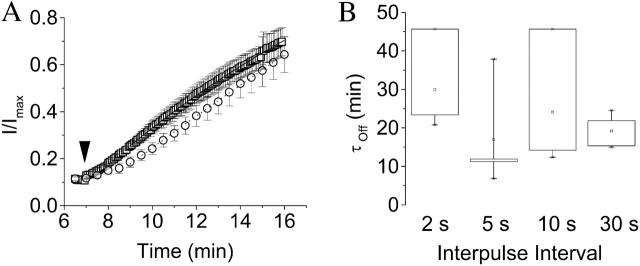
Ni2+ washout in D274A channels does not depend on pulse frequency. (A) During application of 20 μM Ni2+, the membrane was pulsed for 50 ms from a holding potential of −80 to +60 mV at intervals of 2, 5, 10, or 30 s. After saturation of the decline in current amplitude, the perfusate was changed to Ni2+-free 89 mM K+ Ringers bath solution (arrowhead) and the rate of recovery monitored by continuation of the pulse protocol. Measured peak current amplitudes were normalized to the maximal value obtained before Ni2+ application. Data shown are for interpulse intervals of 5 (□) and 30 (○) s. Values are provided as mean ± SE, n = 3–4. The time course of recovery was fitted with a single exponential function (solid curve, 5-s interval; dotted curve, 30-s interval) to obtain values for τoff. Fits to the averaged data are shown. (B) Box plot of the distribution of values of τoff obtained in individual experiments at different interpulse intervals. The recovery rates do not differ significantly at the P = 0.05 level. Data are presented as mean ± SE, n = 3–4.
FIGURE 11.
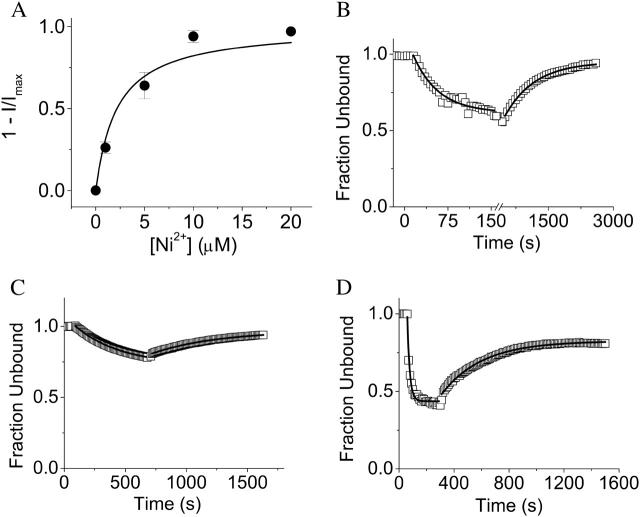
Apparent affinity of D274A channels for Ni2+. (A) Various concentrations of Ni2+ were applied to D274A channels at a holding potential of −80 mV. After saturation of the effect, the current amplitude was normalized to the maximum amplitude obtained in the same oocyte in the absence of Ni2+ (I/Imax) and plotted as 1–I/Imax versus Ni2+ concentration. Data are provided as mean ± SE, n = 4. The data were fitted with a rectangular hyperbola (solid curve), revealing that the half-maximal effective concentration is ∼2.2 μM. (B) As described in the text, the fraction of unbound subunits was calculated as the fourth root of the normalized current amplitude (I/Imax) in 20 μM Ni2+ and plotted versus time. Single exponential functions were fitted to the data resulting in values of τobserved = 43 s and τoff = 667 s, for a calculated KD of 1.5 ± 0.3 μM according to the standard law of mass action. (C) The fraction of unbound subunits was calculated as the fourth root of the normalized current amplitude (I/Imax) in 5 μM Ni2+ and plotted versus time. Single exponential functions were fitted to the data resulting in values for τobserved and τoff, which were used to calculate an apparent KD of 2.3 ± 0.2 μM according to the standard law of mass action. (D) The fraction of unbound subunits was calculated as the fourth root of the normalized current amplitude (I/Imax) in 50 μM Ni2+ and plotted versus time. Single exponential functions were fitted to the data resulting in values for τobserved and τoff, which were used to calculate an apparent KD of 3.5 ± 1.0 μM according to the standard law of mass action. KD values in B–D are provided as mean ± SE, n = 3–4. KD values obtained from the 5-, 20-, and 50-μM data sets did not differ significantly at the P = 0.05 level (paired Student's t-test).
Voltage pulses were delivered and data were acquired using either pClamp v5.5.1 and a TL-1 Labmaster interface, or pClamp v8.1 and a Digidata 1322 interface (Axon Instruments, Union City, CA) connected to a model OC-725 or OC-725C oocyte clamp, respectively (Warner Instruments, Hamden, CT). Data were filtered at 0.2–2 kHz using an eight-pole Bessel filter (Frequency Devices, Haverhill, MA), and digitized at a frequency five times greater than the filter frequency. The sampling rate was varied as needed to resolve activation kinetics. Linear leak and capacitive currents were subtracted using a P/−4 protocol (Bezanilla and Armstrong, 1977). Data were analyzed and figures were prepared using Origin 5.0 or Origin 5.5 (Microcal, Northampton, MA).
Currents were evoked by pulsing from the holding potential of −80 mV to voltages ranging from −60 mV to +80 mV. Activation kinetics were quantified by measuring the time to half-maximal current amplitude (t½), which reflects both the delay and the time course of the characteristically sigmoidal activation kinetics of eag (Silverman et al., 2000; Tang et al., 2000).
To estimate the half-maximal effective concentration of each ion, the change in t½ was measured at different ion concentrations and expressed as fold change in t½. The dose-response data were well fitted by a hyperbolic function of the form
 |
where y is the fold change in t½ and x is the ion concentration. The typical equation for a hyperbola has been offset by 1 because the minimum value of y (at x = 0) is 1 rather than 0. The maximal fold change in t½ is given by A + 1, and the half-maximal effective concentration is given by B.
Assuming that the observed change in t½ is proportional to ion occupancy of the available binding sites, the finding that a rectangular hyperbola provides an excellent fit to the data indicates that ion binding to individual voltage sensors in the tetrameric channel is noncooperative. A hyperbolic function describes oxygen binding to its single site in myoglobin, but also fits binding data in multisite proteins where the sites are independent (Mathews et al., 1999).
The probability of opening (Po) as a function of voltage for wild-type and D274A channels was determined from isochronal tail current amplitudes. From a holding potential of −80 mV, the membrane was stepped to voltages ranging from −80 to +60 mV in 10-mV increments, and then returned to −80 mV to generate tail currents. Isochronal tail current amplitudes were normalized to the maximum amplitude obtained from that oocyte and plotted versus test potential. The data were fitted using a single, first-power Boltzmann equation to obtain estimates of the midpoint voltage and slope factor.
RESULTS
Mn2+ acts without cooperativity to slow eag activation
Eag channels were expressed in Xenopus oocytes, and ionic currents were recorded using a two-electrode voltage-clamp. Upon application of extracellular Mn2+, activation of wild-type eag was slowed significantly with no decrease in steady-state current amplitude (Fig. 1 B). Activation kinetics were characterized by measuring the time to half-maximal current amplitude (t½), which reflects both the delay and time course of activation of the ionic current (Silverman et al., 2000; Tang et al., 2000). Values of t½ were normalized to the value obtained in the absence of Mn2+, and plotted as fold change in t½ versus Mn2+ concentration (Fig. 1 C). The data were fitted with a rectangular hyperbola to obtain estimates for the maximal effect and the half-maximal effective concentration for Mn2+. The maximal effect was predicted to be a 6.6-fold increase in t½; the half-maximal concentration was estimated to be 6.2 mM (Fig. 1 C, Table 1). Both the magnitude of the effect and the half-maximal concentration were similar to that of Mg2+ (Fig. 1 C, Table 1).
TABLE 1.
Summary of effects of Mg2+, Mn2+, and Ni2+ on wild-type and mutant eag channels
| Half-maximal concentration (mM)
|
Peak fold change in t½
|
|||||
|---|---|---|---|---|---|---|
| Mg2+ | Mn2+ | Ni2+ | Mg2+ | Mn2+ | Ni2+ | |
| Wild-type | 3.5 | 6.2 | 0.12 | 6.7 | 6.6 | 123 |
| D274A | 5.4 | 6.3 | 0.0022*, 0.0015** | 9.3 | 9.1 | NA† |
| D274E | 1.2 | 2.6 | ND‡ | 22.8 | 18.5 | ND |
| D278V | —§ | — | — | — | — | — |
| D278E | — | 17.7 | — | — | 5.3 | — |
| D327A | — | — | 0.37 | — | — | 93 |
Determined from current decline.
Estimated KD from on/off rates.
Not applicable.
Not determined.
Insensitive.
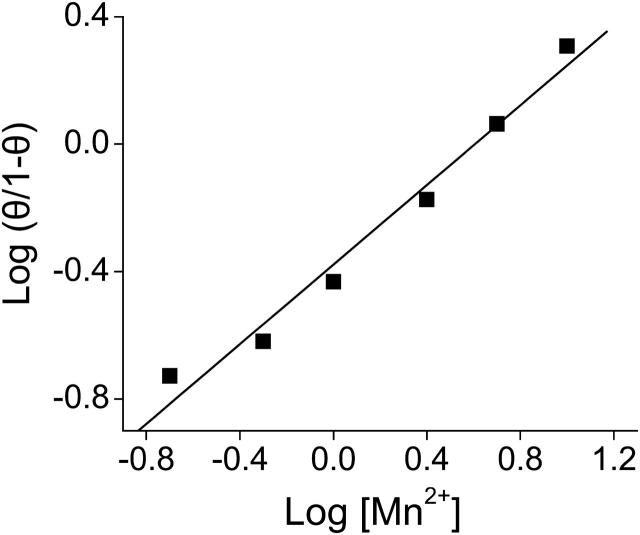
Although we have not measured binding directly, it is reasonable to assume that the functional efficacy of Mn2+ or Mg2+, as measured by fold change in t½, is directly proportional to the occupancy of available binding sites. If so, then the fact that the dose response data are well fitted by a hyperbolic function suggests that ion binding to individual voltage sensors in the tetrameric channel lacks cooperativity (Mathews et al., 1999). To test this idea, a Hill plot was generated from the Mn2+ dose response data. We defined a parameter θ as the fractional occupancy of binding sites, and set θ = 1 at saturating Mn2+ concentrations. Our data predict that the maximal effect obtained at saturating levels of Mn2+ is a 6.6-fold increase in t½ (Fig. 1 C, Table 1). To estimate θ for subsaturating Mn2+ concentrations, we divided the fold change in t½ obtained at each concentration by 6.6, and then plotted log (θ/1−θ) versus log [Mn2+] (Fig. 2). For noncooperative binding, the expected result is a straight line with a slope of 1.0 (Mathews et al., 1999). Our data were well-fitted by a straight line (correlation coefficient 0.99) with a slope of 0.6. It is likely that the slope is <1.0 because Mn2+ was not the only divalent ion in the bath solution. Our electrophysiological experiments were conducted in the presence of 1.8 mM Ca2+ to stabilize the membrane and reduce nonspecific surface charge effects due to added divalent ions. Ca2+ is likely to bind to the eag voltage sensor site to some extent, and would therefore act as a competitive inhibitor of Mn2+ binding. The presence of a competitive inhibitor decreases the slope of the Hill plot (Mathews et al., 1999). We conclude that Mn2+ acts independently in the individual subunits to modulate activation gating, and that there is no significant cooperativity between the four binding sites present in the channel. This conclusion is compatible with earlier work of Schönherr et al. (1999), who showed that slow gating transitions (which are highly modulated by divalent ions) occur independently in each of the four subunits that compose the eag channel.
FIGURE 2.
Mn2+ acts without cooperativity. The Hill plot was generated using the Mn2+ dose response data shown in Fig. 1 C. We assumed that the fold change in t½ was directly proportional to the fractional occupancy (θ) of the ion-binding site in the eag voltage sensor. We further assumed that at saturating concentrations of Mn2+, θ = 1. Values of θ for 0.2 to 10 mM Mn2+ were calculated by dividing the corresponding fold change in t½ by 6.6, the estimated maximal effect of Mn2+ (Fig. 1 C, Table 1). The graph plots log(θ/1−θ) versus log[Mn2+]. The data are well fitted by a line (correlation coefficient 0.99) with a slope of 0.6.
Mn2+ slows eag activation by binding between S2 and S3
To test the hypothesis that Mn2+, an ion similar in size and polarizability to Mg2+, binds to the same site to modulate activation kinetics, we characterized the effect of Mn2+ on eag channels containing mutations of D278 and D327, eag-specific acidic residues in S2 and S3, respectively, that interact with bound Mg2+ ions (Fig. 1 A). Channels containing the neutralization mutation D278V or the charge-conserving mutation D278E were separately expressed in oocytes, and activation kinetics were compared in the presence and absence of Mn2+ (Fig. 3, A and B). The D278V channel was virtually insensitive to extracellular Mn2+ up to 10 mM, whereas D278E retained some sensitivity to Mn2+. In contrast, we previously showed that D278E mutant channels are insensitive to Mg2+ concentrations up to 20 mM (Silverman et al., 2000). To characterize the residual effect of Mn2+ in D278E, the fold-change in t½ was plotted versus concentration and the data were fitted with a rectangular hyperbola (Fig. 3 C). Although the maximal effect of Mn2+ on D278E channels was similar to that of wild-type, the half-maximal effective concentration was threefold greater (Table 1). This is consistent with the idea that D278E reduces the apparent affinity of eag for Mn2+, whereas D278V abolishes Mn2+ sensitivity.
FIGURE 3.
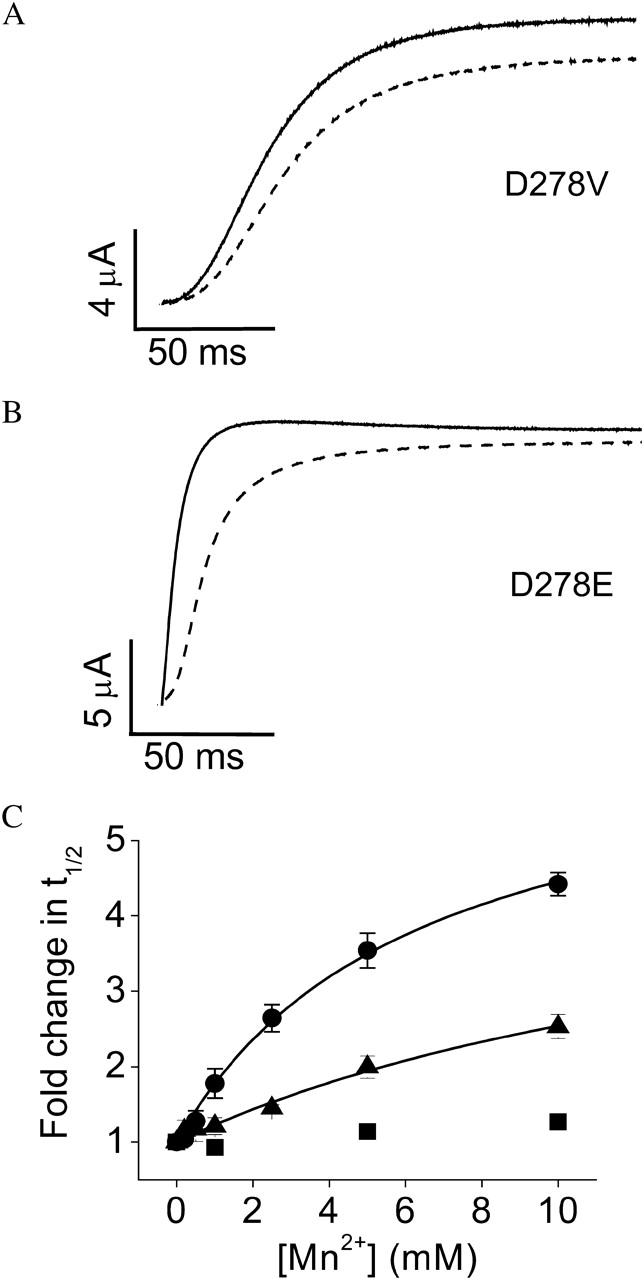
Neutralization of D278 abolishes Mn2+ sensitivity of activation kinetics. (A and B) Representative traces of D278V (A) and D278E (B) are shown. From a holding potential of −80 mV, test pulses to +60 mV were applied in the absence (solid traces) or presence (dashed traces) of 10 mM Mn2+. (C) Values of t½ at +60 mV were measured for D278V (▪), D278E (▴), or wild-type eag (•) in various concentrations of Mn2+ up to 10 mM, expressed as fold change in t½ and plotted as a function of concentration. Data are shown as mean ± SE, n = 3–4. The data for D278E and wild-type were fitted with rectangular hyperbolas (solid curves) to estimate the maximal fold-change in t½ and the half-maximal effective concentration (see Table 1).
To test whether D327 in S3 is required for Mn2+ sensitivity, the D327A mutant was expressed in oocytes and activation kinetics were compared in the presence or absence of Mn2+. Extracellular Mn2+ up to 10 mM resulted in no significant change in the activation kinetics of D327A (Fig. 4, A and B). Similar results were previously obtained with Mg2+ (Silverman et al., 2000). In contrast, the D327A mutation does not abolish sensitivity to Ni2+ (see below).
FIGURE 4.
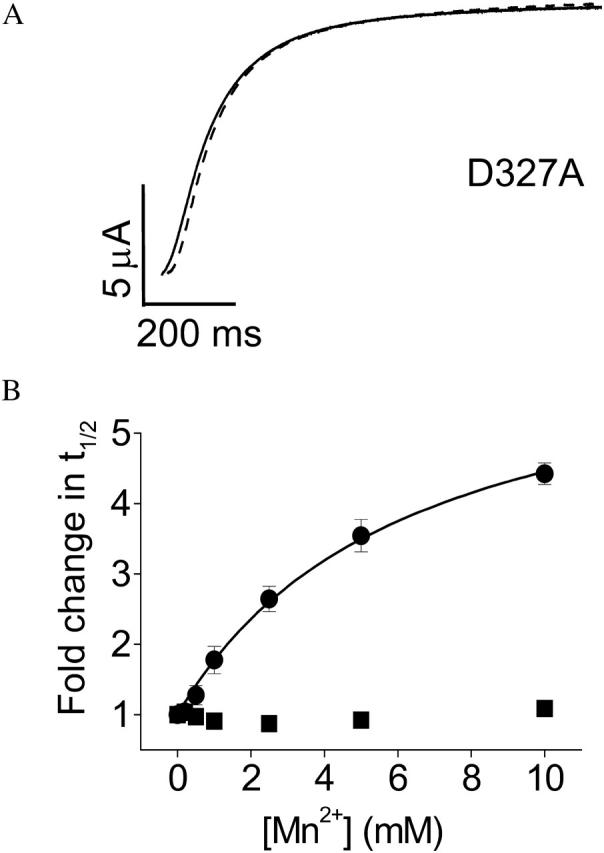
Neutralization of D327 abolishes Mn2+ sensitivity of activation kinetics. (A) Representative traces of D327A are shown. From a holding potential of −80 mV, test pulses to +60 mV were applied in the absence (solid trace) or presence (dashed trace) of 10 mM Mn2+. (B) Values of t½ at +60 mV were measured for D327A (▪) or wild-type eag (•) in various concentrations of Mn2+ up to 10 mM, expressed as fold change in t½ and plotted as a function of concentration. Data are shown as mean ± SE, n = 3–4. The data for wild-type were fitted with a rectangular hyperbola (solid curve) to estimate the maximal fold-change in t½ and the half-maximal effective concentration (see Table 1).
D274 in S2 corresponds to an acidic residue that is widely conserved in the superfamily of voltage-gated ion channels (Warmke and Ganetzky, 1994; Chandy and Gutman, 1995). Previously, we presented evidence that D274 is exposed in the same extracellular-facing pocket that contains the ion-binding site in eag, but does not interact with bound Mg2+ (Silverman et al., 2000). However, lengthening the side chain by one methylene group in the D274E mutant increases the maximal effect and reduces the half-maximal effective concentration for Mg2+, suggesting that the longer side chain is able to interact with the bound ion.
To investigate whether similar results are obtained for Mn2+, we expressed the neutralization mutant, D274A, and the charge-conserving mutant, D274E, for functional analysis. Extracellular Mn2+ dramatically slowed activation of the D274A channel, confirming that D274 is not required for Mn2+ binding (Fig. 5 A). The D274E channel was also highly sensitive to Mn2+, with a maximal effect larger than that seen in the wild-type channel or in D274A (Fig. 5, B and C). The dose response curve revealed that the half-maximal effective concentrations for wild-type eag and D274A channels were similar, whereas the D274E mutation reduced the half-maximal concentration for Mn2+ (Fig. 5 C, Table 1). These results are similar to those previously obtained for Mg2+ (Silverman et al., 2000). In contrast, Ni2+ blocks opening of D274A channels with no change in activation kinetics, which is a novel phenotype (Silverman et al., 2003).
FIGURE 5.
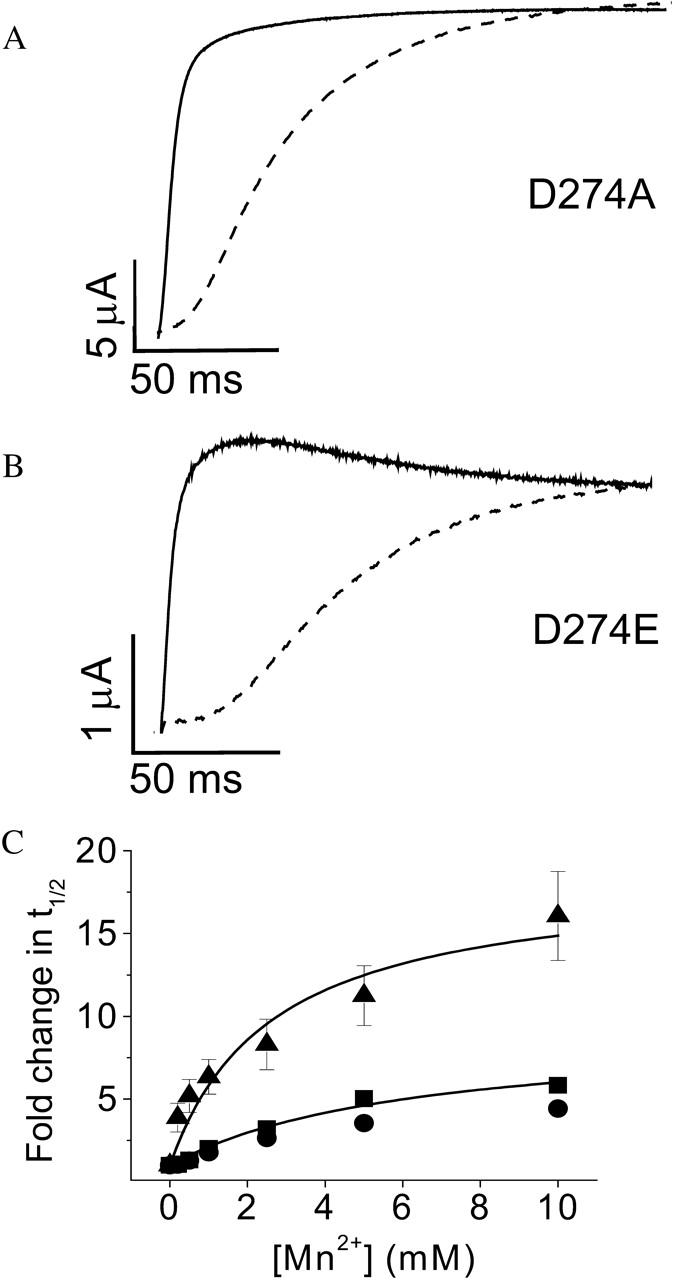
D274 in S2 is not required for Mn2+ binding. (A and B) Representative traces of D274A (A) and D274E (B) are shown. From a holding potential of −80 mV, test pulses to +60 mV were applied in the absence (solid traces) or presence (dashed traces) of 10 mM Mn2+. (C) Values of t½ at +60 mV for D274A (▪), D274E (▴), or wild-type eag (•) were measured in various concentrations of Mn2+ up to 10 mM, expressed as fold change in t½ and plotted as a function of concentration. Data are shown as mean ± SE, n = 3–4. The data were fitted with rectangular hyperbolas (solid curves) to estimate the maximal fold-change in t½ and the half-maximal effective concentration (see Table 1).
Ni2+ interacts with both D278 and D327
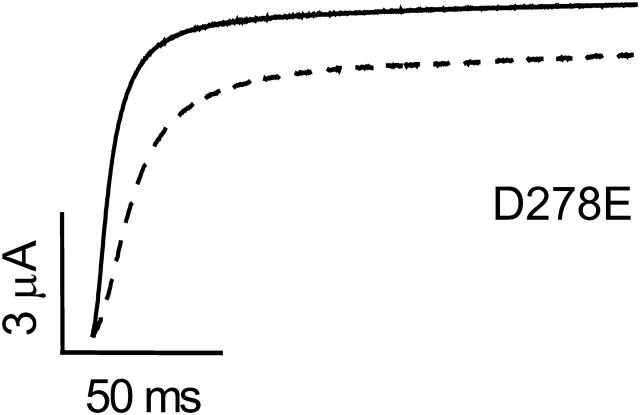
Extracellular Ni2+ dramatically slows eag activation (Terlau et al., 1996; Silverman et al., 2003). We previously reported that Ni2+ sensitivity is abolished by the D278V mutation (Silverman et al., 2003). As shown in Fig. 6, Ni2+ modulation is also eliminated by the charge-conserving D278E mutation. Ni2+ concentrations up to 5 mM had no significant effect on activation kinetics in the D278E channel (see Fig. 7 D). In contrast, 5 μM Ni2+ significantly slowed activation of the wild-type channel (see Fig. 7 B) (Silverman et al., 2003). These results are consistent with the conclusion that Ni2+ binding requires an aspartate residue at position 278 in S2.
FIGURE 6.
D278 is required for sensitivity to Ni2+. Representative traces of D278E are shown. From a holding potential of −80 mV, cells were pulsed to a test potential of +60 mV in the absence (solid trace) or presence (dashed trace) of 5 mM Ni2+.
FIGURE 7.
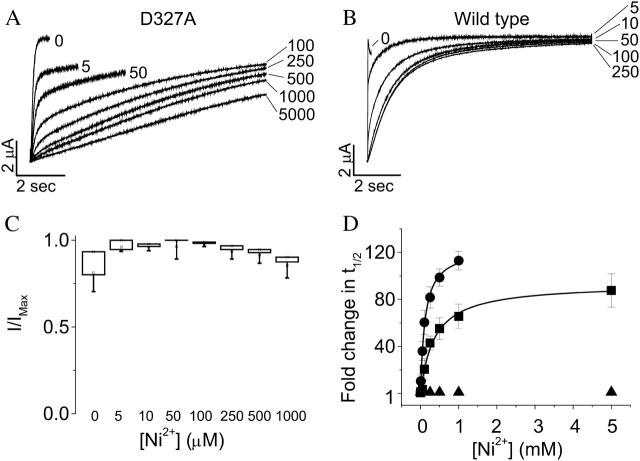
Ni2+ interacts with D327. (A and B) Representative current traces of D327A (A) and wild-type (B) are shown. From a holding potential of −80 mV, currents from a single oocyte were recorded in response to a pulse to a test potential of +60 mV in the presence of the indicated concentrations of Ni2+ (μM). (C) Wild-type eag currents were recorded in various concentrations of Ni2+ (μM) in response to 10-s test pulses from a holding potential of −80 mV to +60 mV. Peak current amplitudes at each concentration were measured and normalized to the maximal amplitude obtained for the same oocyte in the absence of Ni2+. The box plot illustrates the distribution of amplitudes at each concentration (n = 3). (D) Values of t½ were measured for wild-type eag (•) and estimated as described in the text for D327A (▪) in various concentrations of extracellular Ni2+, expressed as fold change in t½ and plotted versus Ni2+ concentration. Data are shown as mean ± SE, n = 3–5. The data were fitted with a rectangular hyperbola (solid curves) to estimate the maximal fold-change in t½ and the half-maximal effective concentration (see Table 1). For comparison, the fold change in t½ for D278E (▴) has also been plotted versus Ni2+ concentration (n = 4).
In contrast to D278V and D278E, D327A retains significant sensitivity to Ni2+ (Silverman et al., 2003). To determine whether D327 in S3 contributes to Ni2+ binding, we investigated whether the D327A mutation reduces the apparent affinity of eag for Ni2+. Fig. 7 A shows a series of traces recorded from a single oocyte in various concentrations of Ni2+. Concentrations up to 5 mM resulted in a progressive slowing of activation. Because the D327A channel activates slowly even in the absence of divalent cations, addition of Ni2+ resulted in extremely slow opening kinetics. At high Ni2+ concentrations, current amplitude did not reach a steady-state level during a 10-s pulse. For comparison, Fig. 7 B shows a similar series of traces for the wild-type channel. Interestingly, 250 μM Ni2+ gave a near-maximal slowing of activation in the wild-type channel (Fig. 7 B), which was not the case in D327A (Fig. 7 A). These results are consistent with the idea that the D327A mutation reduces the affinity of the eag channel for Ni2+.
The slow activation kinetics of D327A in the presence of Ni2+ made it infeasible to reach steady-state current amplitude even in very long depolarizing pulses. Therefore, we were unable to determine t½ directly as a function of Ni2+ concentration. However, in the wild-type channel, Ni2+ did not alter the steady-state current amplitude (Fig. 7 C). To estimate the dose response curve for Ni2+ in D327A, we made the reasonable assumption that Ni2+ does not decrease the steady-state current amplitude in D327A channels. For each Ni2+ concentration, we measured the time required to reach half the maximal current amplitude obtained in the absence of Ni2+. Assuming that Ni2+ does not significantly alter the steady-state current amplitude, this approach should reliably estimate values of t½.
Values for t½, obtained as described, were plotted versus Ni2+ concentration and the data were fitted with a rectangular hyperbola to estimate the maximal effect and half-maximal effective concentration (Fig. 7 D, Table 1). In wild-type eag, the half-maximal concentration for Ni2+ was estimated to be 120 μM, whereas the maximal effect was an ∼120-fold increase in t½. In D327A, the maximal effect of Ni2+ was an ∼90-fold increase in t½, similar to that observed for wild-type eag channels. However, the half-maximal effective concentration was increased to 370 μM, corresponding to a threefold change. This result is consistent with the conclusion that Ni2+, like Mg2+ and Mn2+, interacts with both D278 in S2 and D327 in S3.
Binding site is accessible to extracellular ions when the channel is closed
A recently proposed model for voltage-dependent gating in K+ channels suggests that the voltage sensor acts as a hydrophobic paddle that moves through the lipid environment of the membrane during activation (Jiang et al., 2003b). In this model, the voltage sensor, including the S3–S4 loop, is located near the cytoplasmic side of the membrane at hyperpolarized potentials. If applied to eag, the model predicts that extracellular ions would be unable to access their binding site, located between transmembrane segments S2 and S3 in proximity to the S3–S4 loop, when the voltage sensor is in its resting position.
We took advantage of the novel effect of Ni2+ on D274A channels to test this prediction. As previously reported, application of Ni2+ to D274A reduces current amplitude with no change in activation kinetics (Silverman et al., 2003). We have presented data indicating that in D274A, Ni2+ prevents S4 conformational changes required for opening, trapping the voltage sensor in its resting state (Silverman et al., 2003). To determine whether Ni2+ can access its binding site in closed channels, we monitored the rate of decrease in current amplitude as a function of holding potential and pulse frequency during Ni2+ perfusion. The membrane potential was held at −80 mV continuously or was depolarized during 50-ms pulses from −80 to +60 mV at different pulse frequencies. It is important to note that the probability that D274A adopts an activated conformation at −80 mV is extremely low. The D274A mutation shifts the probability of opening in the depolarized direction compared to the wild-type channel; the midpoint of the D274A activation curve is ∼+25 mV (Fig. 8 A). Perfusion with Ni2+ resulted in a monoexponential decline in current amplitude (Fig. 8 B). The rate of onset of the Ni2+ effect at −80 mV showed no significant dependence upon pulse frequency (Fig. 8 C). Furthermore, when the membrane potential was held continuously at −80 mV or at −120 mV for 0.5, 1, 1.5, or 2 min while applying Ni2+, the decline in current amplitude was similar to that seen at equivalent time points during continuous pulsing (Fig. 8 D). We conclude that Ni2+ is able to access its binding site from the extracellular solution when the voltage sensor is in its resting conformation.
Since Ni2+ blocks voltage-sensor conformational changes in D274A channels, it should prevent opening less effectively at membrane potentials where S4 transitions have already occurred. To test this prediction, the membrane was held at −80, −40, 0, or +40 mV during perfusion with Ni2+, and the decline in current amplitude was monitored (Fig. 9 A). Importantly, eag channels do not inactivate during long depolarizing pulses, so any decline in amplitude can be attributed to Ni2+ (Silverman et al., 2003). The Ni2+ effect was progressively decreased as the membrane was held at more depolarized potentials (Fig. 9 B). The decline in current amplitude when Ni2+ was applied at −40 mV was significantly less than at −80 mV. The minimal decrease in current amplitude was seen when Ni2+ was applied at 0 mV, with no further effect at +40 mV. For comparison, we plotted the Po–V curve of the D274A mutant on the same set of axes (Fig. 9 B). The influence of holding potential on Ni2+ efficacy was significantly shifted to hyperpolarized potentials relative to the Po–V curve. We have previously shown that movement of the eag voltage sensor, as indicated by the gating charge-voltage relationship (q–V curve), occurs at more hyperpolarized potentials than activation of the ionic conductance (Tang et al., 2000). Thus, the dependence of Ni2+ efficacy on holding potential confirms our previous conclusion that Ni2+ prevents voltage-sensor movement in D274A channels (Silverman et al., 2003). Furthermore, the data are consistent with the idea that Ni2+ cannot effectively prevent opening of D274A channels if the voltage sensor is in an activated conformation. Thus, the effect of Ni2+ at −80 or −120 mV, as shown in Fig. 8, requires binding of the ion to closed channels, reinforcing the conclusion that extracellular ions can access their site when the voltage sensor is in its resting state.
We also investigated whether Ni2+ can dissociate from closed D274A channels. Ni2+ was applied as in Fig. 8 B: the membrane was held at −80 mV and depolarized during 50-ms steps from −80 to +60 mV at different pulse frequencies. After saturation of the decline in current amplitude, Ni2+ was removed from the perfusate and the pulse protocol was continued. Upon washout of Ni2+, the D274A current amplitude slowly returned to its original value (Fig. 10 A). The rate of recovery was little affected by pulse frequency during washout (Fig. 10 B). This result suggests that Ni2+ can dissociate from its binding site when the voltage sensor is in the resting conformation.
High apparent affinity of D274A channels for Ni2+ is consistent with kinetics of onset and recovery
The onset and recovery kinetics that we have measured are consistent with the high apparent affinity of D274A channels for Ni2+ as revealed by dose-response data. In Fig. 11 A, the maximal decline in current amplitude in response to Ni2+ application at a holding potential of −80 mV has been plotted as a function of Ni2+ concentration. The data have been fitted with a rectangular hyperbola, revealing that the half-maximal concentration for Ni2+ is ∼2.2 μM (Table 1). This is lower than the half-maximal concentration for Ni2+ in the wild-type channel (see Fig. 7 D, Table 1), but these values are not directly comparable, since they have been assessed in different conformations corresponding to the open state for the wild-type channel, and the closed state for D274A. We used the kinetics of onset during perfusion with 20 μM Ni2+ and recovery during perfusion with Ni2+-free solution to estimate the dissociation constant (KD) for Ni2+ in D274A (Fig. 11 B). We assumed that Ni2+ binds to each voltage sensor in the tetrameric channel independently, and that a single Ni2+ ion is sufficient to prevent opening. The latter assumption, although unproven, is reasonable. If multiple Ni2+ ions were needed to block activation, we would expect to see slower activation kinetics at subsaturating Ni2+ concentrations, which is not the case. Thus, the remaining current reflects channels that have not bound Ni2+, and the fraction of unbound channels will equal the normalized current amplitude (I/Imax). Given these assumptions, the fraction of unbound subunits will be equal to the fourth root of the normalized current amplitude, according to the binomial distribution. We plotted the fraction of unbound subunits in D274A as a function of time during onset and recovery of the Ni2+ effect, fitted the data with two single exponential components (τobserved and τoff), and calculated an apparent KD for Ni2+ of 1.5 ± 0.3 μM (Fig. 11 B). This value is similar to the half-maximal concentration of 2.2 μM obtained from the dose response curve (Fig. 11 A). The experiment was repeated using 5 or 50 μM Ni2+ (Fig. 11, C and D). As expected, the on-rate but not the off-rate was dependent on Ni2+ concentration. Apparent KD values of 2.3 ± 0.2 μM and 3.5 ± 1.0 μM were obtained from the 5- and 50-μM data sets, respectively. Thus, similar estimates of the apparent affinity of D274A channels for Ni2+ were provided by dose response analysis and by the time course of onset and recovery at several Ni2+ concentrations. Furthermore, the results are consistent with the idea that a single Ni2+ ion is able to prevent activation gating in D274A channels.
DISCUSSION
Binding site in eag voltage sensor accommodates a variety of divalent cations
In eag and many of its closest homologs, activation gating is modulated by extracellular Mg2+ and other divalent cations (Terlau et al., 1996; Tang et al., 2000). This form of regulation is not seen in other subfamilies of voltage-gated K+ channels. In proteins, bound Mg2+ is typically coordinated by the carboxylic acid side chains of aspartate or glutamate residues. Previously, we tested the hypothesis that D278 in S2 and D327 in S3 contribute to the binding site for Mg2+ in eag (Silverman et al., 2000). These residues were good candidates because they are located in the voltage-sensor domain and they are conserved as acidic only among members of the eag subfamily. We obtained several lines of evidence that D278 and D327 contribute to the Mg2+ binding site. First, neutralization mutations at these positions greatly reduced or abolished the effect of Mg2+ on eag activation kinetics. This was most likely due to a change in binding rather than a change in the gating pathway because hyperpolarizing prepulses still accessed rate-determining steps for activation in the mutant channels. In the wild-type, these transitions are highly modulated by Mg2+ (Tang et al., 2000). Second, neutralization mutations slowed eag activation kinetics, mimicking the ion-bound state of the channel. These results suggest that Mg2+ slows activation kinetics in the wild-type channel, at least in part, by shielding the negatively charged side chains of D278 and D327. In contrast, neutralization of D284 in S2 and D319 in S3 (acidic residues that are widely conserved among the superfamily of voltage-gated channels) preserved the fast activation kinetics of the wild-type channel seen in the absence of Mg2+. Thus, charge shielding of these residues does not contribute to the slow activation caused by Mg2+ binding.
We have now shown that the ion-binding site formed by D278 in S2 and D327 in S3 in the eag voltage sensor is able to accommodate a variety of divalent cations, including Mg2+, Mn2+, and Ni2+. These ions differ in size and polarizability, suggesting that the binding site is somewhat flexible. Each slows activation, but Ni2+ has a much larger effect and higher affinity compared to Mg2+ and Mn2+. The chemical properties of Mg2+ and Mn2+ are more similar to each other than either is to Ni2+. Mg2+ is a hard ion that prefers oxygen ligands, whereas Mn2+ is somewhat softer, with a higher tolerance for nitrogen ligands (Bock et al., 1999; da Silva and Williams, 2001). Both prefer a coordination number of 6. Mg2+ is most commonly found in binding sites with a regular octahedral geometry, whereas Mn2+ can be bound with a distorted octahedral geometry (Dudev and Lim, 2003). This may explain why the mutation D278E abolishes Mg2+ but not Mn2+ sensitivity. We originally suggested that D278E prevented Mg2+ binding due to steric hindrance, but this interpretation does not account for the observation that Mn2+, a larger ion, exhibits residual binding (Silverman et al., 2000). An alternative explanation is that the D278E mutation disrupts the regular octahedral geometry of the site, which would have a larger effect on Mg2+ than on Mn2+ binding (Pauling, 1960; Bock et al., 1999; Dudev and Lim, 2003).
Ni2+ has more flexible coordination requirements than Mg2+ or Mn2+, and can be found with coordination numbers of 4, 5, or 6 in square planar, trigonal bipyramidal, and octahedral geometries, among others (da Silva and Williams, 2001). It is a relatively soft ion, and is often coordinated by sulfur in addition to oxygen and nitrogen. Ni2+ has a highly polarizable electron shell that results in greater covalency in its bonds. As a result, Ni2+ often binds with higher affinity to sites normally occupied by other ions under physiological conditions. Our data indicate that the D327A mutation reduces the apparent affinity (as estimated by the half-maximal effective concentration) for Ni2+ by approximately threefold. In contrast, D327A appears to have a more dramatic effect on the affinity of the binding site for Mg2+ and Mn2+. This suggests that Ni2+ may interact with additional ligands in the binding site crevice. The high affinity for Ni2+ is not due to preferential association with a nearby cysteine residue, C323 in S3, however (J. P. A. Bannister and D. M. Papazian, unpublished data).
Mapping the binding site residues onto three structural models for the voltage sensor
To simultaneously coordinate an ion, D278 and D327 must be in atomic proximity. High-resolution protein structures reveal that carboxylate groups of acidic residues coordinating Mg2+ are within 2.7–4.3 Å of each other (Kankare et al., 1996; Andersson et al., 1997; Harutyunyan et al., 1997; Larsen et al., 1997; Sliz et al., 1997; Stec et al., 1998; Goldgur et al., 1999; Nichols et al., 1999). Previously we had used this distance constraint, constraints derived from second site suppressor analysis of Shaker, and a variety of other data from the literature, to generate a model for the structure of the voltage sensor in K+ channels (Silverman et al., 2003). Furthermore, we recently identified residues in S4 and the pore domain that move into atomic proximity of each other during activation of Shaker channels, leading to a model for voltage-sensor/pore interactions (Lainé et al., 2003). Not surprisingly, residues corresponding to D278 and D327 are within a few Ångstroms of each other in this model (Fig. 12 A).
FIGURE 12.
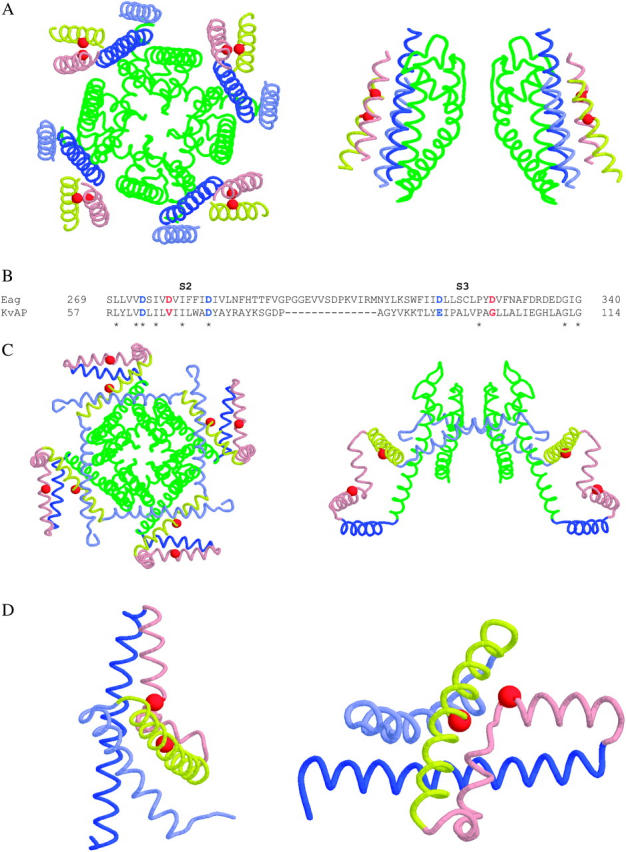
Mapping the ion-binding site residues on a structural model for voltage-dependent K+ channels and on the KvAP x-ray structures. (A) Shown are diagrams representing extracellular (left) and side (right) views of the structural model for voltage-dependent K+ channels proposed by Lainé et al. (2003). For clarity, only two subunits are depicted in the right panel. The pore domain is shown in green, S1 in light blue, S2 in yellow, S3 in pink, and S4 in dark blue. The red spheres correspond to the Cα atoms of D278 in S2 and D327 in S3, which contribute to the ion-binding site in eag. (B) An alignment of S2 and S3 sequences from eag and KvAP. Conserved charged residues are shown in blue. Residues in red correspond to those shown as red spheres in A, C, and D. Identical residues are denoted with asterisks. (C) Shown are diagrams representing extracellular (left) and side (right) views of the x-ray structure of full-length KvAP as determined by Jiang et al. (2003a). For clarity, only two subunits are depicted in the right panel. Segments S1–S4 and the pore domain are colored as in A. The red spheres represent the Cα atoms of V66 in S2 and G101 in S3, which correspond to the ion binding site residues in eag. (D) Shown are diagrams representing two views of the x-ray structure of the KvAP voltage-sensor domain (S1–S4) as determined by Jiang et al. (2003a). Segments S1–S4 are colored as in A. The red spheres represent the Cα atoms of V66 in S2 and G101 in S3, which correspond to the ion-binding site residues in eag.
Our model for voltage-dependent K+ channels differs significantly from the x-ray structure of the KvAP protein, obtained after detergent solubilization and complexation with a monoclonal Fab fragment by MacKinnon and co-workers (Jiang et al., 2003a). To determine whether the eag ion-binding site is compatible with the KvAP x-ray structure, we identified residues homologous to D278 and D327 and measured the distance between them in the KvAP structure (Fig. 12, B and C). An alignment of S2 and S3 segments from eag and KvAP indicates that D278 and D327 correspond to V66 and G101, respectively (Fig. 12 B). The α-carbon atoms of these residues are 17 Å apart in the KvAP x-ray structure, a distance that is incompatible with the formation of an ion-binding site (Fig. 12 C). Thus, it is difficult to reconcile the identification of the binding site in the eag voltage sensor with this structure. In the x-ray structure of the isolated voltage sensor (S1–S4) of KvAP, also solved by MacKinnon and co-workers, the α-carbon atoms of V66 and G101 are somewhat closer, at 10.8 Å (Fig. 12 D) (Jiang et al., 2003a). Given the larger volume of two aspartate residues compared to valine plus glycine, it is possible that with fairly minor changes, the isolated voltage sensor structure could accommodate an ion binding site as found in eag.
One intriguing aspect of the location of the binding site residues is that G101, the KvAP homolog of D327, is near a break in S3 secondary structure that is seen in the structures of both full-length KvAP and its isolated voltage-sensor domain (Jiang et al., 2003a). The break in the S3 α-helix is adjacent to a highly conserved proline residue corresponding to P99 in KvAP and P325 in eag (Fig. 12 B). This feature may impart a flexibility to S3 that is important in the mechanism of voltage-dependent activation. Our analysis of the Ni2+ effect in D274A indicates that S4 charge-moving residues undergo conformational changes in close proximity to the ion-binding site; S3 flexibility in this region may be required for S4 movement (Silverman et al., 2003). One interesting possibility is that ion binding in eag reduces the flexibility of S3, thereby slowing S4 conformational changes.
Largely influenced by the KvAP x-ray structure, MacKinnon and co-workers (Jiang et al., 2003b) have proposed an alternative model for voltage-dependent activation in which the S4 segment is located at the periphery of the channel protein and moves through the hydrophobic lipid environment as part of a voltage-sensor paddle during activation. According to this model, the S3–S4 loop is located near the cytoplasmic side of the membrane at hyperpolarized potentials. Since D327 is near the carboxyl terminus of S3, in proximity to the S3–S4 loop, this model predicts that extracellular ions would be unable to access the binding site in the eag voltage sensor when the channel is closed. Contrary to this prediction, we find that ions can access the binding site from the extracellular solution at hyperpolarized potentials.
It might be argued that the KvAP structure, with its positively charged paddles sticking out into the lipid, disorganizes the bilayer sufficiently to allow access of an extracellular ion to a binding site located near the cytoplasmic side of the membrane. This seems unlikely to account for our results. In the hydrophobic paddle model, depolarizing the membrane would move the voltage sensor to the extracellular side of the membrane, significantly changing the pathway for access to the binding site. However, the rate of onset of the Ni2+ effect in D274A was virtually identical, whether the membrane was held continuously at −80 or −120 mV or pulsed at different frequencies to +60 mV. We conclude that the binding site in the eag voltage sensor is located in a water-filled crevice near the extracellular surface of the protein regardless of voltage-sensor conformation.
This conclusion is compatible with earlier work on Shaker channels. We have shown that a cysteine residue substituted at position 283 in S2, the Shaker homolog of D274 in eag, reacts with the impermeant methanethiosulfonate reagents, MTSET and MTSES, at similar rates at −100 and +40 mV, potentials at which the protein is in resting and activated conformations, respectively (Tiwari-Woodruff et al., 2000). We concluded from this work that position 283 is in a solvent-accessible location near the extracellular surface of the membrane in both open and closed channels.
Acknowledgments
We are grateful to Allan Mock for expert technical assistance. We thank Jessica Richardson and Drs. Muriel Lainé and Meng-chin Lin for helpful comments on the manuscript.
This work was supported by grants to D.M.P. from the National Institutes of Health (GM43459) and the Laubisch fund for Cardiovascular Research at the University of California, Los Angeles.
William R. Silverman's present address is the Dept. of Molecular Biophysics and Biochemistry, Yale University, New Haven, CT 06520.
References
- Andersson, S. K., A. Malmendal, S. Linse, I. Iverson, S. Forsen, and L. A. Svensson. 1997. Structural basis for negative allostery between Ca2+ and Mg2+ binding in the intracellular Ca2+ receptor calmodulin D9k. Prot. Sci. 6:1139–1147. [DOI] [PMC free article] [PubMed] [Google Scholar]
- Bezanilla, F., and C. M. Armstrong. 1977. Inactivation of the sodium channel. I. Sodium current experiments. J. Gen. Physiol. 70:549–566. [DOI] [PMC free article] [PubMed] [Google Scholar]
- Bock, C. W., A. K. Katz, G. D. Markham, and J. P. Glusker. 1999. Manganese as a replacement for magnesium and zinc: functional comparison of the divalent ions. J. Am. Chem. Soc. 121:7360–7372. [Google Scholar]
- Chandy, K. G., and G. A. Gutman. 1995. Voltage-gated potassium channel genes. In Ligand- and Voltage-Gated Ion Channels. R.A. North, editor. CRC Press, Boca Raton, FL. 1–71.
- da Silva, J. J. R. F., and R. J. P. Williams. 1991. The Biological Chemistry of the Elements: The Inorganic Chemistry of Life. Oxford University Press, New York.
- Dudev, T., and C. Lim. 2003. Principles governing Mg, Ca, and Zn binding and selectivity in proteins. Chem. Rev. 103:773–787. [DOI] [PubMed] [Google Scholar]
- Goldgur, Y., G. H. Cohen, T. Fugiwara, T. Yoshinaga, T. Fujishita, H. Sugimoto, T. Endo, H. Murai, and D. R. Davies. 1999. Structure of the HIV-1 integrase catalytic domain complexed with an inhibitor: a platform for antiviral drug design. Proc. Natl. Acad. Sci. USA. 96:7754–7760. [DOI] [PMC free article] [PubMed] [Google Scholar]
- Harutyunyan, E. H., V. Y. Oganessyan, N. N. Oganessyan, S. M. Avaeva, T. I. Nazarova, N. N. Vorobyeva, S. A. Kurilova, R. Huber, and T. Mather. 1997. Crystal structure of holo inorganic pyrophosphatase from Escherichia coli at 1.9Å resolution. Mechanism of hydrolysis. Biochemistry. 36:7754–7760. [DOI] [PubMed] [Google Scholar]
- Jiang, Y., A. Lee, J. Chen, V. Ruta, M. Cadene, B. T. Chait, and R. MacKinnon. 2003a. X-ray structure of a voltage-dependent K+ channel. Nature. 423:33–41. [DOI] [PubMed] [Google Scholar]
- Jiang, Y., V. Ruta, J. Chen, A. Lee, and R. MacKinnon. 2003b. The principle of gating charge movement in a voltage-dependent K+ channel. Nature. 423:42–48. [DOI] [PubMed] [Google Scholar]
- Kankare, J., T. Salminen, R. Lahti, B. S. Cooperman, A. A. Baykov, and A. Goldman. 1996. Crystallographic identification of metal binding sites in Escherichia coli inorganic pyrophosphatase. Biochemistry. 35:4770–4777. [DOI] [PubMed] [Google Scholar]
- Lainé, M., M. A. Lin, J. P. A. Bannister, W. R. Silverman, A. F. Mock, B. Roux, and D. M. Papazian. 2003. Atomic proximity between S4 segment and pore domain in Shaker potassium channels. Neuron. 39:467–481. [DOI] [PubMed] [Google Scholar]
- Landt, O., H. P. Grunert, and U. Hahn. 1990. A general method for rapid site-directed mutagenesis using the polymerase chain reaction. Gene. 96:125–128. [DOI] [PubMed] [Google Scholar]
- Larsen, T. M., M. M. Benning, G. E. Wesenberg, I. Rayment, and G. H. Reed. 1997. Ligand-induced domain movement in pyruvate kinase: structure of the enzyme from rabbit muscle with Mg2+, K+ and L-phospholactate at 2.7Å resolution. Arch. Biochem. Biophys. 345:199–206. [DOI] [PubMed] [Google Scholar]
- Mathews, C. K., K. E. Van Holde, and K. G. Ahern. 1999. Biochemistry, 3rd Ed. Benjamin/Cummings Publishing Company, Redwood, CA.
- Nichols, M. D., K. A. DeAngelis, J. L. Keck, and J. M. Berger. 1999. Structure and function of an archaeal topoisomerase VI subunit with homology to meiotic recombination factor Spo11. EMBO J. 18:6177–6188. [DOI] [PMC free article] [PubMed] [Google Scholar]
- Papazian, D. M., L. C. Timpe, Y. N. Jan, and L. Y. Jan. 1991. Alteration of voltage dependence of Shaker potassium channel by mutations in the S4 sequence. Nature. 349:305–310. [DOI] [PubMed] [Google Scholar]
- Pauling, L. 1960. The Nature of the Chemical Bond and the Structure of Molecules and Crystals: An Introduction to Modern Structural Chemistry. Cornell University Press, Ithaca, New York.
- Sarkar, G., and S. S. Sommer. 1990. The “megaprimer” method of site-directed mutagenesis. Biotechniques. 8:404–407. [PubMed] [Google Scholar]
- Schönherr, R., S. Hehl, H. Herlau, A. Baumann, and S. H. Heinemann. 1999. Individual subunits contribute independently to slow gating of bovine eag potassium channels. J. Biol. Chem. 274:5362–5369. [DOI] [PubMed] [Google Scholar]
- Schönherr, R., L. M. Mannuzzu, E. Y. Isacoff, and S. H. Heinemann. 2002. Conformational switch between slow and fast gating modes: allosteric regulation of voltage sensor mobility in the eag K+ channel. Neuron. 35:935–949. [DOI] [PubMed] [Google Scholar]
- Silverman, W. R., B. Roux, and D. M. Papazian. 2003. Structural basis of two-stage voltage-dependent activation in K+ channels. Proc. Natl. Acad. Sci. USA. 100:2935–2940. [DOI] [PMC free article] [PubMed] [Google Scholar]
- Silverman, W. R., C.-Y. Tang, A. F. Mock, and D. M. Papazian. 2000. Mg2+ modulates voltage-dependent activation in ether-à-go-go potassium channels by binding between transmembrane segments S2 and S3. J. Gen. Physiol. 116:663–677. [DOI] [PMC free article] [PubMed] [Google Scholar]
- Sliz, P., R. Engleman, W. Hengstenberg, and E. F. Pai. 1997. The structure of the enzyme IIA lactose from Lactococcus lactis reveals a new fold and points to possible interactions of a multicomponent system. Structure. 5:775–788. [DOI] [PubMed] [Google Scholar]
- Stec, B., M. J. Mehir, C. Brennan, M. Nolte, and E. R. Kantrowitz. 1998. Kinetic and x-ray structural studies of three mutant E. coli alkaline phosphatases: insights into the catalytic mechanism without the nucleophile Ser102. J. Mol. Biol. 227:647–662. [DOI] [PubMed] [Google Scholar]
- Tang, C.-Y., and D. M. Papazian. 1997. Transfer of voltage independence from a rat olfactory channel to the Drosophila ether-à-go-go K+ channel. J. Gen. Physiol. 109:301–311. [DOI] [PMC free article] [PubMed] [Google Scholar]
- Tang, C.-Y., F. Bezanilla, and D. M. Papazian. 2000. Extracellular Mg2+ modulates slow gating transitions and opening of Drosophila ether-à-go-go potassium channels. J. Gen. Physiol. 115:319–337. [DOI] [PMC free article] [PubMed] [Google Scholar]
- Terlau, H., J. Ludwig, R. Steffan, O. Pongs, W. Stühmer, and S. H. Heinemann. 1996. Extracellular Mg2+ regulates activation of rat eag potassium channel. Pflugers Arch. 432:301–312. [DOI] [PubMed] [Google Scholar]
- Timpe, L. C., T. L. Schwarz, B. L. Tempel, D. M. Papazian, Y. N. Jan, and L. Y. Jan. 1988. Expression of functional potassium channels from Shaker cDNA in Xenopus oocytes. Nature. 331:143–145. [DOI] [PubMed] [Google Scholar]
- Tiwari-Woodruff, S. K., M. A. Lin, C. T. Schulteis, and D. M. Papazian. 2000. Voltage-dependent structural interactions in the Shaker K+ channel. J. Gen. Physiol. 115:123–138. [DOI] [PMC free article] [PubMed] [Google Scholar]
- Warmke, J. W., and B. Ganetzky. 1994. A family of potassium channel genes related to eag in Drosophila and mammals. Proc. Natl. Acad. Sci. USA. 91:3438–3442. [DOI] [PMC free article] [PubMed] [Google Scholar]


