Abstract
The adsorption of membrane-associated protein cytochrome c to anionic lipid bilayers of dioleoyl phosphatidylglycerol was studied in low ionic strength physiological buffer using atomic force microscopy. The bilayers were supported on polylysinated mica. The formation of stable, single lipid bilayers was confirmed by imaging and force spectroscopy. Upon addition of low concentrations of cytochrome c, protein molecules were not topographically visible on the lipid bilayer-buffer interface. However, the forces required to punch through the bilayer by indentation using the atomic force microscopy probe were significantly lower after protein adsorption, which suggest that the protein inserts into the bilayer. Moreover, the apparent thickness of the bilayer remained unchanged after cytochrome c adsorption. Yet, mass spectroscopy and visible light absorption spectroscopy confirmed the presence of cytochrome c in the lipid bilayers. These results suggest that 1), cytochrome c inserts into the bilayer and resides in its hydrophobic core; 2), cytochrome c insertion changes the mechanical properties of the bilayer significantly; and 3), bilayer force spectroscopy may be a useful tool in investigating lipid-protein interactions.
INTRODUCTION
Cytochrome c is considered a peripheral membrane protein that binds to the outer surface of the inner mitochondrial membrane (Voet and Voet, 1990). The protein plays an essential role in the electron transport chain of the respiratory process by shuttling electrons between cytochrome c reductase and cytochrome c oxidase. The inner mitochondrial membrane is rich in the anionic phospholipid cardiolipin, and cytochrome c binds to it through electrostatic and hydrophobic interactions between the protein and the lipids (Ott et al., 2002). There has been extensive research in understanding the role of mitochondria in apoptosis, or cell death, and it is believed that the release of cytochrome c from the inner mitochondrial membrane is an important first step in apoptosis (Gogvadze et al., 2001; Lemeshko, 2002; Ott et al., 2002; Berezhna et al., 2003; Iverson et al., 2004). One hypothesis of how the release of cytochrome c occurs states that excess mitochondrial Ca2+ increases the permeability of the inner mitochondrial membrane, which leads to the rupturing of the outer mitochondrial membrane due to matrix swelling and eventual release of cytochrome c (Gogvadze et al., 2001). Another hypothesis states that the pro-apoptotic protein Bax promotes the cytochrome c release from the mitochondria (Gogvadze et al., 2001; Ott et al., 2002; Iverson et al., 2004). Within the latter hypothesis, there has been debate over whether cardiolipin is required for Bax-mediated pore formation resulting in the release of cytochrome c (Kuwana et al., 2002; Iverson et al., 2004). Although the exact mechanism of cytochrome c release is not yet clear, it is important to understand how cytochrome c interacts with these negatively-charged lipid membranes on a molecular level.
Results from theoretical models and experimental data derived from bulk methods, such as infrared spectroscopy (Choi and Swanson, 1995; Käsbauer and Bayerl, 1999), titration calorimetry (Heimburg et al., 1999; Zuckermann and Heimburg, 2001), solid state nuclear magnetic resonance spectroscopy (Pinheiro et al., 1997), electron spin resonance spectroscopy (Heimburg and Marsh, 1995; Kostrzewa et al., 2000), and fluorescence spectroscopy (Rytömaa and Kinnunen, 1995; Gorbenko, 1999; Tuominen et al., 2002), have suggested that cytochrome c either adsorbs to the surface of anionic lipid membranes or inserts into the membrane layer. These techniques are generally not adequate for surface studies alone because they lack the lateral resolution on the nanoscale level. Atomic force microscopy (AFM) is one technique that allows for such nanometer range lateral resolution. Another advantage of AFM is the ability to gain such high resolution in aqueous solution, which is biologically relevant. For the first time here the AFM is used to obtain more direct evidence that cytochrome c inserts into bilayers composed of the anionic lipid dioleoyl phosphatidylglycerol (DOPG). Mueller et al. (2000) used AFM to look at cytochrome c adsorption on the surface of a bilayer composed of a mixture of negatively and neutrally charged lipids with cholesterol in high salt buffers. In this study, a physiological low ionic strength buffer was used to reduce the effect of high salt on cytochrome c adsorption. The choice of a low ionic strength buffer for the current study was dictated by previous studies indicating that the binding strength of cytochrome c to DOPG is strong in the absence of salts (Heimburg and Marsh, 1995). Supported lipid bilayers are useful models for cell membranes and various systems have been studied using the AFM (Mou et al., 1994; Egawa and Furusawa, 1999; Muresan and Lee, 2001; Richter et al., 2003; Tokumasu et al., 2003). The use of only DOPG allows for a well-defined model system, and DOPG is a precursor to cardiolipin. Force spectroscopy using AFM revealed that the force needed to punchthrough the DOPG bilayer is significantly less in the presence of cytochrome c. The resulting “softer” membrane suggests that when cytochrome c inserts into the DOPG bilayer, the bilayer becomes more permeable and more fluid-like. That is, cytochrome c changes the mechanical properties of the anionic DOPG bilayer. Since cytochrome c is not visible on the surface of the bilayer, it is concluded that it fully inserts into the bilayer. Imaging and force spectroscopy also provided evidence that the cytochrome c adsorption to DOPG is irreversible, which suggests that the protein-lipid interaction is very strong and stable, and that its release from the mitochondria may be an active process, possibly cooperative.
MATERIALS AND METHODS
Cytochrome c (horse heart, MW 12,384, Sigma-Aldrich, St. Louis, MO) was purchased in powder form of >95% purity based on emittance at 550 nm (reduced) and was used without further purification. In most of the experiments discussed here cytochrome c was dissolved in phosphate buffer (NaH2PO4·H2O and Na2HPO4·7H2O), pH 6.8, without any additional salts.
A 2 mg/mL solution of DOPG (Avanti Polar Lipids, Alabaster, AL) in 50 mM of the NaPO4 buffer was placed in a Vortex shaker for 3 h. The lipid suspension was then extruded through a 100 nm polycarbonate filter by passing the solution through 19 times. Lipid mixtures were stored under argon gas. All experiments were performed at room temperature where the lipid is in the fluid phase (the melting transition temperature of DOPG is −18°C and of dilauroyl phosphatidylcholine (DLPC), −1°C).
A fresh solution of 1 mg/mL poly-l-lysine (hydrobromide, MW 3800, polydispersity 1–4 kDa, Sigma-Aldrich) in ultrapure water was adsorbed to freshly cleaved mica (Ted Pella, Redding, CA) for 10 min. The sample was washed with 200 μL ultrapure water and dried with argon gas. Additional rinses were done with the phosphate buffer after the dried modified mica substrates were placed in the AFM fluid cell to remove any possible unbound poly-l-lysine from the system.
Atomic force microscopy
Picoforce Multimode AFM with Nanoscope IV controller and type E scanner head (Veeco/Digital Instruments, Santa Barbara, CA) was used for imaging and force spectroscopy. All imaging was performed at room temperature and in a fluid cell in tapping mode AFM with oxide sharpened silicon nitride cantilevers (Veeco/Digital Instruments) with nominal spring constants of 0.58 N/m. Force spectroscopy was performed with the same cantilevers in contact mode. Each prepared bilayer sample was first imaged and then indented for force spectroscopy using a single probe, so that all the data from any particular sample were obtained with a probe of the same stiffness and same tip radius of curvature to ensure self-consistency within each data set.
Mass spectroscopy
Mass spectroscopy measurements were performed on a Kratos PCKompact Probe MALDI-TOF (Matrix Assisted Laser Desorption Ionization-Time of Flight) spectrometer (Kratos Analytical/Shimadzu, Manchester, England). The instrument was set at linear high with laser power of 82. Three independent sets of experiments were performed where each time a total of 18 target wells were coated with poly-l-lysine. On 12 of those wells, DOPG was adsorbed for times similar to those needed for complete bilayer coverage on modified mica. Finally, six of those wells were used for protein adsorption. A 1:1 mixture of sample to appropriate carrier matrix was dried on the target spot on the linear steel target and placed in the target chamber of the mass spectrometer. All 18 targets were then scanned and the recorded spectra inspected for the presence and/or absence of the different species.
UV/visible light absorption
Visible light absorption experiments were performed on a PerkinElmer Lambda 25 spectrometer (PerkinElmer Life and Analytical Sciences, Boston, MA). For light absorption measurements, we first recorded the absorption spectra of 5 and 10 μg/mL solutions of cytochrome c. These solutions were then introduced onto adsorbed DOPG bilayers and after incubation of 30 min, the supernatant was collected and their absorption spectra recorded.
RESULTS AND DISCUSSION
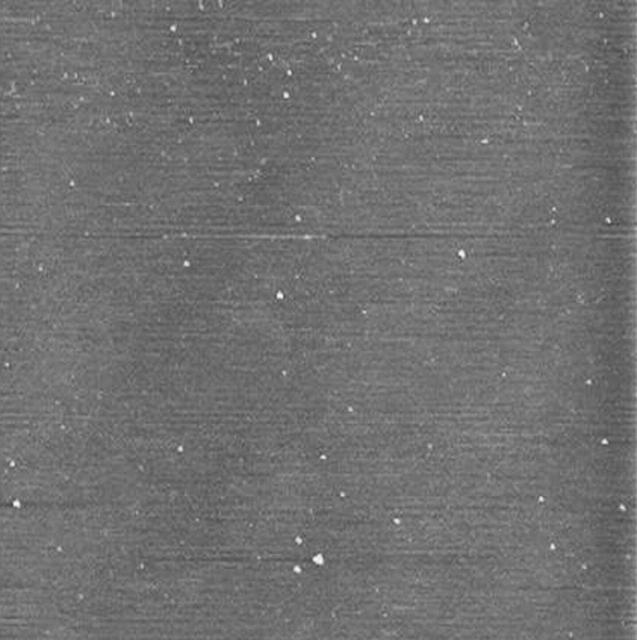
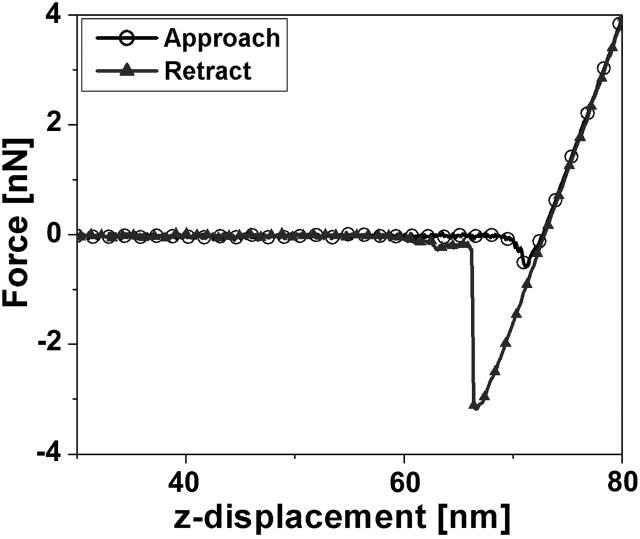
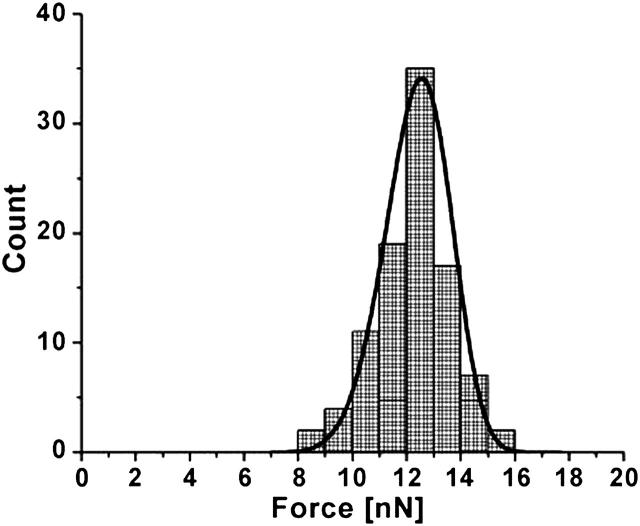
AFM force spectroscopy suggests that 1 mg/mL solution of 3800 Dalton polylysine adsorbed as a single layer to the surface of the mica substrate. The nature of the polylysinated mica surface was examined by AFM topographic imaging and by force spectroscopy. Fig. 1 shows a typical polylysinated mica surface which looks very flat with measured rms roughness of 0.6 ± 0.35 nm. Fig. 2 shows a typical approach-retract force curve recorded with the AFM. The polylysinated mica surface was submerged in and rinsed with the 50 mM NaPO4 buffer. As expected, on approach there is an attractive force of a few hundred pN due to the positively-charged polylysine layer and no punchthrough was observed. Upon retraction, a rather strong adhesion (>2 nN) and pulling of polylysine molecules from the surface was evident. Since polylysine is likely forming a dense, closely-packed layer, a population of polylysine chains will most likely participate in the pulling force. Hence, typical single-molecule pulling curves were almost never observed. The absence of a punchthrough would be expected for such a small molecular weight of polylysine that does not form thick adsorbed layers. When the 0.4 mg/mL solution of the DOPG vesicles in 50 mM NaPO4 buffer was introduced, DOPG vesicles adsorbed to the polylysine layer over time, with the formation of a complete bilayer within two hours, and with excess lipid vesicles sparsely adsorbed to the bilayer surface. This is in stark contrast to the observed instantaneous formation of a bilayer of DOPG on bare mica in buffers composed of 50 mM NaCl and 2 mM MgCl2. DOPG bilayers formed on bare mica in the presence of salt were not reproducible, and often resulted in the formation of multiple bilayers. The low ionic strength conditions throughout this study provided good, reproducible single bilayers and allowed for the strongest interactions between cytochrome c and the lipid bilayer. The thickness of the single bilayer of DOPG adsorbed on mica may be obtained in two ways. The simplest way measures the depth of defects in the bilayer observed in images (Fig. 3). Whenever defects were present, we measured a thickness of 3.7–4.5 nm, which is consistent with a thickness of 4.1 nm reported for 18:1 PC bilayers (Rawicz et al., 2000). When no obvious defects were present, we used the approach-retract displacement versus deflection curves (Fig. 4) showing the bilayer punchthrough to estimate the thickness as described in the Appendix. Imaging was performed during initial incubation of DOPG vesicle solution onto the mica surface, which lasted ∼2 h and during which we observed steady increase of mica surface coverage by a single DOPG bilayer. When coverage was complete we collected a number of force curves on the DOPG bilayer. The bilayer was then rinsed with 50 mM phosphate buffer in an effort to remove any excess lipids that remained on the surface or in solution. Imaging and force spectroscopy confirm that the bilayer remains intact after rinsing, suggesting that the bilayer was strongly adsorbed and stable on the polylysinated mica. Fig. 3 shows a partially formed bilayer where the formation of a single bilayer is confirmed. The defects seen measured 4–5 nm in depth. The variance in the thickness is attributed to the underlying polylysine layer. Once the bilayer was fully formed we collected a large number of force-distance curves and measured the force at punchthrough. For consistency, the term “punchthrough” will be used hereafter to describe the force required to fully penetrate through the bilayer down to the polylysine layer. Fig. 5 shows a typical histogram of measured forces. If one assumes an approximately spherical probe of 10 nm nominal radius of curvature and a bilayer thickness of ∼5 nm, simple force balance arguments can give an estimate of the line tension in the bilayer at the moment of punchthrough. The estimated line tension when the punchthrough force is ∼12 nN is of the order of 0.2 nN/nm. This number is an order of magnitude higher than one would measure for the rupture of giant unilamellar vesicles (GUVs) (Rawicz et al., 2000), and this may be attributed to the additional constraint that the poly-l-lysine provides. The actual values would also differ with probe spring constant and probe geometry. The force measurements were repeated after thoroughly rinsing the DOPG bilayer surface with 50 mM phosphate buffer and no statistically significant differences were observed.
FIGURE 1.
3.8 kDa poly-l-lysine on mica in 50 mM NaPO4. The short polylysine chain results in a near perfectly flat surface, with full coverage of the mica. 5 μm scan, full z range is 10 nm.
FIGURE 2.
Typical approach-retract force curve on poly-l-lysinated mica. The positively charged surface induces an attractive force of a few hundred pN on approach and, upon retraction, a strong adhesion force of >2 nN. No punchthrough of the polylysine layer is observed, which is an indication of a tightly-packed layer.
FIGURE 3.
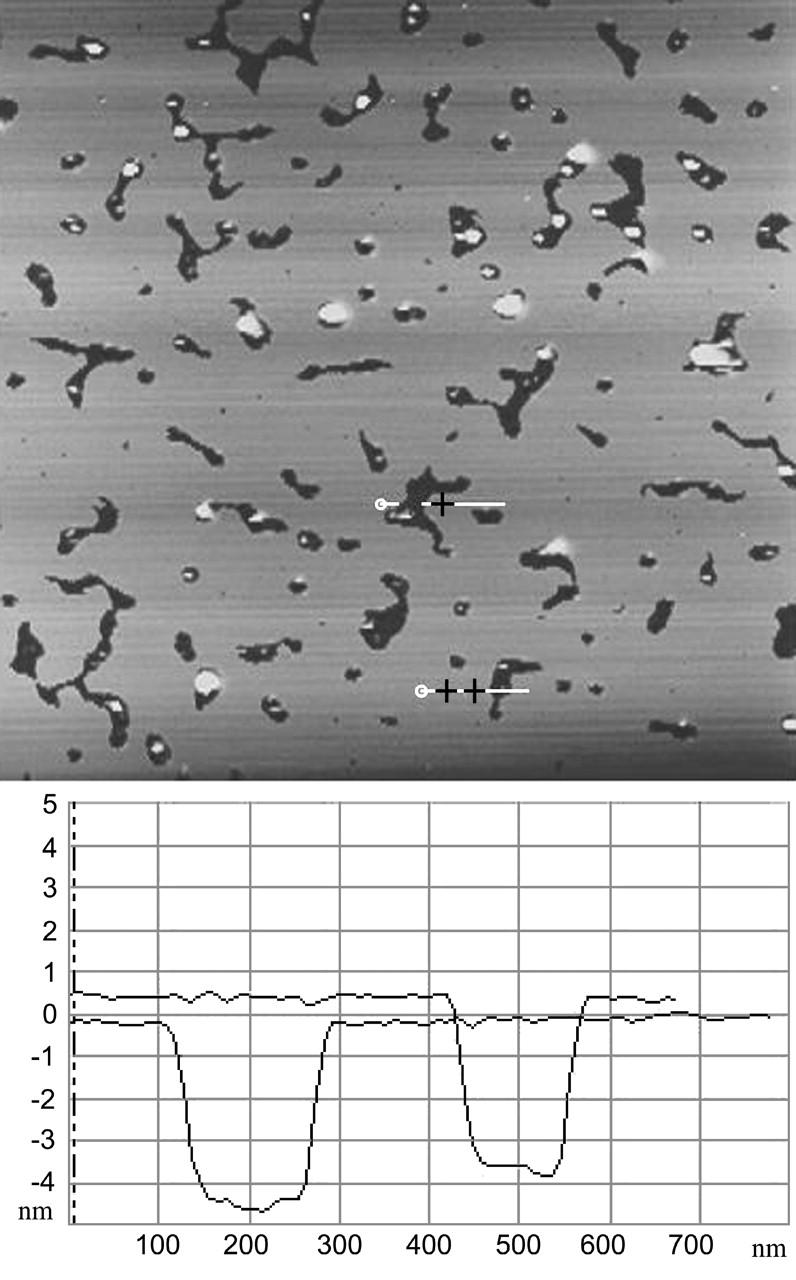
Partial coverage of polylysinated mica surface with DOPG. Defects in the lipid bilayer and nonadhered vesicles are clearly visible. Complete coverage is reached in ∼2 h. The thickness of the bilayer is 4–5 nm. Vertical scale is 10 nm. Scan size is 7 μm.
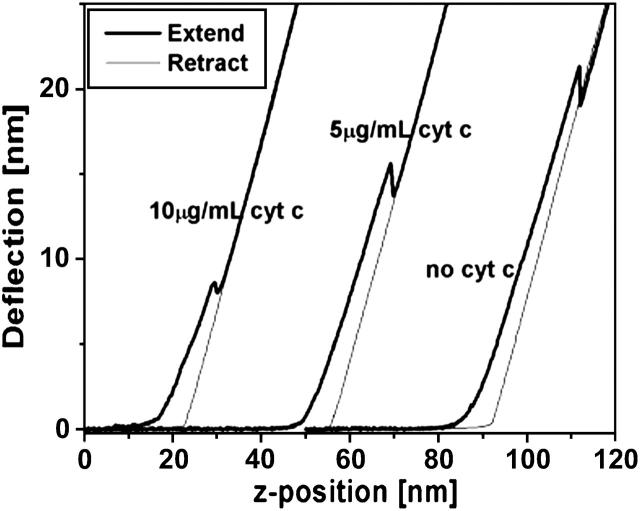
FIGURE 4.
Typical extend-retract curves for 10 μg/mL and 5 μg/mL solutions of cytochrome c adsorbed in DOPG bilayer and bare DOPG bilayer. Punchthrough of the DOPG bilayer can be observed in all three cases. All three curves were collected using the same cantilever with nominal stiffness of 0.58 N/m.
FIGURE 5.
Typical histogram of punchthrough force at DOPG bilayer rupture. Also shown is the fitted probability density function from Eq. 1.
There have been very few theoretical studies of the punchthrough force for supported lipid bilayers. Butt and Franz (Butt and Franz, 2002; Loi et al., 2002) modified previous theories to calculate the probability that the spontaneous continuously forming holes in the bilayer due to thermal fluctuations will develop into a complete punchthrough. The force applied by the cantilever controls the process by lowering the energy barrier to hole formation. The theory is termed “continuum (hole) nucleation theory” and the applied force works by storing elastic energy into the bilayer according to the elastic foundation model in contact mechanics. The model assumes a bilayer with lateral fluidity and linear spring stiffness in the vertical direction (Johnson, 1985). The calculated probability distribution of the punchthrough force is given by the following expression
 |
(1) |
where Γ0 is the gamma function of order zero, A is related to the thermal fluctuations of the cantilever and represents the frequency at which the cantilever “attempts” a punchthrough, k is the cantilever spring constant, u is the tip velocity during the measurement, R is the tip radius of curvature, T is the line tension in the bilayer, and FS = 2πRS where S is the energy at the various interacting interfaces. We fitted the histograms of punchthrough force using the above equation to estimate the bilayer line tension, T, the frequency factor, A, and the interfacial energy, S, for the experiments. We used R = 10 nm as the nominal value of the tip radius of curvature, and u = 200 nm/s, which was the typical tip velocity during the measurements. Different indentation rates were not closely examined, but because force rate is known to affect the punchthrough strength of bilayers and to allow comparisons with published results from giant unilamellar vesicle experiments (Rawicz et al., 2000), the rate was kept approximately constant and low. The corresponding fitted probability function is superimposed onto the collected data in Fig. 5. The estimated line tension at punchthrough is about T = 0.42 nN/nm, indicating the strength of the bilayer attachment to the poly-l-lysinated mica. The frequency factor A came out to be 500 Hz, considerably lower than the cantilever natural frequency, and the interface energy was equal to S = 0.12 nN/nm.
After the formation of a complete DOPG bilayer, different concentrations of cytochrome c were introduced. Imaging was performed immediately after the introduction of cytochrome c and for extended periods of time during which it was observed that the bilayer surface did not change in any visible manner. It is concluded that either the protein does not adsorb to the bilayer with any strength or that it incorporates into the bilayer in a manner that makes it topographically indistinguishable from bare DOPG. Specifically, when a 5 μg/mL solution of cytochrome c in 50 mM NaPO4 buffer was introduced, the protein did not appear to adsorb to the bilayer surface. This observed behavior is different from the visibly observed adsorption of cytochrome c on the substrate-buffer interface of bare mica, polylysinated mica, and neutrally-charged (DLPC) bilayers (not shown) in experiments performed in parallel as positive controls. One possible reason for the absence of cytochrome c from the bilayer surface may be that the AFM probe is continuously displacing protein molecules from the fluid bilayer surface during scanning. Since cytochrome c is positively charged, if cytochrome c adsorbs strongly enough onto the surface of a neutrally-charged bilayer as to allow AFM imaging, then one would expect that the binding to an anionic lipid bilayer surface would also be strong enough for the same purpose. Therefore, although cytochrome c was not seen on the surface, this cannot be due to the probe displacing the molecules during scanning; in that event imaging would also normally be unstable and of poor quality, which was not the case here. To examine whether the thickness of the bilayer changed, a large number of force-distance curves (Fig. 4) were collected and the thickness measured as described in the Appendix. Fig. 6 shows representative histograms of bilayer thickness before and after the introduction of a 5 μg/mL cytochrome c solution. The thickness of the bilayer after adsorption of cytochrome c does not significantly change. However, force-distance curves in Fig. 4 and the force histograms in Fig. 7 show a significant reduction in the force required to punch through the bilayer after the introduction of cytochrome c. Therefore, one may conclude that cytochrome c has been inserted into the bilayer and its localization and conformation within the bilayer does not alter the bilayer surface topography. However, the different structures of lipid and protein cause the lipid to become more “fluid”, implying a higher rate of thermal fluctuations (Heimburg and Marsh, 1995; Zuckermann and Heimburg, 2001). This is consistent with high levels of mismatch between the surface charge distribution on lipid and protein, respectively. A thorough wash with 50 mM NaPO4 buffer solution did not appear to alter the bilayer which means that the wash does not reverse the insertion of cytochrome c into the bilayer. The wider distribution of the force histogram may be an indication of nonuniformity in the cytochrome c distribution within the bilayer.
FIGURE 6.
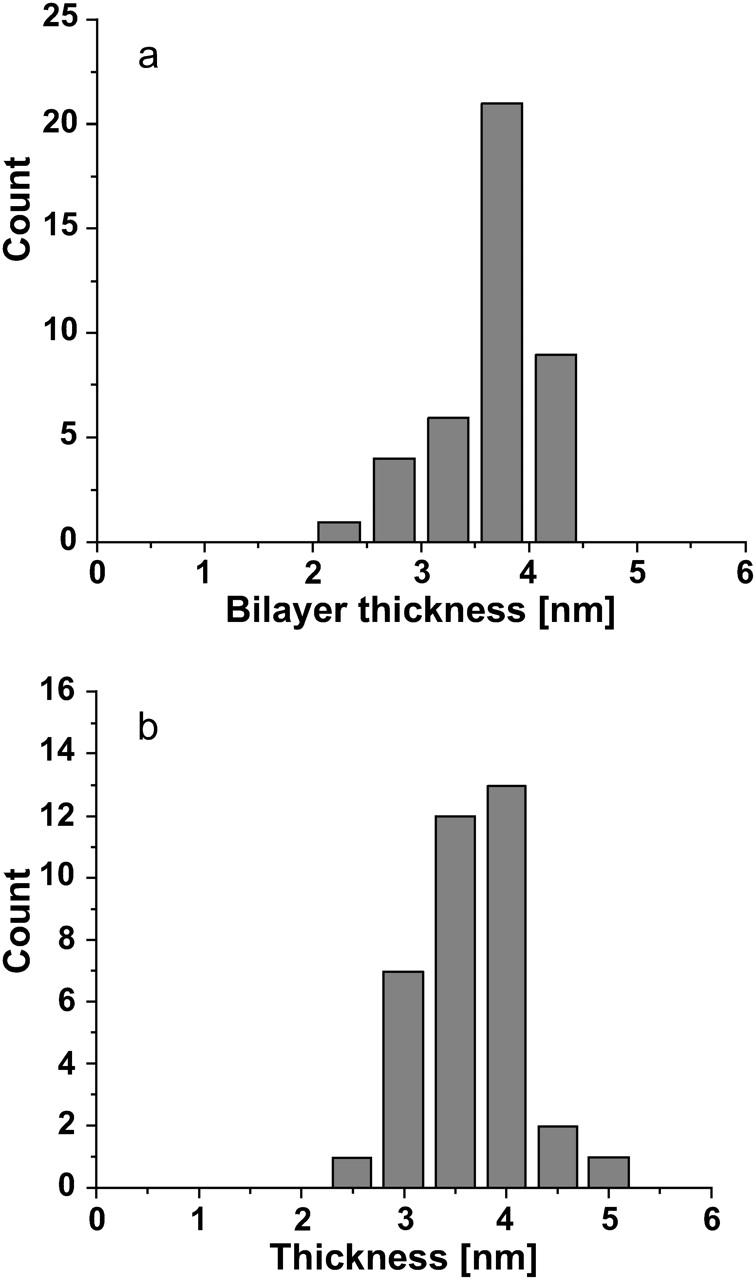
DOPG bilayer thickness (a) before and (b) after the introduction of 5 μg/mL cytochrome c. Differences in the mean are within instrumental noise although higher statistical moments seem to differ significantly possibly indicating a more fluid environment.
FIGURE 7.
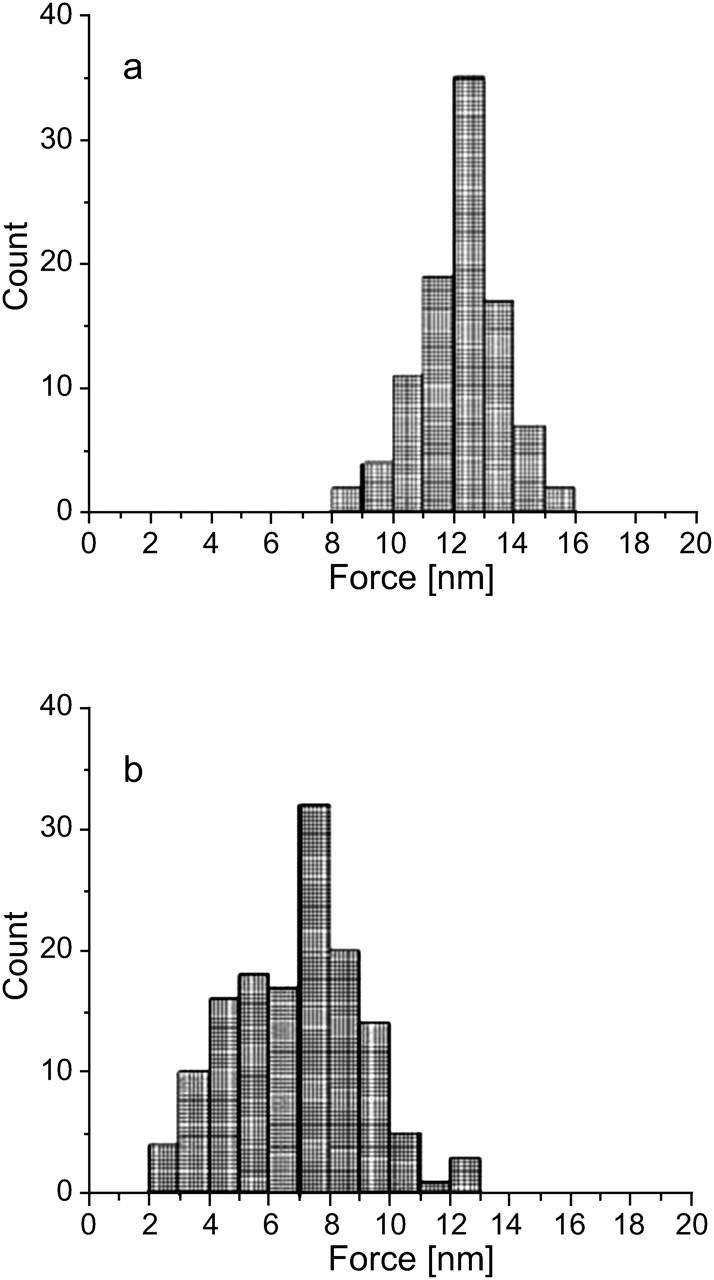
DOPG bilayer punchthrough force histograms (a) before and (b) after the introduction of 5 μg/mL cytochrome c. The mean force is reduced by ∼45% and, again, higher statistical moments are consistent with a more fluid environment.
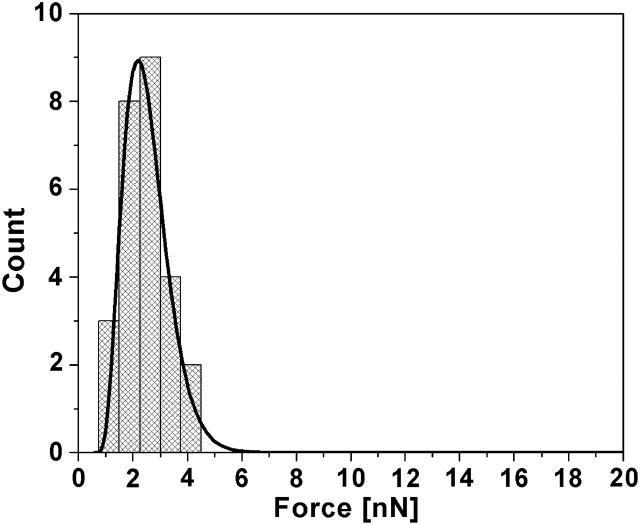
When a 10 μg/mL solution of cytochrome c in 50 mM NaPO4 buffer was introduced, similarly to the 5 μg/mL solution, cytochrome c did not appear to adsorb to the bilayer surface. However, over a span of 20 min after introduction of the 10 μg/mL solution, the excess lipid vesicles that had adsorbed to the bilayer surface desorbed from the surface, and shallow defects in the bilayer were observed. Defects were not observed to grow in time even after several hours. Fig. 8 shows an image of the bilayer surface showing these defects along with sections across some such defects that show their depth to be ∼1 nm. Images obtained before the introduction of cytochrome c showed no such defects. Free cytochrome c molecules are roughly spherical with radius of ∼1.2 nm. Therefore, if cytochrome c molecules insert into the hydrophobic region of the bilayer and form nanodomains of pure cytochrome c as the concentration increases, it would create defects similar to what is seen here. Although the mechanism of defect formation is not completely understood, one possibility is that cytochrome c displaces both leaflets of the single bilayer, and resides in the hydrophobic core of the lipid bilayer. Within those nanodomains it was not possible to distinguish individual protein molecules. Phase imaging in tapping mode AFM also did not yield any additional useful information from within the defects of the bilayer. Yet, AFM force-distance curves indicate that a much smaller force is needed to punch through the bilayer (Fig. 4). The force magnitude was measured to be four to five times smaller than the force needed to punch through the DOPG bilayer before cytochrome c adsorption. Fig. 9 shows the representative corresponding force histogram and the fitted probability density function from Eq. 1. The line tension came out to be 0.11 nN/nm, which is ∼4 times lower than the tension in the DOPG bilayer before the addition of cytochrome c. The frequency factor A did not change significantly but the interface energy was lower by about an order of magnitude. These results further support the hypothesis that cytochrome c interpenetrates the DOPG bilayer and changes the properties of the bilayer. After rinsing with 50 mM NaPO4, neither the topography nor the punchthrough force of the bilayer changed, again indicating irreversible adsorption due to strong protein-lipid interactions. The thickness of the DOPG bilayer did not significantly change after the adsorption of 10 μg/mL solution of cytochrome c (also seen in the case of 5 μg/mL cytochrome c), and any small observed differences are within the noise of the instrument. Experiments with higher concentrations (as high as 200 μg/mL) of cytochrome c (not shown), did not significantly affect the thickness nor the punchthrough force of the bilayer. This suggests that at 10 μg/mL cytochrome c, the bilayer has become saturated with adsorbed protein.
FIGURE 8.
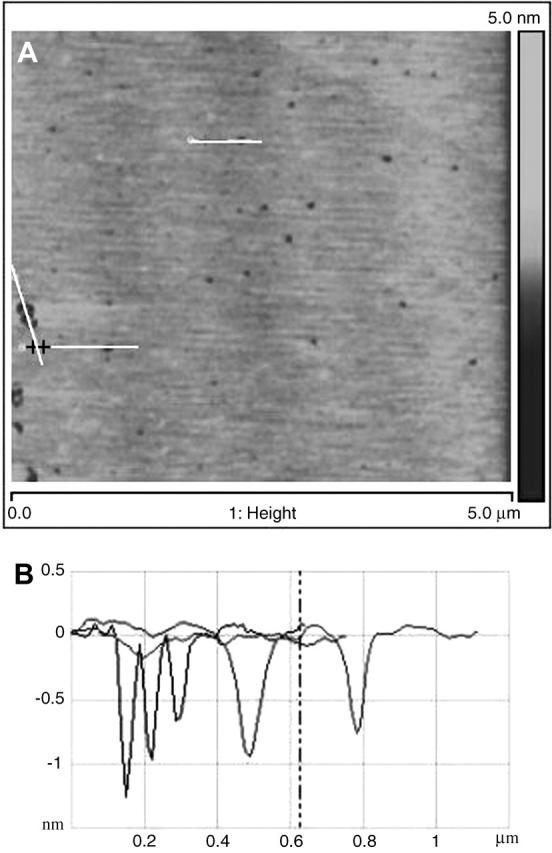
Defects appear on the bilayer after incubating 10 μg/mL cytochrome c on DOPG for more than 20 min. Sections through the defects (lines in A) show the defects to be ∼1 nm in depth (curves in B).
FIGURE 9.
DOPG bilayer punchthrough force histogram after the introduction of 10 μg/mL cytochrome c. The mean force is reduced by about a factor of five and, again, higher statistical moments are consistent with a more fluid environment. Also shown is the fitted probability density function from Eq. 1.
The above series of experiments, from the modification of the mica to the introduction of cytochrome c, were repeated many times (>20), each time using a single probe for imaging and force spectroscopy throughout the experiment that lasted several hours each. Imaging was performed at exactly the same location on the bare bilayer and after the introduction of the protein. The actual measured mean punchthrough force varied between samples by a factor of more than 2, which is expected because the force depends on the probe stiffness, the radius of curvature and the attachment strength of the bilayer to the substrate. In fact, a closer look at Eq. 1 revealed that the punchthrough force is roughly linearly dependent on the probe radius and has a weaker dependence on the probe stiffness. Probe calibration and tip radius estimation would reduce but not eliminate the variability. The observation that remained consistent, however, across all samples was the reduction in punchthrough force by a factor of 4 to 5 after introduction of 10 μg/mL of cytochrome c. It was, therefore, deemed that the most likely scenario is that cytochrome c inserts into the bilayer.
Since cytochrome c was not visibly observed on the surface of the DOPG bilayer, mass spectroscopy and visible light absorption techniques were employed as complementary methods supporting the presence of cytochrome c in the bilayer. Mass spectroscopy spectra of 0.2 mg/mL bulk solution of cytochrome c in 50 mM NaPO4 show a peak at 12528 mass/charge, corresponding to the molecular mass of cytochrome c (Fig. 10 a). Poly-l-lysine coated targets showed a range of peaks between 1 and 4 kDa, which is consistent with the polydispersity of the poly-l-lysine stock. Further, DOPG targets gave additional peaks below 1 kDa, again consistent with the molecular mass of DOPG (797 Da). When cytochrome c was adsorbed to the DOPG bilayer, peaks appeared at mass/charge values of 12303, 12408, and 12919. It is expected that the presence of DOPG, which seems to interact strongly with cytochrome c, and of poly-l-lysine will introduce additional peaks in the neighborhood of the pure cytochrome c peak (Fig. 10 b).
FIGURE 10.
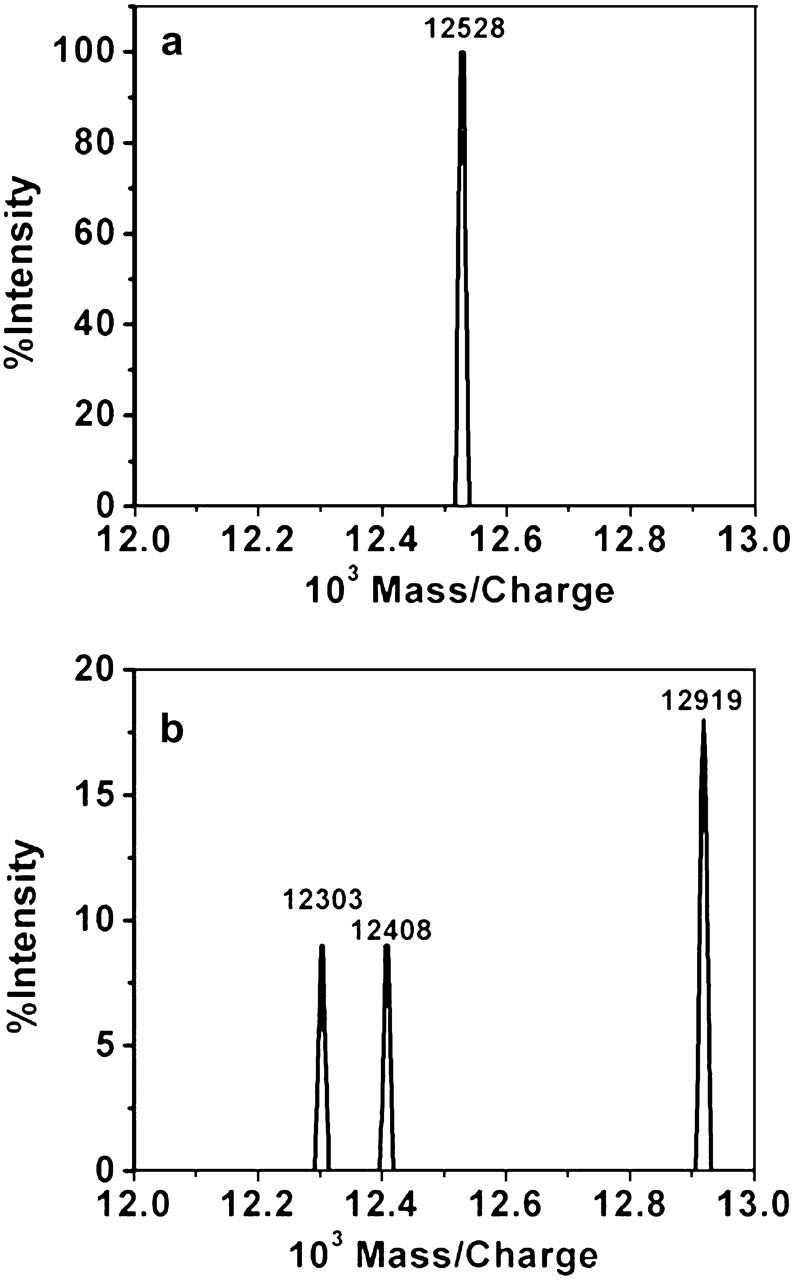
Mass spectroscopy spectra for (a) 0.2 mg/mL cytochrome c solution in 50 mM NaPO4 buffer and (b) 10 μg/mL cytochrome c solution adsorbed onto DOPG bilayer.
Visible light absorption measurements (not shown) provided additional indication of the presence of cytochrome c in the DOPG bilayer. The supernatant of a 5 μg/mL cytochrome c solution after a 30 min incubation on DOPG was too dilute to obtain consistent results. However, the 10 μg/mL solution consistently showed that ∼80–85% of cytochrome c adsorbed into the DOPG bilayer.
Whether positively charged cytochrome c adsorbs at the anionic DOPG bilayer-buffer interface or inserts into the bilayer depends on whether electrostatic or hydrophobic forces dominate the protein-lipid interactions. From electron spin resonance experiments, Heimburg and Marsh (1995) concluded that at low ionic strength, cytochrome c inserts into the hydrophobic core of a DOPG bilayer, and that inserted molecules of cytochrome c increase the overall area of the bilayer and reduce the lipid charge density. Also, at low ionic strength, titration calorimetry experiments have shown a slow endothermal reaction in binding isotherms that is associated with protein insertion into the lipid bilayer (Zuckermann and Heimburg, 2001). Other proteins, such as SecA (Breukink et al., 1992) and acyl-CoA (Simonsen et al., 2003), have also been shown to insert into phospholipid membranes. In this study, using AFM, direct evidence that cytochrome c inserts into the hydrophobic tails of the DOPG membrane, instead of adsorbing to the anionic head group-buffer interface, is obtained. And for the first time, the changes in the mechanical properties of the DOPG bilayer (i.e., becoming more fluid) due to insertion of cytochrome c were measured.
Acknowledgments
We thank Dr. Terry M. Phillips from the Ultramicro Analytical Immunochemistry Resource in the Division of Bioengineering and Physical Science (DBEPS), Office of Research Services, Office of the Director, at the National Institutes of Health (NIH) for his help with the mass spectroscopy measurements; Dr. Albert J. Jin, also of DBEPS, for critically reading and discussing the manuscript and for his contributions to the AFM facility; and Dr. Allen Minton, of the National Institute for Diabetes, Digestive and Kidney Diseases (NIDDK) at NIH for his suggestions and encouragement.
APPENDIX: MEASURING BILAYER THICKNESS BY AFM FORCE SPECTROSCOPY
The customary method for measuring indentation, δ, on force-distance curves requires that we know the contact point. Were the contact point (z0, d0) known one could simply calculate indentation as the difference between the piezo z-displacement of the cantilever and the associated deflection, namely, δ = (z−z0) − (d−d0), where z and d are the final piezo z position and cantilever deflection, respectively. In this case, we know the final position of interest, which is the position of bilayer punchthrough. The total indentation to that point is equal to the sample thickness. The contact point is difficult to localize because at low forces near contact, the bilayer acts as a soft deformable surface. The second method for estimating the bilayer thickness exploits the difference between the approach and the retract curves and, again, if the initial contact point (z0, d0) were known, the bilayer thickness will be equal to the z position difference between the two curves, namely, thickness t = z0,retract − z0,approach, where both z0s are measured at the same contact point deflection offset d0. It is suggested that, instead of using the actual retract curve, one should use a straight line at 45° from the point of bilayer punchthrough to avoid the tip-surface interactions near the point of tip detachment from the bilayer. This method also depends on the accurate estimation of the contact point. The two methods give identical results for the same choice of contact point except outside the contact region. Therefore, the first point at which the two methods give the same thickness is the correct contact point.
References
- Berezhna, S., H. Wohlrab, and P. M. Champion. 2003. Resonance Raman investigations of cytochrome c conformational change upon interaction with the membranes of intact and Ca2+-exposed mitochondria. Biochemistry. 42:6149–6158. [DOI] [PubMed] [Google Scholar]
- Breukink, E., R. A. Demel, G. de Korte-Kool, and B. de Kruijff. 1992. SecA insertion into phospholipids is stimulated by negatively charged lipids and inhibited by ATP: a monolayer study. Biochemistry. 31:1119–1124. [DOI] [PubMed] [Google Scholar]
- Butt, H.-J., and V. Franz. 2002. Rupture of molecular thin films observed in atomic force microscopy. I. Theory. Phys. Rev. E. 66:031601. [DOI] [PubMed] [Google Scholar]
- Choi, S., and J. M. Swanson. 1995. Interaction of cytochrome c with cardiolipin: an infrared spectroscopic study. Biophys. Chem. 54:271–278. [DOI] [PubMed] [Google Scholar]
- Egawa, H., and K. Furusawa. 1999. Liposome adhesion on mica surface studied by atomic force microscopy. Langmuir. 15:1660–1666. [Google Scholar]
- Gogvadze, V., J. D. Robertson, B. Zhivotovsky, and S. Orrenius. 2001. Cytochrome c release occurs via Ca2+-dependent and Ca2+-independent mechanisms that are regulated by Bax. J. Biol. Chem. 276:19066–19071. [DOI] [PubMed] [Google Scholar]
- Gorbenko, G. P. 1999. Structure of cytochrome c complexes with phospholipids as revealed by resonance energy transfer. Biochim. Biophys. Acta. 1420:1–13. [DOI] [PubMed] [Google Scholar]
- Heimburg, T., B. Angerstein, and D. Marsh. 1999. Binding of peripheral proteins to mixed lipid membranes: Effect of lipid demixing upon binding. Biophys. J. 76:2575–2586. [DOI] [PMC free article] [PubMed] [Google Scholar]
- Heimburg, T., and D. Marsh. 1995. Protein surface-distribution and protein–protein interactions in the binding of peripheral proteins to charged lipid membranes. Biophys. J. 68:536–546. [DOI] [PMC free article] [PubMed] [Google Scholar]
- Iverson, S. L., M. Enoksson, V. Gogvadze, M. Ott, and S. Orrenius. 2004. Cardiolipin is not required for Bax-mediated cytochrome c release from yeast mitochondria. J. Biol. Chem. 279:1100–1107. [DOI] [PubMed] [Google Scholar]
- Johnson, K. L. 1985. Contact Mechanics. Cambridge University Press, Cambridge, England.
- Käsbauer, M., and T. M. Bayerl. 1999. Formation of domains of cationic or anionic lipids in binary lipid mixtures increases the electrostatic coupling strength of water-soluble proteins to supported bilayers. Biochemistry. 38:15258–15263. [DOI] [PubMed] [Google Scholar]
- Kostrzewa, A., T. Páli, W. Froncisz, and D. Marsh. 2000. Membrane location of spin-labeled cytochrome c determined by paramagnetic relaxation agents. Biochemistry. 39:6066–6074. [DOI] [PubMed] [Google Scholar]
- Kuwana, T., M. R. Mackey, G. Perkins, M. H. Ellisman, M. Latterich, R. Schneiter, D. R. Green, and D. D. Newmeyer. 2002. Bid, Bax, and lipids cooperate to form supramolecular openings in the outer mitochondrial membrane. Cell. 111:331–342. [DOI] [PubMed] [Google Scholar]
- Lemeshko, V. V. 2002. Cytochrome c sorption-desorption effects on the external NADH oxidation by mitochondria. J. Biol. Chem. 277:17751–17757. [DOI] [PubMed] [Google Scholar]
- Loi, S., G. Sun, V. Franz, and H.-J. Butt. 2002. Rupture of molecular thin films observed in atomic force microscopy. II. Experiment. Phys. Rev. E. 66:031602. [DOI] [PubMed] [Google Scholar]
- Mou, J., J. Yang, and Z. Shao. 1994. Tris(hydroxymethyl)aminomethane (C4H11NO3) induced a ripple phase in supported unilamellar phospholipid bilayers. Biochemistry. 33:4439–4443. [DOI] [PubMed] [Google Scholar]
- Mueller, H., H.-J. Butt, and E. Bamberg. 2000. Adsorption of membrane-associated proteins to lipid bilayers studied with an atomic force microscope: Myelin basic protein and cytochrome c. J. Phys. Chem. B. 104:4552–4559. [Google Scholar]
- Muresan, A. S., and K. Y. C. Lee. 2001. Shape evolution of lipid bilayer patches adsorbed on mica: an atomic force microscopy study. J. Phys. Chem. B. 105:852–855. [Google Scholar]
- Ott, M., J. D. Robertson, V. Gogvadze, B. Zhivotovsky, and S. Orrenius. 2002. Cytochrome c release from mitochondria proceeds by a two-step process. Proc. Natl. Acad. Sci. USA. 99:1259–1263. [DOI] [PMC free article] [PubMed] [Google Scholar]
- Pinheiro, T. J., M. J. Duer, and A. Watts. 1997. Phospholipid headgroup dynamics in DOPG-d5-cytochrome c complexes as revealed by 2H and 31P NMR: The effects of a peripheral protein on collective lipid fluctuations. Solid State Nucl. Magn. Reson. 8:55–64. [DOI] [PubMed] [Google Scholar]
- Rawicz, W., K. C. Olbrich, T. McIntosh, D. Needham, and E. Evans. 2000. Effect of chain length and unsaturation on elasticity of lipid bilayers. Biophys. J. 79:328–339. [DOI] [PMC free article] [PubMed] [Google Scholar]
- Richter, R., A. Mukhopadhyay, and A. Brisson. 2003. Pathways of lipid vesicle deposition on solid surfaces: A combined QCM-D and AFM study. Biophys. J. 85:3035–3047. [DOI] [PMC free article] [PubMed] [Google Scholar]
- Rytömaa, M., and P. K. J. Kinnunen. 1995. Reversibility of the binding of cytochrome c to liposomes. J. Biol. Chem. 270:3197–3202. [DOI] [PubMed] [Google Scholar]
- Simonsen, A. C., U. B. Jensen, N. J. Faergeman, J. Knudsen, and O. G. Mouritsen. 2003. Acyl-coenzyme A organizes laterally in membranes and is recognized specifically by acyl-coenzyme A binding protein. FEBS Lett. 552:253–258. [DOI] [PubMed] [Google Scholar]
- Tokumasu, F., A. J. Jin, G. W. Feigenson, and J. A. Dvorak. 2003. Nanoscopic lipid domain dynamics revealed by atomic force microscopy. Biophys. J. 84:1–10. [DOI] [PMC free article] [PubMed] [Google Scholar]
- Tuominen, E. K. J., C. J. A. Wallace, and P. K. J. Kinnunen. 2002. Phospholipid-cytochrome c interaction. J. Biol. Chem. 277:8822–8826. [DOI] [PubMed] [Google Scholar]
- Voet, D., and J. G. Voet. 1990. Biochemistry. John Wiley & Sons, New York. [DOI] [PubMed]
- Zuckermann, M. J., and T. Heimburg. 2001. Insertion and pore formation driven by adsorption of proteins onto lipid bilayer membrane-water interfaces. Biophys. J. 81:2458–2472. [DOI] [PMC free article] [PubMed] [Google Scholar]


