

Abstract
Nystatin interaction with liposomes mimicking fungal and mammalian membranes (ergosterol- and cholesterol-containing 1-palmitoyl-2-oleoyl-sn-glycero-3-phosphocholine (POPC) large unilamellar vesicles, respectively) was studied by fluorescence spectroscopy. The activity of this antibiotic was also measured using a pyranine fluorescence detected K+/H+ exchange assay. Nystatin mean fluorescence lifetime varied with the antibiotic concentration and ergosterol content (0–30 mol%) of the lipid vesicles. It sharply increased from 5 to 37 ns upon reaching 100 molecules per liposome, reporting nystatin oligomerization in the membrane. Concomitantly, spectral alterations typical of excitonic coupling were detected and there was a pronounced increase in the initial rate of pore formation by nystatin. These findings suggest that nystatin exerts its antibiotic activity via a two-stage mechanism: at low antibiotic concentrations, surface-adsorbed monomeric antibiotic molecules perturb the lipid packing, changing the permeability properties of the ergosterol-rich liposomes. Upon reaching a critical threshold, nystatin mode of action switches to the classical model of transmembrane aqueous channel formation. In the presence of cholesterol-containing POPC liposomes, neither nystatin spectroscopic properties, nor the kinetics of K+ efflux varied with the antibiotic concentration suggesting that in this case the first stage of antibiotic mode of action always prevails or the assemblies formed by nystatin and cholesterol are very loose.
INTRODUCTION
Polyene macrolide antibiotics isolated from Streptomyces Gram-positive bacteria have been identified as antifungal agents presenting a very low antibacterial activity. Amphotericin B (AmB) and nystatin, which are two representative members of this class of compounds, exert their antibiotic activity via permeabilization of the target plasma membrane of the antibiotic-sensitive organisms leading to a leakage of ions and small molecules, ultimately causing cell destruction (Bolard, 1986). It has been shown that these molecules are able to self-aggregate and form large conductance pores with size-discriminating properties in model membrane systems (Kleinberg and Finkelstein, 1984) as well as single ion channels in planar lipid bilayers (BLM) (Ermishkin et al., 1977; Kleinberg and Finkelstein, 1984; Brutyan and McPhie, 1996). However, the molecular details of the mechanism of antibiotic interaction with, insertion into, and final organization within the membranes are still not clear.
One of the most intriguing questions related to this class of compounds is the elucidation of the role of sterols in their mode of action. The most widespread model considers the formation of stoichiometric antibiotic-sterol complexes organized as barrel-like membrane-spanning channels in the lipid bilayers (de Kruijff and Demel, 1974). The selective toxicity of the polyene antibiotics between pathogenic eukaryotic organisms and animal cells would then be related to their stronger affinity toward ergosterol, present in the fungal membranes, relatively to cholesterol, found in the membranes of mammalian cells (Bolard, 1986). Alternatively, the sterols may have only an ordering function packing the polyene molecules together, not directly participating in channel formation (Kleinberg and Finkelstein, 1984). Bolard et al. (1991) considered instead that the key factor governing their mode of action was the aggregation state of the antibiotic in solution; soluble monomeric AmB could be very active toward ergosterol-containing membranes, but a soluble self-associated oligomer was required for the permeabilization of cholesterol-containing membranes.
Direct spectroscopic evidence supporting the formation of antibiotic-sterol complexes would be of fundamental importance to validate the first hypothesis. However, Dufourc et al. (1984) failed to detect an AmB-induced cholesterol immobilization by deuterium nuclear magnetic resonance (NMR) as the one described later for a smaller polyene antibiotic, filipin (Dufourc and Smith, 1985). On the other hand, conflicting data have accumulated suggesting that these antibiotics may have a multiplicity of modes of action that depend on the membrane properties (Hartsel et al., 1993). Several studies have even questioned the obligatory presence of a sterol in a membrane in order for the polyene antibiotics to be able to induce a leakage of monovalent ions, particularly K+ ions, from the membranes. However, a comparison between the conditions employed in most of these experiments revealed that the main factor responsible for this effect was the use of strained phospholipid bilayers. Both the high-curvature radius of small unilamellar vesicles (SUV) (Milhaud et al., 1989; Whyte et al., 1989; Hartsel et al., 1991) and the increased volume of the osmotically stressed large unilamellar vesicles (LUV) (Weakliem et al., 1995; Ruckwardt et al., 1998) caused a decrease in the packing density of the phospholipids present in the outer monolayer of the vesicles, thereby promoting the interaction of the antibiotic with the liposomes and its subsequent self-aggregation in the lipid bilayer.
From the above, it can be concluded that studies designed to achieve a comprehensive understanding about the nature of antibiotic/sterol interactions are needed. As a first contribution toward this goal, we have compared the properties of the active species formed by the polyene antibiotic nystatin in ergosterol- and cholesterol-containing membranes. The structural information gained from fluorescence spectroscopic studies (using both steady-state and time-resolved measurements) was correlated with functional data obtained from membrane permeabilizing activity assays. Our aims were: i), to identify the main steps of nystatin mode of action at the membrane level, ii), to detect the antibiotic species produced at each stage, and iii), to investigate the role played by sterols (ergosterol and cholesterol) in their formation. Based on our results, a two-stage mechanism is presented for nystatin activity in ergosterol-containing target membranes. A nonspecific membrane permeabilization mechanism is proposed for low occupancy numbers of the ergosterol-containing lipid vesicles that switches to the nystatin classical model of channel formation when a threshold antibiotic surface concentration of ∼100 nystatin molecules per lipid vesicle is reached. Although the exact architecture of the channels formed by nystatin remains to be clarified, this study strongly supports the view that at least ergosterol is directly involved in their formation. Regarding cholesterol-containing POPC liposomes, our data suggest that either stage two is never reached or the structure of the aggregates formed by the antibiotic in these experimental conditions is less compact than the ones formed in the presence of ergosterol, not being able to induce an increase in nystatin mean fluorescence lifetime. Altogether this study provides further evidence that nystatin binding and assembly in lipid membranes is a complex process that depends critically on the membrane composition.
MATERIALS AND METHODS
Reagents
Nystatin was obtained from Sigma Chemical (St. Louis, MO) and was used without further purification. The antibiotic and its 1-mM stock solution prepared in methanol (spectroscopic grade) were stored in the dark at −20°C. The phospholipids 1-palmitoyl-2-oleoyl-sn-glycero-3-phosphocholine (POPC) and 1-palmitoyl-2-stearoyl(11-12)dibromo-sn-glycero-3-phosphocholine (BrPC) were purchased from Avanti Polar Lipids (Alabaster, AL), either as a solid or in a chloroform solution (20 mg/mL). Ergosterol (>98%) and cholesterol (>99%) were purchased from Fluka (Buchs, Switzerland) and Merck (Whitehouse Station, NJ), respectively. The stock solutions of phospholipids and sterols were prepared in chloroform and also kept at −20°C. The ionophores nigericin (sodium salt), valinomycin, and FCCP (carbonyl cyanide p-(trifluoromethoxy)phenylhydrazone) were purchased from Sigma Chemical. The stock solutions of nigericin (0.5 mM in ethanol), valinomycin, and FCCP (1.8 and 4 mM in anhydrous dimethyl sulphoxide, respectively) were stored at 4°C. HPTS (8-hydroxypyrene-1,3,6-trisulfonic acid, trisodium salt) or pyranine was purchased from Molecular Probes (Eugene, OR). All other chemicals were of analytical or reagent grade.
LUV preparation
LUV with a mean diameter of 100 nm were prepared using the extrusion technique according to Mayer et al. (1986). Aqueous phospholipid suspensions were prepared by premixing ergosterol or cholesterol with POPC in the desired molar ratios as solutions in chloroform and evaporating the solvent in a stream of nitrogen, followed by placing the lipid residue in a vacuum pump overnight. The sterol mol fractions used were 0, 7.5, 10, 15, and 30 mol%. The residual lipid film, warmed to 50°C in a water bath, was hydrated with HEPES buffer (20 mM HEPES-NaOH (pH 7.4) with 150 mM NaCl and 1 mM EDTA) and repeatedly vortexed until all lipid was removed from the walls of the round-bottom flask. Then a freeze-thaw cycle was repeated eight times using liquid nitrogen and a water bath warmed to 50°C. Subsequently, the lipid suspension was extruded four and 10 times through polycarbonate membranes of 400- and 100-nm pore size (Nuclepore, Pleasanton, CA), respectively. The resulting stock solution was stored at 4°C. The final phospholipid concentration was determined by phosphate analysis (McClare, 1971).
Nystatin partitioning experiments
Due to the presence of a fluorescent impurity in ergosterol, both a separation and a spectroscopic method were used to determine the mol fraction partition coefficients of nystatin. The separation method was based upon the centrifugation of the liposomes prepared with brominated phospholipids (White et al., 1998). Briefly, LUV of BrPC with variable sterol mol fractions (final lipid concentration of 7 mM), were prepared by the extrusion method. Diluted BrPC LUV (1–4 mM) and nystatin (∼5 μM final antibiotic concentration) were mixed, and incubated for at least 1 h at room temperature. The samples were sedimented (Sigma 2K15 centrifuge) at 25°C progressively by spinning at 4500, 9000, and 16,000 × g for 30 min each. The supernatant was removed and centrifuged again at 18,000 × g for 1 h. Under these conditions, the fraction of lipid in the supernatant was <4%. The total and free nystatin concentrations were assayed by absorption spectrophotometry. The mol-fraction partition coefficient, Kp, of the antibiotic was calculated as White et al. (1998):
 |
(1) |
where [N]i (i = l and i = w) is the nystatin concentration in the lipid and water phases, respectively. The amount of antibiotic bound to the lipid was determined by subtracting the free antibiotic concentration from the total antibiotic concentration. [L] and [W] are the molar concentrations of lipid and water, respectively. It was always assumed that only 50% of the overall lipid used, [L]av, was available for the initial partitioning of the antibiotic.
The spectroscopic method used relies upon measuring the increase in the fluorescence intensity of the antibiotic upon its partitioning into the lipid bilayers (Coutinho and Prieto, 2003). The samples were prepared as described in the “LUV preparation” section and the fluorescence signal of 7.5 μM nystatin was monitored as a function of the lipid concentration used. Background intensities in nystatin-free samples due to the lipid vesicles were always subtracted from each recording of fluorescence intensity.
The partitioning experiments were analyzed according to Eq. 2:
 |
(2) |
In this equation, ΔI = I − I0 stands for the difference between the steady-state fluorescence intensity of the antibiotic measured in the presence (I) and in the absence of lipid vesicles (Io) and ΔImax = I∞ − I0 is the maximum value of this difference, because I∞ is the limiting value of I measured upon increasing the available lipid concentration, [L]av, of the solution.
The partition coefficient of the antibiotic can be used to compute the mol fraction of membrane-bound monomeric antibiotic molecules, xl:
 |
(3) |
The mean number of antibiotic molecules associated with a lipid vesicle, 〈A〉, is calculated from Eq. 4:
 |
(4) |
Here, μ is the average number of lipid molecules per lipid vesicle (Table 1) and [N]t and [L]t are the overall antibiotic and lipid concentrations present in a sample, respectively.
TABLE 1.
Summary of the physical characteristics considered for the lipid vesicles prepared with a variable sterol mol fraction
| Sterol mol fraction
|
|||||
|---|---|---|---|---|---|
| 0 | 0.075 | 0.10 | 0.15 | 0.30 | |
| AS (nm2) | 0.63 | 0.59 | 0.58 | 0.56 | 0.48 |
| μ* | 92,074 | 97,901 | 100,011 | 104,516 | 120,847 |
The calculation of the average number of lipids in a single liposome, μ, was made assuming a homogeneous population of spherical lipid vesicles with an external diameter of 100 nm and a bilayer thickness of 4.0 nm. The condensing effect of cholesterol was taken into account by considering a variable average cross-sectional molecular area, AS (Smaby et al., 1997). It was further assumed that ergosterol had a similar effect to cholesterol on the physical properties of the lipid bilayers.
Nystatin activity measurements
LUV prepared with a variable lipid composition containing the pH-sensitive fluorophore pyranine were used to probe nystatin's ability in inducing an H+/K+ exchange across the membrane bilayer. Dried POPC films with 0 or 10 mol% cholesterol or ergosterol were hydrated with a 0.5 mM pyranine solution in K buffer at pH 7.4 (20 mM HEPES-KOH (pH 7.4) with 100 mM K2SO4), subjected to eight freeze-thaw cycles, and subsequently extruded to prepare pyranine-loaded LUV. Untrapped pyranine was removed by gel filtration on a Sephadex G25 column that was equilibrated with K buffer at pH 7.4. Calibration of the pH-dependence of the fluorescence signal of the entrapped fluorophore was performed by diluting 0.6 mL of pyranine loaded vesicles prepared with a variable lipid composition into 1.4 mL of K buffer directly in a fluorescence cuvette. The liposomes were then permeabilized to protons through the addition of 1.25 μM nigericin to the medium. The presence of this ionophore certified that the pH inside and outside the vesicles (pHin and pHout, respectively) were balanced throughout the entire experiment. After adding small aliquots of 2.5 M KOH or 1 M H2SO4 to the liposome suspension, the pyranine fluorescence intensity, If, and the pH of the solution (measured using a pH microelectrode) were simultaneously measured while the solution was magnetically stirred. The pKa of the entrapped pyranine was evaluated by fitting Eq. 5 to the experimental data of If versus pH. The maximal and minimal fluorescence intensities of the dye, Imax and Imin, respectively, were also considered as variable parameters in this fitting procedure.
 |
(5) |
Under the conditions used, the fluorescence intensity of the entrapped pyranine was found to be linear with respect to pH for 7.0 < pH < 7.8 (pKa = 7.3–7.4).
The effect of nystatin on the potassium permeability of the lipid vesicles was monitored indirectly through measuring the variation in the fluorescence intensity of pyranine-loaded vesicles upon adding aliquots of the antibiotic to the lipid suspension. Briefly, 0.7 mL of pyranine-containing POPC LUV (prepared with a variable mol fraction of sterol), were preincubated overnight with the protonophore FCCP (at 6.7 μM final concentration) to allow for free equilibration of H+ ions. These liposomes were then subjected to a transmembrane K+ gradient of 3.3:1 [K+]in/[K+]out through direct dilution of 0.6 mL of the previous lipid suspension into 1.4 mL of osmotically balanced S buffer (20 mM HEPES-KOH (pH 7.4) with 0.23 M sucrose) in a magnetically stirred fluorescence quartz cuvette. After 120 s, adequate aliquots of nystatin stock solution (5–25 μM final concentration) were added to the lipid suspension and the time course of the change in pyranine fluorescence intensity was followed at 510 nm (excitation at 460 nm). At the end of the experiment, the fluorescence emission corresponding to the total dissipation of the K+ gradient was measured after adding the ionophore valinomycin (at 13.4 μM final concentration) to the lipid vesicles. The final lipid concentration in solution was ∼1.2 mM. To prevent submitting the vesicles to osmotic stress the osmolalities of the solution inside (dye solution) and outside (S buffer) of the vesicles were checked by means of a cryoscopic osmometer (Knauer, Berlin, Germany). It should be further noted that the lipid bilayers are impermeable to sulfate ions, as well as to pyranine even in the presence of the antibiotic nystatin (Bolard et al., 1991).
Calibration of the response function of the system was carried out by generating variable K+ gradients across the lipid bilayer. To this end, 0.6 mL of pyranine-loaded vesicles preincubated with FCCP were directly diluted into 1.4 mL of variable mixtures of K and S buffers in a fluorescence cuvette. The addition of valinomycin to each lipid suspension 5 min later was again used to measure pyranine fluorescence intensity corresponding to the total dissipation of the K+ gradient. This signal was converted to  using Eq. 5 and its dependence with the transmembrane potassium gradient used in each assay was compared to the theoretical expectation (Kornberg et al., 1972).
Absorption and fluorescence measurements
Nystatin concentrations were determined photometrically using a Jasco V-560 ultraviolet-visible spectrophotometer (Jasco, Tokyo, Japan) using ɛ304 = 7.4 × 10⁴ M−1cm−1 (Coutinho and Prieto, 1995). Steady-state fluorescence spectra were recorded on a SLM-Aminco 8100 Series 2 spectrofluorometer (Rochester, NY), with double excitation and emission monochromators using a 450 W Xe arc lamp. The conditions used in most nystatin fluorescence measurements were λexc = 320 nm and λem = 410 nm (bandwidths of 4 nm). The fluorescence intensity of the entrapped pyranine was measured using λexc = 460 nm and λem = 510 nm (also with bandwidths of 4 nm). All fluorescence measurements were carried out under a right-angle geometry using 0.5-cm pathlength quartz cuvettes, except for the activity measurements where 1-cm pathlength quartz cuvettes were employed.
The steady-state anisotropies, 〈r〉, were determined according to Lakowicz (1999):
 |
(6) |
where Iij are the steady-state vertical and horizontal components of the fluorescence emission with excitation vertical (IVV and IVH) and horizontal (IHV and IHH) to the emission axis. The correction for orientation-dependent transmittance of the emission polarizer was determined using horizontally polarized light to calculate the G factor (G = IHV/IHH). Polarization measurements were made using Glan-Thompson prism polarizers in a single-channel detection system and an adequate blank was subtracted from each intensity reading before calculating the anisotropy value.
The time-correlated single-photon timing method was used to obtain the time-resolved fluorescence data. Briefly, the samples were excited at 320 nm using a frequency-doubled cavity-dumped dye laser of 4-di-cyanomethylene-2-methyl-6-(p-dimethylaminostyryl)-4H-pyran, or DCM (Coherent 701-2, Santa Clara, CA), synchronously pumped by a mode-locked Ar+ laser (514.5 nm, Coherent Innova 200-10). The emission (at 410 nm) was detected at the magic angle (54.7°) relative to the vertically polarized excitation beam using a Hamamatsu R-2809 MCP photomultiplier (Hamamatsu, Japan) and the instrument response functions (80 ps FWHM) for deconvolution were generated from scatter dispersion (silica colloidal). The number of counts in peak channel was typically 20,000 and the number of channels per curve used for analysis was 1000. Data analysis was carried out using a nonlinear, least-squares iterative fitting procedure based on the Marquardt algorithm. The fluorescence intensity decay curves obtained were deconvoluted with the instrument response function and analyzed as a sum of exponential terms:
 |
(7) |
where I(t) is the fluorescence intensity at time t and αi and τi are the normalized amplitude and lifetime of component i. The goodness of fit of the multiexponential decay was judged by the reduced-χ2 value (between 1.0 and 1.3), and inspection of the plots for random distribution of weighted residuals and autocorrelation. The mean fluorescence lifetime was calculated as:
 |
(8) |
Activity data analysis
Analysis of nystatin functional assays was based on a simple theoretical model of pore formation (assuming noninteracting uniform pores) developed by Schwarz and collaborators to explain the activity of membrane-active compounds (Schwarz and Robert, 1990, 1992; Schwarz and Arbuzova, 1995). Two different parameters were used for comparing nystatin ability in generating electrogenic K+ currents. Considering that: i), the drop of pHin over time reflects the acidification of the inner vesicular space that accompanies the rate-limiting nystatin-induced efflux of K+ ions from the lipid vesicles, and ii), the fluorescence intensity of the entrapped pyranine varied linearly with respect to pH between pH values of 7.0 and 7.8, the percentage of transmembrane K+ gradient dissipation, Π, was calculated from:
 |
(9) |
where  and
and  are the pH inside the lipid vesicles at times t = 0 s and t = 300 s and
  is the pH obtained after the addition of 13.4 μM valinomycin.
Secondly, the apparent initial rate of pore formation by nystatin in the liposomes, vo, was calculated from the initial slope of the function p′(t), which is the apparent average number of pores per lipid vesicle that has been formed from t = 0 to t (Schwarz and Robert, 1990, 1992; Schwarz and Arbuzova, 1995):
 |
(10) |
R(t) is the retention function of the liposome population, as it describes the time evolution of the fraction of potassium ions still retained in the vesicles after the addition of nystatin to the liposome suspension, and which is in excess relatively to its final equilibrium value. pHin(t) is the time course of the pH decrease of the inner vesicular space of the liposomes. When the “all-or-none” mode of potassium release applies, i.e., when the first pore formed by nystatin in each lipid vesicles is sufficiently long lived to allow for the full dissipation of its transmembrane K+ gradient, R(t) can be used to calculate directly the average number of pores per lipid vesicle in the course of time t, p(t).
When there is a basal membrane permeability toward K+ ions, the data were corrected for this effect assuming an additional dissipation process with a rate constant νi, which is independent of nystatin action (Eq. 11)
 |
(11) |
Here p*(t) is the noncorrected average number of pores per lipid vesicle in the course of time t, a function that also includes the intrinsic K+/H+ exchange of the liposomes. The rate constant vi describing this process was determined by a linear regression of the p*(t) versus t data obtained during the period of time elapsed between the liposome and the antibiotic addition to the fluorescence cuvette in each activity assay.
RESULTS
Influence of lipid composition on nystatin partitioning
Considering that the phase diagram of a phospholipid/sterol mixture determines its properties at a given composition and temperature, it was important to evaluate the effect that both the membrane sterol type and mol fraction had on nystatin partitioning behavior. Although a fluorimetric method was previously applied to measure nystatin binding to liposomes (Coutinho and Prieto, 2003), it could not be used here with POPC/ergosterol mixed bilayers. In fact, even though ergosterol itself is a nonfluorescent compound at room temperature (Nakashima et al., 1985), it always presents a residual fluorescent impurity, dehydroergosterol (DHE) (Albro et al., 1997). We did not succeed in purifying ergosterol by reversed-phase high-performance liquid chromatography as described (Albro et al., 1997), probably due to its easy reoxidation. Therefore, its use in fluorescence partitioning studies was ruled out due to the need of using highly concentrated lipid suspensions in these experiments (typically up to 6–7 mM). In this case, an alternative technique (centrifugation method) was employed to determine nystatin partition coefficients. Regarding cholesterol-containing POPC LUV, both methods were applied to establish a comparison between them.
The effect of membrane sterol type and content on the partition coefficient of nystatin is presented in Table 2. Within the cholesterol concentration range examined (i.e., 5–30 mol%) nystatin always presented a low mol-fraction partition coefficient toward the liposomes (Kp ≈ (1.7 ± 0.3) × 104 and Kp ≈ (1.5 ± 0.2) × 104 using the spectroscopic and separation methods, respectively), which was similar to the value obtained for sterol-free lipid vesicles (Kp ≈ (1.4 ± 0.3) × 104; Table 2). Upon substitution of cholesterol with ergosterol, the partition behavior of the antibiotic did not change, an average Kp ≈ (1.5 ± 0.2) × 104 being now obtained (also using 5–30 mol% ergosterol-containing POPC LUV; Table 2). The inspection of Table 2 also shows that the use of brominated phospholipids in the centrifugation method did not affect the partitioning behavior of the antibiotic because the Kp values obtained for nystatin were independent of the method used (separation or spectroscopic) in their determination.
TABLE 2.
Mol-fraction partition coefficients of nystatin, Kp, for sterol-free and cholesterol- and ergosterol-containing POPC LUV determined by a spectroscopic (fluorescence) and a separation method (centrifugation)
|
Kp (× 104)
|
|||
|---|---|---|---|
| Lipid system* | xSterol | Fluorescence | Centrifugation |
| POPC | 0 | 1.4 ± 0.2 | 1.4 ± 0.3 |
| Cholesterol/POPC | 0.05 | 2.2 ± 0.2 | 1.5 ± 0.2 |
| 0.075 | 1.6 ± 0.3 | – | |
| 0.10 | 1.7 ± 0.2 | 1.7 ± 0.5 | |
| 0.15 | 1.7 ± 0.4 | – | |
| 0.20 | 1.9 ± 0.7 | 1.4 ± 0.4 | |
| 0.30 | 1.3 ± 0.5 | 1.3 ± 0.6 | |
| Ergosterol/POPC | 0.05 | – | 1.2 ± 0.2 |
| 0.075 | – | – | |
| 0.10 | – | 1.5 ± 0.4 | |
| 0.15 | – | – | |
| 0.20 | – | 1.7 ± 0.4 | |
| 0.30 | – | 1.4 ± 0.4 | |
It was considered that only the external leaflet of the lipid vesicles could establish an interaction with the antibiotic. The antibiotic concentration used in each assay was 7.5 μM, respectively.
Fluorescence spectra
The excitation and emission spectra of nystatin in interaction with sterol-free and mixed bilayers of POPC/cholesterol prepared with 7.5, 10, 15, and 30 mol% cholesterol were essentially independent of the antibiotic concentration added to the lipid vesicles, as it is exemplified in Fig. 1, A and B, respectively, for 2.5, 5.0, and 20 μM nystatin and 10 mol% cholesterol-containing POPC LUV. The opposite behavior was found for nystatin in interaction with ergosterol-containing POPC LUV. Fig. 1 E shows that upon increasing the overall nystatin concentration from 2.5 to 20 μM in the presence of 10 mol% ergosterol-containing POPC LUV, the antibiotic presented progressively a more structured and blue-shifted emission spectra, with an isoemissive wavelength at 403 nm. The vibrational progression of its excitation spectra was also strongly affected, the more concentrated antibiotic samples presenting an increase in the intensities of the transitions at higher (2←0 and 3←0) energies (Fig. 1 D). Moreover, the wavelength maxima of the lower energy transitions 0←0 and 1←0 gradually shifted from 322 and 307 nm to 325 and 309 nm, respectively (Fig. 1 D). These spectral alterations were also noticed when studying nystatin interaction with mixed bilayers of POPC/ergosterol prepared with 7.5, 15, and 30 mol% ergosterol, and their detection was always accompanied by a sharp increase in the fluorescence emission intensity of the antibiotic, as it is demonstrated in Fig. 1 F for 10 mol% ergosterol-containing POPC LUV. Concomitantly, nystatin absorption spectra were found to remain essentially unaltered and the antibiotic samples obeyed the Beer-Lambert law in both types of lipid mixtures (data not shown). These data provide strong evidence for the coexistence of different populations of antibiotic molecules in the ergosterol-rich lipid vesicles with different spectral properties and quantum yields.
FIGURE 1.

Corrected excitation (λem = 410 nm; A and D) and emission (λex = 320 nm; B and E) fluorescence spectra of 2.5 (thin solid line), 5.0 (dotted line), and 20 μM (thick solid line) nystatin in interaction with 1.4 mM (A) 10 mol% cholesterol- and (B) 10 mol% ergosterol-containing POPC LUV. (Insets C and F) Variation of the steady-state fluorescence intensities, corrected for the inner-filter effect, with nystatin concentration for each lipid system studied.
It was also found that nystatin was unable to induce the fusion/aggregation of the lipid vesicles because the light-scattering intensity of each sample did not change upon nystatin addition to the liposomes suspension, independently of its lipid composition (data not shown).
Time-resolved fluorescence measurements
The fluorescence emission decay kinetics of nystatin was measured in the presence of 0, 7.5, 10, 15, and 30 mol% cholesterol-containing POPC LUV. According to χ2 optimization and deviation function criteria (random-weighted residuals and autocorrelation plots), a four-exponential model was always required to describe the fluorescence intensity decay curves of nystatin (data not shown). For each cholesterol/POPC mixture studied, nystatin fluorescence decays were essentially independent of the antibiotic concentration used within the range studied (2.5–25 μM) (Fig. 2 A). On the other hand, the intensity-weighted mean fluorescence lifetime of nystatin slightly decreased from ∼5.3 to 4.8 ns upon going from 0 to cholesterol mol fractions higher than 10 mol%. This effect was mainly caused by a small reduction of all nystatin lifetime components for 15 and 30 mol% cholesterol-containing POPC LUV (data not shown).
FIGURE 2.

Effect of (A) nystatin concentration and (B) membrane ergosterol content on the intensity-weighted mean fluorescence lifetime of the antibiotic in interaction with 1.4 mM sterol-containing POPC LUV at room temperature. (A) The lipid compositions studied were: POPC (▵), 7.5 mol% (□), and 30 mol% (▪) cholesterol-containing POPC LUV, and 7.5 mol% (○) and 30 mol% (•) ergosterol-containing POPC LUV, respectively. (B) The antibiotic concentrations studied were: 2.5 (▾), 5.0 (▵), 7.5 (▴), 10 (□), 15 (▪), 20 (○), and 25 μM (•) nystatin, respectively. Lines were drawn just to guide the eye.
Upon changing the composition of the lipid vesicles from cholesterol- to ergosterol-containing POPC LUV, the photophysical properties of nystatin changed dramatically. The fluorescence emission decay kinetics of the antibiotic now became sharply dependent upon both the sterol content of the lipid vesicles (Fig. 2 B) and the overall antibiotic concentration used (Fig. 2 A). As it is illustrated in Fig. 2 A for 7.5 mol% ergosterol-containing POPC LUV, the intensity-weighted mean fluorescence lifetime of nystatin was essentially invariant until its concentration reached 10 μM; above this antibiotic concentration, 〈τ〉 progressively increased from ∼5–8 ns to 25 ns at 25 μM nystatin. This change was even more pronounced when higher ergosterol mol fractions were used, as it is exemplified in Fig. 2 A for 30 mol% ergosterol-containing POPC LUV. The conversion of nystatin from a fast to a slow decaying fluorescent species was mainly caused by a sharp increase in nystatin longest lifetime component from ∼6–8 ns to 42 ns (data not shown). A similar variation of nystatin fluorescence emission decay kinetics has already been described for the antibiotic in interaction with gel-phase DPPC vesicles (Coutinho and Prieto, 1995). This behavior was demonstrated to be essentially controlled by the mean number of membrane-bound antibiotic molecules per lipid vesicle, 〈A〉, and was therefore ascribed to nystatin oligomerization in the lipid vesicles (Coutinho and Prieto, 2003). Here, Fig. 2 shows that nystatin mean fluorescence lifetime reaches a variable plateau of 24.0, 29.7, and 35.9 ns for 15, 20, and 25 μM nystatin, respectively, at ∼10 mol% ergosterol. According to the previous model, these data imply that for ergosterol mol fractions higher than 10 mol%, ergosterol is no longer the limiting reagent for the formation of nystatin-ergosterol mixed complexes. Therefore, for these antibiotic concentrations the replot of 〈τ〉 as a function of 〈A〉 can be used to study this process in ergosterol-containing POPC LUV. From inspection of Fig. 3 A, nystatin critical concentration was found to increase from 〈A〉* ≈ 10 up to 100 upon changing the lipid vesicles from gel-phase DPPC SUV and LUV to ergosterol-containing POPC LUV, respectively. Therefore, both the physical condition (gel/fluid) and chemical composition of the liposomes are important features that modulate nystatin self-assembly in the system.
FIGURE 3.

(A) Influence of lipid composition on the photophysical behavior of nystatin in interaction with liposomes. The lipid vesicles used were: gel-phase DPPC SUV (▵) and LUV (▴) (Coutinho and Prieto, 2003) and POPC LUV containing 10 (•), 15 (▪), and 30 mol% (□) of ergosterol. The mean number of membrane-bound antibiotic molecules per liposome, 〈A〉, was calculated according to Eq. 4. The solid lines are the best fits of the cooperative partition model of the antibiotic to the experimental data obtained with gel-phase (z = 6;  (Coutinho and Prieto, 2003) and ergosterol-rich lipid vesicles (z = 8;
  ; see the text for more details). The limiting values of nystatin amplitude- and intensity-weighted mean fluorescence lifetimes used in the fit were
  and
and  for monomeric nystatin, respectively, and
  and
and  for the aggregates formed by the antibiotic and ergosterol, respectively. (B, inset) Plot showing the relationship between the lowest value of the root-mean-square deviations, RMS, and the aggregation number of nystatin, z.
  was allowed to vary in each fitting whereas z was kept constant at different integer numbers.
It should be noted that the fluorescent impurity of ergosterol (dehydroergosterol) caused a small decrease in the mean fluorescence lifetime of the samples when both low antibiotic concentrations (between 2.5 and 10 μM, Fig. 2 A) and high ergosterol mol fractions (≥10 mol%; Fig. 2 B) were used. The mean fluorescence lifetime of DHE itself was essentially independent of the ergosterol content of the lipid vesicles (〈τ〉 = 1.9 ± 0.6 ns). Considering that this impurity did not interfere with the detection of the longest-lived lifetime component of nystatin (τ4 ≈ 42 ns), which is the characteristic signature of the slow-decaying antibiotic species formed by nystatin in the lipid vesicles upon increasing its overall concentration in solution, nonpurified ergosterol could be used in all lifetime measurements.
Steady-state fluorescence anisotropy measurements
The steady-state fluorescence anisotropy profile of nystatin as a function of the sterol content of the lipid bilayer is plotted in Fig. 4. For POPC LUV, the anisotropy of 15, 20, and 25 μM nystatin was 〈r〉 = 0.271 ± 0.007. The inclusion of 10 or 15 mol% cholesterol did not influence appreciably this parameter, which slightly decreased to 〈r〉 = 0.259 ± 0.003 for 30 mol% cholesterol-containing POPC LUV. In contrast, ergosterol had a more pronounced influence upon nystatin rotational diffusion because its fluorescence anisotropy steadily increased from 〈r〉 = 0.271 ± 0.007 to 〈r〉 = 0.306 ± 0.005 for POPC LUV containing >10 mol% ergosterol (Fig. 4). This observation further supports the conclusion that this antibiotic is forming mixed nystatin-ergosterol complexes, which are rigid molecular aggregates, as the increased fluorescence anisotropy combined with a longer fluorescence lifetime is indicative of strongly reduced mobility.
FIGURE 4.

Effect of membrane sterol content on the steady-state fluorescence anisotropy of nystatin in interaction with 1.4 mM (•) ergosterol- and (○) cholesterol-containing POPC LUV at room temperature. The error bars represent the standard deviation of the measurements obtained with 15, 20, and 25 μM nystatin.
Nystatin activity assays
One of the primary effects known to be induced by the polyene antibiotics on the cells is a loss of potassium ions (Bolard, 1986). To test whether the changes found in nystatin spectroscopic properties were accompanied by the formation of functional antibiotic species, the effect of nystatin on the permeability properties of the liposomes toward K+ ions was examined using an activity assay developed by Hartsel and co-workers (Whyte et al., 1989; Hartsel et al., 1991). The change in fluorescence emission at 510 nm of the pH-sensitive fluorescent dye pyranine entrapped inside LUV prepared with a variable lipid composition was used to follow indirectly the antibiotic-mediated efflux of K+ ions from the liposomes (Fig. 5 A). The generation of a potassium gradient across the phospholipid bilayer was required to measure the electrically neutral transmembrane K+/H+ exchange and we chose to use [K+]in = 3.3 [K+]out. Addition of nystatin to the suspension of lipid vesicles lowered the fluorescence intensity of the entrapped dye reporting an acidification of the inner vesicular space (Fig. 5 A). In order for the influx of protons (which occurred simultaneously with the antibiotic-mediated efflux of potassium ions) not to be rate limiting, the liposomes were preincubated with FCCP. The presence of this protonophore was essential to preclude the buildup of a diffusion potential created by the efflux of potassium ions that would otherwise prevent the dissipation of the initial electrochemical gradient present across the lipid vesicles. When the ionophore valinomycin was added at the end of each experiment, the pyranine signal instantaneously dropped to attain the fluorescence intensity corresponding to the equilibrium pH,  due to the fully dissipation of the transmembrane K+ gradient (Fig. 5 A). The validation of this assay was carried out in control experiments by showing that the dependence of
  with the transmembrane potassium gradient used in each experiment followed the theoretical expectation within ±1%. This is exemplified in Fig. 5 C for POPC vesicles. These data also evidence that the liposome populations used in these experiments were essentially unilamellar because if a significant fraction of oligolamellar lipid vesicles was present, then the value of
  determined with the ionophore valinomycin would become significantly and reproducibly lower than the expected theoretical value, as it was previously reported by Hartsel et al. (1991).
FIGURE 5.
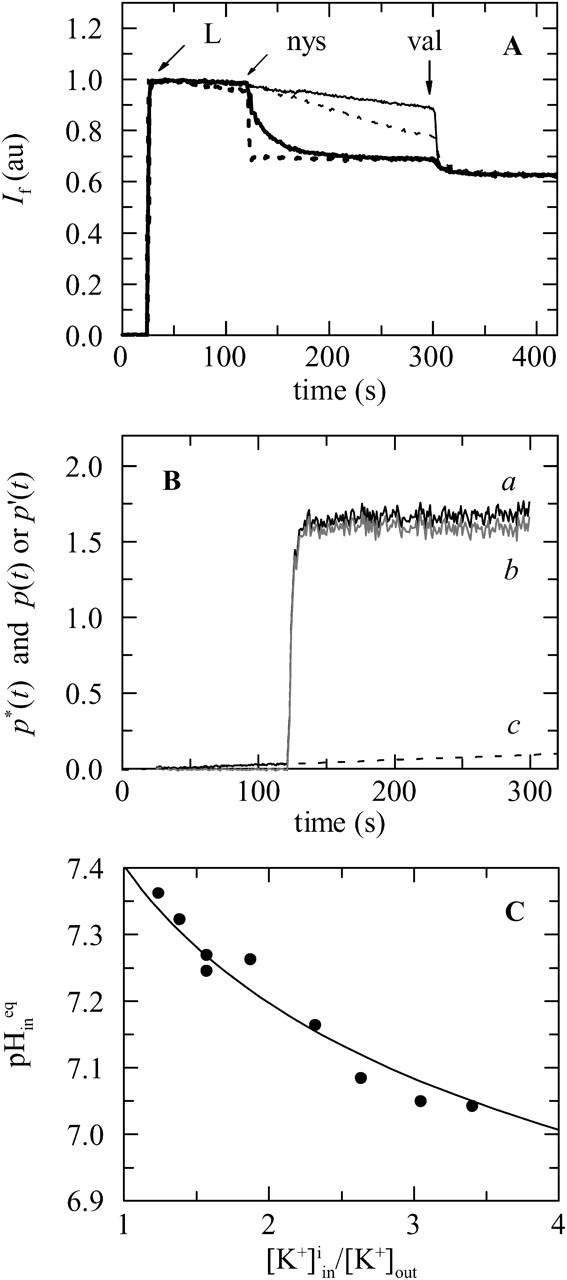
(A) Fluorescence-detected pH changes induced by nystatin in a suspension of 10 mol% sterol-containing POPC LUV (cholesterol (solid lines) and ergosterol (dotted lines)) with a 3.3:1 K+ gradient. After diluting 0.6 mL of the pyranine-loaded liposomes (preincubated with 6.7 μM FCCP) into 1.4 mL of S buffer (L), 5 (thin lines), or 25 μM (thick lines) nystatin (nys) was added to the lipid suspension. Valinomycin at 13.4 μM (val) was used as a potassium-selective control. The final lipid concentration was 1.4 mM. The decrease in fluorescence is due to K+/H+ exchange and demonstrates electrogenic K+ currents caused by nystatin. (B) Illustration of the procedure followed to correct the data for the basal K+/H+ exchange of the lipid vesicles. The function p*(t) was calculated from the experimental data obtained with 10 μM nystatin and 10 mol% ergosterol-containing POPC LUV using Eqs. 10 and 11 (solid black curve a). The rate constant vi describing the intrinsic K+/H+ exchange of the liposomes was determined by doing a linear regression of the baseline change of p*(t) in the absence of nystatin (vi = 3.3 × 10⁻⁴ s−1). The extrapolated straight line (dashed curve c) was subtracted from the data (curve a) to rule out nonspecific defects and leaks as a source of the observed change in fluorescence. Curve b (solid gray curve b = a − c) describes the time evolution of the average number of pores per lipid vesicle, p(t) or its apparent value, p′(t), depending on the mode of potassium release by nystatin, i.e., “all-or-none” or graded release, respectively (see text). (C) Exemplification of the dependence of the acidification of the inner vesicular space with the magnitude of the transmembrane K+ gradient used. The calibration of the response function of pyranine-loaded POPC LUV was carried out by generating variable K+ gradients across the lipid bilayers. The fluorescence intensity of the entrapped pyranine was measured 300 s after adding 13.4 μM valinomycin to the lipid vesicles that were preincubated with FCCP (at 2 μM final concentration). The corresponding final equilibrium value of the pH inside the lipid vesicles,  was determined using Eq. 5. The solid line describes the theoretical variation of
  calculated according to Kornberg et al. (1972).
The change of pyranine fluorescence signal directly reflects the number of pores formed by nystatin in each lipid vesicle only if the antibiotic mode of action is of the “all-or-none” type. Otherwise, the normalized change of the pH inside the lipid vesicles, R(t), can only be used to evaluate the apparent number of activated pores per vesicle, p′(t), in the course of time t as it is described in Materials and Methods (Fig. 5 B). These curves can be analyzed through the calculation of two different parameters, namely the percentage of transmembrane K+ gradient dissipated 300 s after the beginning of each assay, Π, and the apparent initial rate of pore formation, vo, by nystatin in the liposomes. Fig. 6 shows a comparison between the outcome of exposing sterol-free and sterol-containing POPC vesicles submitted to a potassium gradient to variable antibiotic concentrations. Both a more extensive (Fig. 6 A) and faster (Fig. 6 B) decrease in the pyranine fluorescence intensity was detected in experiments carried out with 10 mol% ergosterol—compared to 10 mol% cholesterol-containing POPC LUV. Furthermore, the apparent initial rate of pore formation by nystatin, vo, exhibited a strong dependence with the antibiotic occupancy number of the lipid vesicles, sharply increasing for 〈A〉 ≥ 100 only for 10 mol% ergosterol-containing POPC LUV (Fig. 6 B). This critical concentration was coincident with the formation of long-lived fluorescent antibiotic species in these lipid vesicles (Fig. 6, B and C). It is also shown in Fig. 6 that nystatin is able to induce a slow but significant increase in the permeability of sterol-free POPC LUV to K+ ions within the antibiotic concentration range studied.
FIGURE 6.

The active species formed by nystatin in the lipid vesicles depend both on the antibiotic concentration used and on the lipid composition of the lipid vesicles. Dependence of (A) the fraction of transmembrane K+ gradient dissipated 300 s after the beginning of each assay, Π, (B) the apparent initial rate of pore formation, vo, and (C) the intensity-weighted mean fluorescence lifetime of the antibiotic, 〈τ〉, with the mean number of membrane-bound antibiotic molecules per liposome, 〈A〉. POPC LUV (▪), 10 mol% ergosterol- (•), and 10 mol% cholesterol-containing POPC (○) were used in these experiments. The dashed vertical line at 〈A〉 = 100 signals the onset of the sharp increase simultaneously detected in the initial rate of pore formation and in the mean fluorescence lifetime of the antibiotic in the presence of 10 mol% ergosterol-containing liposomes.
DISCUSSION
Nystatin interaction with sterol-containing liposomes
The aim of this study was to investigate the sterol dependence of the fluorescence properties and membrane activity of the polyene antibiotic nystatin. The first step in the characterization of nystatin interaction with sterol-containing POPC LUV was the evaluation of its partition equilibrium because it was anticipated that the well-known lipid-ordering effect of both cholesterol (Vist and Davis, 1990) and ergosterol (Urbina et al., 1995; Endress et al., 2002) could influence the antibiotic distribution between the lipid bilayer and the bulk aqueous phase. From the known partition coefficients of nystatin, it is possible to compute the mean number of membrane-bound antibiotic molecules per lipid vesicle (Eqs. 3 and 4), a factor that controls the surface activity and oligomerization state of the antibiotic in gel phase lipid vesicles (Coutinho and Prieto, 2003). Therefore, the evaluation of Kp is of fundamental importance because it allows for a reliable comparison to be made between data obtained with liposomes prepared with a variable sterol content (either cholesterol or ergosterol) and/or total lipid concentration.
The partition coefficients of nystatin were found to be essentially independent of the sterol type and content of the lipid vesicles used, always presenting a low value (Table 2). According to the phase diagram of POPC/cholesterol determined by de Almeida et al. (2003), at room temperature (T = 22°C) there is a phase coexistence region of  (or α) and
  (or β) phases between ∼11 and 45 mol% of cholesterol. For 15, 20, and 30 mol% of cholesterol, the fractions of
  phase present in the POPC/cholesterol binary lipid mixtures are then expected to be ∼12, 26, and 56%, respectively. Because Kp is almost invariant within this concentration range, it can be concluded that nystatin is not extensively excluded from the liquid-ordered phase induced by cholesterol in the lipid bilayers. Therefore, the decrease in free volume available in the hydrophobic core of the bilayer upon increasing the mol fraction of cholesterol (Straume and Litman, 1987) does not seem to play a significant role in nystatin partitioning behavior. Considering the similar ability of cholesterol and ergosterol in ordering phospholipid bilayers (Urbina et al., 1995; Endress et al., 2002), the same reasoning may be applied to this sterol.
Effect of membrane sterol type and content on nystatin photophysical properties
This study confirmed again the ability of nystatin fluorescence emission decay kinetics to report its oligomerization state in lipid membranes. Moreover, Fig. 2 clearly shows that the ergosterol content of the lipid vesicles also influenced the photophysical behavior of the antibiotic. The establishment of interactions between nystatin and ergosterol must therefore drive their assembly and insertion into the liposomes. Nystatin molecules are putatively more rigidified in the sterol-antibiotic mixed complexes formed in the lipid bilayer than in their monomeric form, their nonradiative deactivation pathways decrease and, consequently, nystatin mean fluorescence lifetime increases from ∼5 to 38 ns (Fig. 3 A).
For ergosterol mol fractions higher than 10 mol%, nystatin mean fluorescence lifetime reached an antibiotic-concentration dependent plateau showing that this sterol is no longer the limiting reagent for heteromeric complex formation with nystatin (Fig. 2 B). Using the lifetime data obtained in these conditions, it was found that the onset of nystatin oligomerization was much higher in ergosterol-containing liposomes (〈A〉* ≈ 100) compared to gel-phase DPPC vesicles (〈A〉* ≈ 10) (Fig. 3 A). Therefore, the phase/lipid composition of the lipid vesicles must be controlling nystatin ability to oligomerize through modulation of its aggregation number and/or the degree of reversibility of this process. To test this hypothesis, the cooperative partition model developed earlier for nystatin (Coutinho and Prieto, 2003) was fitted to the experimental data of 〈τ〉 versus 〈A〉 obtained in the presence of a large excess of ergosterol (Fig. 3). Briefly, this model considers that monomeric nystatin molecules partition into the lipid bilayer surface and reversibly assemble into aggregates of z antibiotic molecules, with an association constant,  Although our studies strongly suggest that nystatin-ergosterol complexes are formed in the lipid bilayer, where p molecules of membrane-bound monomeric nystatin, N, and q molecules of ergosterol, E, react to form a complex NpEq, the use of a nonlimiting concentration of ergosterol ensures that the recovered aggregation number, z, accurately describes nystatin stoichiometry, p, in the mixed aggregates formed. In these conditions
  is an apparent equilibrium constant and therefore its value is no longer comparable with the one obtained with gel-phase DPPC vesicles.
In the fitting procedure, it was arbitrarily assumed that the liposomes were POPC LUV containing 30 mol% ergosterol. Therefore, the partition coefficient of nystatin and the average number of lipids in a single liposome were fixed to Kp = 1.4 × 10⁴ (Table 2) and μ = 120,847 (Table 1), respectively. The amplitude- and intensity-weighted mean lifetimes chosen for monomeric ( and
and  respectively, where
  ) and aggregated nystatin (
 and
and  respectively) were based upon the limiting values experimentally found for very diluted and concentrated nystatin samples in interaction with ergosterol-containing POPC LUV (xErg ≥ 10 mol%). Due to the high cross correlation between z and
  z (integer) was fixed and
  was varied in each RMS minimization, where RMS is the root-mean-square deviation between the experimental and calculated values for the intensity-weighted mean fluorescence lifetime of nystatin, 〈τ〉exp and 〈τ〉calc, respectively (Coutinho and Prieto, 2003). Fig. 3 B shows that nystatin reversibly assembled into aggregates of eight antibiotic molecules with a two-standard-deviation confidence interval of [6,12] calculated using the support plane method (Straume et al., 1991). The higher limit of z is rather ill-defined due to the pronounced asymmetry in the error curve (Fig. 3 B). This aggregation number is not statistically significantly larger than the value obtained earlier for gel-phase DPPC SUV and LUV (z = 6 ± 2) (Coutinho and Prieto, 2003).
The most surprising result of this study was the contrasting effect that ergosterol and cholesterol had upon the photophysical behavior of nystatin, particularly the observation that the mean lifetime of the antibiotic was essentially independent of the mol fraction of cholesterol used in the preparation of the lipid vesicles (Fig. 2 A). This result was much unexpected because previous fluorescence studies carried out with trans-parinaric acid (t-PnA) had shown that the fluorescence emission decay kinetics of this tetraene-containing fluorescent fatty acid was very sensitive to the cholesterol content of the liposomes (Mateo et al., 1995). The opposite results obtained with nystatin and t-PnA may be related to the preferential solubility of t-PnA in a liquid-ordered phase (Mateo et al., 1995), which increases its ability to detect the formation of a  phase in POPC/cholesterol binary mixtures. In conclusion, the main factor governing the fluorescence emission kinetics of nystatin seems to be its oligomeric state and not the physical properties of the hydrophobic core of the lipid bilayers, at variance with t-PnA.
Molecular mechanism of pore formation by nystatin in ergosterol-containing POPC LUV
The data presented in Fig. 6 suggest that nystatin exerts its antibiotic activity by permeabilizing the target ergosterol-containing membrane via a two-stage mechanism. When the mean number of membrane-bound antibiotic molecules was low (〈A〉 ≤ 100, stage I) nystatin induced a moderate dissipation of the electrochemical gradient 300 s after the beginning of each assay (Fig. 6 A). This process was further characterized by a low apparent initial rate of pore formation (Fig. 6 B). For 〈A〉 ≥ 100 (stage II), this parameter sharply increased (Fig. 6 B), leading to an almost instantaneous and full dissipation of the transmembrane K+ gradient 300 s after nystatin addition to the lipid vesicles (Fig. 6 A). Concomitantly, and only in ergosterol-containing membranes, there was a rise in the mean fluorescence lifetime of the antibiotic (Fig. 6 C). The large value found for the critical concentration of nystatin (〈A〉* ≈ 100) could imply that a complete loss of membrane barrier function might be involved in the second stage of liposome permeabilization by this antibiotic, as it was proposed earlier in the carpet model described by Shai and co-workers for the antimicrobial peptides (Shai, 1999). However, this hypothesis was ruled out because: i), control experiments showed that the light-scattered intensity by the liposome population did not vary during the activity assays, and ii), <1% of the external surface area of a 100-nm diameter large unilamellar vesicle is occupied by 100 horizontally adsorbed nystatin molecules, considering 1.8–1.9 nm2 per molecule (Seoane et al., 1997).
Another possibility is that for each stage of membrane permeabilization, different antibiotic active species are formed by nystatin in the lipid bilayer. For low vesicle occupancy numbers (stage I), monomeric nystatin molecules anchored at the lipid-water interface must predominate in the lipid vesicles, as it was previously found for nystatin in interaction with gel-phase DPPC vesicles (Coutinho and Prieto, 2003). The antibiotic molecules embedded in the headgroup region of the bilayer, presenting a short mean fluorescence lifetime, must transiently perturb its interfacial structure, diminishing its selective permeability properties toward the potassium ions. When the occupancy number of the vesicles surpasses a critical value (stage II), which is dependent upon the lipid composition of the liposomes, the classical model of transmembrane pore formation by nystatin must prevail. The antibiotic and ergosterol assemble in the lipid bilayer, forming membrane-spanning channels permeable to ions, water, and nonelectrolytes. Therefore, a pore encompasses a broad definition in this work, corresponding to very different organizational levels of the antibiotic in the membrane: it includes not only channel formation but also any membrane structural defect induced by the polyene antibiotic that facilitates the diffusion of ions across the lipid bilayer. The key steps of this putative model are similar to the sequential mechanism proposed earlier by Cohen and co-workers to explain the effects exerted by AmB upon the selective permeability properties of liposomes and plasma membrane vesicles prepared from Leishmania sp. (Cohen, 1992). Briefly, the authors considered that AmB could form two different types of channels in sterol-containing liposomes, whose appearance was dependent both on the antibiotic concentration used and on the time elapsed since its addition to the medium. For low antibiotic concentrations, nonaqueous prepore structures (ionic channels) were formed without the direct participation of sterol molecules. These initially formed nonaqueous channels subsequently interacted with the sterols in the membrane to form aqueous channels, having an enlarged diameter. Several other investigators have also shown that the polyene antibiotics are able to form different types of channels in ergosterol- and cholesterol-containing liposomes (Hartsel et al., 1994), as well as in erythrocytes (Cybulska et al., 1995), which are antibiotic-, concentration- and time-dependent.
An interesting point stems from the observation of Fig. 6, A and C. Although the addition of 10 μM nystatin to 10 mol% ergosterol-containing lipid vesicles (〈A〉 = 114) already induces an almost instantaneous and full dissipation of the transmembrane potassium gradient, the mean fluorescence lifetime of the antibiotic is far from reaching its maximum value in these experimental conditions (Fig. 6 C). This result can be explained by the different sensitivities of the spectroscopic and functional assays to the extension of aggregate formation by nystatin and ergosterol in the liposomes. The formation of a single aggregate/channel in a lipid vesicle is sufficient to originate the full dissipation of its transmembrane electrochemical gradient in the “all-or-none” mode of antibiotic action. However, the mean fluorescence lifetime of nystatin approaches its limiting value,  only when a large fraction of the monomeric membrane-bound antibiotic molecules has undergone aggregation in the lipid vesicles.
Molecular architecture of the pores formed by nystatin
Nystatin showed a slow but significant activity in sterol-free POPC liposomes under iso-osmotic conditions within the antibiotic concentration range studied (0–25 μM) (Fig. 6, A and B) in agreement with the results obtained for AmB (Ruckwardt et al., 1998). The inclusion of 10 mol% cholesterol in the composition of the lipid vesicles incremented the antibiotic activity (Fig. 6 A). Nevertheless, although it was found that the antibiotic was able to almost completely collapse the transmembrane potassium gradient imposed on, e.g., 10 mol% cholesterol-containing POPC LUV, as it did with 10 mol% ergosterol-containing POPC LUV (Fig. 6 A), surprisingly there were no kinetic nor spectroscopic/photophysical evidences for aggregate formation by nystatin in these conditions. According to the above reasoning, these results seem to indicate that nystatin does not reach the second phase of its mode of action in the presence of sterol-free and 10 mol% cholesterol-containing POPC LUV, e.g., because the antibiotic molecules remain predominantly surface embedded in the liposomes in these conditions.
Alternatively, nystatin may form different ion channels in the membrane, which present distinct spectroscopic and photophysical properties. In this study, it was shown that the excitation and emission spectra of nystatin were strongly antibiotic concentration dependent (Fig. 1, D and E) reporting a structural rearrangement undergone by the antibiotic molecules upon aggregate formation only within the ergosterol-rich POPC membranes. In contrast, a similar transition from a short- to a long-lived fluorescent species (i.e., from a monomeric to an oligomeric state of the antibiotic) was not accompanied by any spectral alterations in gel-phase DPPC vesicles (Coutinho and Prieto, 2003). The changes detected here in nystatin fluorescence spectra are typical of excitonic interactions and have been reported earlier for several polyene antibiotics (Castanho et al., 1992; Gruszecki et al., 2003). The transition dipolar moments of the chromophores must be close and parallel to each other in the oligomers formed by the antibiotic because the excitonic splitting results in a higher intensity at lower wavelengths in nystatin excitation spectra. Therefore, these data show unequivocally that the packing of nystatin molecules in its long-lived fluorescent assemblies (like the spacing and relative orientation between the polyene chains), is critically influenced by the physical state (gel phase) and/or type of sterol included in the membrane. This hypothesis is also supported by the experimental study of Brutyan and McPhie (1996), which has shown that the one-sided action of the polyene antibiotic AmB on phospholipid bilayer membranes formed from synthetic phosphatidylcholines (DOPC and DPhPC) and sterols (ergosterol and cholesterol) produced channels that had comparable conductances but very different lifetimes (∼100-fold less in cholesterol-containing membranes than in ergosterol-containing ones; see Fig. 4 in Brutyan and McPhie, 1996). Baginski et al. (2002) in their molecular modeling study also indicated that AmB channels in ergosterol-containing membranes are more stable than in cholesterol-containing membranes. Other studies have also shown that in addition to the sterol structure, other factors like the ionic character of the molecules (Cybulska et al., 1985; Hervé et al., 1989) or the lipid composition of the membrane (Matsuoka and Murata, 2003) can influence the permeabilization mechanism of the lipid vesicles by polyene antibiotics, which can switch from an “all-or-none” to a graded or progressive type. It is therefore possible that besides their stability, the spectroscopic and photophysical properties of the putative supramolecular complexes formed by the polyene antibiotics and sterols are also influenced by their molecular architecture. In particular, the local “rigidity” sensed by the chromophores in the channel may vary with the sterol that putatively is involved in their formation. If the channels formed by nystatin adopt a looser, less-compact structure in cholesterol than in ergosterol-containing membranes, as suggested by the steady-state fluorescence anisotropy measurements of the antibiotic (Fig. 4), nystatin mean fluorescence lifetime might not vary upon reaching stage II of its putative mechanism of action, at variance with what was found with ergosterol/POPC LUV.
CONCLUSIONS
This study demonstrates that nystatin is a membrane-active compound that may present two distinct phases in its mode of action. A nonspecific membrane permeabilization mechanism is proposed for low occupancy numbers of the ergosterol-containing lipid vesicles, in which surface-associated antibiotic molecules transiently induce structural defects in the membrane, thereby perturbing its selective permeability properties. These monomeric antibiotic molecules characteristically present a low mean fluorescence lifetime of 5 ns and slowly dissipate the transmembrane potassium gradient imposed on the lipid vesicles. When the mean number of membrane-bound antibiotic molecules surpasses a critical value of 〈A〉* ≈ 100, a transition to the classical model of nystatin transmembrane aqueous channel formation happens. Long-lived fluorescent antibiotic species (〈τ〉 ≈ 37 ns) are now formed, reporting nystatin oligomerization in the lipid vesicles. These aggregates present a much faster apparent initial rate of pore formation, which leads to an almost full and instantaneous dissipation of the transmembrane K+ gradient present across the lipid vesicles. Concomitantly, alterations in nystatin excitation spectra are detected, which are typical of excitonic coupling. Both our spectroscopic and functional data suggest that nystatin is not able to reach the second stage of its mechanism of action upon interacting with cholesterol-containing POPC LUV because the ability to dissipate a potassium gradient was not concurrent with any alteration in the spectral or photophysical properties of the antibiotic. Alternatively, the molecular architecture of the aggregates formed by nystatin in these experimental conditions may originate very unstable assemblies, which do not rigidify sufficiently the polyene chains to cause an increase in the antibiotic mean fluorescence lifetime.
Acknowledgments
This work was supported by a grant from Fundação para a Ciência e Tecnologia (POCTI/FCB/36389/2000). L.S. and A.F. acknowledge research grants BD/10029/2002 and BPD/11488/2002, respectively, from Fundação para a Ciência e Tecnologia, Portugal.
References
- Albro, P. W., P. Bilski, J. T. Corbett, J. L. Schroeder, and C. F. Chignell. 1997. Photochemical reactions and phototoxicity of sterols: novel self-perpetuating mechanism for lipid photooxidation. Photochem. Photobiol. 66:316–325. [DOI] [PubMed] [Google Scholar]
- Baginski, M., H. Resat, and E. Borowski. 2002. Comparative molecular dynamics simulations of amphotericin B-cholesterol/ergosterol membrane channels. Biochim. Biophys. Acta. 1567:63–78. [DOI] [PubMed] [Google Scholar]
- Bolard, J. 1986. How do the polyene macrolide antibiotics affect the cellular membrane properties? Biochim. Biophys. Acta. 864:257–304. [DOI] [PubMed] [Google Scholar]
- Bolard, J., P. Legrand, F. Heitz, and B. Cybulska. 1991. One-sided action of amphotericin B on cholesterol-containing membranes is determined by its self-association in the medium. Biochemistry. 30:5707–5715. [DOI] [PubMed] [Google Scholar]
- Brutyan, R. A., and P. McPhie. 1996. On the one-sided action of amphotericin B on lipid bilayer membranes. J. Gen. Physiol. 107:69–78. [DOI] [PMC free article] [PubMed] [Google Scholar]
- Castanho, M. A. R. B., A. Coutinho, and M. J. E. Prieto. 1992. Absorption and fluorescence spectra of polyene antibiotics in the presence of cholesterol. J. Biol. Chem. 267:204–209. [PubMed] [Google Scholar]
- Cohen, B. E. 1992. A sequential mechanism for the formation of aqueous channels by amphotericin B in liposomes. The effect of sterols and phospholipid composition. Biochim. Biophys. Acta. 1108:49–58. [DOI] [PubMed] [Google Scholar]
- Coutinho, A., and M. Prieto. 1995. Self-association of the polyene antibiotic nystatin in dipalmitoylphosphatidylcholine vesicles: a time-resolved fluorescence study. Biophys. J. 69:2541–2557. [DOI] [PMC free article] [PubMed] [Google Scholar]
- Coutinho, A., and M. Prieto. 2003. Cooperative partition model of nystatin interaction with phospholipid vesicles. Biophys. J. 84:3061–3078. [DOI] [PMC free article] [PubMed] [Google Scholar]
- Cybulska, B., J. Bolard, O. Seksek, A. Czerwinski, and E. Borowski. 1995. Identification of the structural elements of amphotericin B and other polyene macrolide antibiotics of the heptaene group influencing the ionic selectivity of the permeability pathways formed in the red cell membrane. Biochim. Biophys. Acta. 1240:167–178. [DOI] [PubMed] [Google Scholar]
- Cybulska, B., M. Hervé, E. Borowski, and C. M. Gary-Bobo. 1985. Effect of the polar head structure of polyene macrolide antifungal antibiotics on the mode of permeabilization of ergosterol- and cholesterol-containing lipidic vesicles studied by 31P-NMR. Mol. Pharmacol. 29:293–298. [PubMed] [Google Scholar]
- de Almeida, R. F., A. Fedorov, and M. Prieto. 2003. Sphingomyelin/phosphatidylcholine/cholesterol phase diagram: boundaries and composition of lipid rafts. Biophys. J. 85:2406–2416. [DOI] [PMC free article] [PubMed] [Google Scholar]
- de Kruijff, B., and R. A. Demel. 1974. Polyene antibiotic-sterol interactions in membranes of Acholeplasma laidlawii cells and lecithin liposomes. 3. Molecular structure of the polyene antibiotic-cholesterol complexes. Biochim. Biophys. Acta. 339:57–70. [DOI] [PubMed] [Google Scholar]
- Dufourc, E. J., and I. C. Smith. 1985. 2H NMR evidence for antibiotic-induced cholesterol immobilization in biological model membranes. Biochemistry. 24:2420–2424. [DOI] [PubMed] [Google Scholar]
- Dufourc, E. J., I. C. Smith, and H. C. Jarrel. 1984. Interaction of amphotericin B with membrane lipids as viewed by 2H-NMR. Biochim. Biophys. Acta. 778:435–442. [DOI] [PubMed] [Google Scholar]
- Endress, E., S. Bayerl, K. Prechtel, C. Maier, R. Merkel, and T. M. Bayerl. 2002. The effect of cholesterol, lanosterol, and ergosterol on lecithin bilayer mechanical properties at molecular and microscopic dimensions: a solid-state NMR and micropipet study. Langmuir. 18:3293–3299. [Google Scholar]
- Ermishkin, L. N., K. M. Kasumov, and V. M. Potseluyev. 1977. Properties of amphotericin B channels in a lipid bilayer. Biochim. Biophys. Acta. 470:357–367. [DOI] [PubMed] [Google Scholar]
- Gruszecki, W. I., M. Gagos, and M. Herec. 2003. Dimers of polyene antibiotic amphotericin B detected by means of fluorescence spectroscopy: molecular organization in solution and in lipid membranes. J. Photochem. Photobiol. B. 69:49–57. [DOI] [PubMed] [Google Scholar]
- Hartsel, S. C., S. K. Benz, W. Ayenew, and J. Bolard. 1994. Na+, K+ and Cl− selectivity of the permeability pathways induced through sterol-containing membrane vesicles by amphotericin B and other polyene antibiotics. Eur. Biophys. J. 23:125–132. [DOI] [PubMed] [Google Scholar]
- Hartsel, S. C., S. K. Benz, R. P. Peterson, and B. S. Whyte. 1991. Potassium-selective amphotericin B channels are predominant in vesicles regardless of sidedness. Biochemistry. 30:77–82. [DOI] [PubMed] [Google Scholar]
- Hartsel, S. C., C. Hatch, and W. Ayenew. 1993. How does amphotericin B work? Studies on model membrane systems. J. Liposome Res. 3:377–408. [Google Scholar]
- Hervé, M., J. C. Debouzy, E. Borowski, B. Cybulska, and C. M. Gary-Bobo. 1989. The role of the carboxyl and amino groups of polyene macrolides in their interactions with sterols and their selective toxicity. A 31P-NMR study. Biochim. Biophys. Acta. 980:261–272. [Google Scholar]
- Kleinberg, M. E., and A. Finkelstein. 1984. Single-length and double-length channels formed by nystatin in lipid bilayer membranes. J. Membr. Biol. 80:257–269. [DOI] [PubMed] [Google Scholar]
- Kornberg, R. D., M. G. McNamee, and H. M. McConnell. 1972. Measurement of transmembrane potentials in phospholipid vesicles. Proc. Natl. Acad. Sci. USA. 69:1508–1513. [DOI] [PMC free article] [PubMed] [Google Scholar]
- Lakowicz, J. R. 1999. Principles of Fluorescence Spectroscopy. Plenum Press, New York, NY.
- Mateo, C. R., A. U. Acuna, and J. C. Brochon. 1995. Liquid-crystalline phases of cholesterol/lipid bilayers as revealed by the fluorescence of trans-parinaric acid. Biophys. J. 68:978–987. [DOI] [PMC free article] [PubMed] [Google Scholar]
- Matsuoka, S., and M. Murata. 2003. Membrane permeabilizing activity of amphotericin B is affected by chain length of phosphatidylcholine added as minor constituent. Biochim. Biophys. Acta. 1617:109–115. [DOI] [PubMed] [Google Scholar]
- Mayer, L. D., M. J. Hope, and P. R. Cullis. 1986. Vesicles of variable sizes produced by a rapid extrusion procedure. Biochim. Biophys. Acta. 858:161–168. [DOI] [PubMed] [Google Scholar]
- McClare, C. W. 1971. An accurate and convenient organic phosphorous assay. Anal. Biochem. 39:527–530. [DOI] [PubMed] [Google Scholar]
- Milhaud, J., M. A. Hartmann, and J. Bolard. 1989. Interaction of the polyene antibiotic amphotericin B with model membranes: differences between small and large unilamellar vesicles. Biochimie. 71:49–56. [DOI] [PubMed] [Google Scholar]
- Nakashima, N., S. R. Meech, A. R. Auty, A. C. Jones, and D. Phillips. 1985. Fluorescence properties of ergosterol. J. Photochem. 30:207–214. [Google Scholar]
- Ruckwardt, T., A. Scott, J. Scott, P. Mikulecky, and S. C. Hartsel. 1998. Lipid and stress dependence of amphotericin B ion selective channels in sterol-free membranes. Biochim. Biophys. Acta. 1372:283–288. [DOI] [PubMed] [Google Scholar]
- Schwarz, G., and A. Arbuzova. 1995. Pore kinetics reflected in the dequenching of a lipid vesicle entrapped fluorescent dye. Biochim. Biophys. Acta. 1239:51–57. [DOI] [PubMed] [Google Scholar]
- Schwarz, G., and C. H. Robert. 1990. Pore formation kinetics in membranes determined from the release of marker molecules out of liposomes or cells. Biophys. J. 58:577–583. [DOI] [PMC free article] [PubMed] [Google Scholar]
- Schwarz, G., and C. H. Robert. 1992. Kinetics of pore-mediated release of marker molecules from liposomes or cells. Biophys. Chem. 42:291–296. [DOI] [PubMed] [Google Scholar]
- Seoane, J. R., N. Vila Romeu, J. Miñones, O. Conde, P. Dynarowicz, and M. Casas. 1997. The behavior of amphotericin B monolayers at the air/water interface. Progr. Colloid Polym. Sci. 105:173–179. [Google Scholar]
- Shai, Y. 1999. Mechanism of the binding, insertion and destabilization of phospholipid bilayer membranes by alpha-helical antimicrobial and cell non-selective membrane-lytic peptides. Biochim. Biophys. Acta. 1462:55–70. [DOI] [PubMed] [Google Scholar]
- Smaby, J. M., M. M. Momsen, H. L. Brockman, and R. E. Brown. 1997. Phosphatidylcholine acyl unsaturation modulates the decrease in interfacial elasticity induced by cholesterol. Biophys. J. 73:1492–1495. [DOI] [PMC free article] [PubMed] [Google Scholar]
- Straume, M., S. G. Frasier-Cadoret, and M. L. Johnson. 1991. Least-squares analysis of fluorescence data. In Topics in Fluorescence Spectroscopy: Principles, Vol. 2. J. R. Lakowicz, editor. Plenum Press, New York, NY. 177–240.
- Straume, M., and B. J. Litman. 1987. Influence of cholesterol on equilibrium and dynamic bilayer structure of unsaturated acyl chain phosphatidylcholine vesicles as determined from higher order analysis of fluorescence anisotropy decay. Biochemistry. 26:5121–5126. [DOI] [PubMed] [Google Scholar]
- Urbina, J. A., S. Pekerar, H. B. Le, J. Patterson, B. Montez, and E. Oldfield. 1995. Molecular order and dynamics of phosphatidylcholine bilayer membranes in the presence of cholesterol, ergosterol and lanosterol: a comparative study using 2H-, 13C- and 31P-NMR spectroscopy. Biochim. Biophys. Acta. 1238:163–176. [DOI] [PubMed] [Google Scholar]
- Vist, M. R., and J. H. Davis. 1990. Phase equilibria of cholesterol/dipalmitoylphosphatidylcholine mixtures: 2H nuclear magnetic resonance and differential scanning calorimetry. Biochemistry. 29:451–464. [DOI] [PubMed] [Google Scholar]
- Weakliem, C. L., G. Fujii, J.-E. Chang, A. Ben-Shaul, and W. M. Gelbart. 1995. Effect of tension on pore formation in drug-containing vesicles. J. Phys. Chem. 99:7694–7697. [Google Scholar]
- White, S. H., W. C. Wimley, A. S. Ladokhin, and K. Hristiva. 1998. Protein folding in membranes: determining energetics of peptide-bilayer interactions. Methods Enzymol. 295:62–87. [DOI] [PubMed] [Google Scholar]
- Whyte, B. S., R. P. Peterson, and S. C. Hartsel. 1989. Amphotericin B and nystatin show different activities on sterol-free vesicles. Biochem. Biophys. Res. Commun. 164:609–614. [DOI] [PubMed] [Google Scholar]