

Abstract
Imaging of nucleosomal arrays by atomic force microscopy allows a determination of the exact statistical distributions for the numbers of nucleosomes per array and the locations of nucleosomes on the arrays. This precision makes such data an excellent reference for testing models of nucleosome occupation on multisite DNA templates. The approach presented here uses a simple statistical thermodynamic model to calculate theoretical population and positional distributions and compares them to experimental distributions previously determined for 5S rDNA nucleosomal arrays (208-12,172-12). The model considers the possible locations of nucleosomes on the template, and takes as principal parameters an average free energy of interaction between histone octamers and DNA, and an average wrapping length of DNA around the octamers. Analysis of positional statistics shows that it is possible to consider interactions between nucleosomes and positioning effects as perturbations on a random positioning noninteracting model. Analysis of the population statistics is used to determine histone-DNA association constants and to test for differences in the free energies of nucleosome formation with different types of histone octamers, namely acetylated or unacetylated, and different DNA templates, namely 172-12 or 208-12 5S rDNA multisite templates. The results show that the two template DNAs bind histones with similar affinities but histone acetylation weakens the association of histones with both templates. Analysis of locational statistics is used to determine the strength of specific nucleosome positioning tendencies by the DNA templates, and the strength of the interactions between neighboring nucleosomes. The results show only weak positioning tendencies and that unacetylated nucleosomes interact much more strongly with one another than acetylated nucleosomes; in fact acetylation appears to induce a small anticooperative occupation effect between neighboring nucleosomes.
INTRODUCTION
It is now widely recognized that the essential processes of replication, transcription, repair, and recombination in eukaryotes take place in, and are strongly impacted by, the in vivo chromosome organization of the eukaryotic genome. The basic unit of chromosomal structure is the nucleosomal array, core nucleosomes separated by lengths of linker DNA (Fletcher and Hansen, 1996; Hansen, 2002). In vitro studies of nucleosomal arrays provide insights on the basic features associated with this most fundamental level of in vivo structure and, because nucleosomes in arrays show behavioral differences compared to isolated single nucleosomes (Fletcher and Hansen, 1996; Hansen et al., 1998; Hansen, 2002), also provide information about nucleosome structure that is not obtainable from studies of mononucleosomes.
Our laboratories have been carrying out quantitative studies of in vitro reconstituted, subsaturated nucleosomal arrays using atomic force microscopy (AFM) approaches. One set of those studies (Yodh et al., 1999, 2002; Bash et al., 2001) involved the analysis of templates consisting of head-to-tail repeats of a sequence derived from the sea urchin 5S rDNA gene (Simpson et al., 1985), which can position nucleosomes (Simpson and Stafford, 1983; Dong et al., 1990; Meerseman et al., 1991). These concatameric templates are probably the most widely used in vitro model for biochemical and biophysical studies of chromatin (Carruthers et al., 1999; Hansen, 2002). Our studies have focused on subsaturated arrays, i.e., arrays in which the number of possible nucleosome binding sites exceeds the number of nucleosomes present to bind to the DNA template, because the occupancy choices such templates provide can lead to novel insights on occupation tendencies. Subsaturated arrays are also models for chromatin regions that are less than fully nucleosome-saturated, such as gene promoters and replication origins (Lohr, 1997; Sogo et al., 1986; Lohr and Torchia, 1988), and for newly replicated chromatin.
The use of AFM provides unique opportunities for analysis. Single molecule resolution allows the precise characterization of specific features, for example the number of nucleosomes present on DNA template molecules, for individual arrays or for a population of molecules. The latter provides the precise description of the experimental feature, i.e., the statistical distribution of occupied states, in the population. These distributions contain a wealth of information and their analysis will provide important insights into the fundamental features of nucleosome occupation on multisite DNA templates. For example, the experimental behavior can be compared to theoretical models, an approach that will be described in this article. For the 5S arrays, both population and location features of nucleosome occupation have been analyzed (Yodh et al., 1999, 2002; Bash et al., 2001). In this article, the population and location data for the 5S arrays will be compared to model predictions.
To obtain the theoretical distributions to compare to the experimental population data, a statistical thermodynamic model is developed. The main assumption of the model is that the free energy of interaction between the histone octamers and the segments of DNA to which they are bound is primarily local in nature, that is, it is independent of the higher-order conformation of the array. This assumption will be justified a posteriori by the results. The model has similarities with other theoretical models of nucleosome formation (McGhee and von Hippel, 1974; Chou, 2003), but it addresses, in particular, the distributions for nucleosomes on finite length templates. For the purposes of this analysis, the thermodynamics of the association of histones and DNA into nucleosomes will be described in terms of a simple set of parameters: the interaction free energy between the histone octamer and the DNA template, the interaction free energy between neighboring nucleosomes, and the average wrapping length per nucleosome. We find that this simple model accurately predicts the population distribution data obtained from AFM imaging of 5S nucleosomal arrays. The analysis provides values for association constants and free energies, which can be directly compared to results obtained from mononucleosome studies (Gottesfeld and Luger, 2001; Khrapunov et al., 1997) and to other types of results, such as estimates of the pure electrostatic component of the histone-DNA interaction (Mateescu et al., 1999; Kunze and Netz, 2000), or used as an input in models for kinetic aspects of chromatin behavior (Schiessel et al., 2001). Furthermore, the analysis of positional distributions allows us to determine the strength of the interaction between neighboring nucleosomes and the amplitude of the variations in positioning interactions along the templates.
METHODS
Experimental methods
Isolation of DNA and histones, reconstitution and imaging of nucleosomal array samples, and compilation of the loading data were carried out as described in a previous article (Bash et al., 2001).
Theory
Description of templates
The data that forms the basis for the analysis in this article was initially described in Yodh et al. (1999, 2002) and Bash et al. (2001). It consists of AFM determinations of nucleosome population (172-12 and 208-12) and location (208-12) distributions for subsaturated 5S rDNA nucleosomal arrays reconstituted by salt dialysis with various input levels of HeLa histones. From the AFM images gathered for each sample it is possible to determine the total number N of template molecules, the number Nn of templates with n nucleosomes, and the positions of the nucleosomes on the template. From these basic measurements, we define the fraction f(n) of templates with n nucleosomes as
 |
(1) |
As the number of observed templates grows, the fraction function f(n) converges to a population probability distribution p(n),
 |
(2) |
Each nucleosomal array is described as a linear set of points, where each point represents a basepair and is labeled by its position x measured from one template terminus (the two termini are indistinguishable in the AFM). The quantity x can take values from 1 to L, where L is the total number of basepairs in the template. Each of the nucleosomes is assumed to be composed of a histone octamer and a fixed number, Lo, of DNA basepairs wrapped around it. Many studies, including x-ray crystallography, indicate a wrapping length of 147 basepairs per core nucleosome (Van Holde, 1989; Luger et al., 1997). However, the average wrapping length can be influenced by environmental conditions such as the ionic strength of the medium both in vivo (Lohr, 1986) and in vitro (van Holde, 1989). We thus take the average wrapping length as an adjustable parameter of the model. The position of the ith nucleosome within a template (see Fig. 1) can be described by specifying the basepair number xi at the midpoint of the octamer-DNA contact, i.e., the nucleosome dyad. The resolution of the AFM images does not permit a determination of the precise value of xi but measurements of nucleosome positions on the template lead to approximate determination of the ratios xi/L. The model assumes that there are no partially bound nucleosomes at the ends of the template and that every nucleosome observed contains a full octameric set of histones. The latter assumption has been experimentally verified for reconstitutions of 5S arrays under these conditions (Hansen et al., 1991). The maximum possible number of nucleosomes in a template, Nmax, is the largest integer smaller or equal to L/Lo.
FIGURE 1.

A typical AFM image of a subsaturated 5S array (containing four nucleosomes) is shown top left; to its right is a schematic trace of this molecule and to the far right the schematic of a single nucleosome is shown. Below, a linear scheme illustrates how the location of each nucleosome is measured along the length of the template in imaged, subsaturated arrays. It is assumed that each nucleosome is wrapped by a fixed number of basepairs Lo. The position x of each nucleosome is considered to be the basepair number corresponding to the midpoint of the DNA wrapping length.
Interaction free energy
The next step is to construct a model grand-canonical partition function from which an effective thermodynamic potential for the nucleosomal array can be derived and expressions for the population distributions of such arrays can be calculated. The main assumptions of this model are that 1), each time a nucleosome forms there is approximately the same change ΔG in free energy due to the ionic and hydrogen-bond interactions between histones and DNA and to the ion release from, or absorption into, the nucleosome neighborhood; and 2), the wrapping lengths form a sharply peaked distribution centered at Lo. To simplify notation below, we introduce the interaction free energy per nucleosome g = ΔG/A, where A is Avogadro's number.
The total change in the free energy due to nucleosome formation is composed of the interaction energy described above, an entropic contribution related to the positioning of the octamers on the DNA template, and secondary contributions arising from nucleosome-nucleosome interactions and sequence-dependent fluctuations in the average interaction energy between histones and DNA. Nonlocal effects, such as residual long-range electrostatic interactions between segments of DNA, and excluded volume effects are ignored. The association free energy depends on the precise location of the nucleosomes along the DNA, and on interactions between pairs of nucleosomes in sufficiently close contact with each other. We can model these secondary effects by means of two effective potential energies V1(x) and V2(y). V1(x) is a one-particle interaction potential that depends on the specific sequence of the template and measures the local deviation from the average interaction free energy g. V2(y) is a two-body potential describing the average interaction between neighboring nucleosomes, where y is the distance between them measured in basepairs.
The partition function
The total grand-canonical partition function for the system of a multisite DNA template in equilibrium with histones in solution is composed of contributions from the Nmax +1 sectors, each corresponding to the number of nucleosomes occupying the DNA template. The nucleosomes are considered to be indistinguishable particles. The partition function is obtained by weighting each possible configuration with the suitable exponential of the interaction energies, and summing over all possible configurations. The partition function Z reads as
 |
(3) |
where the nth sector contribution Zn is
 |
(4) |
In this expression, the sum is carried out over all possible arrangements of n nucleosomes in the template. The symbols μ, k, and T, represent the chemical potential of the nucleosomes, the Boltzmann constant, and the temperature, respectively. The extra potential energy contribution V is given by the sum of two terms describing sequence-dependent effects and nearest-neighbors interaction,
 |
(5) |
From equilibrium considerations, the chemical potential μ of the nucleosomes can be identified with the chemical potential, μoct, of the histone octamers free in solution,
 |
(6) |
This chemical potential is a function of the concentration of free histone octamers [H], which is obtained by subtracting the concentration of nucleosomes formed on the DNA templates from the input octamer concentration [H]o. If [D] is the input concentration of DNA templates, then
 |
(7) |
where  is the average number of nucleosomes per template. An octamer chemical potential can be defined even though histones do not form an octamer under reconstitution conditions until they are assembled into nucleosomes. Moreover, assembly occurs in a stepwise, sequential fashion; the H3-H4 tetramer assembles on the DNA first, then two H2A-H2B dimers add on, one at a time, to complete the octamer (Hansen et al., 1991), and each step occurs at a different salt concentration during the (stepwise) decrease from 2M NaCl to low ionic strength. However, as we consider only thermodynamic equilibrium conditions, the sequential nature of the process does not invalidate the chemical potential definition. The model does assume, however, that all nucleosomes contain full octamers and there are no partial assemblages. This restriction is consistent with the data for nucleosome assembly on these templates (Hansen et al., 1991; Hansen and Lohr, 1993).
During the reconstitution process, the histones in solution consist of H3-H4 tetramers and H2A-H2B dimers (Van Holde et al., 1995). In general, if the octamer in solution exists as different components, each with label i and concentration ci, the chemical potential can be approximately written as
 |
(8) |
The integers yi are the number of parts of type i in an octamer, and μo is a reference chemical potential. In the simplest case, when the octamer is assembled, this is just
 |
(9) |
Note, however, that μo also depends on salt concentrations and on other components present in the solution, in ways that are difficult to assess.
Population probabilities for noninteracting nucleosomes
For the analysis of population statistics, it is possible to neglect, to first approximation, both the neighboring interactions V2(y) and the local fluctuations in the strength of the interaction V1(x). In this very simple case the partition function sectors Zn are given by
 |
(10) |
where sn is the number of ways of placing n identical nucleosomes in the template, and the dimensionless parameter w is defined as
 |
(11) |
The number of configurations can be obtained by standard combinatorial methods and is given by the binomial coefficient,
 |
(12) |
Thus, for given concentrations of DNA, histones, and salt, the partition function depends only on the dimensionless free energy parameter w and the lengths of the template and interaction region L and Lo. The probability distribution for the population is
 |
(13) |
Fig. 2 presents graphs of the theoretical probability distribution p(n) as a function of the nucleosome number n for noninteracting nucleosomes, as determined by Eqs. 10–13, for Lo = 106 and L = 2099 (the number of basepairs in the 172-12 template) and different values of w. Fig. 3 shows the predicted probability distribution for systems with different average wrapping lengths but fixed free energy parameter and template length, w = 3.0 and L = 2099.
FIGURE 2.

Theoretical nucleosome loading probability p(n) versus the number n of nucleosomes on the template calculated from the noninteracting nucleosomes model for different values of the energy parameter w. For these distributions the template length is L = 2098 basepairs, and the wrapping length is set at Lo = 106 basepairs.
FIGURE 3.

Theoretical nucleosome loading probability p(n) versus the number n of nucleosomes on the template calculated from the noninteracting nucleosomes model for different values of the wrapping length Lo. For these distributions the template length is L = 2104 basepairs, and the free energy parameter is set at w = 3.0.
Effective equilibrium constants
The formation of a nucleosome during in vitro salt reconstitution is a complex process due to the tripartite nature of the nucleosome assembly process and the uncertain role of associated ions. It is not possible to describe nucleosome formation by a simple mass action law equation that considers a nucleosome formed only by histone octamers and DNA. Nevertheless, it is convenient to describe information regarding nucleosome formation in terms of an effective equilibrium constant K for mononucleosomes.
Consider first the case of short DNA with length equal to that which wraps just one nucleosome, i.e., L = Lo. Below we refer to these templates to as minimal length templates. The nucleosome reconstitution process is, schematically,
 |
(14) |
We define the apparent equilibrium or association constant of this process as the quantity
 |
(15) |
where [N], [H], and [Dm] are the final concentrations of, respectively, formed nucleosomes, free octamers, and free DNA templates. For this association constant to be meaningful, it needs to be evaluated under well-specified conditions. For these, we choose the following: 1), the input histone octamer and DNA template concentrations are equal and 2), the final concentrations of nucleosomes and DNA templates [N] and [Dm] are equal. With these conditions, the definition of the apparent association constant is equivalent to
 |
(16) |
If the mass action law (Eq. 15) is obeyed, the equilibrium constant relation above is valid regardless of the input concentrations of reactants. Below, we connect this definition with the association free energy g and parameter w.
Application of the results for the case of noninteracting nucleosomes to the case of minimal length templates leads immediately to expressions for the probabilities of the only two possible loading states, namely, free with n = 0 or forming exactly one nucleosome with n = 1. For these cases, and when the input concentrations of histones and templates are the same,
 |
(17) |
 |
(18) |
The conditions given above for the definition of the association constant are equivalent with p(0) = p(1) = 1/2 and [Dm] = [H]. These, in turn, imply that w = 0. Since we have access to experimental values of w, it is necessary to restate the definition of the association constant in terms of this parameter. The equilibrium constant is then given by Km = [H]−1, where the concentration [H] is such that the parameter w takes a value of zero, as
 |
(19) |
These relations determine the association constant for minimal length templates even when the values of w are determined from nonminimal length templates.
The wrapping length for mononucleosomal DNA under low ionic strength conditions is usually assumed to be 147 basepairs. If the average length of DNA associated with the nucleosome is smaller than 147 basepairs, the equilibrium constants for minimal length and 147-basepair-long templates do not coincide. The relation between them is
 |
(20) |
where K147 is the association constant for templates of 147-basepair length.
Thus, Eqs. 13, 14, and 20 express the degree of nucleosome formation on DNA templates of length L, short templates of length Lo, and standard templates of length L = 147 basepairs. The relations between the quantities describing these different types of systems are given by Eqs. 19 and 20. The need for different descriptions arises from the different entropic contributions to the total free energy in each case. The relations obtained above are valid when the DNA and histones associate in exactly the same way, with the same wrapping length in each case, and with the same interaction free energy. Discarding effects arising from the free ends of the DNA, these conditions ought to be satisfied whenever similar concentrations of histone octamers are present in solution and the same salt concentrations are considered. These relations enable us to directly compare results for the long templates considered here with results of experiments on mononucleosomes.
Limit of long templates
We now connect the above description with the simpler but well-known method of analysis of association of proteins on very long templates from McGhee and von Hippel (1974). The model presented in this article is based on similar assumptions as those used by McGhee and von Hippel with two important differences: first, we have shorter templates and second, the McGhee-von Hippel analysis can only provide the mean number of associated histone octamers, whereas AFM results can provide the full probability distributions. When the DNA template length is much larger than the nucleosome wrapping length, L ≫ Lo, the probability distribution p(n), becomes sharply peaked around its mean  . For large templates, it is useful to use the average occupation number per basepair,
 |
(21) |
In our approach, the mean value  of nucleosomes can be obtained in different ways. The thermodynamic potential Ω associated with the formation of the nucleosomes is
 |
(22) |
This potential can be interpreted as the partial osmotic pressure per template generated by nucleosome formation. In terms of this potential, the average number of nucleosomes per template is
 |
(23) |
Equivalently,  can be expressed as
 |
(24) |
We omit a proof, but it can be shown that in the limit of long templates the average occupation number ν obtained from these expressions coincides with that given by McGhee and Von Hippel, namely
 |
(25) |
This expression assumes an ideal solution of binding molecules, the histone octamers in this case, so that the association constant is K = exp(−w)/[H]. Another model, similar to that of McGhee and von Hippel (1974), has been recently proposed by Chou (2003), which considers a variable wrapping length but also only addresses the limit of very large templates.
Free length coordinates
To organize and analyze the positional information contained in the experimental data, it is best to introduce a second set of positional variables that allow a clearer statement of the predictions of the theory. The number of states available to a set of n nucleosomes, each occupying Lo basepairs in a template of length L, is the same as the number of states available to a set of n objects each occupying only one basepair in a template of length L−n(Lo−1). Each state of the original template can be mapped into a state of this second, equivalent template. The mth nucleosome in the template with center at position x is mapped into the auxiliary template at position x−(m−1/2)(Lo−1). It is convenient at this point to change to a continuous set of variables y describing the ratio of the position of a nucleosome to the total length of the auxiliary template. Thus, we define
 |
(26) |
and call these the free length coordinates of the nucleosomes. Fig. 4 is a graphical representation of this definition. These coordinates measure the positions of the nucleosomes within the template when one considers only the effectively unoccupied sites of the template. Although these variables can actually only take a finite number of values, it is best to treat them as continuous. It is important to note that these variables are the quantities that are most directly accessible from the AFM images, as, a priori, we do not know the wrapping length Lo of the nucleosomes, and thus the images determine only relative positions along the observed contour of the templates.
FIGURE 4.

Scheme of the definition of the free length variables. The length of the template in basepairs is L, the positions of two nucleosomes, represented by the shaded areas are x1 and x2, and the length of the region occupied by each nucleosome is Lo. In the auxiliary template, all but one of the basepairs of the occupied regions is retained, and the positions are normalized so that the total length is 1.
Positional probability distributions
Both probability distributions and correlation functions take much simpler forms for the free length coordinates when the noninteracting version of the model is considered. We first present these results and analyze later the effects of the perturbations due to nucleosome interactions and template sequence. There are a large number of positional variables that can be considered, and we limit our exposition to those that are simplest, or more relevant to the available experimental data. First, we consider the probability densities for the free length coordinates yi. We denote by fn(ym1,ym2,…,ymi,…,ymr) the joint probability density for the event that the r nucleosomes that appear in the  and
and  places of templates with n nucleosomes occupy positions with free length coordinates ym1, ym2,…,ymi,…ymr. In the noninteracting model it can be shown that this density is given by
 |
(27) |
where c is the multinomial coefficient
 |
(28) |
Both of these expressions use, to simplify notation, the auxiliary index j = i−1.
Let us note two particular cases of the previous general expression. The density distribution for the first nucleosome in a template with load n is
 |
(29) |
The density distribution for a specified position of all nucleosomes in a template is
 |
(30) |
which, indeed reflects that all positions, when presented in terms of their free length variables, are equally probable.
Whereas the distribution functions for the ordered free length coordinates provide suitable approaches for this problem, a different set of distribution functions are even simpler to work with. Instead of using variables identified by their order (first, second, etc…) in the template, we inquire about the probability of occupation of a site regardless of order. We denote by hn( z1, z2,…, zi,… zr) the probability density for the occupation of positions z1 < z2 < … zi …< zr by any of the nucleosomes, regardless of which nucleosome occupies these sites. For example, the first specified position, z1, could be taken by any of the n−r + 1 first nucleosomes. In the noninteracting model, all these distributions are effectively trivial; their value within their region of definition is
 |
(31) |
Note, in particular, that the important case of the probability distribution for the occupation of one specified site z1 by any nucleosome is simply
 |
(32) |
A discussion of the interaction between neighboring nucleosomes is better carried out in terms not of the positions of the nucleosomes per se but, rather, of their relative positions. We are thus interested in the correlation functions that describe the probability of finding the nucleosomes at given distances between each other. The simplest of these quantities is the two-point correlation function  defined as the conditional probability that, in a template with load n, two consecutive occupied points be separated by a distance y (measured in free length coordinates). In the noninteracting model, this is
 |
(33) |
It is even simpler, however, to work with the correlation function Cn(z) defined as the normalized probability of finding any pair of nucleosomes separated by a distance z. For the noninteracting model we obtain the extremely simple form
 |
(34) |
Perturbation theory for interactions
We consider now how interactions involving the template sequence and interactions between nucleosomes affect the positional distributions and correlation functions. We will consider results to first order in perturbation theory. All the statistics considered above exhibit changes due to these effects, but some provide a clearer picture of them. Furthermore, we choose to analyze only those experimental statistics that are more susceptible to effects from only one of the perturbations considered.
Consider first the effects of template sequence. These are the hardest to disentangle from the analysis of the free length coordinates, as the relation between absolute and free-length coordinates complicates matters considerably. To observe these effects it is necessary to avoid considering, to the extent possible, multiple nucleosomes and to focus on single nucleosome positions. The simplest way to do this is to analyze nucleosome positions in templates with load n = 1 and use f1(y1). This choice, however, results in very slowly convergent statistics. An alternative is to use statistics for the first nucleosome in a multinucleosomal template fn(y1). To first order in perturbation theory, both of these distributions (as given by the noninteraction model) are modified by the simple multiplicative factor exp(−V1(x)). Expansion of the probabilities in powers of this factor leads to the results
 |
(35) |
and
 |
(36) |
The available experimental data will not allow the determination of the specific form of V1 but due to the simple form of the corrected distributions, we can set bounds on the size of the fluctuations of the interaction potential along the template.
Next, consider the effects of neighboring nucleosome interactions. These are clearest in the correlation functions  and Cn(z). For these functions, the effect of the interactions is simply to enhance the probability within the region of interaction of length a. If within this region the average interaction energy is V2, we obtain, to first order in the expansion in powers of the exponential of the potential,
 |
(37) |
and
 |
(38) |
These correlation functions are also modified by the intrinsic nucleosome positioning properties of the DNA templates. These modifications are clearly observed in the experimentally determined  functions, but are very small for the Cn functions. In both cases, the modifications due to positioning effects are clearly separated from those of internucleosomal interactions.
The enhancement of the occupation probability of the region of interaction (of size a), for consecutive nucleosomes (i.e., for  ) is approximately
 |
(39) |
whereas the enhancement for any pair (Cn) is
 |
(40) |
In these expressions, we have used the virial coefficient v, defined as
 |
(41) |
Determination of parameters from fits
To obtain values of w, the energy parameter, and L0, the nucleosome wrapping length, the population data were fitted using a maximum likelihood estimator. For a given population distribution f(n) we determine the values of the estimator s given by
 |
(42) |
In this expression, fk is the observed relative frequency of templates with population n in sample k and p(n;w,Lo) is the predicted probability for given values of the parameters w and Lo. For a given wrapping length Lo, the values of parameters wk that maximize the estimator can be determined by direct numerical minimization. The values of the parameter w presented in this work were obtained using a steepest-decent method for the maximization that determined w for each sample and every assumed wrapping length with an accuracy of 0.01%. If the wrapping length were known, these fits would provide estimates of the value of w up to errors of ±0.1. The values of the energy parameter are different for every sample as they are related to the input concentration of histones, whereas it is assumed that the nucleosome wrapping length for all samples is the same. We report below data analysis using different assumed values for the wrapping length, but it is also possible to infer a likely value of the wrapping length by maximizing the sum S of the estimators of all samples, with respect to the assumed wrapping length. The sum can be computed for all values Lo of interest, and the value of Lo that maximizes the estimator can be determined by direct inspection.
For the determination of the amplitude of the fluctuations of the positioning interactions along the templates, we considered the data sets with higher counts, n = 6, and 7, for each of the two different templates. We consider the first positioning maximum and minimum in the probability distribution for the position of the first nucleosome. At these points, the ratio between the observed distribution F1(y) and the value f1(y) predicted by the noninteracting theory determines the amplitude of the fluctuations in positioning potential ΔV1 as
 |
(43) |
For determination of the virial parameter v that quantifies the strength of the nucleosomal interaction, we determined the integrated probability of the peak near zero for the correlations Cn(y) for n = 6,7. Using these values for the enhancement Δp, the values of the viral parameter follow from Eqs. 39–40.
RESULTS
We have used a statistical mechanical model to analyze population data obtained from AFM studies of 5S rDNA nucleosomal arrays (172-12 or 208-12) reconstituted to various subsaturated occupation levels with hyperacetylated or unacetylated histone octamers (Yodh et al., 1999, 2002; Bash et al., 2001). For each sample in these data sets, the DNA length and sequence, input concentrations of DNA and histones, the actual numbers of nucleosomes formed on the templates and their locations are all known quantities. By fitting the predicted (model) population distributions to the experimental data (see Methods), we have determined the free energy parameter w for all samples, using assumed nucleosome wrapping length values from 90 to 147 basepairs. We have found that the sum of estimator parameters for the whole data set is maximized for an assumed wrapping length of Lo = 106 basepairs.
Fig. 5 shows examples of experimental population distributions for individual reconstituted samples and the theoretical curves that provide the best fits to them. The population distributions with the best (Fig. 5, a, c, e, and g) and worst (Fig. 5, b, d, f, and h) fits are shown for each type of data set (172-12 or 208-12, acetylated or unacetylated). In the best fit cases, the agreement between theory and experiment is excellent. Even for some of the worst fits (compare to Fig. 5, d and f) experiment and theory do not produce grossly different distributions. The majority of experimental distributions were suitably fit by the theory (data not shown). We note that these fits of probability distributions to data from individual samples, and therefore the determinations of the parameter w from these fits, are precise so long as a large enough number of molecules are counted. In some of the samples in the data set, >300 molecules were analyzed and all had at least 150 counted. The value of the parameter w for a given sample depends on the chemical potential of free histone octamers, which in turn depends (in a complicated manner) on their concentration in solution. It is nevertheless useful to plot the values of w as a function of the logarithm of the molar concentration of free histone octamers [H], as a method to analyze the whole data set. Fig. 6 shows examples of this type of plot using two different values for the assumed wrapping length: the standard 147 bp and the value minimizing the sum of estimators, 106 bp. Each data point is marked according to the type of histone and DNA template used. The scatter in the data undoubtedly reflects the variations inherent in reconstitution. For example, material adsorbing to the dialysis bag can vary from experiment to experiment and these variations can be significant for the small (few microgram) quantities of DNA and histones that we typically reconstitute (Bash et al., 2001). Thus, there will of necessity be some uncertainty in these free histone octamer concentration [H] values, resulting in variable errors in the horizontal location of points in the w against ln[H] plots. In Fig. 6 the vertical errors in the position of the data points are ±0.1, and we consider the horizontal errors in the position of the data points of order ±0.5, determined by the degree of horizontal dispersion for points of similar w-values. These effects produce low values for the coefficient of determination in the linear regressions shown in average R2 = 0.35.
FIGURE 5.
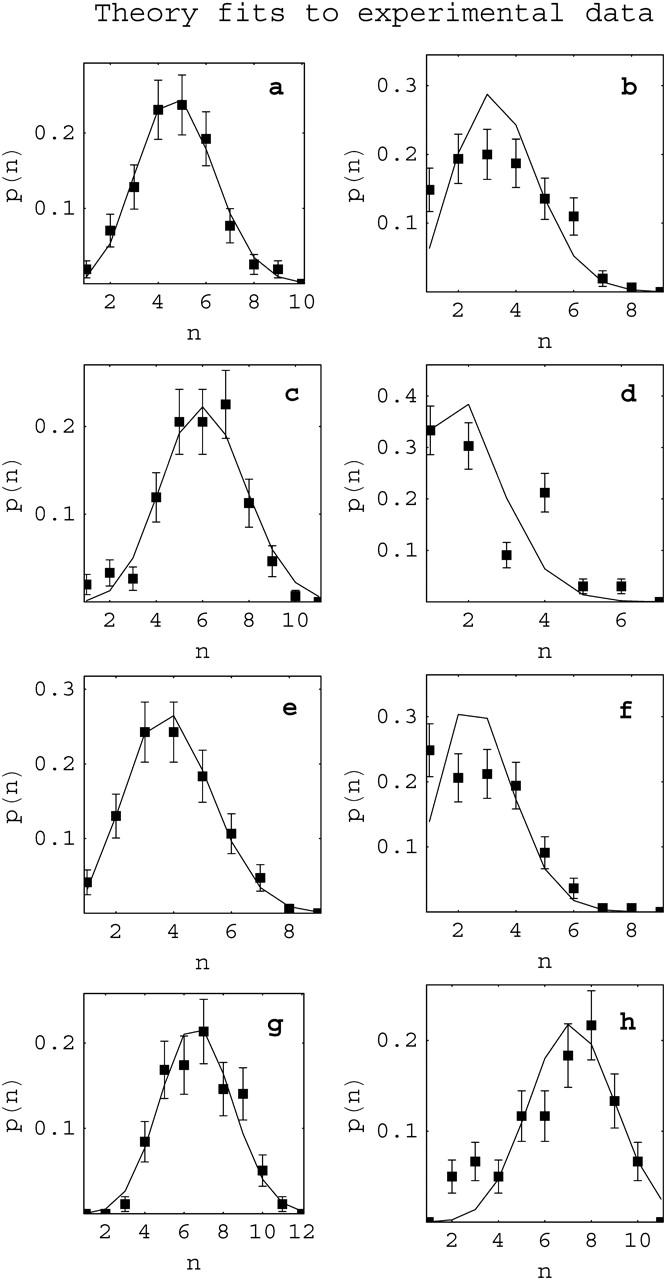
Fits of theoretical and experimental population distributions. For each pair (theoretical/experimental) of distributions, we show the cases of best (a, c, e, and g) and worst (b, d, f, and h) agreement between theoretical fits (solid lines) and experiment (squares). (a and b) 172-12 DNA template/unacetylated histones with nav = 3.7 and 2.4; (c and d) 208-12/unacetylated histones, nav = 4.8 and 1.4; (e and f) 172-12 template/acetylated histones, nav = 2.9 and 1.8; and (g and h) 208-12/acetylated histones, nav = 5.8 and 5.6. In all cases the assumed wrapping length for the theoretical calculation is Lo = 106 basepairs. Error bars indicate expected statistical fluctuations given the number of molecules counted.
FIGURE 6.
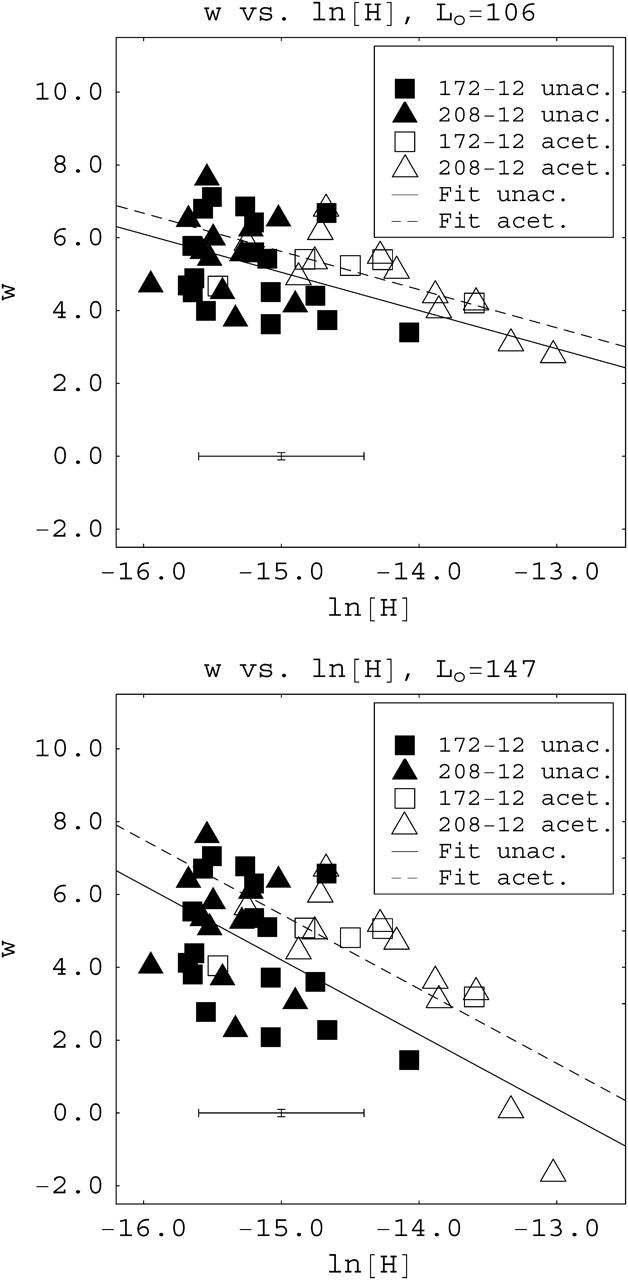
Plots of the fitted parameter w against the logarithm of the concentration of free octamers ln[H] for two different assumed values of the wrapping length, (top) Lo = 106 basepairs, and (bottom) Lo = 147 basepairs. The linear fits shown were obtained assuming equal slopes for both acetylated and unacetylated samples. Typical size of error bars for the data points are shown at the bottom left. Errors in the vertical positions of the data points are ±0.1, smaller than the size of the symbols. Errors in the horizontal position of the data points are inferred from the horizontal dispersion of points for similar values of w.
Despite the scatter, it is clear that data points for the two different DNA templates, 172-12 and 208-12, commingle but data points for acetylated arrays group distinctly from those for unacetylated arrays, regardless of the DNA template. Thus, the parameter w is not sensitive to which of these two DNA templates are used, which implies, at least for subsaturated arrays, that the interaction free energy g does not depend to a significant extent on the size of the basic unit, 172 or 208 basepairs, in these templates. The DNA units in both templates contain the basic DNA sequence thought to be essential for positioning (Fitzgerald and Simpson, 1985) and both arrays position nucleosomes similarly (Dong et al., 1990). Both templates are therefore expected to bind nucleosomes with quite similar affinities. On the other hand, the data do indicate that the interaction free energy g varies with histone acetylation state. The model presented above predicts that a change in the value of the interaction free energy, for example due to histone acetylation, should produce a vertical shift in the plots of w against the logarithm of the free histone concentration [H]. The fits, of the independent variable w as a function of the logarithm of the concentration of free histones obtained in Fig. 6, are consistent with that prediction. These fits were obtained assuming that the graphs for acetylated and unacetylated chromatin samples have equal slopes, i.e., the two data sets are best fit simultaneously to have the same slope. The slope is very close to −1.0 (−1.02) for an assumed wrapping length of 106 basepairs. We also tried independent linear fits for the acetylated and unacetylated data sets. This approach yields slopes of −1.12 and −0.88, respectively, still close to the joint slope value of −1.0 (data not shown). Thus, we believe that the two data sets have the same slopes, within experimental error. A similar analysis for an assumed wrapping length of 147 basepairs exhibits a slope close to −2.0, and the two types of data sets are also well fit by a single slope (see Fig. 6 e).
The significance of the separation of the data points, in the w energy parameter analysis, into two distinct clusters based on acetylation state, can be tested in different ways. Using the linear fits as a starting point, a straight line intermediate between the fits for acetylated and unacetylated data separates the w–ln[H] plane into two parts. The region below the line contains predominantly points from unacetylated arrays whereas the region above the line contains primarily points from acetylated arrays. A chi-square test reveals that the separation of populations is meaningful to a 0.1 level of significance, for all different values of the assumed wrapping length. Furthermore, an unpaired t-distribution test of the horizontal deviations from the linear fits reveals that the assumption that the deviations correspond to a single population, as opposed to belonging to two distinct groups, can be rejected to a 0.05 level, for all different values of the assumed wrapping length.
In linear fits such as those in Fig. 6, the following quantities are relevant: the slope m of the fits, the intercepts of the fits with the horizontal axis, and the vertical shifts Δw between the acetylated and unacetylated curves. These quantities can be interpreted as follows: 1), the magnitude of the slope m corresponds to the effective number of species into which the octamer decomposes in solution (see Eq. 8); 2), the x axis intercept provides the association constants for a nucleosome formed on a length of DNA Lo (see Eqs. 16 and 19), which in turn determines the association constants for standard templates of length L = 147 basepairs (see Eq. 20); and 3), the vertical shift Δw between the acetylated and unacetylated linear fits is related to the difference in interaction energies between acetylated and unacetylated octamers, ΔΔG = kTΔw. The values for these quantities, as determined from Fig. 6 and from a similar analysis for an assumed wrapping length of 127 basepairs, are presented in Table 1. In agreement with our suggestion above that acetylation is a contributing factor in the association free energy, we find that ΔΔG is positive (not zero) in all cases. Determination of errors bounds on the inferred values of ΔΔG and the association constants are complicated, but we can provide a simple estimate by using the known lower bound of 0, and take the maximum magnitude of the error to be equal to the magnitude of the ΔΔG value itself.
TABLE 1.
Association constants for different values of assumed wrapping length
| Association constants for histone octamers and DNA of minimal length Lo
|
Association constants for histone octamers and DNA of length 147 basepairs
|
|||||
|---|---|---|---|---|---|---|
| Assumed wrapping length in basepairs Lo | Slope of joint linear fits | Unacetylated Kmn × 10−6 M−1 | Acetylated Kma × 10−6 M−1 | Unacetylated K147,n × 10−6 M−1 | Acetylated K147,a × 10−6 M−1 | ΔΔG (Kcal/mol) |
| 106 | −1.0 | 0.026 | 0.015 | 1.1 | 0.64 | 0.34 |
| 127 | −1.4 | 0.12 | 0.066 | 2.5 | 1.4 | 0.49 |
| 147 | −2.0 | 0.42 | 0.22 | 0.42 | 0.22 | 0.75 |
Nucleosome location data can also be incorporated into the statistical mechanical model analysis described above and provide a further test of occupation tendencies of nucleosomes on these subsaturated rDNA templates. There are two general types of molecular interactions that will produce nonrandom nucleosome occupation: 1), sequence-specific interactions between the DNA and histones, which will cause nucleosome occupation at specific sites on the template, i.e., nucleosome positioning; and 2), interactions between neighboring nucleosomes, which will produce shorter than the expected (random) internucleosomal separations (Yodh et al., 2002). Nearest-neighbor internucleosomal interactions are mediated by the histone N-terminal tails and involve either histone-DNA or histone-histone contacts (Hansen et al., 1998; Hansen, 2002).
Nucleosome locations
We first describe an analysis of the degree of randomness in nucleosome location preferences (nucleosome positioning). This can be detected by measuring absolute nucleosome locations on the template (Figs. 7 and 8). Fig. 7 a shows a plot of the probability density h6(y1) of finding a nucleosome at any position y (in free length coordinates) on a 208-12 DNA template that contains six (acetylated) nucleosomes compared to the prediction of the random occupation model. To plot these distributions, the experimental data was binned into segments of size Δy = 0.025. Nucleosome occupation levels of n = 6 are of interest because these molecules are at approximately one-half of full occupation levels on these 12-site templates. Such levels have shown the most deviation from random behavior in previous qualitative analyses (Bash et al., 2001; Yodh et al., 2002). Due to the definition of the free length variables, a template with a small periodic positional preference will exhibit systematic deviations from a uniform distribution only at the free length coordinate corresponding to the first positioning unit. The data show a good deal of fluctuation and in certain portions the values exceed (by ±1 σ) the predictions of the noninteracting model. However, the overall fluctuations in the distribution of absolute nucleosome locations over the whole length of the template for each of the values of loading n for both acetylated (compare to Fig. 7; see Table 2) and unacetylated (not shown) arrays do not support the existence of widespread, specific positioning on this subsaturated template, i.e., the data are in general more consistent with a random occupation model.
FIGURE 7.
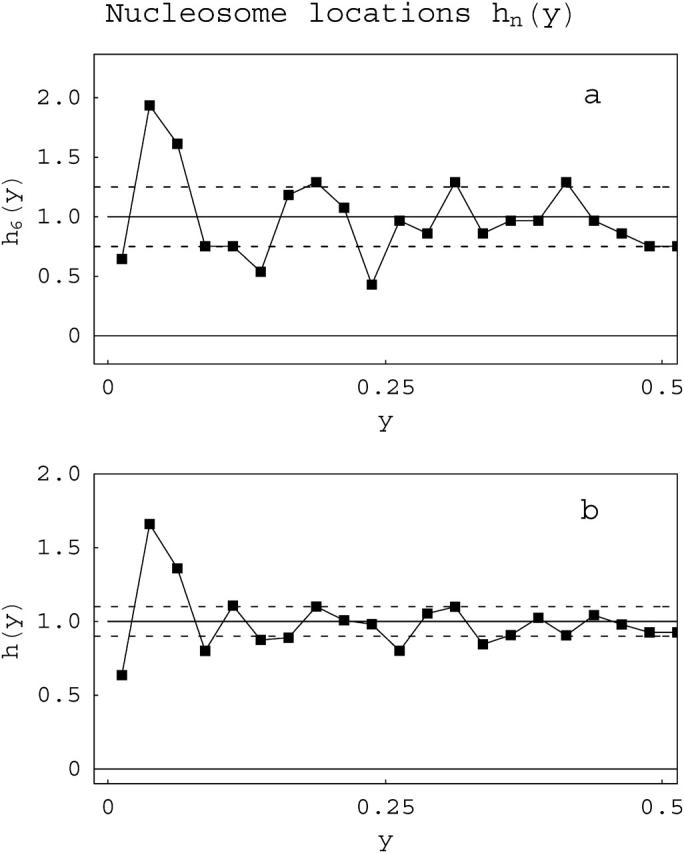
Nucleosome location distributions. fn is the probability of a nucleosome occupying any position y (in free length coordinates) on a DNA template containing n nucleosomes. The distribution for 208-12 acetylated templates containing only six nucleosomes, f6(y), is shown in a and the composite distribution f(y), i.e., combining all values n of nucleosome occupation in a single distribution, is shown in b, again for acetylated 208-12 arrays. Because we cannot distinguish between the two ends, the distributions are symmetrized with respect to the point y = 0.5. The solid lines are the theoretical predictions; the dotted lines are ±1σ from the theoretical value, adjusted for the number of molecules counted, the binning size, etc. The peaks (>+1σ) or valleys (<−1σ) reflect preferred or disfavored positioning within the template.
FIGURE 8.
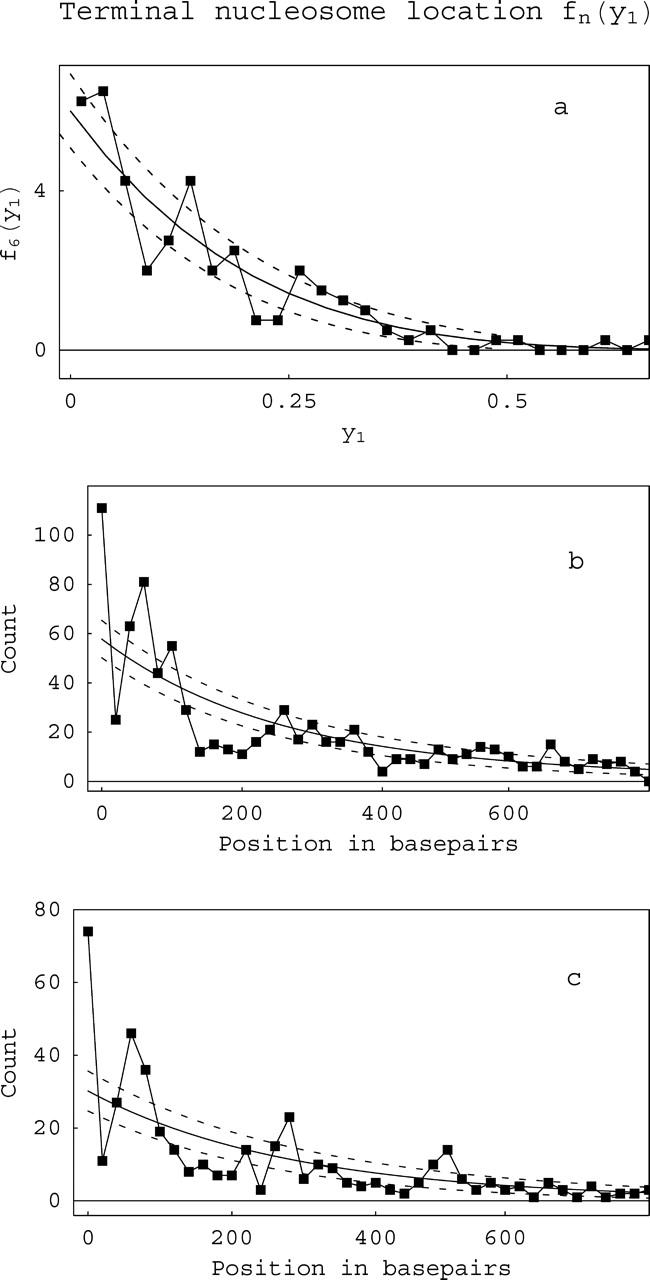
Location distributions for the most terminal nucleosome. hn(y) is the probability for finding the first nucleosomes, i.e., the two most terminal ones, at any position y on a DNA template containing n nucleosomes. (a) Distribution for h6, i.e., arrays containing only six nucleosomes. (b and c) Composite h(y) distributions (the weighted sum of data from all values n of nucleosome occupation) for 208-12 unacetylated (b) or acetylated (c) arrays. Because we cannot distinguish between the two ends, the distributions are symmetrized; thus only half needs to be shown. The solid lines are the theoretical predictions; the dotted lines are ±1σ from the theoretical value, adjusted for the number of molecules counted, the binning size, etc. The peaks (>+1σ) or valleys (<−1σ) reflect preferred or disfavored positions for the terminal nucleosome. Note the differing x-axis scales for a versus b and c.
TABLE 2.
Strength of fluctuations in positioning potentials of 208-12 templates
| Histone type | Potential fluctuation ΔV1 Kcal M−1 |
|---|---|
| Unacetylated | 0.2 ± 0.1 |
| Acetylated | 0.3 ± 0.1 |
Fig. 7 b shows a composite plot, obtained by a weighted combination of the data for different n-values; the corresponding theoretical curves are obtained in the same way. This distribution (for acetylated 208-12) also shows only weak periodicity and again does not support a high degree of specific positioning on these templates. Moreover, the composite distribution for 208-12 unacetylated arrays shows even weaker periodicity (data not shown). We note that the amount of data necessary to obtain good convergence to average values of positional statistics is much larger than that needed for the analysis of population features. Thus, composite distributions provide useful insights even though the distributions at individual values of n provide the best tests for the model.
The locations of the first nucleosome on the template, i.e., the nucleosomes closest to the template termini, show the best and most consistent evidence for occupation at specific sites. This is seen in both the n = 6 and composite distributions in Fig. 7 and more clearly in Fig. 8, which shows the observed frequency f6(y1) for the first nucleosome, i.e., the one nearest a template terminus, to occupy a position y1 in a 208-12 template with (acetylated) nucleosome occupation level n = 6. This distribution shows two strong peaks, one near the origin and a second one corresponding to a terminal nucleosome occupying the second unit in the 208-12 concatameric template. Fig. 8 b shows the composite distribution of first nucleosome locations for the 208-12 unacetylated samples compared with the theoretical prediction obtained from the weighting of the corresponding fn(y1) distributions, whereas Fig. 8 c shows a composite for acetylated 208-12 arrays. This data is presented as a function of the absolute position of the edge of the first nucleosome. The composite distribution for the acetylated arrays shows very clear periodicity, with three peaks each spaced at ∼200-bp intervals, consistent with the size of the repeating unit in this template. The data in Fig. 8 b demonstrates that the periodicity (positioning tendency) is weaker in 208-12 unacetylated arrays. By comparing the deviations of the experimental location data with the values predicted by the noninteracting theory, the size of the fluctuations in the interaction free energy due to the sequence of the template can be determined. This corresponds to 0.2 ± 0.1 kCal/M for unacetylated and 0.3 ± 0.1 kCal/M for acetylated nucleosomes The error corresponds to the expected statistical fluctuations given the number of observed molecules. The predominance of the peak at the shortest distance in these distributions reflects the strong preference of nucleosomes to occupy DNA termini, as noted previously (Yodh et al., 2002).
Internucleosomal interactions
We turn next to an analysis of the extent to which interactions between nucleosomes affect template occupation. Fig. 9 (a and b) show the observed frequencies  that pairs of neighboring nucleosomes occupy positions a distance y apart in 208-12 unacetylated (Fig. 9 a) or 208-12 acetylated (Fig. 9 b) arrays with an occupation level n = 6. These very short distances reflect the effects of internucleosomal contacts on occupation tendencies, i.e., cooperativity in site occupation. Fig. 9, c and d, compare the composite (summed over all n-values) distributions for acetylated and unacetylated 208-12 arrays. The short internucleosomal distances are the most populated in the distribution for unacetylated but not for acetylated 208-12 chromatin. In the acetylated distribution, the major peak is at ∼100 bp, a linear distance too long for major internucleosomal contact (Yodh et al., 2002). This statistic clearly reveals an enhancement in the probability of finding pairs of nucleosomes at very short distances from each other and demonstrates that acetylation largely abolishes this preference for very short distances. This effect was noted previously (Yodh et al., 2002). In fact, this model analysis shows acetylation induces an anticooperative effect, as seen by the dip at the shortest distances in the distribution in Fig. 9 d. From the deviations of experimental internucleosomal distances with respect to the noninteracting theory (data from Figs. 9 and 10, and other not shown), we have determined values for the virial coefficients v2, and these are presented in Table 3. This table also reports an inferred average energy of interaction between nucleosomes. This was calculated by assuming that strong internucleosomal contacts between nucleosome neighbors extend over a distance of up to 14 nm or 40 bp of linear DNA, 7 nm (20 bp) from each nucleosome in the pair. The real values of this quantity are completely unknown but picking a value for this distance allows us to estimate relative energies of interaction. The value we chose is consistent with studies of the reduction in binding of transcription factors to DNA caused by the presence of nucleosomal cores (Thiriet and Hayes, 1998) and with a consideration of possible histone N-terminal tail lengths (Yodh et al., 2002). The interaction energy values differ significantly between acetylated and unacetylated chromatin (Table 3) since they are opposite in sign. The positive sign for the acetylated arrays confirms the above suggestion of an anticooperative effect due to acetylation.
FIGURE 9.

Nearest-neighbor internucleosomal distance distributions.  is the probability for finding neighboring nucleosomes at distances y from one another on DNA templates containing n nucleosomes. (a and b) Plots of
  i.e., 208-12 templates containing six nucleosomes, for (a) unacetylated, and (b) acetylated nucleosomal arrays. Using the weighting of theoretical values for different n-values, a theoretical composite can be directly compared with composite data (combining all n-values) of observed neighboring internucleosomal distances. On the right, this comparison is shown for (c) unacetylated and (d) acetylated 208-12 arrays. The solid lines are the theoretical predictions. The dashed lines are placed at 1 SD from the theoretical curves, given the number of molecules counted.
FIGURE 10.
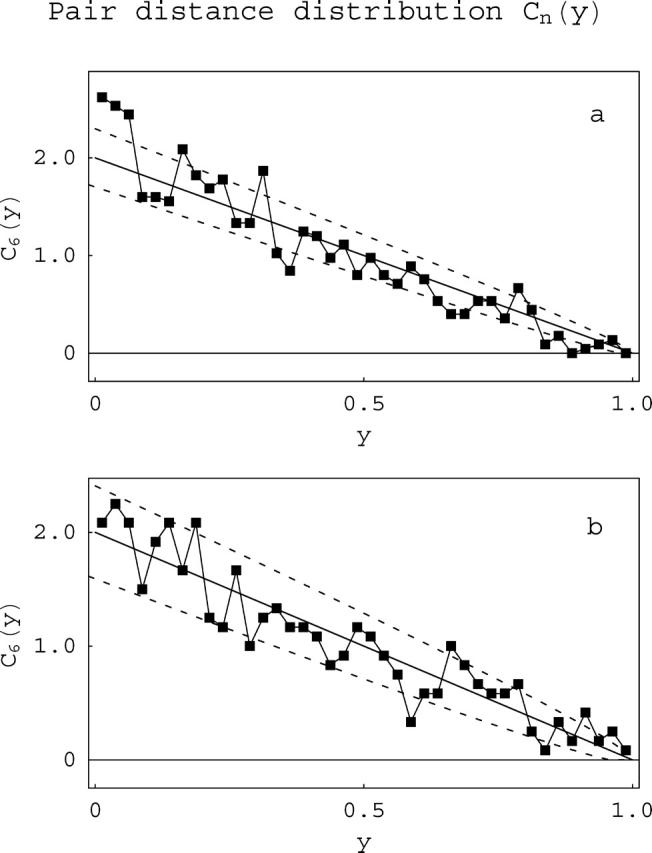
Any pair-internucleosomal distance distributions. The positional statistic Cn(y) expresses the probability of finding any pair of nucleosomes at a distance y from each other on a template containing n nucleosomes. The figure shows plots of C6(y), i.e., 208-12 templates containing six nucleosomes, for (a) unacetylated, and (b) acetylated arrays. The solid lines are the theoretical predictions. The dashed curves are placed at 1 SD from the theoretical curves, given the number of molecules counted.
TABLE 3.
Virial coefficients and interaction energies for neighboring nucleosome interactions in 208-12 templates
| Histone type | Virial coefficient v2 bp | Interaction energy V2 Kcal M−1 |
|---|---|---|
| Unacetylated | 20.0 ± 10.0 | −0.25 ± 0.15 |
| Acetylated | −10.0 ± 10.0 | 0.15 ± 0.15 |
One more type of intratemplate correlation distribution was calculated, the probability for any two nucleosomes (nearest-neighbors n–(n + 1), next-nearest-neighbors n–(n + 2), etc.) to occupy sites a distance y apart (Fig. 10). This statistic can detect any longer-range correlation in nucleosome occupation. As seen in Fig. 10, occupation is random except for the tendency for short nearest-neighbor distances. Composite distributions show the same result (data not shown). These distributions most clearly separate the effect of neighboring nucleosomes interactions from the random background.
DISCUSSION
We have developed a statistical mechanical model and applied it to the analysis of population and location features of nucleosome occupation at subsaturating levels on the widely-studied 5S rDNA concatameric templates such as the 208-12. The model takes as adjustable parameters the free energy of histone-DNA interactions and the average wrapping length of DNA in nucleosomes. We use data obtained from AFM studies of the occupation features of subsaturated 5S rDNA arrays (Yodh et al., 1999, 2002; Bash et al., 2001) and compare the experimental population and location distributions so derived to various types of theoretical distributions describing population and location (both absolute and relative) behavior.
CONCLUSIONS
The results of the analysis lead to the following conclusions.
Population features
The good agreement between experiment and theory, for example between the predicted (theoretical) and experimental population distributions for individual samples (see Fig. 4), supports the basic assumptions used to construct the model. Also, despite a large dispersion, the differential grouping of values for acetylated versus unacetylated samples in Fig. 5 does indicate convergence of data for the two types of arrays and thus again shows consistency between the experimental results and the theoretical analysis.
The agreement between the model and the experimental results argues that the major determinant of the population distribution of a chromatin sample is the strength of the DNA-histone interaction, as suggested in previous work (Bash et al., 2001). The minor deviations from the predictions of the simple model of noninteracting nucleosomes, such as broadening of the experimental distributions compared to the theoretical ones (Fig. 4), are probably due to neighboring nucleosome interactions, DNA template-dependent effects such as nucleosome positioning or torsional effects. The former two effects can be analyzed through studies of positional data (see Locational Features, below). The two DNA templates whose population characteristics were analyzed here are repetitive in nature and vary mainly in the length of the basic, repeating DNA unit, 172 or 208 bp. Both contain the same basic rDNA nucleosome positioning sequence (Simpson et al., 1985; Dong et al., 1990).
Under reconstitution conditions, histones are present as H3-H4 tetramers and H2A-H2B dimers. Thus, one might expect the slope for the plot of the free energy parameter w versus ln[H] to be ∼−3.0, corresponding to two dimers (y1 = 2) and a tetramer (y2 = 1) in Eq. 8. For the largest assumed wrapping length used in this analysis, 147 basepairs (Table 1), we obtain a slope of −2.0. Minimization of the sum of estimators with respect to the wrapping length leads to an inferred wrapping length of 106 basepairs. We regard this fitted length as the best wrapping length value for this data set. With this wrapping length, a slope of −1.0 is obtained. A value of −1.0 might reflect the fact that the nucleosome reconstitution process is determined by the association of the H3-H4 tetramer with DNA; H2A and H2B are merely add-ons. In agreement, the H3-H4 tetramer is known to play the central role in organizing the nucleosome (van Holde, 1989) and by itself determines positioning of nucleosomes on this DNA template (Dong et al., 1990). Interestingly, Khrapunov et al. (1997) obtain a value for the association of H3-H4 tetramers with DNA (in 1 M NaCl) that is similar to the value we determine for nucleosome association. Determination of the average wrapping length by this theoretical approach is admittedly somewhat uncertain for subsaturated arrays because the shapes of the probability distributions are not very sensitive to changes in L0 (see Fig. 3), due to the small number of nucleosomes on the arrays. However, results supporting a shorter wrapping length for 5S nucleosomes have also been obtained from a more reliable method, contour length measurements on subsaturated arrays (S. Lindsay R. Bash, H. Want, J. Yodh, F. Solis, and D. Lohr, unpublished). Also, the literature provides numerous examples, from other types of approaches, of stable nucleosomes containing a full histone complement and lengths of DNA as short as 100 basepairs (van Holde and Zlatanova, 1999) and environmental influences such as ionic strength can affect the nucleosome wrapping length both in vivo (Lohr, 1986) and in vitro (van Holde, 1989). Shorter wrapping lengths are also consistent with the known decreases in histone-DNA affinities toward the termini of the nucleosome (Luger et al., 1997; Davey et al., 2002; Brower-Toland et al., 2002) and with the greater lability of termini DNA on the histone surface (van Holde, 1989; Polach and Widom, 1995). It is also possible that AFM-related surface effects could contribute to this apparent shortening of the nucleosome wrapping length in these AFM studies.
The values for nucleosome association constants (see Table 1) determined from Fig. 5 also have some uncertainty. However, varying the assumed average wrapping length or relaxing the assumption of common slopes for both acetylated and unacetylated data sets still leaves the association constants within the (inverse) micromolar range, which suggests that the above values are probably not grossly in error. Gottesfeld and Luger (2001) determined dissociation constants for mononucleosomes to be in the nanomolar range, i.e., much higher binding constants than we determine. On the other hand, Luger et al. (1999) report that with inputs of 6 μM of 5S DNA and histones, there is an ∼80% yield of mononucleosomes, which would correspond to an association constant in the micromolar range for formation of unacetylated 5S mononucleosomes. We suggest that values for nucleosome association constants remain inconclusive. The use of the techniques discussed in this article, extended to a larger range of concentrations, can provide a more precise determination of these association constants. The application of the model allows us to quantify the difference between the interaction free energies of unacetylated and hyperacetylated histones for 5S rDNA templates. The value of ΔΔG can be read from the shift in the w versus ln[H] graphs observed for acetylated chromatin. The direction of the shift indicates that acetylation weakens the DNA-histone interaction. This result is consistent with work using other types of approaches showing that acetylation “loosens” the histone-DNA interaction but only modestly (reviewed in Wolffe and Hayes, 1999). Also, Widlund et al. (2000) found that complete removal of N-terminal histone tails, a common model for the effects of histone acetylation, can destabilize nucleosome formation by 0.2–0.9 kcal/mol, which is in quantitative agreement with our results. However, the same study also found that acetylation stabilizes nucleosome formation, although a possible kinetic explanation for this effect was noted.
Locational features
These features are more difficult to analyze than population features because the number of data points required to reconstruct a positional probability density is much larger. Nevertheless, the positional data presented above is sufficient to demonstrate that a random occupation model provides an adequate starting point for the analysis of both population and location features of these chromatin arrays. Sequence-specific DNA-histone interactions, which cause specific nucleosome positioning, and histone tail-mediated internucleosomal interactions, which cause a shortening of nearest-neighbor internucleosomal distances due to correlations in occupation, are the two nonrandom features identified in previous occupational studies of 5S arrays (Yodh et al., 2002):
Specific nucleosome positioning is thought to be a hallmark of the concatameric 5S rDNA templates (Dong et al., 1990; Meerseman et al., 1991) and one possible reason why these templates are so successful in reconstitution of multinucleosomal arrays by salt dialysis methods (for review, see Bash et al., 2003). However, the data in Figs. 7 and 8 show only a weak tendency for specific nucleosome positioning, superimposed on a random location background. Only near the template termini and for the most terminal nucleosomes (Fig. 8) can we see clear evidence for specific positioning; the evidence for specific positioning is clearest for acetylated arrays (Fig. 8). Previous work has indicated that acetylation does not disrupt nucleosome positioning, but our analysis suggests that it can actually enhance positioning tendencies. We suggest that first nucleosome positions (Fig. 8) more clearly reveal positioning effects because influences arising from contacts with other nucleosomes (see below) are reduced for the terminal nucleosomes and that acetylated arrays show the strongest positioning because these arrays have lower levels of internucleosomal interactions than unacetylated arrays (see below). Acetylated arrays show better positioning despite having a lower level of intrinsic DNA-histone interaction energy (Table 1), indicating the strong influence of internucleosomal contacts on nucleosome positioning. Nucleosomes have a strong tendency to locate near DNA termini on any DNA fragment (Linxweiler and Horz, 1984; Yodh et al., 2002), thus accounting for the absolute end preference. Why do we not observe the high level of specific nucleosome positioning thought to be characteristic of these 5S arrays? Previous studies (Dong et al., 1990; Meerseman et al., 1991) used saturated (or approaching saturated) nucleosomal arrays and nuclease (MNase) digestion approaches, whereas our studies have used subsaturated arrays and AFM approaches. Subsaturated arrays provide clearer tests for intrinsic occupation tendencies, such as sequence-specific positioning, but increase the opportunity for random occupation, thus providing an unfavorable entropic component for positioning that is greatly reduced on saturated templates. Therefore, lower degrees of specific positioning may be thermodynamically favored on subsaturated templates. If subsaturation affects positioning this way, then intrinsic DNA-histone positioning should be a less important feature during chromatin assembly in vivo than it is on assembled templates, which are typically saturated with nucleosomes. Note that even in saturated 208-12 arrays, the preferred translational position is favored in only ∼50% of the population. Alternatively, the AFM technique itself could have a disruptive effect on specific nucleosome positioning. In these experiments, chromatin is fixed before it is exposed to conditions that could lead to sliding and positional changes and the fact that we do see some evidence of specific positioning (near the termini) argues that positioning can be observed by AFM approaches but we cannot exclude the possibility that the approach itself is responsible for the failure to observe high levels of positioning. It is also possible that the use of MNase in the previous approaches, which has a significant potential for sequence-specific cleavage (van Holde, 1989), could have affected those results. Our observations indicate that the status of specific positioning on 5S rDNA arrays, at least subsaturated ones, is less than absolute. The value we estimate for the contribution of sequence-specific effects like positioning (0.6 ± 0.4 kcal/M) is lower than differential favorability for nucleosome formation on 5S DNA (∼1.5 kcal/M) compared to other DNAs (Shrader and Crothers, 1999). Those studies used mononucleosomes and, as for studies of saturated multinucleosomal templates, would have a less unfavorable entropic contribution than would be the case for our subsaturated templates.
Interactions between neighboring nucleosomes can cause nucleosomes to locate closer to one another than would be the case for random occupation, thus leading to a shortening of internucleosomal distances compared to random expectation (Yodh et al., 2002). Fig. 9 shows that this feature is much more pronounced in unacetylated than in acetylated 208-12 arrays. The difference is observed in both composite and distributions at individual n-values, verifying its significance. The difference in behavior between acetylated and unacetylated 208-12 arrays is consistent with the known effects of acetylation on folding of these arrays, a feature which also depends on internucleosomal contact (Garcia-Ramirez et al., 1995; Fletcher and Hansen, 1996). It was previously argued that on 208-12 DNA templates, the sequences in the individual units that are responsible for positioning are located far enough apart that positioning preferences and internucleosomal contact preferences can sometimes compete with one another (Yodh et al., 2002). The analysis presented here confirms the strong effects of acetylation on internucleosomal interactions and the effects of internucleosomal interactions on nucleosome positioning in the template. Histone acetylation is a characteristic of both replicating (Annunziato and Hansen, 2000) and transcriptionally active chromatin (Grunstein, 1997). By reducing internucleosomal contacts in templates like the 208-12, this modification allows acetylated nucleosomes to behave more independently, and in fact anticooperatively, compared to unacetylated nucleosomes (Yodh et al., 2002).
A statistical thermodynamic analysis of experimental AFM population and location data has been used to quantitate intrinsic DNA-histone binding strength, DNA sequence-specific binding contributions, and the contributions of internucleosomal interactions to template occupation on the well-studied 5S rDNA concatameric templates. Occupational behavior can be described as a mainly random process with features like nucleosome positioning and internucleosomal interactions treated as perturbations. Qualitative AFM analyses carried out on a single copy sequence, the MMTV promoter, indicate that this DNA may differ in several occupational features compared to the 5S (Bash et al., 2003). The approach developed here should prove useful in uncovering the intrinsic features of DNA-histone interaction in such physiologically relevant nucleosomal arrays.
Acknowledgments
We thank Jon Widow and Tom Chou for useful discussions.
This work was funded by a grant from the National Institutes of Health, CA 859900-02.
References
- Annunziato, A. T., and J. C. Hansen. 2000. Role of histone acetylation in the assembly and modulation of chromatin structures. Gene Expr. 9:37–61. [DOI] [PMC free article] [PubMed] [Google Scholar]
- Bash, R. C., J. Yodh, Y. Lyubchenko, N. Woodbury, and D. Lohr. 2001. Population analysis of subsaturated 172–12 nucleosomal arrays by atomic force microscopy detects nonrandom behavior that is favored by histone acetylation and short repeat length. J. Biol. Chem. 276:48362–48370. [DOI] [PubMed] [Google Scholar]
- Bash, R., H. Wang, J. Yodh, G. Hager, S. M. Lindsay, and D. Lohr. 2003. Nucleosomal arrays can be salt-reconstituted on a single-copy MMTV promoter DNA template: their properties differ in several ways from those of comparable 5S concatameric arrays. Biochemistry. 42:4681–4690. [DOI] [PubMed] [Google Scholar]
- Brower-Toland, B. D., C. L. Smith, R. C. Yeh, J. T. Lis, C. L. Peterson, and M. D. Wang. 2002. Mechanical disruption of individual nucleosomes reveals a reversible multistage release of DNA. Proc. Natl. Acad. Sci. USA. 99:1960–1965. [DOI] [PMC free article] [PubMed] [Google Scholar]
- Carruthers, L. M., C. Tse, K. P. Walker, and J. C. Hansen. 1999. Assembly of defined nucleosomal and chromatin arrays from pure components. Chromatin Meth. Enzymol. 304:19–35. [DOI] [PubMed] [Google Scholar]
- Chou, T. 2003. An exact theory of histone-DNA adsorption and wrapping. Europhys. Lett. 62:753–759. [Google Scholar]
- Davey, C. A., D. F. Sargent, K. Luger, A. W. Maeder, and T. J. Richmond. 2002. Solvent-mediated interactions in the structure of the nucleosome core particle at 1.9 Å resolution. J. Mol. Biol. 319:1097–1113. [DOI] [PubMed] [Google Scholar]
- Dong, F., J. Hansen, and K. van Holde. 1990. DNA and protein determinants of nucleosome positioning on sea urchin 5S rRNA gene sequences in vitro. Proc. Natl. Acad. Sci. USA. 87:5724–5728. [DOI] [PMC free article] [PubMed] [Google Scholar]
- Fitzgerald, P. C., and R. T. Simpson. 1985. Effects of sequence alterations in a DNA segment containing the 5S RNA gene from Lytechinus variegatus on positioning of a nucleosome core particle in vitro. J. Biol. Chem. 260:15318–15324. [PubMed] [Google Scholar]
- Fletcher, T. M., and J. C. Hansen. 1996. The nucleosomal array: structure/function relationships. Crit. Rev. Eukaryote Gene Expr. 6:149–188. [DOI] [PubMed] [Google Scholar]
- Garcia-Ramirez, M., C. Rochini, and J. Ausio. 1995. Modulation of chromatin folding by histone acetylation. J. Biol. Chem. 270:17923–17928. [DOI] [PubMed] [Google Scholar]
- Gottesfeld, J. M., and K. Luger. 2001. Energetics and affinity of the histone octamer for defined DNA sequences. Biochemistry. 40:10927–10933. [DOI] [PubMed] [Google Scholar]
- Grunstein, M. 1997. Histone acetylation in chromatin structure and transcription. Nature. 389:349–352. [DOI] [PubMed] [Google Scholar]
- Hansen, J. C., K. E. Van Holde, and D. Lohr. 1991. The mechanism of nucleosome assembly onto oligomers of the sea urchin 5S DNA positioning sequence. J. Biol. Chem. 266:4276–4282. [PubMed] [Google Scholar]
- Hansen, J. C., and D. Lohr. 1993. Assembly and structural properties of subsaturated chromatin arrays. J. Biol. Chem. 268:5840–5848. [PubMed] [Google Scholar]
- Hansen, J. C., C. Tse, and A. P. Wolffe. 1998. Structure and function of the core histone N-termini: more than meets the eye. Biochemistry. 37:17637–17641. [DOI] [PubMed] [Google Scholar]
- Hansen, J. C. 2002. Conformational dynamics of the chromatin fiber in solution: determinants, mechanisms, and functions. Annu. Rev. Biophys. Biomol. Struct. 31:361–392. [DOI] [PubMed] [Google Scholar]
- Kunze, K.-K., and R. R. Netz. 2000. Salt-induced DNA-histone complexation. Phys. Rev. Lett. 85:4389–4392. [DOI] [PubMed] [Google Scholar]
- Khrapunov, S. N., A. I. Dragan, A. V. Sivolob, and A. M. Zagariya. 1997. Mechanisms of stabilizing nucleosome structure. Study of dissociation of histone octamer from DNA. Biochim. Biophys. Acta. 1351:213–222. [DOI] [PubMed] [Google Scholar]
- Linxweiler, W., and W. Horz. 1984. Reconstitution of mononucleosomes—characterization of distinct particles that differ in the position of the histone core. Nucleic Acids Res. 12:9395–9413. [DOI] [PMC free article] [PubMed] [Google Scholar]
- Lohr, D. 1986. The salt dependence of chicken and yeast chromatin structure—effects on internucleosomal organization and relation to active chromatin. J. Biol. Chem. 261:9904–9919. [PubMed] [Google Scholar]
- Lohr, D. 1997. Nucleosome transactions on the promoters of the yeast GAL and PHO genes. J. Biol. Chem. 272:26795–26798. [DOI] [PubMed] [Google Scholar]
- Lohr, D., and T. Torchia. 1988. Structure of the chromosomal copy of yeast ARS1. Biochemistry. 27:3961–3965. [DOI] [PubMed] [Google Scholar]
- Luger, K., A. W. Mader, R. K. Richmond, D. F. Sargent, and T. J. Richmond. 1997. Crystal structure of the nucleosome core particle at 2.8 Å resolution. Nature. 389:251–260. [DOI] [PubMed] [Google Scholar]
- Luger, K., T. J. Rechsteiner, and T. Richmond. 1999. Preparation of NCPs from recombinant histones. Meth. Enzymol. 304:3–19. [DOI] [PubMed] [Google Scholar]
- Mateescu, E. M., C. Jeppesen, and P. Pincus. 1999. Overcharging of a spherical macroion by an oppositely charged polyelectrolyte. Europhys. Lett. 46:493–498. [Google Scholar]
- McGhee, J. D., and P. H. von Hippel. 1974. Theoretical aspects of DNA-protein interactions: cooperative and non-cooperative binding of large ligands to a one-dimensional homogeneous lattice. J. Mol. Biol. 86:469–489. [DOI] [PubMed] [Google Scholar]
- Meerseman, G., S. Pennings, and E. Bradbury. 1991. Chromatosome positioning on assembled long chromatin linker histones affect nucleosome placement on 5-S-RDNA. J. Mol. Biol. 220:89–100. [DOI] [PubMed] [Google Scholar]
- Polach, K. J., and J. Widom. 1995. Mechanism of protein access to specific DNA sequences in chromatin: a dynamic equilibrium model for gene regulation. J. Mol. Biol. 254:130–149. [DOI] [PubMed] [Google Scholar]
- Schiessel, H., J. Widom, R. F. Bruinsma, and W. Gelbart. 2001. Polymer reptation and nucleosome repositioning. Phys. Rev. Lett. 86:4414–4417. [DOI] [PubMed] [Google Scholar]
- Shrader, T., and D. Crothers. 1989. Artificial nucleosome positioning sequences. Proc. Natl. Acad. Sci. USA. 86:7418–7422. [DOI] [PMC free article] [PubMed] [Google Scholar]
- Simpson, R., and D. Stafford. 1983. Structural features of a phased nucleosome core particle. Proc. Natl. Acad. Sci. USA. 80:51–55. [DOI] [PMC free article] [PubMed] [Google Scholar]
- Simpson, R. T., F. Thoma, and J. M. Brubaker. 1985. Chromatin reconstituted from tandemly repeated cloned DNA fragments and core histones: a model system for study of higher order structure. Cell. 42:799–808. [DOI] [PubMed] [Google Scholar]
- Sogo, J. M., H. Stahl, T. Koller, and R. Knippers. 1986. Structure of the replicating SV40 minichromosomes: the replication fork, core histone segregation and terminal structures. J. Mol. Biol. 189:189–206. [DOI] [PubMed] [Google Scholar]
- Thiriet, C., and J. Hayes. 1998. Functionally relevant histone-DNA interactions extend beyond the classically defined nucleosome core region. J. Biol. Chem. 273:21352–21358. [DOI] [PubMed] [Google Scholar]
- Van Holde, K., and J. Zlatanova. 1999. The nucleosome core particle: does it have structural and physiologic relevance? Bioessays. 21:776–780. [DOI] [PubMed] [Google Scholar]
- Van Holde, K., J. Zlatanova, G. Arents, and E. Moudrianakis. 1995. Elements of chromatin structure: histones, nucleosomes, fibers. In Chromatin Structure and Gene Expression. S.C.R. Elgin, editor. Oxford Press, New York. 1–21.
- Van Holde, K. E. 1989. Chromatin. Springer Series in Molecular Biology. Springer-Verlag, New York.
- Widlund, H., J. Vitolo, C. Thiriet, and J. Hayes. 2000. DNA sequence-dependent contributions of core histone tails to nucleosome stability: differential effects of acetylation and proteolytic tail removal. Biochemistry. 39:3835–3841. [DOI] [PubMed] [Google Scholar]
- Wolffe, A. P., and J. J. Hayes. 1999. Chromatin disruption and modification. Nucl. Acids Res. 27:711–720. [DOI] [PMC free article] [PubMed] [Google Scholar]
- Yodh, J. G., Y. L. Lyubchenko, L. S. Shlyakhtenko, N. Woodbury, and D. Lohr. 1999. Evidence for nonrandom behavior in 208-12 subsaturated nucleosomal array populations analyzed by AFM. Biochemistry. 38:15756–15763. [DOI] [PubMed] [Google Scholar]
- Yodh, J. G., N. Woodbury, L. S. Shlyakhtenko, Y. L. Lyubchenko, and D. Lohr. 2002. Mapping nucleosome locations on the 208-12 by AFM provides clear evidence for cooperativity in array occupation. Biochemistry. 41:3565–3574. [DOI] [PubMed] [Google Scholar]