

Abstract
A peptide containing glycine at a and d positions of a heptad motif was synthesized to investigate the possibility that membrane-soluble peptides with a Gly-based, left-handed helical packing motif would associate. Based on analytical ultracentrifugation in C14-betaine detergent micelles, the peptide did associate in a monomer-dimer equilibrium, although the association constant was significantly less than that reported for the right-handed dimer of the glycophorin A transmembrane peptide in similar detergents. Fluorescence resonance energy transfer (FRET) experiments conducted on peptides labeled at their N-termini with either tetramethylrhodamine (TMR) or 7-nitrobenz-2-oxa-1,3-diazole (NBD) also indicated association. However, analysis of the FRET data using the usual assumption of complete quenching for NBD-TMR pairs in the dimer could not be quantitatively reconciled with the analytical ultracentrifugation-measured dimerization constant. This led us to develop a general treatment for the association of helices to either parallel or antiparallel structures of any aggregation state. Applying this treatment to the FRET data, constraining the dimerization constant to be within experimental uncertainty of that measured by analytical ultracentrifugation, we found the data could be well described by a monomer-dimer equilibrium with only partial quenching of the dimer, suggesting that the helices are most probably antiparallel. These results also suggest that a left-handed Gly heptad repeat motif can drive membrane helix association, but the affinity is likely to be less strong than the previously reported right-handed motif described for glycophorin A.
INTRODUCTION
The folding of membrane proteins differs from that of water-soluble proteins because the hydrophobic effect, such a strong driving force for the association of apolar peptide residues in water, does not apply in the hydrocarbon-like interior of the membrane. This raises the question of what other forces stabilize and specify the equilibrium structures of membrane proteins. Possibilities include not only those familiar in water-soluble proteins (H-bonding, ion-pairing, van der Waals interactions) but also some specific to the lipid hydrocarbon environment (reviewed in Gil et al., 1998). Experimental studies of model transmembrane peptides have shown hydrogen bonding to be a particularly important factor in the association of transmembrane helices (Choma et al., 2000; Gratkowski et al., 2001; Lear et al., 2001; Zhou et al., 2000, 2001). This is to be expected considering the more favorable free energy of formation of hydrogen bonds in non-aqueous environments (White and Wimley, 1999). Indeed, an analysis of α-helical, membrane protein crystal structures found almost all transmembrane helices to have interhelical hydrogen bonds (Adamian and Liang, 2002). There are, however, some transmembrane helices that associate by sequence motifs less clearly dependent on H-bonding. For example, the sequence LIxxGVxxGVxxT (x = any nonpolar residue) has been shown by extensive studies (Lemmon et al., 1992a,b) to drive strong dimerization of the transmembrane protein glycophorin A (GpA). Mutation of Thr, the only H-bonding side chain, to either Val (Lemmon et al., 1992a) or Ala (Fleming and Engelman, 2001) produces only a modest reduction of dimerization strength. In contrast, mutation of the second Gly (G83) residue produces a much greater reduction in dimerization (Fleming and Engelman, 2001; Lemmon et al., 1992a).
More generally, the motif GxxxG appears to be a common theme in the association of helical membrane proteins (Brosig and Langosch, 1998; Javadpour et al., 1999; Langosch et al., 1996; Russ and Engelman, 2000; Senes et al., 2000). Gly plays a different role in a membrane-like environment than in water, where it is known to be a helix breaker. It appears to allow the helices to come close together (Bowie, 1997; Javadpour et al., 1999), which permits not only favorable van der Waals interactions of surrounding side chains (Lemmon et al., 1992a; MacKenzie et al., 1997; Senes et al., 2000; Smith et al., 1994) but, also in many cases, CαH-amide carbonyl H-bond formation (Senes et al., 2001). CαH-amide carbonyl H-bonds have been shown to play a small, but significant role in stabilizing water-soluble proteins (Chamberlain and Bowie, 2002; Shi et al., 2002) and, considering their much greater strength in low dielectric environments, they can be expected to play an even greater role in membranes. Van der Waals interactions have also been shown to play an important energetic role in stabilizing water-soluble proteins (Chen and Stites, 2001). Because the surface of any protein is likely to be more extensively accessible to water than to the larger lipid hydrocarbon chains, protein-protein packing could be even more important in membranes than in water-soluble proteins (Lemmon and Engelman, 1994).
The structure of the glycophorin transmembrane peptide dimer in dodecylphosphocholine micelles (MacKenzie et al., 1997) as well as in dimyristoylphosphatidylcholine bilayers (Smith et al., 2001) shows a right-handed helix crossing angle versus the left-handed crossing of water-soluble coiled-coils such as GCN4. Left-handed crossings are also observed in the crystal structures of a variety of polytopic proteins (Senes et al., 2001); for example, that between Gly-containing transmembrane helices M5 and M7 in the crystal structure of the Ca2+-dependent ATPase of sarcoplasmic reticulum (Lee, 2002). This arrangement appears from molecular modeling studies (Adams et al., 1996; Treutlein et al., 1992; Dieckmann and DeGrado, 1997) to maximize the helix-helix interaction surface in the local vicinity of the GXXXG motif and favor CαH-amide carbonyl H-bond formation (Senes et al., 2001). Supporting the idea that the role of Gly in transmembrane helix association is to allow closer helix-helix interactions, small residues such as Ala and Ser sometimes substitute for Gly; GXXXA was identified in a genetic screening assay applied to a library of random Escherichia coli genomic DNA fragments (Leeds et al., 2001) and AXXXA along with GXXXG was found from analysis of crystal structures to be a commonly occurring helix packing motif in both water-soluble and membrane proteins (Kleiger et al., 2002).
Although Gly-containing motifs with right-handed GpA-like crossing angles have received the most attention, the original article describing the generality of this motif also documented the occurrence of an analogous left-handed motif, which is stabilized by CαH-hydrogen bonds and occurs with approximately half the frequency of the GpA motif (Senes et al., 2001). Both parallel and antiparallel left-handed motifs were observed. Sequence analysis also suggests that Gly-rich motifs might also mediate left-handed crossovers (Lemmon and Engelman, 1994). Left-handed crossing angles are found in coiled coils, which have a characteristic seven-residue structural repeat. This motif is also found in the packing of straight helices, which also show the same heptad sequence repeat for approximately two heptads before the helices diverge (Dieckmann and DeGrado, 1997). Heptad repeats containing highly conserved Gly residues occur in the class II MHC α- and β-chains, and mutation of the Gly residues disrupts the formation of heterodimers between the two chains (Cosson and Bonifacino, 1992). The sequence of the transmembrane helices from both the α- and β-chains (Fig. 1) have Gly at three consecutive a positions, with the remaining a position being filled by a small residue (Cys or Ser). Similarly, Gly residues fill several of the d positions. This heptad repeat, together with the database study of Senes et al. (2001) suggests that appropriately spaced Gly residues specify a left-handed transmembrane packing motif. To investigate the possibility that heptad repeats containing Gly might also be capable of driving transmembrane helix association, we synthesized a peptide, MS1-Gly4 containing Gly at a and d positions over two heptads (Fig. 1). To allow comparison with earlier work, this peptide is based on MS1, a membrane-soluble model peptide. The sequence of the MS1 peptide was redesigned by: 1) changing its first two heptads to introduce Gly at a and d; and 2) repacking all positions at the helix-helix interface to avoid steric overlap, maintain the overall hydrophobicity of the peptide, and simplify the chemical synthesis.
FIGURE 1.

Sequences (one-letter code; B, β-alanine) of the transmembrane segments of Glycophorin A (Fisher et al., 1999) and the MHC α- and β-chains (Cosson and Bonifacino, 1992). MS1-Gly4 is the peptide synthesized in this work and MS1 the membrane-soluble version of the GCN4 peptide synthesized previously (Choma et al., 2000).
Analytical ultracentrifugation (AUC) and fluorescence resonance energy transfer (FRET) were used to obtain quantitative data on the equilibrium association of MS1-Gly4 in C14-betaine detergent micelles. We find that this peptide's Gly motif, in C14-betaine detergent micelles, promotes dimerization with an association strength similar to that observed with the previously studied MS1 peptide, but significantly less than that of the glycophorin A transmembrane peptide (GpA) in similar (zwitterionic) detergents.
MATERIAL AND METHODS
Sequence design
An ideal 3.6 residue/turn polyalanine helix was constructed using InsightII (Biosym/MSI, San Diego, CA) and cloned with C2 symmetry for the dimer backbone and C3 symmetry for the trimer backbone. Core Gly residues were substituted at a and d positions for two heptads (Fig. 1). The structures were then minimized using the Discover package with the constant valence force field. The remaining core and interfacial residues (a, d, e, and g) were selected from a set of hydrophobic amino acids using a simulated annealing Monte Carlo algorithm (Hellinga and Richards, 1994; Summa et al., 2002). Sequences were scored for steric compatibility with the backbone using the AMBER force field (Cornell et al., 1995). The remaining positions corresponded to the sequence of the MS1 peptide.
Peptide synthesis and purification
The peptide sequence is shown in Fig. 1. Peptides were synthesized on an Applied Biosystems model 433A peptide synthesizer (Applied Biosystems, Foster City, CA). N-9-fluorenylmethyloxycarbonyl 2,4-dimethoxybenzyhydrylamine resin (Applied Biosystems) with a substitution level of 0.67 mmol/gram was used on a 0.25-mmol scale. To maintain solubility of the peptide on resin, N-methylpyrrolidinone with 25% dimethylsulfoxide was chosen as the solvent. Standard couplings were performed as described in Choma et al. (2000). Some of the difficult amino acids were double-coupled. After each coupling cycle, the peptide was capped to ensure a less extensive purification. The resin was dried under reduced pressure, and the peptides were labeled at their N-termini with NBD or 5-carboxy-tetramethylrhodamine (TMR) as described in Choma et al. (2000). The peptide was cleaved from the resin with trifluoroacetic acid (TFA) (50 mg/mL) using 5% water (v/v), and 1% triisopropylsilane (v/v) as scavengers. The reaction proceeded for 2 h at room temperature. After filtering the mixture to remove the resin, TFA was evaporated under a gentle nitrogen stream. The peptide was precipitated with equal amounts of cold ether and hexanes. After washing several times, organic solvents were removed under high vacuum.
The cleavage products were solubilized with sonication in 50% trifluorethanol and 50% HPLC buffer A (99.9% water, 0.1% TFA). Peptides were purified by reverse-phase HPLC on a C4 preparative column (Vydac, Hesperia, CA) using a linear gradient at 10 ml min−1 of buffer A and buffer B (60% isopropanol, 30% acetonitrile, 10% water, and 0.1% TFA). The peptide molecular weights were confirmed by matrix-assisted laser desorption ionization time-of-flight mass spectrometry (PerSeptive Biosystems, Framingham, MA), and purity was assessed by analytical HPLC on a C4 column with a linear gradient using buffer A and buffer B.
Analytical ultracentrifugation
Most of the AUC studies in this work were done with NBD-labeled peptides to provide greater sensitivity in measurements. Some measurements were also done with TMR-labeled peptides to check for possible interactions (see Results). Peptide stock solution concentrations were determined by measuring absorbance spectra of each peptide in ethanol solutions (NBD: ɛ458 = 21,000 M−1; TMR: ɛ549 = 95,000 M−1). Samples were prepared by mixing peptide/ethanol stock solutions with the appropriate amount of C14-betaine (N-tetradecyl-N, N-dimethyl-3-ammonio-1-propanesulfonate) detergent stock also in ethanol. Throughout the experiments, the detergent concentration remained constant at 4 mM while the peptide concentration varied to achieve different peptide/detergent ratios. The samples were dried under reduced pressure, and then dissolved in 100 mM sodium phosphate pH 7.0 containing 13% D2O to match the detergent density. The samples were centrifuged in a Beckman Optima XLI analytical ultracentrifuge at various speeds above 40 KRPM (Beckman Coulter, Fullerton, CA). After 14 h, the samples were determined (by comparison of scans at 12 and 14 h) to have reached equilibrium. Data obtained from UV measurements were analyzed by global curve fitting as described in DeGrado et al. (2003). Because of the low molecular weights of the peptides, baselines could not be determined by depleting the meniscus using higher rotor speeds. Therefore, we relied on the fact that optical density offsets, although different for each sample, should be independent of rotor speed. Thus, they were constrained in data fitting to be identical for individual samples. For the NBD-labeled peptide data reported in Table 1, three different fit quality indices were used:
Q1: The sum of squared residuals divided by the fit degrees of freedom for all data sets employed in a given fit. This quantity, called the reduced chi-squared (χ2/N) is a standard statistical measure for determining fit quality.
Q2: The ratio of the sum of squared, normalized autocorrelated residuals to the same sum applied to a random sequence.
Q3: The summed squared fractional differences between input and fit-computed component concentrations normalized to a tolerance of 0.05, a judgment of the best expected accuracy for this measure, the calculation of which is described in Arkin and Lear (2001).
Each of these indices, ideally unity, is shown for each peptide's data analysis in Table 1.
TABLE 1.
Analytical ultracentrifuge data fitting results
| Model
|
Parameters
|
Fit quality
|
||||
|---|---|---|---|---|---|---|
| n1 | n2 | pKd1 | pKd2 | Q1 | Q2 | Q3 |
| 2 | x | 3.04 ± 0.14 | x | 1.9 | 1.4 | 1.9 |
| 3 | x | 3.5 ± 0.04 | x | 1.9 | 1.5 | 7.6 |
| 4 | x | 4.8 ± 0.03 | x | 2.4 | 2.3 | 11 |
| 2 | 3 | 2.6 ± 0.3 | 4.2 ± 0.2 | 1.8 | 1.4 | 1.8 |
| 2 | 4 | 2.6 ± 0.2 | 6.3 ± 0.2 | 1.8 | 1.4 | 1.7 |
Data were weighted by the reciprocal standard error of each measurement using values reported by the Beckman XLI data system for five repetitive measurements at fixed position and wavelength. This does not take into account absorbance variations caused by window imperfections or position variations. In our experience, these added sources of error usually exceed the reported measurement error (a factor of 2 would raise the ideal Q1 from 1 to 4), so we rely more on finding a minimum Q1 than on its absolute value. Q2, which measures the randomness of the residuals, is a more robust criterion of model validity.
Fluorescence resonance energy transfer (FRET)
FRET measurements were done using mixtures of NBD-, tetramethyl rhodamine-(TMR-), and unlabeled peptides prepared at different peptide/detergent ratios in 100 mM phosphate buffer containing C14-betaine at least 5 times above its cmc (0.1 mM). The concentrations of unlabeled and fluorophore-labeled peptides were determined by the absorbance of ethanolic solutions (unlabeled: ɛ280 = 12,000 M−1) . Ethanolic solutions of the peptide plus detergent were dried under reduced pressure, then dissolved in buffer. A series of samples were prepared from two stock solutions containing a 1:3:0 and 1:0:3 of NBD-labeled, unlabeled, and TMR-labeled peptides and allowed to equilibrate overnight. Total peptide concentration and NBD-labeled peptide concentration were kept constant so that the additive concentration of unlabeled and TMR-labeled peptide is constant although their respective ratio is not constant between samples. Measurements were done in 10-mm fused silica cells using sample concentrations dilute enough to preclude significant artifacts from optical excitation of quencher fluorescence, inner filter effects, and molecular crowding (see Appendix 2). Samples were irradiated at 460 nm and emission was monitored at 525 nm using a Photon Technologies International C-720 spectrofluorimeter (Photon Technologies International, Lawrenceville, NJ). Data from experiments done at various peptide/detergent ratios were analyzed by weighted curve-fitting. Data were analyzed using a refinement of methods previously developed to study association of peptides in membranes (Li et al., 1999; London and Khorana, 1982; Veatch and Stryer, 1977). The curve-fitting function (Appendix 2) takes into account the equilibrium among multiple aggregation states, adventitious occurrences of multiple peptides in single micelles, and the possibility of both parallel and antiparallel orientations of peptides in aggregates.
RESULTS
Sedimentation equilibrium of MS1-Gly4
The degree of association of both NBD-labeled peptides was determined by analytical ultracentrifugation at various peptide/detergent ratios (1:600, 1:300, 1:225, and 1:150) and speeds (40–48 KRPM). Fig. 2 shows the data and fit for the MS1-Gly4 peptide in a monomer-dimer equilibrium. The concentration dependence of monomer and dimer species corresponding to the fitting model is shown on the bottom left panel. In the bottom right-hand panel, the total mole fraction of peptide in the centrifuge cell is compared to that predicted from the fitting parameters. The material balance, a useful check on the plausibility of the model (Arkin and Lear, 2001), supports here a monomer-dimer over a monomer-trimer model. Monomer-dimer-trimer or -tetramer models gave marginally better fits but the contribution from the trimer or tetramer species was negligible. Details of the fit results are reported in Appendix 1. The monomer-dimer model negative base-10 logarithm of Kd, pKd, of 3.04 ± 0.14 (Kd in MR units as previously determined to be appropriate for detergent-solubilized peptide systems, Fleming, 2002; Fleming et al., 2004; Lear et al., 2001) thus is an accurate reflection of the strength of association of this peptide.
FIGURE 2.
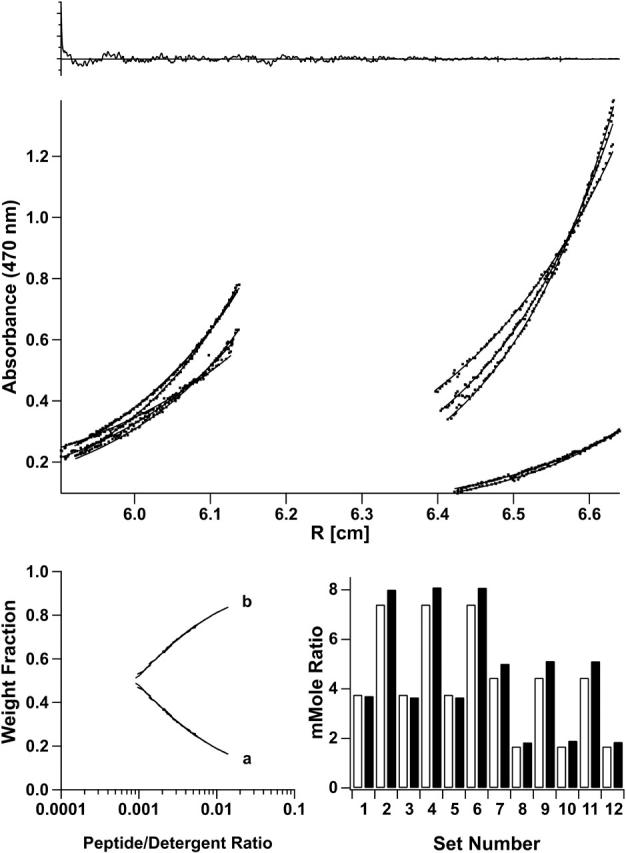
Best-fit AUC results for MS1-Gly4 as determined by the lowest mean of Q-values. In each panel, shown at the top are combined autocorrelated residuals (ordinate 0.25/division, abscissa 100 points/division) from global curve-fitting of data at 40, 45, and 48 KRPM and at different initial peptide/detergent ratios. Data points and best-fit curves for a monomer-dimer equilibrium model are in the middle. The lower right histogram shows known (open bars) and calculated (solid bars) average concentrations (mMR, millimole ratios) for each data set. The fit-calculated species fractions over the experimental peptide/detergent mole ratio range are shown in the lower-left graph.
Because we wished to compare our sedimentation results with those obtained by FRET, we felt it prudent to experimentally examine the issue of potential interactions between the N-terminal NBD and TMR groups. In our previous studies of membrane-soluble GCN4 peptides using NBD- and TMR-labeled membrane peptides (Choma et al., 2000), we obtained good agreement between AUC- and FRET-measured equilibrium constants, indicating that the fluorophores had a negligible influence on the association equilibrium. Moreover, peptides lacking H-bonding residues, but having N-terminal NBD labels showed negligible levels of association. Apparently, the presence of detergent minimizes any hydrophobic association of the fluorophores, a frequent problem in aqueous systems (Daugherty and Gellman, 1999). To ensure that this was also the case with the MS1-Gly4 peptide, AUC experiments were performed on NBD- and TMR-labeled peptides alone and in a 1:1 mixture, all at a total peptide/detergent ratio of 1:200 and the data fit to a monomer-dimer model. The pKd values corresponding to the fits shown in Fig. 3 were 3.2, 3.0, and 3.3 for NBD-, Rho-, and the 1:1 mixture of labeled peptides respectively. The insignificant differences between equilibrium constants indicates there to be no significant interaction between the two fluorophores.
FIGURE 3.

Data (points) and fits (lines) for equilibrium AUC measurements at 40, 45, and 50 KRPM for the following MS1-Gly4 peptides in 4 mM C14-betaine at 1:200 total peptide/detergent ratio: (A) NBD-labeled (ɛ475 = 84); (B) TMR-labeled (ɛ360 = 30); and (C) 1:1 molar mixture of NBD-and TMR-labeled (ɛ475 = 50 based on measured spectrum of mixture). Extinction coefficient units are (mole ratio)−1 cm−1. Fits were done using a monomer-dimer equilibrium model.
FRET of MS1-Gly4
FRET, like AUC, probes both the aggregation number (by the degree of curvature in quenching versus quencher mole ratio plots) and the tightness of association (by the dependence of quenching curves on peptide/detergent mole ratio). Thus, provided the same detergent is used, and there are no interactions between the fluorophore donor and quencher. FRET can provide an independent check on the AUC results (Choma et al., 2000). FRET, however, depends on the distance and orientation distributions of the donor and quencher molecules in the aggregate structure. With parallel coiled-coils and the NBD-TMR pair (∼40–50 Å quenching radius), the usual assumption of complete quenching in the aggregate structure appeared to hold in our previous studies of the membrane-soluble GCN4 peptides. However, we found that quenching models based on this assumption were inadequate to account for our FRET data in a manner consistent with the AUC results. Therefore, we generalized the mathematical model used to describe the FRET experiment to allow for bundles having peptides with two different possible orientations and associated degrees of quenching, thereby allowing for antiparallel orientations (see Appendix 2). Because the orientations were not known, equilibrium constants in the FRET models were constrained to be consistent with those measured by AUC and the limiting fluorescence intensities λ. This parameter is a measure of the degree of quenching across an antiparallel helical bundle. It represents the relative fluorescence observed when a single quencher and a donor are located on opposite sides of an antiparallel bundle (Appendix 2), and has the value of 1.0 if the end-to-end distance is ≤R0 or 0 if the corresponding distance is >R0. The value λ was allowed to vary in fitting to determine its optimum values for each model considered. Results (Appendix 1 and Fig. 4) show that a monomer-antiparallel dimer model with a limiting fluorescence ratio (λ) equal to 0.29 provides a more reasonable fit to the data with the fewest number of parameters.
FIGURE 4.
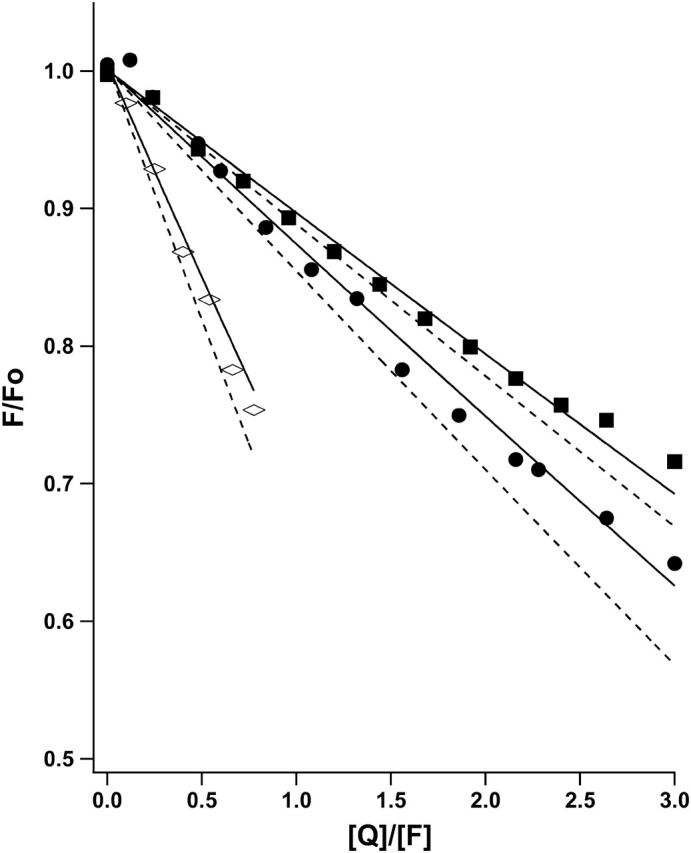
FRET results for MS1-Gly4 at peptide/detergent millimole ratio units of 6.67 (⋄), 3.33 (•), and 1.66 (▪). The lines are fits to a parallel (λ = 0, dashed) or antiparallel (λ = 0.29, solid) monomer-dimer model with pKd values constrained to the AUC-determined range of 3.04 ± 0.14.
DISCUSSION
The goals of this article were twofold. First, we wished to investigate how the Gly residues in a heptad repeat pattern affected the association of transmembrane helices. In the course of this work, we found it necessary to develop a general treatment of the equations describing FRET between fluorophores in parallel or antiparallel helices. We show here that these equations can be used in conjunction with AUC data to describe fully the association of the helices in MS1-Gly4. The FRET and AUC methods are complementary in several ways. First, by examining the association of the various fluorescently labeled peptides, it is possible to quantitatively assess the degree to which the fluorophores perturb the equilibrium. In this case, we were pleased to find virtually no interaction between the fluorophores. Furthermore, by combining FRET data together with analytical ultracentrifugation, one obtains a better determination of the final association state of the peptide, and the association constant for the complex. Finally, FRET is unique in being able to distinguish between parallel and antiparallel modes of association.
This study also investigated the possibility that membrane-soluble peptides with a Gly-based, left-handed Gly4 packing motif could show strong association due to a close and extended helix-helix interface. Gly residues were placed at the a and d positions of two heptads of a previously designed model membrane peptide. Characterization of MS1-Gly4 by equilibrium analytical ultracentrifugation showed that it associates approximately as tightly as the previously studied MS-1 peptide. In MS1 a single Asn residue is essential for inducing association. Thus, the introduction of four Gly residues (together with other conservative changes) had approximately the same effect in inducing association as a single Asn.
The association of MS1-Gly4 (Kd = 10−3 mole ratio units (MR) was, however, much weaker than that of the glycophorin TM peptide measured by FRET in zwitterionic detergents (∼5 × 10⁻⁶ MR) (Fisher et al., 1999). More recently, the dimer dissociation constant was measured for a Staphylococcal nuclease-glycophorin A transmembrane domain fusion protein in C14-betaine micelles (Fleming et al., 2004). The value determined (after converting to unit mole ratio standard state) was 5.6 × 10⁻⁵ MR, still over two orders-of-magnitude tighter than MS1-Gly4. Because MS1-Gly4 contains two GXXXG motifs embedded within the heptad repeats, it is important to ask whether the degree of association observed by in MS1-Gly4 is a result of a weak association between these motifs in a parallel right-handed motif as in glycophorin. We believe this is unlikely for two reasons: 1), the degree of quenching in the dimeric state was too low to be consistent with a parallel dimeric model and 2), the favorability of a GXXXG motif is highly dependent on the surrounding sequence, which is very suboptimal in MS1-Gly4. In GpA, the motif-defining association is L75IxxGVxxGVxxT87, and mutation at even a single one of the indicated non-Gly residues surrounding the GXXXG can decrease the affinity to the values observed here. Multiple mutations are highly destabilizing. In MS1-Gly4 these positions were intentionally changed from the residues found in GpA to avoid the possibility of having a highly favorable GXXXG motif competing with the desired left-handed motif. Clearly, a complete description of the geometry and energetics of the MS1-Gly4 dimer would require extensive mutagenesis and experimental structure determination. What is shown here is that the left-handed helix-packing motif needs to be considered as an alternative to the more ubiquitously studied right-handed motif, and most importantly, that the analytical tools are now available to thoroughly evaluate the association.
Acknowledgments
This work was supported by National Institutes of Health grant GM60610.
APPENDIX 1
The pKd values and fit quality parameter values (see Methods) were determined by curve-fitting of AUC and FRET data using different monomer-n1, n2-mer association models. The x-values in Table 2 denote nonconsideration of the second equilibrium. FRET data were fit with pKd values constrained within the limits defined by the AUC data fitting results. The value λt is the fluorescence intensity ratio in the limit of infinite quencher/fluorophore ratio in an ni-mer (see Table 2, and Appendix 2, below).
TABLE 2.
FRET data fitting results
| Model
|
Model
|
Fit results
|
|||
|---|---|---|---|---|---|
| n1 | λ1 | n2 | λ2 | pKd1 | pKd2 |
| 2 | 0.29 | x | x | 2.9 | x |
| 2 | 0.27 | 3 | 0 | 2.7 | 4.4 |
| 2 | 0.25 | 4 | 0 | 2.7 | 6.8 |
APPENDIX 2
Mathematical analysis of fluorescence quenching
We explicitly consider the distribution of all three species of peptide (unlabeled, fluorescent-, and quencher-labeled), in different equilibrium aggregation states, using elementary probability statistics combined with solution equilibrium relationships. The equation used to fit FRET data was derived by considering, with fluorophores, quenchers, and unlabeled peptides of mole fractions F, Q, and U = T-F-Q, the probabilities of finding a fluorophore in a micelle with either no quencher or with quenchers sufficiently distant from the fluorophore such that the fluorescence is only partially quenched. For example, in a parallel trimer, the fluorescence will be that due to fluorophores in trimers having a fluorophore and no quencher present (F*(1–Q)2). In an antiparallel trimer, the fluorescence will be the sum of that from trimers having no quencher present (as calculated for the parallel case) plus l times that from trimers having all quenchers at an orientation opposite that of the fluorophore where l is the fraction of fluorescence unquenched in the antiparallel orientation, a function of the ratio of the fluorophore-quencher distance to the Förster quenching radius. With the NBD-TMR pair used in this work (R0 ∼50 Å), we assume full quenching in the parallel orientation and take l to be an empirically determined constant parameter.
The following analysis was used to determine the dependence of fluorescence intensity on quencher mole fraction in an antiparallel helical bundle with a given aggregation state.
Antiparallel dimer
In an antiparallel dimeric bundle, there is one N-terminal end on each side of the bundle (which can be labeled with a fluorophore, quencher, or be unlabeled, designated F, Q, and U, respectively). The two sides are equivalent, so we arbitrarily designate one as the cis side, and the other side as the trans side. We assume a quencher on the opposite side of the bundle might totally or partially quench a fluorophore, because the distance between the ends is near R0 for the donor/acceptor pair used in this work. We define the following variables as f, fraction of peptides bearing a fluorophore, F; q, fraction of peptides bearing a fluorophore, Q; u, fraction of peptides bearing a fluorophore, U; and λ, fraction of signal for partial quenching by trans quencher (0 〈 λ 〉 1).
Now, we enumerate the 32 possible states of the system (see Table 3).
TABLE 3.
Anti-parallel dimer
| cis | trans | Prob. | Cont. to signal |
|---|---|---|---|
| F | F | f2 | 2f2 |
| F | Q | fq | λfq |
| F | U | fu | fu |
| Q | F | fq | λfq |
| Q | Q | q2 | none |
| Q | U | qu | none |
| U | F | fu | fu |
| U | Q | uq | none |
| U | U | u2 | none |
The species that give rise to the signal can be summed to give
 |
(1) |
In an antiparallel trimeric bundle, there are two N-terminal ends on one side of the bundle and one at the opposite end. We define the side with two N-termini as the cis side, and the other side as the trans side. We also assume that a single quencher will completely quench the fluorescence of a fluorophore if it is on the same side of the bundle, because this would be well within the R0 for this quencher pair. As in the antiparallel dimer we assume a quencher on the opposite side of the bundle might partially quench a fluorophore, because these are near R0 for this pair. We also assume arbitrarily that the attenuation of a trans fluorophore's fluorescence due to two cis quenchers is λ2. We can now enumerate the 33 states (see Table 4),
 |
(2) |
TABLE 4.
Anti-parallel trimer
| cis | trans | Prob. | Cont. to signal |
|---|---|---|---|
| FF | F | f3 | 3f3 |
| FF | Q |  |
 |
| FF | U |  |
 |
| FQ | F |  |
 |
| FQ | Q |  |
none |
| FQ | U | fqu | none |
| FU | F |  |
 |
| FU | Q | fqu | λfqu |
| FU | U |  |
 |
| QF | F |  |
 |
| QF | Q |  |
none |
| QF | U | fqu | none |
| F |  |
 |
|
| Q | q3 | none | |
| U |  |
none | |
| QU | F | fqu | λfqu |
| QU | Q |  |
none |
| QU | U |  |
none |
| UF | F |  |
 |
| UF | Q | fqu | λfqu |
| UF | U |  |
 |
| UQ | F | fqu | λfqu |
| UQ | Q |  |
none |
| UQ | U |  |
none |
| UU | F |  |
 |
| UU | Q |  |
none |
| UU | U | u3 | none |
General treatment of an odd-numbered antiparallel bundle
Consider a more general case for an antiparallel bundle with an odd number of helices with aggregation state = m. On one side of the bundle there will be x = (m + 1)/2 helices (cis side) and on the opposite side there will be y = (m − 1)/2 helices (trans side).
Contribution to signal from cis side
Without considering attenuation from trans quenching, the signal from the cis side is signal(cis) ∼ ΣnfNff(nf)(ux–nf), in which the summation is over the number of fluorophores on the cis side and is taken from nf = 1 to x, where x = (m + 1)/2. The first term provides the number of fluorophores in the bundle, and hence is required to account for the fact that the signal for a given state will scale with the number of fluorophores. The second term Nf is x on nf (i.e., x!/[(x – nf )!nf!]), the number of ways to arrange n F values and x – n U values in x slots.
Inclusion of trans quenching gives signal(cis)  in which the second summation is evaluated from iq = 0 to iq – y = (m − 1)/2, and Mq is y on iq (y!/[(y – iq)!iq!]).
Contribution to signal from trans side
Without considering attenuation from trans quenching, the signal from the trans side is signal(trans) ∼ ΣifMffifu(y–if) in which the summation is from if = 1 to y, where y = (m − 1)/2. The first term provides the number of fluorophores in the bundle, and is required to account for the fact that the signal for a given state will scale with the number of fluorophores. The second term Mf is y on if(y!/[(y – if)!if!]). Inclusion of trans quenching gives signal(trans)  in which the second summation is evaluated from nq = 0 to x = (m + 1)/2, and Nq is x on n (i.e., x!/[(x – nq)!nq!]).
Total signal
The total signal is obtained from the sum of the trans and the cis sides:
 |
(3) |
Evaluating this equation for a trimer, and recalling that (1–q) = f + u,


The summation of which gives the same result as in the full enumeration method described above (see Eq. 2), is signal Equation 3 can also be used to treat an even numbered, but asymmetrical bundle by simply redefining x to be the number of helices on the cis side and y the (smaller) number on the trans side. For example, the equation for antisymmetric antiparallel tetramers (x = 3,y = 1) is
The even-numbered, symmetric antiparallel, helical bundle
This case is much simpler, because the two sides of the bundle are equivalent. Therefore, without considering attenuation from trans quenching, the signal is signal ∼ 2ΣnfOff(nf)(uz–nf) in which the summation is over the number of fluorophores on one side and is taken from nf = 1 to z, where z = m/2. The first term provides the number of fluorophores in the bundle, and hence is required to account for the fact that the signal for a given state will scale with the number of fluorophores. The second term Of is z on nf (i.e., z!/[(z – nf)!nf!]), the number of ways to arrange nf F-values and (z – nf) U-values in z slots.
Inclusion of trans quenching gives signal ∼ {2ΣnfOff(nf)(uz–nf)} {Σ Oq(1−q)(z–nq)(λq)nq}, in which the second summation is evaluated from nq = 0 to x = (m)/2, and Oq is x on nq (i.e., x!/[(x – nq)!nq!]).
Checking this out for the antiparallel dimer case we have 2Σf{Σ(1 − q)(1–nq)(λq)nq} signal ∼ 2Σf{Σ(1 − q)(1–nq)(λq)nq}:


which is the same as Eq. 1.
For symmetric antiparallel tetramers (z = 2), a similar calculation gives signal ∼ 2{f2 + 2fu + [(4λ – 1)fu + (2λ – 1)f2]q + (l2 – 2λ + 1)f2 + (2λl2 – 4λ + 2)fu]}q2.
For data fitting, the distribution of n-mers is computed from the equilibrium relationship using the dissociation constant as a fitting variable. The fluorescence signal is calculated from the summed contributions of monomers and n-mers. It is desirable in experiments such as these to consider quenching related to chance occurrences of monomeric quenchers and fluorophores in a single micelle (“molecular crowding”). This effect, expected to become increasingly important at high peptide/detergent ratios, has been analyzed in great detail (Wolber and Hudson, 1979) for vesicular systems where peptides are confined within the vesicle bilayer and diffuse within a well-defined area. As with lipid bilayers, excitation of a fluorophore that happens to have a quencher in the same micelle will lead to quenching. In the absence of peptide, the average number of particles per detergent micelle, c, can be computed from the micelle number times the ratio of the sum of molar concentrations of monomers and n-mers to the molar concentration of detergent. If we make the simplifying assumption that the peptide particles are randomly distributed in micelles of constant detergent number, we can estimate the distribution of particles/micelle using Poisson statistics. We then sum fluorescence contributions from micelles containing up to six particles and require for simplicity that fluorescence from micelles containing more than one particle be free of quencher. This slightly overestimates the “adventitious quenching” by not counting fluorescence from micelles containing multiple particles with all quenchers oriented antiparallel to all fluorophores. The magnitude of the adventitious quenching correction depends on the micelle number. It seems reasonable to assume that the micelle number is the same as that observed in pure detergent, but it is equally reasonable to assume that each peptide species binds only sufficient detergent to solvate its hydrophobic side chains, in effect substituting for detergents which would otherwise be in the micelle. Since lower micelle numbers give smaller correction terms, we have done all our fluorescence experiments under conditions where the results depend only minimally on assumed micelle number and used the higher number in data analysis, checking the assumption by alternatively fitting with lower micelle numbers.
References
- Adamian, L., and J. Liang. 2002. Interhelical hydrogen bonds and spatial motifs in membrane proteins: polar clamps and serine zippers. Proteins. 47:209–218. [DOI] [PubMed] [Google Scholar]
- Adams, P. D., D. M. Engelman, and A. T. Brünger. 1996. Improved prediction for the structure of the dimeric transmembrane domain of glycophorin obtained through global searching. Proteins. 26:257–261. [DOI] [PubMed] [Google Scholar]
- Arkin, M., and J. D. Lear. 2001. A new data analysis method to determine binding constants of small molecules to proteins using equilibrium analytical ultracentrifugation with absorption optics. Anal. Biochem. 299:98–107 (See Erratum, ibid, 304, 275). [DOI] [PubMed] [Google Scholar]
- Bowie, J. U. 1997. Helix packing in membrane proteins. J. Mol. Biol. 272:780–789. [DOI] [PubMed] [Google Scholar]
- Brosig, B., and D. Langosch. 1998. The dimerization motif of the glycophorin A transmembrane segment in membranes: importance of glycine residues. Protein Sci. 7:1052–1056. [DOI] [PMC free article] [PubMed] [Google Scholar]
- Chamberlain, A., and J. Bowie. 2002. Evaluation of C-H·O hydrogen bonds in native and misfolded proteins. J. Mol. Biol. 322:497–503. [DOI] [PubMed] [Google Scholar]
- Chen, J., and W. E. Stites. 2001. Packing is a key selection factor in the evolution of protein hydrophobic cores. Biochemistry. 40:15280–15289. [DOI] [PubMed] [Google Scholar]
- Choma, C., H. Gratkowski, J. D. Lear, and W. F. DeGrado. 2000. Asparagine-mediated self-association of a model transmembrane helix. Nat. Struct. Biol. 7:161–166. [DOI] [PubMed] [Google Scholar]
- Cornell, W., P. Cieplak, C. Bayly, I. Gould, K. Merz, D. Ferguson, D. Spellmeyer, T. Fox, J. Caldwell, and P. Kollman. 1995. A second generation force field for the simulation of proteins, nucleic acids, and organic molecules. J. Am. Chem. Soc. 117:5179–5197. [Google Scholar]
- Cosson, P., and J. S. Bonifacino. 1992. Role of transmembrane domain interactions in the assembly of class II MHC molecules. Science. 258:659–662. [DOI] [PubMed] [Google Scholar]
- Daugherty, D. L., and S. H. Gellman. 1999. A fluorescence assay for leucine zipper dimerization: avoiding unintended consequences of fluorophore attachment. J. Am. Chem. Soc. 121:4325–4333. [Google Scholar]
- DeGrado, W. F., H. Gratkowski, and J. D. Lear. 2003. How do helix-helix interactions help determine the folds of membrane proteins? Perspectives from the study of homo-oligomeric helical bundles. Protein Sci. 12:647–665. [DOI] [PMC free article] [PubMed] [Google Scholar]
- Dieckmann, G. R., and W. F. DeGrado. 1997. Modeling transmembrane helical oligomers. Curr. Opin. Struct. Biol. 7:486–494. [DOI] [PubMed] [Google Scholar]
- Fisher, L. E., D. M. Engelman, and J. N. Sturgis. 1999. Detergents modulate dimerization, but not helicity, of the glycophorin A transmembrane domain. J. Mol. Biol. 293:639–651. [DOI] [PubMed] [Google Scholar]
- Fleming, K. G. 2002. Standardizing the free energy change of transmembrane helix-helix interactions. J. Mol. Biol. 323:563–571. [DOI] [PubMed] [Google Scholar]
- Fleming, K. G., and D. M. Engelman. 2001. Specificity in transmembrane helix-helix interactions can define a hierarchy of stability for sequence variants. Proc. Natl. Acad. Sci. USA. 98:14340–14344. [DOI] [PMC free article] [PubMed] [Google Scholar]
- Fleming, K. G., C. C. Ren, A. K. Doura, M. E. Eisley, F. J. Kobus, and A. M. Stanley. 2004. Thermodynamics of glycophorin A transmembrane helix dimerization in C14 betaine micelles. Biophys. Chem. 108:43–49. [DOI] [PubMed] [Google Scholar]
- Gil, T., J. H. Ipsen, O. G. Mouritsen, M. C. Sabra, M. M. Sperotto, and M. J. Zuckermann. 1998. Theoretical analysis of protein organization in lipid membranes. Biochim. Biophys. Acta. 1376:245–266. [DOI] [PubMed] [Google Scholar]
- Gratkowski, H., J. D. Lear, and W. F. DeGrado. 2001. Polar side chains drive the association of model transmembrane peptides. Proc. Natl. Acad. Sci. USA. 98:880–885. [DOI] [PMC free article] [PubMed] [Google Scholar]
- Hellinga, H. W., and F. M. Richards. 1994. Optimal sequence selection in proteins of known structure by simulated evolution. Proc. Natl. Acad. Sci. USA. 91:5803–5807. [DOI] [PMC free article] [PubMed] [Google Scholar]
- Javadpour, M. M., M. Eilers, M. Groesbeek, and S. O. Smith. 1999. Helix packing in polytopic membrane proteins: role of glycine in transmembrane helix association. Biophys. J. 77:1609–1618. [DOI] [PMC free article] [PubMed] [Google Scholar]
- Kleiger, G., R. Grothe, P. Mallick, and D. Eisenberg. 2002. GXXXG and AXXXA: common α-helical interaction motifs in proteins, particularly in extremophiles. Biochemistry. 41:5990–5997. [DOI] [PubMed] [Google Scholar]
- Langosch, D., B. Brosig, H. Kolmar, and H. J. Fritz. 1996. Dimerisation of the glycophorin A transmembrane segment in membranes probed with the ToxR transcription activator. J. Mol. Biol. 263:525–530. [DOI] [PubMed] [Google Scholar]
- Lear, J. D., H. Gratkowski, and W. F. DeGrado. 2001. De novo design, synthesis and characterization of membrane-active peptides. Biochem. Soc. Trans. 29:559–564. [DOI] [PubMed] [Google Scholar]
- Lee, A. G. 2002. Ca2+-ATPase structure in the E1 and E2 conformations: mechanism, helix-helix and helix-lipid interactions. Biochim. Biophys. Acta. 1565:246–266. [DOI] [PubMed] [Google Scholar]
- Leeds, J. A., D. Boyd, D. R. Huber, G. K. Sonoda, H. T. Luu, D. M. Engelman, and J. Beckwith. 2001. Genetic selection for and molecular dynamic modeling of a protein transmembrane domain multimerization motif from a random Escherichia coli genomic library. J. Mol. Biol. 313:181–195. [DOI] [PubMed] [Google Scholar]
- Lemmon, M. A., and D. M. Engelman. 1994. Specificity and promiscuity in membrane helix interactions. Q. Rev. Biophys. 27:157–218. [DOI] [PubMed] [Google Scholar]
- Lemmon, M. A., J. M. Flanagan, J. F. Hunt, B. D. Adair, B. J. Bormann, C. E. Dempsey, and D. M. Engelman. 1992a. Glycophorin A dimerization is driven by specific interactions between transmembrane α-helices. J. Biol. Chem. 267:7683–7689. [PubMed] [Google Scholar]
- Lemmon, M. A., J. M. Flanagan, H. R. Treutlein, J. Zhang, and D. M. Engelman. 1992b. Sequence specificity in the dimerization of transmembrane α-helices. Biochemistry. 31:12719–12725. [DOI] [PubMed] [Google Scholar]
- Li, M., L. G. Reddy, R. Bennett, N. D. Silva, Jr., L. R. Jones, and D. D. Thomas. 1999. A fluorescence energy transfer method for analyzing protein oligomeric structure: application to phospholamban. Biophys. J. 76:2587–2599. [DOI] [PMC free article] [PubMed] [Google Scholar]
- London, E., and H. G. Khorana. 1982. Denaturation and renaturation of bacteriorhodopsin. J. Biol. Chem. 257:7003–7011. [PubMed] [Google Scholar]
- MacKenzie, K. R., J. H. Prestegard, and D. M. Engelman. 1997. A transmembrane helix dimer: structure and implications. Science. 276:131–133. [DOI] [PubMed] [Google Scholar]
- Russ, W. P., and D. M. Engelman. 2000. The GxxxG motif: a framework for transmembrane helix-helix association. J. Mol. Biol. 296:911–919. [DOI] [PubMed] [Google Scholar]
- Senes, A., M. Gerstein, and D. M. Engelman. 2000. Statistical analysis of amino acid patterns in transmembrane helices: the GxxxG motif occurs frequently and in association with β-branched residues at neighboring positions. J. Mol. Biol. 296:921–936. [DOI] [PubMed] [Google Scholar]
- Senes, A., I. Ubarretxena-Belandia, and D. M. Engelman. 2001. The Cα-H·O hydrogen bond: a determinant of stability and specificity in transmembrane helix interactions. Proc. Natl. Acad. Sci. USA. 98:9056–9061. [DOI] [PMC free article] [PubMed] [Google Scholar]
- Shi, Z., C. A. Olson, A. J. Bell, and N. R. Kallenbach. 2002. Non-classical helix-stabilizing interactions: C-H·O H-bonding between Phe and Glu side chains in α-helical peptides. Biophys. Chem. 101–102:267–279. [DOI] [PubMed] [Google Scholar]
- Smith, S. O., R. Jonas, M. Braiman, and B. J. Bormann. 1994. Structure and orientation of the transmembrane domain of glycophorin A in lipid bilayers. Biochemistry. 33:6334–6341. [DOI] [PubMed] [Google Scholar]
- Smith, S. O., D. Song, S. Shekar, M. Groesbeek, M. Ziliox, and S. Aimoto. 2001. Structure of the transmembrane dimer interface of glycophorin A in membrane bilayers. Biochemistry. 40:6553–6558. [DOI] [PubMed] [Google Scholar]
- Summa, C. M., M. M. Rosenblatt, J. K. Hong, J. D. Lear, and W. F. DeGrado. 2002. Computational de novo design, and characterization of an A2B2 diiron protein. J. Mol. Biol. 321:923–938. [DOI] [PubMed] [Google Scholar]
- Treutlein, H. R., M. A. Lemmon, D. M. Engelman, and A. T. Brunger. 1992. The glycophorin A transmembrane domain dimer: sequence-specific propensity for a right-handed supercoil of helices. Biochemistry. 31:12726–12733. [DOI] [PubMed] [Google Scholar]
- Veatch, W., and L. Stryer. 1977. The dimeric nature of the gramicidin A transmembrane channel: conductance and fluorescence energy transfer studies of hybrid channels. J. Mol. Biol. 113:89–102. [DOI] [PubMed] [Google Scholar]
- White, S. H., and W. C. Wimley. 1999. Membrane protein folding and stability: physical principles. Annu. Rev. Biophys. Biomol. Struct. 28:319–365. [DOI] [PubMed] [Google Scholar]
- Wolber, P. K., and B. S. Hudson. 1979. An analytic solution to the Förster energy transfer problem in two dimensions. Biophys. J. 28:197–210. [DOI] [PMC free article] [PubMed] [Google Scholar]
- Zhou, F. X., M. J. Cocco, W. P. Russ, A. T. Brunger, and D. M. Engelman. 2000. Interhelical hydrogen bonding drives strong interactions in membrane proteins. Nat. Struct. Biol. 7:154–160. [DOI] [PubMed] [Google Scholar]
- Zhou, F. X., H. J. Merianos, A. T. Brunger, and D. M. Engelman. 2001. Polar residues drive association of polyleucine transmembrane helices. Proc. Natl. Acad. Sci. USA. 98:2250–2255. [DOI] [PMC free article] [PubMed] [Google Scholar]