

Abstract
We measured the frequency of side-chain rotamers in 14 α-helical and 16 β-barrel membrane protein structures and found that the membrane environment considerably perturbs the rotamer frequencies compared to soluble proteins. Although there are limited experimental data, we found statistically significant changes in rotamer preferences depending on the residue environment. Rotamer distributions were influenced by whether the residues were lipid or protein facing, and whether the residues were found near the N- or C-terminus. Hydrogen-bonding interactions with the helical backbone perturbs the rotamer populations of Ser and His. Trp and Tyr favor side-chain conformations that allow their side chains to extend their polar atoms out of the membrane core, thereby aligning the side-chain polarity gradient with the polarity gradient of the membrane. Our results demonstrate how the membrane environment influences protein structures, providing information that will be useful in the structure prediction and design of transmembrane proteins.
INTRODUCTION
Integral membrane proteins represent ∼25% of an average proteome (Wallin and von Heijne, 1998) and control many vital aspects of cellular metabolism. They act as receptors, transporters, pores, and enzymes, and are involved in fundamental cellular processes such as respiration, photosynthesis, cell trafficking, and signaling. The G-protein coupled receptor (GPCR) family alone is the target of 50% of recently released drugs and 25 of the top 100 best-selling drugs (Klabunde and Hessler, 2002). Despite their obvious importance, we know the detailed structure of only one GPCR (Palczewski et al., 2000) and a total of just over 30 unique transmembrane protein structures.
Computational prediction of transmembrane (TM) proteins could help to rapidly expand our structural information. Although a difficult challenge, predicting membrane protein structures may be simpler than predicting soluble protein structures because the membrane limits the possible TM structures. For example, the increased strength of hydrogen bonds favors helical and β-barrel secondary structures within the bilayer (White and Wimley, 1999). The structure prediction efforts, however, would be aided from a better understanding of the interactions between the protein and the membrane.
Computational studies of soluble proteins have benefited greatly by the identification and classification of side-chain rotamer preferences (Dunbrack and Cohen, 1997; Lovell et al., 2000; Dunbrack, 2002). The observed side-chain dihedral angles cluster around ideal values, such as the −60°, +60°, and 180° dihedral angles expected between two sp3 hybridized atoms (Fig. 1). A rotamer is a set of these ideal dihedral angles that describes the side-chain position, assuming the bond length and angles vary minimally. Libraries of rotamers describe the frequency of each rotamer and may vary depending on the local secondary structure or φ/ψ-angles.
FIGURE 1.

The three favored χ1 angles in proteins. The −60°, +60°, and 180° angles are often referred to as gauche minus (g−), gauche plus (g+), and trans (t), respectively. We refer to a rotamer by the amino acid name followed by the χ-angles in the center of the rotamer bins, e.g., Leu(−60,180).
Unlike soluble proteins, membrane proteins are influenced by different environments at different bilayer depths. Among the properties that change across the membrane are the electrostatic potential, pressure, pH, and dielectric constant (Popot and Engelman, 2000). The varying dielectric constant creates a polarity gradient pointing out of the membrane on both sides. The changes in these properties across the membrane result in a bias for certain amino acids to be located in different parts of the helices or strands (Landolt-Marticorena et al., 1993; Andersson and von Heijne, 1994; Wimley and White, 1996; Arkin and Brunger, 1998; Seshadri et al., 1998; Ulmschneider and Sansom, 2001; Chamberlain et al., 2004; Chamberlain and Bowie, 2004).
Rotamer preferences in membrane proteins may vary from those in soluble proteins, because of the different environments found in the bilayer. For example, polar side chains tend to “snorkel” their polar atoms out of the membrane and toward the aqueous regions in both amphipathic and transmembrane helices (Tanford and Reynolds, 1976; Segrest et al., 1992; Mishra et al., 1994; Wimley and White, 1996; Shrivastava et al., 2000; Strandberg et al., 2002; Chamberlain et al., 2004). In addition, weak interactions like C-H⋯O hydrogen bonds may be important in the low dielectric medium (Tanford and Reynolds, 1976; Burley and Petsko, 1988; Derewenda et al., 1995; Fabiola et al., 1997; Chakrabarti and Chakrabarti, 1998; Senes et al., 2001; Chamberlain and Bowie, 2002).
We have analyzed the side-chain rotamers of the available α-helical and β-barrel membrane protein structures. For many amino acids, the rotamer frequencies in TM proteins differ significantly from the frequencies found in water-soluble proteins. Furthermore, the rotamer populations of TM amino acids differ depending on the location of the amino acid in the membrane. For some amino acids, the residues located on the N- or C-terminal sides of the membrane have different rotamer distributions as do lipid-facing and protein-facing residues. These differences reflect the various environments the membrane presents to the amino acid side chains.
MATERIALS AND METHODS
Selection of transmembrane residues
We selected nonhomologous membrane proteins and their TM residues as in our previous work (Chamberlain et al., 2004; Chamberlain and Bowie, 2004). From a list of known membrane protein structures from the Max Planck Institute (www.mpibp-frankfurt.mpg.de/michel/public/memprotstruct.html), we began with crystal structures with a resolution of 3.0 Å or better. We discarded structures until each pair had <30% sequence identity, leaving the following PDB codes: 1), helical structures, 1C3W, 1EHK, 1EUL, 1EYS, 1FX8, 1H2S, 1J4N, 1JB0, 1KQF, 1KZU, 1L9H, 1QLA, and 2OCC; and 2), sheet structures, 1A0S, 1E54, 1EK9, 1FEP, 1I78, 1K24, 1KMO, 1PHO, 1PRN, 1QD6, 1QJ8, 1QJP, 2FCP, 2MPR, 2POR, and 7AHL.
The transmembrane residues of each protein were identified as those contained within a 30-Å-thick slab, representing the membrane. The slab is orientated with its normal vector parallel to an average vector of the helix axes or β-strand vectors. The slab is positioned to maximize the average hydrophobicity (Fauchere and Pliska, 1983) of the residues within it. Each helix axis was defined by a set of axis points, one per Cα atom. The position of an axis point, i, was calculated from a weighted average of the Cα atom positions of the i − 1, i, and i + 1 residues assuming 100° helical rotation per residue. The difference vector between the fifth and 15th axis points of each helix represents the helix axis. The strand axis was simply taken as the difference vector between the second and eighth Cα atoms in each strand.
Separation of TM residues by position
After identifying the TM residues as those contained in the 30-Å-thick slab, we divided the residues into different categories. We divided the membrane into two 15-Å-thick slabs and assigned the residues to either the N-terminal or C-terminal regions of the membrane. We also classified each residue as inward facing or exposed to lipids. Helical residues were considered buried if >75% of their surface area was buried as judged by the program ENVIRONMENTS (Bowie et al., 1991), using a probe radius of 1.4 Å. In β-barrel proteins, a residue was considered lipid facing if its Cα atom was closer than its Cβ atom to the center of mass of the TM barrel. We used the Hα2 atom in place of the Cβ atom for glycine.
Rotamer measurements
Side-chain dihedral angles were calculated with the program, InsightII (Molecular Simulations, San Diego, CA). We separated the residues into rotamers according to the scheme of Dunbrack (Dunbrack and Cohen, 1997), www.fccc.edu/research/labs/dunbrack/bbdep.html. The side-chain atoms of Gln, Asn, and His were corrected using REDUCE (Lovell et al., 1999; Word et al., 1999). Our observed rotamer counts in TM proteins were compared to the number of counts expected given the rotamer frequencies of water-soluble proteins, using the soluble-protein, rotamer libraries of Dunbrack with φ/ψ-angles of −60°/−40° (helices) and −130°/140° (sheets). These rotamer libraries are subdivided by the backbone φ/ψ-angles in 10° increments. Because of the limited data set, we have included a broader range of φ/ψ-angles. We accepted rotamers with φ/ψ-angles within 20° of −62°/−40° for helices and within 30° of −135°/−140° of sheets. Using broader φ/ψ-values may result in broader distributions of rotamers, so we have avoided interpreting rotamer distributions that may be influenced in this manner. We also present the results obtained with φ/ψ-angles within 10° of the ideal values. These results are in the “Total 10” columns of Tables 2 and 5.
TABLE 2.
Ser and Thr rotamers in TM helices
| AA | Rot | χ1 | Soluble % | Total (%) | Total (%) | In (%) | Out (%) |
|---|---|---|---|---|---|---|---|
| Ser | 1 | −60 | 42.9 | 65 (55) | 45 (60) | 39 (47) | 26 (74) |
| 2 | +60 | 30.2 | 34 (29) | 17 (23) | 28 (33) | 6 (17) | |
| 3 | 180 | 26.9 | 19 (16) | 13 (17) | 16 (19) | 3 (9) | |
| Total | 118 | 75 | 83 | 35 | |||
| Thr | 1 | −60 | 87.6 | 108 (78) | 77 (83) | 73 (75) | 35 (83) |
| 2 | +60 | 11.5 | 28 (20) | 16 (17) | 23 (24) | 5 (12) | |
| 3 | 180 | 0.8 | 3 (2) | 0 (0) | 1 (1) | 2 (5) | |
| Total | 139 | 93 | 97 | 42 |
TABLE 5.
Met rotamers in TM helices
|
χ
|
Soluble % | Total (%) | Total 10 (%) | % Area Buried | ||||
|---|---|---|---|---|---|---|---|---|
| AA | Rot | 1 | 2 | 3 | ||||
| Met | 1 | −60 | −60 | −60 | 19.7 | 17 (13) | 13 (14) | 15 |
| 2 | −60 | 180 | +60 | 19.5 | 20 (16) | 13 (14) | 15 | |
| 3 | −60 | 180 | −60 | 11.3 | 14 (11) | 10 (11) | 24 | |
| 4 | −60 | 180 | 180 | 10.0 | 11 (9) | 11 (12) | 16 | |
| 5 | 180 | +60 | +60 | 8.8 | 6 (5) | 4 (4) | 13 | |
| 6 | 180 | 180 | +60 | 8.0 | 18 (14) | 14 (15) | 16 | |
| 7 | 180 | 180 | −60 | 7.2 | 5 (4) | 4 (4) | 12 | |
| 8 | −60 | −60 | +60 | 3.2 | 12 (10) | 6 (6) | 25 | |
| 9 | 180 | 180 | 180 | 2.8 | 1 (1) | 1 (1) | 7 | |
| 10 | 180 | −60 | −60 | 2.4 | 4 (3) | 4 (4) | 21 | |
| 11 | 180 | +60 | 180 | 2.1 | 3 (2) | 2 (2) | 11 | |
| 12 | −60 | −60 | 180 | 2.0 | 9 (7) | 8 (9) | 17 | |
| 13 | 180 | +60 | −60 | 1.4 | 4 (3) | 2 (2) | 19 | |
| 16 | −60 | +60 | +60 | 0.2 | 1 (1) | 1 (1) | 41 | |
| 21 | 180 | −60 | +60 | 0.0 | 1 (1) | 1 (1) | 34 | |
| Total | 126 | 94 | ||||||
To compare two different rotamer distributions, we used a χ2-test. We added one pseudocount to each observed and expected rotamer bin. This addition insures that the χ2-values were not inflated by observing one rotamer when the expected number of counts of that rotamer was much less than one. This addition had the effect of underestimating the significance of the difference between two distributions with few counts, but does not appreciably affect calculations with the more populous amino acids. We also used the χ2-test to assess the difference between two rotamer distributions from different regions in the membrane.
Rotamer side-chain placement
For side-chain distance and surface area measurements, we mutated a residue to each of the 20 amino acids and placed the side chains in each of their rotamers using the average χ-angles observed in soluble proteins and an in-house program. For helices, we created an ideal poly-alanine helix with all φ/ψ-angles equal to −65°/−40° and mutated an internal site. For β-sheets, we started with a known β-barrel protein, mutated every residue to alanine and chose an inward-facing or lipid-facing position. We measured the distance from the Cβ atom to a potential snorkeling atom in the side chain. We defined the snorkeling atoms to be Cδ1 and Cδ2 (Leu), none (Ala), Cζ (Phe), Cγ1 and Cγ2 (Val), Cδ (Ile), none (Gly), Oγ (Thr and Ser), Sδ (Met), Nɛ (Trp), Oη (Tyr), Nδ and Nɛ (His), none (Pro), Oδ and Nδ (Asn), Oɛ1 and Oɛ2 (Glu), Oɛ and Nɛ (Gln), Sγ (Cys), Nɛ, Nη1 and Nη2 (Arg), Nζ (Lys), and Oδ1 and Oδ2 (Asp). If more than one atom is listed for each amino acid, we used the average coordinates for all listed atoms. Distance and buried surface area measurements in sheets were done by averaging the results from eight buried or eight exposed sites. The inward-facing positions (buried) were residues 207, 242, 260, and 291 in 1E54 and 12, 52, 80, and 167 in 1QJP. The outward-facing positions (exposed) were residues 223, 274, 292, and 324 in 1E54 and 81, 95, 139, and 164 in 1QJP.
RESULTS
In the following sections, we describe the amino acid rotamer distributions as we observed them in TM helices and sheets and compare them to the distributions for soluble proteins as reported by Dunbrack and co-workers (Dunbrack and Cohen, 1997). Due to the low number of TM rotamers available, we have used a χ2-analysis to find statistically significant differences between two rotamer distributions. We then discuss the origins of the differences by considering the extension of the side chains toward one side of the membrane, strong and weak hydrogen bonding, side-chain burial, and the location of the residues. We distinguished residues in the N- or C-terminal half of the membrane, as well as inward- and outward-facing residues. Inward-facing residues in helical proteins contact more protein, whereas those in β-barrels contact water or protein segments. Comparing the rotamer distributions at buried and surface residues helps to identify the influences of the membrane environment. Similarly, comparing the distributions in the N- and C-terminal halves of the membrane illuminates the effects of flipping the membrane polarity gradient.
Helical rotamers: tryptophan and tyrosine
The rotamer distributions of Trp and Tyr are different in the N- and C-terminal halves of the helices. The χ2-probability that the Trp rotamer distributions in the N- and C-terminal halves of the helices were drawn from the same distribution is 4.0 × 10⁻⁴. As shown in Table 1, Trp(−60,120) is more frequent in the N-terminal half (40% or 25/63) than in the C-terminal half (8% or 3/37). This rotamer extends the Trp ring N atom 2.6 Å toward the N-terminus, further away from the Cβ atom than in any other rotamer (Fig. 2). Trp(−60,120) may also be stabilized by a hydrogen bond from the Hδ atom to the i − 4 carbonyl O atom (Hδ–O distance 2.0 Å; Cδ–O distance 2.6 Å). In contrast, Trp(180, 0) extends the ring N atom toward the C-terminus and is more frequent in the C-terminus. It represents 19% (7/37) of C-terminal Trp and only 2% (1/63) of N-terminal Trp. Trp(180,0) extends further toward the C-terminus than any other rotamer (2.2 Å).
TABLE 1.
Trp and Tyr rotamers in TM helices
|
χ
|
Extension¶
|
||||||||
|---|---|---|---|---|---|---|---|---|---|
| AA | Rot* | 1 | 2 | Soluble† % | Total‡ (%) | N§ (%) | C§ (%) | Direction | Distance |
| Trp | 1 | 180 | 120 | 26.9 | 31 (31) | 17 (27) | 14 (38) | C | 1.8 |
| 2 | 180 | −120 | 25.1 | 17 (17) | 8 (13) | 9 (24) | C | 1.8 | |
| 3 | −60 | 120 | 20.3 | 28 (28) | 25 (40) | 3 (8) | N | −2.6 | |
| 4 | −60 | 0 | 12.4 | 10 (10) | 7 (11) | 3 (8) | N | −2.0 | |
| 5 | +60 | −120 | 7.9 | 5 (5) | 5 (8) | 0 (0) | N | −1.7 | |
| 6 | 180 | 0 | 5.2 | 8 (8) | 1 (2) | 7 (19) | C | 2.2 | |
| 7 | −60 | −120 | 1.6 | 1 (1) | 0 (0) | 1 (3) | N | −1.1 | |
| Total | 100 | 63 | 37 | ||||||
| Tyr | 1 | 180 | 90 | 62.2 | 47 (58) | 17 (52) | 30 (63) | C | 3.3 |
| 2 | −60 | 90 | 22.6 | 24 (30) | 12 (36) | 12 (25) | N | −3.1 | |
| 3 | −60 | 0 | 10.1 | 7 (9) | 3 (9) | 4 (8) | N | −3.5 | |
| 4 | +60 | 90 | 2.7 | 2 (2) | 0 (0) | 2 (4) | N | −1.3 | |
| 5 | 180 | 0 | 2.3 | 1 (1) | 1 (3) | 0 (0) | C | 3.1 | |
| Total | 81 | 33 | 48 | ||||||
Rotamer number as found in soluble proteins. Skipped numbers indicate a rotamer was not found in the TM proteins.
Rotamer frequency found in soluble proteins.
Total counts (frequency) of the rotamer in TM proteins.
Rotamer counts (frequency) in the N- or C-terminal halves of the membrane.
Direction (N- or C-terminal) and distance (Å) a side chain extends from the CB atom.
FIGURE 2.
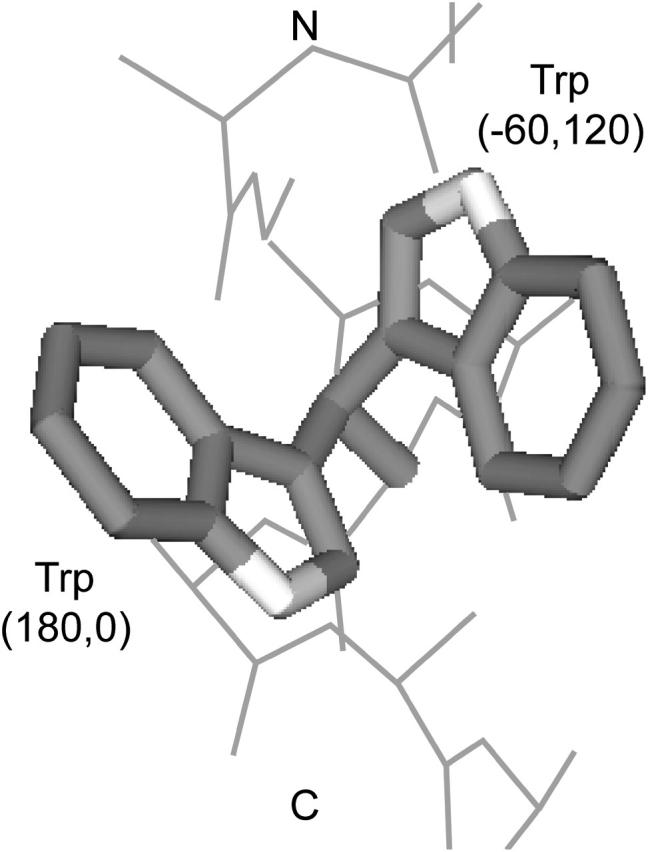
Two Trp rotamers allowing extension of ring N atom toward the N- and C-terminal sides of the membrane. Trp(−60,120) extends the N atom 2.6 Å toward the N-terminal side of the membrane whereas Trp(180,0) extends 2.2 Å toward the C-terminal side. The Cβ atom is considered the reference point.
Although less biased than Trp rotamers, Tyr rotamers are also influenced by the drive to extend the polar atom out of the membrane core (Table 1). Tyr(180, 90) extends the O atom 3.3 Å toward the C-terminus and is more frequent on that half of the helix (63% vs. 52%). In contrast, Tyr(−60,90) extends 3.1 Å toward the N-terminus and is more frequent on that half of the helix (36% vs. 25%). Overall, the TM Tyr distribution is similar to its distribution in soluble proteins and these differences are insignificant statistically. Trp and Tyr rotamers are clearly influenced by the membrane polarity gradient, however. For every rotamer with at least one count in both halves, the frequency of the rotamer is higher in the helix half that causes the side-chain polar atom to extend out of the membrane.
Helical rotamers: serine and threonine
The TM rotamer distributions of Ser favor the −60° χ1 angle. This rotamer forms a hydrogen bond to the carbonyl O atom four residues before the residue (Vijayakumar et al., 1999). Ser(−60) has the highest frequency (74%) in Ser that face out of the protein and into the lipids, compared to 47% in inward-facing Ser. The inward- and outward-facing distributions are significantly different (χ2-probability 2.4%), even though there are only 83 and 35 rotamers in the two populations. Overall, Ser(−60) comprises 55% of TM Ser and 43% of soluble Ser residues (Table 2). Although not statistically significant, the frequency of this rotamer also increases, becoming 59%, when we apply a more stringent, ±10° limit on the backbone φ/ψ-angles (see Total 10 column in Table 2). Therefore, the hydrogen-bonding capability of Ser(−60) greatly favors this rotamer in membrane-facing residues, although Ser is more frequently positioned in protein-facing positions.
Although Thr can also hydrogen bond to the backbone, its TM rotamer distribution is not much different than soluble proteins, because both membrane and soluble proteins strongly prefer the hydrogen-bonding rotamer. In soluble helices, Thr(−60) comprises 87.6% of Thr rotamers. We see a slightly lower frequency of this rotamer in TM Thr (78%), but this frequency approaches the soluble frequency as we consider tighter backbone φ/ψ-angles. This rotamer not only makes the hydrogen bond to the i − 4 backbone O, but is also the most sterically allowed rotamer having the small, hydrogen atom in the χ1 = +60 position. Thus, the increased strength of hydrogen bonding in the membrane is not reflected in an altered TM rotamer distribution because the β-branching of Thr is sufficient to cause the dominance of Thr(−60) in both soluble and TM helices.
Helical rotamers: histidine
The membrane environment also favors a hydrogen-bonding rotamer of His, namely His(−60,60) (Fig. 3). This rotamer is the most frequent His rotamer in TM helices even though it is the fifth most frequent rotamer in soluble helices. Its TM frequency (36% or 26/72) is much larger than its frequency in soluble helices (8.7%). As judged by the χ2-test, the probability of drawing the observed TM rotamer distribution of His (Table 3) from the frequencies found in soluble proteins is 2.6 × 10⁻¹⁰. The His(−60,60) rotamer is even more frequent in the His that faces the lipids. Fifty three percent (21/40) of lipid-facing His are in this rotamer, compared to only 16% (5/32) of protein-facing His. The rotamer distribution of His does not change appreciably when considering only the His with φ/ψ-values within 10° of the ideal helical values.
FIGURE 3.

Histidine's most frequent rotamer in TM helices, His(−60,60). The side-chain Nδ atom hydrogen bonds to the i − 4 backbone carbonyl O atom. The Nδ–O distance is 2.2 Å. This rotamer also extends the ring N atoms an average of 2.0 Å toward the N-terminal side of the membrane.
TABLE 3.
His rotamers in TM helices
|
χ
|
|||||||||
|---|---|---|---|---|---|---|---|---|---|
| AA | Rot | 1 | 2 | Soluble % | Total (%) | In (%) | Out (%) | N (%) | C (%) |
| His | 1 | 180 | +60 | 30.6 | 23 (32) | 17 (53) | 6 (15) | 12 (27) | 11 (39) |
| 2 | −60 | −60 | 17.8 | 5 (7) | 2 (6) | 3 (8) | 1 (2) | 4 (14) | |
| 3 | −60 | 180 | 16.6 | 8 (11) | 2 (6) | 6 (15) | 6 (14) | 2 (7) | |
| 4 | 180 | −60 | 16.0 | 7 (10) | 4 (13) | 3 (8) | 6 (14) | 1 (4) | |
| 5 | −60 | +60 | 8.7 | 26 (36) | 5 (16) | 21 (53) | 18 (41) | 8 (29) | |
| 6 | 180 | 180 | 7.5 | 3 (4) | 2 (6) | 1 (3) | 1 (2) | 2 (7) | |
| Total | 72 | 32 | 40 | 44 | 28 | ||||
Although the His rotamer distribution is not significantly different between the N- and C-termini, His has a bias to be located more frequently in the N-terminal half of TM helices. Of lipid-facing His, 29 are located in the N-terminal half and only 11 are located in the C-terminal half. In both the N- and C-terminal halves, His(−60,60) is the most common rotamer with frequencies of 55% (16/29) and 45%(5/11), respectively. The bias of His to be located more in the N-terminal half is likely to result from the extension of the His(−60,60) side chain toward the helix N-terminus. His(−60,60) extends the two-ring N atoms an average of 2.0 Å from the Cβ atom along the helix axis toward the N-terminus. The extension in this direction makes it more energetically favorable for His to be located toward the N-terminus so that the polarity gradient of the side chain can align with the polarity gradient of the membrane bilayer (Chamberlain et al., 2004). In this manner, hydrogen bonding strongly influences the rotamer choice of His and interactions with the membrane polarity gradient biases the location of His toward one side of the helix.
Helical rotamers: hydrophobic amino acids
In contrast to Trp and Tyr that prefer to reach out of the membrane, Phe, Ile, and Leu slightly favor rotamers that bend back into the membrane. Nine of the 10 rotamers of Phe, Ile, and Leu (Table 4) with >3% frequency in the membrane follow a trend, which we refer to as antisnorkeling. Their rotamers are more frequent in the half of the membrane wherein they extend into the core. For example, Phe(180,90) is more frequent in the N-terminal half (57%) than in the C-terminal half (51%) and extends its Cɛ atom 2.2 Å toward the C-terminus.
TABLE 4.
Leu, Ile, and Phe rotamers in TM helices
|
χ
|
Extension
|
||||||||
|---|---|---|---|---|---|---|---|---|---|
| AA | Rot | 1 | 2 | Soluble % | Total (%) | N (%) | C (%) | Direction | Distance |
| Phe | 1 | 180 | 90 | 61.7 | 140 (54) | 79 (57) | 61 (51) | C | 2.2 |
| 2 | −60 | 90 | 22.2 | 96 (37) | 49 (35) | 47 (40) | N | −2.3 | |
| 3 | −60 | 0 | 11.7 | 14 (5) | 6 (4) | 8 (7) | N | −2.7 | |
| 4 | 180 | 0 | 2.8 | 6 (2) | 4 (3) | 2 (2) | C | 2.1 | |
| 5 | +60 | 90 | 1.4 | 2 (1) | 1 (1) | 1 (1) | N | −1.1 | |
| Total | 258 | 139 | 119 | ||||||
| Ile | 1 | −60 | 180 | 79.0 | 183 (72) | 88 (69) | 95 (75) | N | −2.0 |
| 2 | −60 | −60 | 13.4 | 54 (21) | 31 (24) | 23 (18) | N | −0.3 | |
| 3 | 180 | +60 | 3.1 | 4 (2) | 3 (2) | 1 (1) | C | 1.2 | |
| 4 | 180 | 180 | 2.9 | 3 (1) | 2 (2) | 1 (1) | N | −0.2 | |
| 5 | +60 | 180 | 0.9 | 3 (1) | 1 (1) | 2 (2) | N | −1.2 | |
| 6 | −60 | +60 | 0.4 | 6 (2) | 3 (2) | 3 (2) | N | −1.8 | |
| 8 | +60 | +60 | 0.1 | 2 (1) | 0 (0) | 2 (2) | C | 0.1 | |
| Total | 255 | 128 | 127 | ||||||
| Leu | 1 | −60 | 180 | 57.0 | 247 (52) | 121 (50) | 126 (55) | N | −1.0 |
| 2 | 180 | +60 | 37.2 | 133 (28) | 78 (32) | 55 (24) | C | 0.8 | |
| 3 | 180 | 180 | 2.6 | 30 (6) | 16 (7) | 14 (6) | C | 0.9 | |
| 4 | −60 | +60 | 2.0 | 43 (9) | 21 (9) | 22 (10) | N | −1.1 | |
| 5 | −60 | −60 | 0.6 | 12 (3) | 3 (1) | 9 (4) | N | −0.4 | |
| 6 | 180 | −60 | 0.5 | 9 (2) | 4 (2) | 5 (2) | C | 1.7 | |
| 9 | +60 | −60 | 0.0 | 1 (0) | 1 (0) | 0 (0) | N | −0.8 | |
| Total | 475 | 244 | 231 | ||||||
Phe's second most-frequent rotamer, Phe(−60,90), is considerably more populated in TM helices (37%) than in soluble helices (22%). This rotamer potentially makes two, weak C-H⋯O hydrogen bonds to the backbone (Fig. 4). The Hβ atom in the +60 χ1 position is only 2.2 Å from the i − 3 carbonyl O atom (Cβ–O distance 3.2 Å). The Hδ atom is 1.7 Å from the i − 4 carbonyl O atom (Cδ–O distance 2.5 Å). Whether this Hδ/O interaction should be classified as an oxygen-aromatic (Burley and Petsko, 1988) or a C-H⋯O hydrogen bond could be debated, but either would explain the increased frequency of Phe(−60,90) and also Tyr(−60,90) (See Table 1).
FIGURE 4.
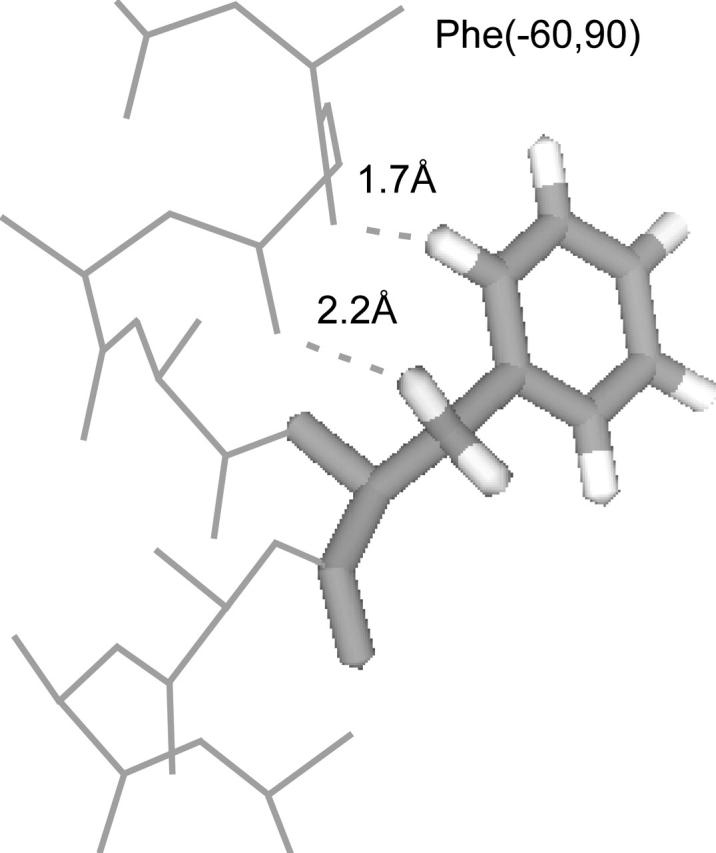
The Phe(−60,90) rotamer making two potential C-H⋯O hydrogen bonds to backbone O atoms in TM helices. The dashed lines indicate the distances from the Hβ and Hδ atoms to the i − 3 and i − 4 carbonyl O atoms, respectively.
Helical rotamers: methionine
The TM rotamer distribution of Met is modestly different from its soluble distribution with a χ2-probability of 1.7 × 10⁻². The changes in Met's TM rotamer distribution may be attributable to the formation of weak hydrogen bonds and the fraction of buried surface area. In Met, and other amino acids like Phe, rotamers with χ1 = −60° or 180° can form a weak hydrogen bond between the Hβ and the i − 3 carbonyl O (Fig. 5 A). In addition, if χ1 = −60° and χ2 = −60° or 180°, then the Hγ atom may also form a weak hydrogen bond to the i − 4 carbonyl O. These six rotamers, Met(−60,−60,X) and Met(−60,180,X), are six of the seven most-frequent Met rotamers in TM helices (Table 5). In particular, Met(−60,−60,60) and Met(−60,−60,180) are the fifth and seventh most-frequent rotamers in TM helices, but were the eighth and 12th most-frequent rotamers in soluble proteins.
FIGURE 5.
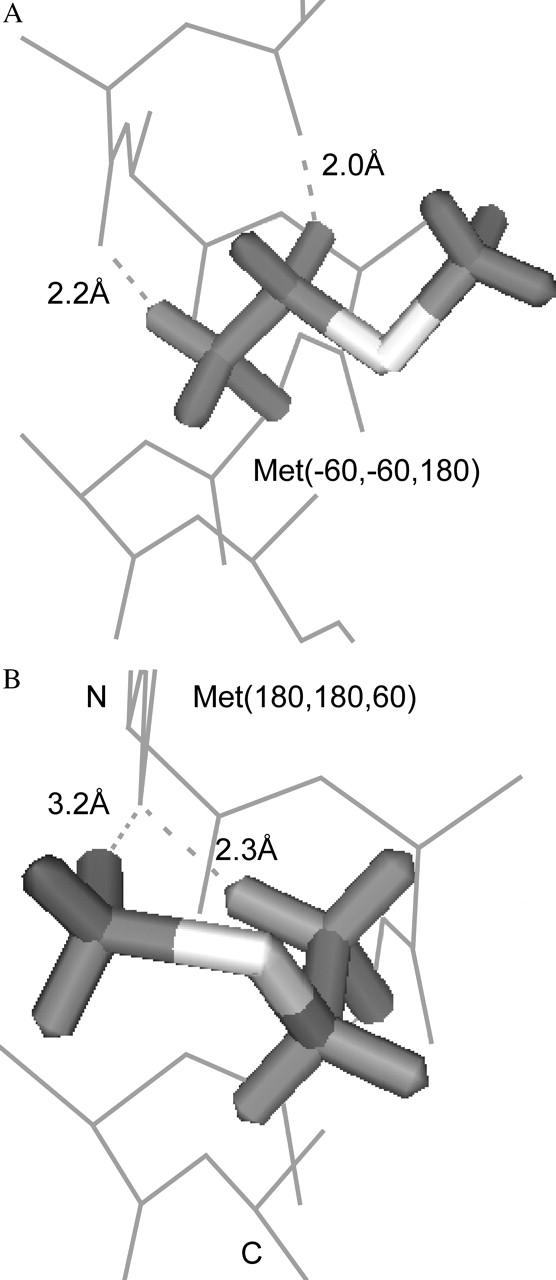
Weak hydrogen-bonding interactions in Met rotamers in TM helices. (A) The six Met(−60,−60 or 180,X) rotamers can make two weak hydrogen bonds to carbonyl O atoms. Met(−60,−60,180) is shown with the two C-H⋯O bonds indicated by dotted lines. (B) The second most-frequent Met rotamer in TM helices, Met(180,180,60), has two potential C-H⋯O bonds. One bond, the Hβ-O bond, is the same as in panel A, but the other is a novel bond using the methyl Hɛ atom.
In addition, Met(180,180,60) changed from being the sixth to the second most-frequent rotamer. An Hβ atom of this rotamer makes the potential weak hydrogen bond, but the Hγ atoms cannot (Fig. 5 B). With the terminal methyl protons assigned to ideal 60°, −60°, and 180° positions, one proton is 3.2 Å from the i − 3 carbonyl O (C–O distance 4.2 Å). This distance is slightly long for a C-H⋯O hydrogen bond, but otherwise the geometry is exceptional. The C-H-O angle is 159° (ideal 180°), the H-O-C angle is 113° (ideal 120°), and the elevation angle is 11° (ideal 0°). The S atom in this side chain also helps polarize the C-H bond more than other methyl C-H bonds.
The differences between the TM rotamer frequencies and the soluble rotamer frequencies of Met are also correlated somewhat to the area buried. The rotamers with increased frequencies in the TM helices bury more surface area than those with a decreased frequency in TM helices. For each rotamer with >1% frequency in soluble helices, the fraction of surface area buried is shown in Fig. 6 as a function of the percent change in rotamer frequency. Met(−60,−60,60), which changed from being the eighth to the fifth most-frequent rotamer, increased in frequency by 290% and has the highest fraction surface area buried of 0.25. In contrast, the frequency Met(180,180,180) decreased in TM helices to 28% of its soluble protein frequency and has the lowest fraction surface area shown, 0.07. There is a considerable amount of scatter in the graph, but we see a similar trend if we plot the distance of the Sδ atom to the helix axis versus the frequency ratio (data not shown). These results suggest that the favored rotamers shield the membrane from the polar backbone.
FIGURE 6.

The surface area buried and change in rotamer frequency of Met rotamers in TM helices. The fraction of surface area buried is shown as a function of the increase in rotamer frequency in TM helices compared to soluble helices. Numbers larger than one on the abscissa indicate that the TM rotamer frequency is higher than the soluble rotamer frequency. Points are plotted for the 13 rotamers with a frequency >1% in soluble proteins.
Helical rotamers: other amino acids
We found some evidence that the long-chain, polar amino acids favor extension of their side chains away from the membrane core, although the data are limited. For example, of the six, lipid-facing Asp residues, four were Asp(−60,0), one was Asp(180,60), and one was Asp(180,−60). The four Asp(−60,0) residues were all found in the N-terminal half of the helix and this rotamer extends toward the N-terminus by 1.2 Å. The only Asp(180,60) rotamer was found in the C-terminal half and extends toward the C-terminus by 1.2 Å. The one Asp(−60,0) residue is the only exception, as it is located in the N-terminal half, but extends toward the C-terminus. Similar trends were found in other polar amino acids, but they were not statistically significant because of the low abundance of these residues. Cys and Val contained TM rotamer distributions that were similar to their soluble rotamer distributions.
Sheet rotamers: tyrosine, tryptophan, and histine
The Tyr rotamer distribution in TM barrels is the distribution most altered from soluble proteins and is profoundly influenced by the membrane polarity gradient. We found nearly four times as many lipid-facing Tyr in the C-terminal half of the sheet than in the N-terminal half (Table 6). Nearly all, 90% or 73/81, of the C-terminal tyrosines are Tyr(180,90). In comparison, this rotamer represents only 27% of N-terminal lipid-facing tyrosines and 15.3% of soluble tyrosines. The probability that the observed lipid-facing C-terminal distribution was drawn from the soluble distribution is 3.1 × 10−68 and the probability that the lipid-facing N- and C-distributions were drawn from the same distribution is 4 × 10⁻⁹. The Tyr(180,90) rotamer is favored in the C-terminus because it extends the side-chain O atom a large distance (5.0 Å) toward the aqueous layer. It also aligns the vector of the side-chain polarity gradient with the polarity gradient of the membrane (Fig. 7). The tilt of the strands with respect to the membrane normal causes the Tyr(180,90) side chain to extend nearly straight out of the membrane (Chamberlain and Bowie, 2004). The abundance of Tyr in the edges of TM helices and sheets allows the overall polarity of its side chain to match the polarity of the membrane interfacial region. The rotamer selection of Tyr aids the overall polarity matching, but also allows the alignment of the side chain and membrane polarity gradients.
TABLE 6.
Tyr, Trp, and His rotamers in TM barrels
|
χ
|
Extension
|
|||||||||
|---|---|---|---|---|---|---|---|---|---|---|
| AA | Rot | 1 | 2 | Soluble % | In (%) | Out (%) | Out-N (%) | Out-C (%) | Direction | Distance |
| Tyr | 1 | −60 | 90 | 74.8 | 5 (12) | 16 (16) | 10 (45) | 6 (7) | N | −3.2 |
| 2 | 180 | 90 | 15.3 | 12 (28) | 79 (77) | 6 (27) | 73 (90) | C | 5.0 | |
| 3 | +60 | 90 | 5.9 | 26 (60) | 8 (8) | 6 (27) | 2 (2) | N | −2.0 | |
| Total | 43 | 103 | 22 | 81 | ||||||
| Trp | 1 | −60 | 120 | 55.2 | 0 (0) | 5 (20) | 5 (50) | 0 (0) | N | −2.4 |
| 2 | −60 | −120 | 10.9 | 1 (7) | 3 (12) | 1 (10) | 2 (13) | N | −1.1 | |
| 3 | 180 | −120 | 9.2 | 0 (0) | 1 (4) | 0 (0) | 1 (7) | C | 3.1 | |
| 4 | 180 | 120 | 9.1 | 1 (7) | 6 (24) | 0 (0) | 6 (40) | C | 3.0 | |
| 6 | 180 | 0 | 3.8 | 2 (13) | 6 (24) | 2 (20) | 4 (27) | C | 3.2 | |
| 7 | +60 | 120 | 1.8 | 4 (27) | 1 (4) | 0 (0) | 1 (7) | N | −0.4 | |
| 8 | +60 | −120 | 1.6 | 6 (40) | 3 (12) | 2 (20) | 1 (7) | N | −1.5 | |
| 9 | +60 | 0 | 0.1 | 1 (7) | 0 (0) | 0 (0) | 0 (0) | N | −1.0 | |
| Total | 15 | 25 | 10 | 15 | ||||||
| His | 1 | −60 | −60 | 38.7 | 2 (20) | 3 (25) | 2 (33) | 1 (17) | N | −1.4 |
| 2 | −60 | +60 | 24.1 | 1 (10) | 1 (8) | 1 (17) | 0 (0) | N | −1.8 | |
| 3 | 180 | +60 | 11.0 | 1 (10) | 3 (25) | 0 (0) | 3 (50) | C | 2.4 | |
| 4 | 180 | −60 | 10.7 | 2 (20) | 3 (25) | 1 (17) | 2 (33) | C | 2.5 | |
| 5 | −60 | 180 | 8.9 | 0 (0) | 1 (8) | 1 (17) | 0 (0) | N | −1.5 | |
| 7 | +60 | +60 | 2.1 | 3 (30) | 0 (0) | 0 (0) | 0 (0) | N | −0.2 | |
| 8 | +60 | −60 | 1.2 | 1 (10) | 1 (8) | 1 (17) | 0 (0) | N | −1.0 | |
| Total | 10 | 12 | 6 | 6 | ||||||
FIGURE 7.

The three most-frequent Tyr rotamers in TM barrels. Each rotamer is marked by a solid vector from low to high polarity. The polarity gradients of the membrane extend out of the membrane toward either the N- or C-terminal side (dashed vectors). Tyr(180,90) aligns it polarity gradient better than the other Tyr rotamers with one of the membrane polarity gradients. This rotamer extends toward the C-terminus helping Tyr to be more populated on this side of the membrane.
The favored Trp rotamers are also different in the membrane N- and C-terminal halves, but the trends are less obvious than for Tyr. In lipid-facing Trp, the rotamers are favored that allow extension of the side-chain N atom out of the membrane (Table 6). All five Trp(−60,120) rotamers are located in the N-terminus and this rotamer extends the N atom toward the N-terminus by 2.4 Å. In contrast, all six Trp(180,120) rotamers are located in the C-terminus and this rotamer extends toward the C-terminus by 3.0 Å. The probability that the N-terminal and C-terminal lipid-facing Trp rotamers were drawn from the same distribution is 3 × 10⁻².
The His rotamers also follow the trend of Tyr and Trp, but the low counts make the results statistically insignificant. The probability that the N-terminal and C-terminal lipid-facing distributions were drawn from the same distribution is 0.25, but each rotamer is more frequent in the sheet half that allows the N atoms to snorkel out of the membrane.
Sheet rotamers: hydrophobic amino acids
The hydrophobic amino acids, Phe, Ile, and Leu, have only slightly different distributions in TM and soluble strands. The differences are related to the area buried by each rotamer (Table 7). Phe(−60,90) is considerably less frequent in lipid-facing residues than in soluble strands and buries less surface area (fraction buried 0.21) than the other two rotamers observed in TM β-barrels (fraction buried 0.30 and 0.31). In Ile rotamers, Ile(−60,180) has the lowest fraction burial (0.24) and has a greatly reduced frequency in barrels (36%) compared to soluble proteins (58%). Ile(180,60) has a high fraction buried (0.40) and an increased frequency in membrane proteins (17% versus 1.9%). The four most frequent rotamers of Leu also demonstrate the trend. The rotamers with 0.29 fraction buried have an increased frequency, whereas the rotamers with 0.22 and 0.23 fraction buried have a similar or decreased frequency. Nevertheless, although there is an apparent correlation between changes in rotamer frequency and area buried, it is relatively weak and we did not see any evidence for antisnorkeling of these amino acids as was observed in TM helices.
TABLE 7.
Phe, Ile, and Leu rotamers in TM barrels
|
χ
|
|||||||
|---|---|---|---|---|---|---|---|
| AA | Rot | 1 | 2 | Soluble % | In (%) | Out (%) | % Area Buried |
| Phe | 1 | −60 | 90 | 69.8 | 1 (8) | 29 (38) | 21 |
| 2 | 180 | 90 | 21.2 | 1 (8) | 33 (43) | 30 | |
| 3 | +60 | 90 | 5.4 | 10 (83) | 14 (19) | 31 | |
| Total | 12 | 77 | |||||
| Ile | 1 | −60 | 180 | 58.1 | 8 (67) | 21 (36) | 24 |
| 2 | 180 | 180 | 16.6 | 1 (8) | 12 (20) | 30 | |
| 3 | +60 | 180 | 11.8 | 3 (25) | 8 (14) | 26 | |
| 4 | −60 | −60 | 9.2 | 0 (0) | 6 (10) | 34 | |
| 5 | 180 | +60 | 1.9 | 0 (0) | 10 (17) | 40 | |
| 7 | +60 | +60 | 0.4 | 0 (0) | 1 (2) | 36 | |
| 8 | +60 | −60 | 0.2 | 0 (0) | 1 (2) | 41 | |
| Total | 12 | 59 | |||||
| Leu | 1 | −60 | 180 | 63.6 | 6 (22) | 48 (33) | 22 |
| 2 | 180 | +60 | 22.3 | 9 (33) | 53 (37) | 29 | |
| 3 | −60 | +60 | 6.1 | 2 (7) | 9 (6) | 23 | |
| 4 | 180 | 180 | 4.8 | 5 (19) | 20 (14) | 29 | |
| 5 | +60 | 180 | 1.1 | 1 (4) | 2 (1) | 32 | |
| 6 | +60 | +60 | 0.9 | 2 (7) | 2 (1) | 33 | |
| 7 | −60 | −60 | 0.6 | 0 (0) | 2 (1) | 36 | |
| 8 | 180 | −60 | 0.5 | 1 (4) | 9 (6) | 44 | |
| 9 | +60 | −60 | 0.0 | 1 (4) | 0 (0) | 48 | |
| Total | 27 | 145 | |||||
The TM rotamer distributions of Met and Val are very similar to their soluble distributions and we found zero Cys residues in the TM strands (Wimley, 2002).
Sheet rotamers: serine and threonine
The Ser rotamers that face into the interior of the barrel are different from those of soluble proteins (probability 4 × 10⁻¹⁶) and favor the Ser(60) rotamer (Table 8). The Ser(60) frequency is 51%, which is considerably higher than its 17.1% frequency in soluble proteins. In this rotamer, the Oγ atom can share a hydrogen bond with the carbonyl O atom to a backbone N atom of an adjacent strand. The Oγ and carbonyl O atoms are 3.3 Å and 3.0 Å from the N atom, respectively. Although an increase in hydrogen-bond strength would be expected in a membrane, these inward facing Ser residues should interact with water or protein segments. Perhaps the detergents used in crystallization interact with the β-barrel pore lining and influence the rotamer populations.
TABLE 8.
Ser and Thr rotamers in TM barrels
| AA | Rot | χ1 | Soluble % | In (%) | Out (%) |
|---|---|---|---|---|---|
| Ser | 1 | −60 | 43.1 | 23 (25) | 6 (29) |
| 2 | 180 | 39.8 | 22 (24) | 9 (43) | |
| 3 | +60 | 17.1 | 47 (51) | 6 (29) | |
| Total | 92 | 21 | |||
| Thr | 1 | −60 | 61.8 | 60 (65) | 23 (51) |
| 2 | +60 | 25.3 | 23 (25) | 8 (18) | |
| 3 | 180 | 12.9 | 10 (11) | 14 (31) | |
| Total | 93 | 45 |
The rotamer distribution of lipid-facing Thr is modestly different from that of soluble proteins (probability 3 × 10⁻³). The least frequent rotamer in soluble sheets, Thr(180), is overpopulated in the lipid-facing residues of TM β-barrels. The rotamer distribution of inward-facing Thr residues is very similar to that found in soluble sheets.
Sheet rotamers: other amino acids
The low counts of the polar amino acids (Gln, Glu, Asn, Asp, Arg, Lys) hinders the analysis of their lipid-facing rotamer distributions. We find a bias for rotamers to be more populated in the strand half that allows extension of the side chain toward the aqueous region. Gln has the most lipid-facing side chains (14), five of which are Gln(180,60,45). This rotamer extends the side chain 1.6 Å toward the C-terminal side of the membrane and all five examples are found in the C-terminal half of the membrane. Moreover, the Gln(180,60,45) rotamer's frequency in lipid-facing residues (36%) is much greater than its soluble protein frequency of 3.8%. It also has the highest fraction buried (0.33) of any of the 14 rotamers with at least 1% frequency in soluble strands. The side-chain amide is oriented flat against the sheet and covers a backbone hydrogen-bond acceptor from the surroundings.
DISCUSSION
The results described above demonstrate that the membrane environment alters the rotamer preferences from those observed in soluble proteins. The preferences change at different locations within the membrane, reflecting the disparate environments present in the bilayer. The effects of the membrane are clearly illustrated by the increased frequencies of hydrogen-bonding rotamers and the snorkeling of Trp and Tyr out of the membrane. Although we need many more structures before completing an analysis of the long, polar residues, we can anticipate that snorkeling will occur given these results. It may be useful to reexamine these rotamer frequencies when the number of structures available is even two- or threefold higher than used here.
The behavior of Trp and Tyr illustrates how the geometry of the helix or sheet interacts with the membrane environment to favor certain rotamers and amino acid locations. Imagine a membrane polarity gradient vector pointing out of the membrane and a side-chain polarity gradient vector extending from the hydrophobic region of a side chain toward the polar region. For Trp and Tyr with fixed ring atoms, the magnitude of side-chain vector will be determined by the polarity of the side-chain atoms, whereas the orientation of the polarity gradient vector will be determined by the side-chain rotamer. For the side chain to interact ideally with the membrane, two conditions should be met: 1), the depth of the amino acid in the membrane should match the average polarity of the amino acid to the polarity of the surrounding lipids, and 2), the side-chain rotamer should be chosen to match the membrane polarity gradient to the polarity gradient of the lipids. In proteins, these ideal conditions must find an appropriate compromise with the connectivity and steric constraints that define rotamer libraries. The lower abundance of Trp in sheets compared to Tyr may result from a less satisfactory compromise. Interestingly, the aromaticity of Trp and Tyr may help cause their preference for the interfacial regions over the core (Yau et al., 1998), although their dipoles seem to cause the N- versus C-biases.
The energy differences between rotamers are often very small, making them very sensitive probes of the membrane environment. As more TM structures are solved, the TM rotamer libraries will become more complete. Already we have seen the necessity of creating rotamer libraries for membrane proteins that vary by amino acid position (in/out or N-terminal/C-terminal). Clearly the side-chain positions must accommodate the constraints caused by the protein geometry and the restraints of membrane environment. Efforts in the areas of structure prediction, protein design, and drug design for membrane proteins will have to move beyond the use of soluble protein rotamer libraries to more detailed libraries tailored to the different membrane environments.
SUPPLEMENTARY MATERIAL
An online supplement to this article can be found by visiting BJ Online at http://www.biophysj.org. A tar compressed file containing the observed TM rotamer counts is available as supplemental information.
Supplementary Material
Acknowledgments
We thank Sanguk Kim for help in measuring rotamers and members of the Bowie laboratory for critical reading of the manuscript.
This research is supported by National Institutes of Health grant RO1-GM63919. J.U.B. is a Leukemia and Lymphoma Society Scholar.
References
- Andersson, H., and G. von Heijne. 1994. Membrane protein topology: effects of delta mu H+ on the translocation of charged residues explain the “positive inside” rule. EMBO J. 13:2267–2272. [DOI] [PMC free article] [PubMed] [Google Scholar]
- Arkin, I. T., and A. T. Brunger. 1998. Statistical analysis of predicted transmembrane alpha-helices. Biochim. Biophys. Acta. 1429:113–128. [DOI] [PubMed] [Google Scholar]
- Bowie, J. U., R. Luthy, and D. Eisenberg. 1991. A method to identify protein sequences that fold into a known three-dimensional structure. Science. 253:164–170. [DOI] [PubMed] [Google Scholar]
- Burley, S. K., and G. A. Petsko. 1988. Weakly polar interactions in proteins. Adv. Protein Chem. 39:125–189. [DOI] [PubMed] [Google Scholar]
- Chakrabarti, P., and S. Chakrabarti. 1998. C–H…O hydrogen bond involving proline residues in alpha-helices. J. Mol. Biol. 284:867–873. [DOI] [PubMed] [Google Scholar]
- Chamberlain, A. K., and J. U. Bowie. 2002. Evaluation of C-H cdots, three dots, centered O hydrogen bonds in native and misfolded proteins. J. Mol. Biol. 322:497–503. [DOI] [PubMed] [Google Scholar]
- Chamberlain, A. K., and J. U. Bowie. 2004. Asymmetric amino acid compositions of transmembrane beta-strands. Protein Sci. 13:2270–2274. [DOI] [PMC free article] [PubMed] [Google Scholar]
- Chamberlain, A., Y. Lee, S. Kim, and J. Bowie. 2004. Snorkeling preferences foster an amino acid composition bias in transmembrane helices. J. Mol. Biol. 339:471–479. [DOI] [PubMed] [Google Scholar]
- Derewenda, Z. S., L. Lee, and U. Derewenda. 1995. The occurrence of C-H…O hydrogen bonds in proteins. J. Mol. Biol. 252:248–262. [DOI] [PubMed] [Google Scholar]
- Dunbrack, R. L., Jr. 2002. Rotamer libraries in the 21st century. Curr. Opin. Struct. Biol. 12:431–440. [DOI] [PubMed] [Google Scholar]
- Dunbrack, R. L., Jr., and F. E. Cohen. 1997. Bayesian statistical analysis of protein side-chain rotamer preferences. Protein Sci. 6:1661–1681. [DOI] [PMC free article] [PubMed] [Google Scholar]
- Fabiola, G. F., S. Krishnaswamy, V. Nagarajan, and V. Pattabhi. 1997. C-H.O hydrogen bonds in beta-sheets. Acta. Crystallogr. D53:316–320. [DOI] [PubMed] [Google Scholar]
- Fauchere, J. L., and V. Pliska. 1983. Hydrophobic parameters of amino acid side chains from the partitioning of N-acetyl-amino acid amides. Eur. J. Med. Chem. 18:369–375. [Google Scholar]
- Klabunde, T., and G. Hessler. 2002. Drug design strategies for targeting G-protein-coupled receptors. Chembiochem. 3:928–944. [DOI] [PubMed] [Google Scholar]
- Landolt-Marticorena, C., K. A. Williams, C. M. Deber, and R. A. Reithmeier. 1993. Non-random distribution of amino acids in the transmembrane segments of human type I single span membrane proteins. J. Mol. Biol. 229:602–608. [DOI] [PubMed] [Google Scholar]
- Lovell, S. C., J. M. Word, J. S. Richardson, and D. C. Richardson. 1999. Asparagine and glutamine rotamers: B-factor cutoff and correction of amide flips yield distinct clustering. Proc. Natl. Acad. Sci. USA. 96:400–405. [DOI] [PMC free article] [PubMed] [Google Scholar]
- Lovell, S. C., J. M. Word, J. S. Richardson, and D. C. Richardson. 2000. The penultimate rotamer library. Proteins. 40:389–408. [PubMed] [Google Scholar]
- Mishra, V. K., M. N. Palgunachari, J. P. Segrest, and G. M. Anantharamaiah. 1994. Interactions of synthetic peptide analogs of the class A amphipathic helix with lipids. Evidence for the snorkel hypothesis. J. Biol. Chem. 269:7185–7191. [PubMed] [Google Scholar]
- Palczewski, K., T. Kumasaka, T. Hori, C. A. Behnke, H. Motoshima, B. A. Fox, I. Le Trong, D. C. Teller, T. Okada, R. E. Stenkamp, M. Yamamoto, and M. Miyano. 2000. Crystal structure of rhodopsin: a G protein-coupled receptor. Science. 289:739–745. [DOI] [PubMed] [Google Scholar]
- Popot, J. L., and D. M. Engelman. 2000. Helical membrane protein folding, stability, and evolution. Annu. Rev. Biochem. 69:881–922. [DOI] [PubMed] [Google Scholar]
- Segrest, J. P., M. K. Jones, H. De Loof, C. G. Brouillette, Y. V. Venkatachalapathi, and G. M. Anantharamaiah. 1992. The amphipathic helix in the exchangeable apolipoproteins: a review of secondary structure and function. J. Lipid Res. 33:141–166. [PubMed] [Google Scholar]
- Senes, A., I. Ubarretxena-Belandia, and D. M. Engelman. 2001. The Calpha–H…O hydrogen bond: a determinant of stability and specificity in transmembrane helix interactions. Proc. Natl. Acad. Sci. USA. 98:9056–9061. [DOI] [PMC free article] [PubMed] [Google Scholar]
- Seshadri, K., R. Garemyr, E. Wallin, G. von Heijne, and A. Elofsson. 1998. Architecture of beta-barrel membrane proteins: analysis of trimeric porins. Protein Sci. 7:2026–2032. [DOI] [PMC free article] [PubMed] [Google Scholar]
- Shrivastava, I. H., C. E. Capener, L. R. Forrest, and M. S. Sansom. 2000. Structure and dynamics of K channel pore-lining helices: a comparative simulation study. Biophys. J. 78:79–92. [DOI] [PMC free article] [PubMed] [Google Scholar]
- Strandberg, E., S. Morein, D. T. Rijkers, R. M. Liskamp, P. C. van der Wel, and J. A. Killian. 2002. Lipid dependence of membrane anchoring properties and snorkeling behavior of aromatic and charged residues in transmembrane peptides. Biochemistry. 41:7190–7198. [DOI] [PubMed] [Google Scholar]
- Tanford, C., and J. A. Reynolds. 1976. Characterization of membrane proteins in detergent solutions. Biochim. Biophys. Acta. 457:133–170. [DOI] [PubMed] [Google Scholar]
- Ulmschneider, M. B., and M. S. Sansom. 2001. Amino acid distributions in integral membrane protein structures. Biochim. Biophys. Acta. 1512:1–14. [DOI] [PubMed] [Google Scholar]
- Vijayakumar, M., H. Qian, and H. X. Zhou. 1999. Hydrogen bonds between short polar side chains and peptide backbone: prevalence in proteins and effects on helix-forming propensities. Proteins. 34:497–507. [PubMed] [Google Scholar]
- Wallin, E., and G. von Heijne. 1998. Genome-wide analysis of integral membrane proteins from eubacterial, archaean, and eukaryotic organisms. Protein Sci. 7:1029–1038. [DOI] [PMC free article] [PubMed] [Google Scholar]
- White, S. H., and W. C. Wimley. 1999. Membrane protein folding and stability: physical principles. Annu. Rev. Biophys. Biomol. Struct. 28:319–365. [DOI] [PubMed] [Google Scholar]
- Wimley, W. C. 2002. Toward genomic identification of beta-barrel membrane proteins: composition and architecture of known structures. Protein Sci. 11:301–312. [DOI] [PMC free article] [PubMed] [Google Scholar]
- Wimley, W. C., and S. H. White. 1996. Experimentally determined hydrophobicity scale for proteins at membrane interfaces. Nat. Struct. Biol. 3:842–848. [DOI] [PubMed] [Google Scholar]
- Word, J. M., S. C. Lovell, J. S. Richardson, and D. C. Richardson. 1999. Asparagine and glutamine: using hydrogen atom contacts in the choice of side-chain amide orientation. J. Mol. Biol. 285:1735–1747. [DOI] [PubMed] [Google Scholar]
- Yau, W. M., W. C. Wimley, K. Gawrisch, and S. H. White. 1998. The preference of tryptophan for membrane interfaces. Biochemistry. 37:14713–14718. [DOI] [PubMed] [Google Scholar]
Associated Data
This section collects any data citations, data availability statements, or supplementary materials included in this article.