Abstract
We studied the pressure-induced folding/unfolding transition of staphylococcal nuclease (SN) over a pressure range of ∼1–3 kilobars at 25°C by small-angle neutron scattering and molecular dynamics simulations. We find that applying pressure leads to a twofold increase in the radius of gyration derived from the small-angle neutron scattering spectra, and P(r), the pair distance distribution function, broadens and shows a transition from a unimodal to a bimodal distribution as the protein unfolds. The results indicate that the globular structure of SN is retained across the folding/unfolding transition although this structure is less compact and elongated relative to the native structure. Pressure-induced unfolding is initiated in the molecular dynamics simulations by inserting water molecules into the protein interior and applying pressure. The P(r) calculated from these simulations likewise broadens and shows a similar unimodal-to-bimodal transition with increasing pressure. The simulations also reveal that the bimodal P(r) for the pressure-unfolded state arises as the protein expands and forms two subdomains that effectively diffuse apart during initial stages of unfolding. Hydrophobic contact maps derived from the simulations show that water insertions into the protein interior and the application of pressure together destabilize hydrophobic contacts between these two subdomains. The findings support a mechanism for the pressure-induced unfolding of SN in which water penetration into the hydrophobic core plays a central role.
INTRODUCTION
The central paradigm of protein folding in aqueous solution is the existence of a thermodynamically stable, native state in which amphiphilic polypeptide chains form unique three-dimensional structures with a closed-packed hydrophobic core (Kauzmann, 1959; Dill, 1990). Although a variety of forces contribute to the stability of these three-dimensional structures, formation of this hydrophobic core is thought to play a dominant role. Based on an information theory model of hydrophobic interactions, Hummer et al. (1998) proposed that proteins stabilized by hydrophobic driving forces at ambient pressure are destabilized at elevated pressures due to water penetration into the hydrophobic core. Thus, pressure-induced unfolding corresponds to the transfer of water into the protein interior rather than the transfer of nonpolar residues from the protein interior into water. The latter transfer process provides an accurate, but primitive thermodynamic model for heat denaturation of proteins. This so-called liquid hydrocarbon model of protein folding accounts for the large negative entropy and large positive heat capacity of unfolding, properties shared with the transfer of liquid hydrocarbons into water (Baldwin, 1986). However, this model fails to predict pressure denaturation of proteins. As pointed out by Kauzmann (1987), the volume change for unfolding is positive at low pressures and negative at high pressures, whereas the transfer of hydrocarbons from a nonpolar phase into water exhibits the opposite behavior: the volume change is negative at low pressures and positive at high pressures. To examine the proposition of Hummer et al. (1998), we measured the reversible folding/unfolding transition of staphylococcal nuclease at ambient temperature and kilobar pressures using small angle neutron scattering (SANS). The SANS experiments were complemented by molecular dynamics (MD) simulations in which unfolding was initiated by water insertions into the protein interior at elevated pressures.
The protein we chose to study is staphylococcal nuclease (SN), a small globular protein consisting of 149 amino acid residues and no disulfide bonds with a folding/unfolding transition that conforms to the two-state model of protein folding (Shortle, 1986). The reversible unfolding of SN as a function of pH, chemical denaturants, and temperature has been studied extensively (Shortle and Meeker, 1986; Shortle, 1995; Ionescu and Eftink, 1997; Carra et al., 1994; Carra and Privalov, 1995; Griko et al., 1988). Experimental studies of the effect of pressure on the folding/unfolding transition have also been reported (Vidugiris et al., 1995; Frye et al., 1996; Panick et al., 1998, 1999; Lassalle et al., 2000; Woenckhaus et al., 2001). These more recent studies indicate that the ensemble of unfolding pathways for pressure denaturation is inherently different from those for heat or chemical denaturation. For example, the pressure denaturation of SN, unlike heat denaturation, leads to an unfolded state characterized by significant residual secondary structure. The application of pressure also forces structural rearrangements of the polypeptide chain leading to relatively compact chain conformations that are nonetheless swollen compared to the native state due to increased hydration. This increased hydration of the polypeptide chain and a concomitant decrease in the total volume of the solution imply changes in protein-solvent interactions across the pressure-induced folding/unfolding transition. The pressure dependence of this transition therefore can provide insights into these interactions, which are difficult to obtain by manipulating other thermodynamic variables, most notably temperature, or through addition of the denaturing agents, such as urea and guanidinium hydrochloride.
Similar pressure-induced perturbations of protein-solvent interactions primarily at hydrophobic interfaces have motivated practical applications of high pressure to reverse the aggregation of folding intermediates (Gorovits and Horowitz, 1998) or to dissociate oligomeric proteins (Silva and Weber, 1993), multiprotein virus assemblies (Da Poian et al., 1993, 1994; Bonafe et al., 1998), and amyloid fibrils under aggregating conditions (Foguel et al., 2003). Pressure unfolding also avoids irreversible aggregation common in heat denaturation as well as the association of denaturing agents with unfolded or partially unfolded proteins in chemical denaturation, both of which can obfuscate an experimental characterization of the unfolded state. Thus, the use of pressure to direct protein unfolding can provide insights into the nature of the unfolded state as well as the folding/unfolding transition.
METHODS
Scattering experiments were performed on the NG3 30 m SANS instrument at the National Institute of Standards and Technology (NIST) Center for Neutron Research (Gaithersburg, MD). Neutrons of wavelength λ = 6 Å with a distribution Δλ/λ = 15% were incident on samples held in a custom-built high-pressure SANS cell. Sample/detector distances of 1.5 and 5 meters were used to obtain a q-range of 0.01 ≤ q/Å−1 ≤ 0.12 where q = (4π/λ) sin(θ/2) is the magnitude of the scattering vector. The upper limit of this q-range was set by the geometry of the pressure cell. Sample scattering was corrected for background and empty cell scattering, and the sensitivity of individual detector pixels was normalized. Corrected data sets were circularly averaged and placed on an absolute scale using standard samples and software supplied by NIST (SANS Data Reduction and Imaging Software, 1998). Instrumental smearing was simulated (Barker and Pedersen, 1995) for the instrument configurations used, eliminating smeared data points from the combined data set.
The custom-built, high-pressure SANS cell consists of a stainless steel outer cell rated to 4 kilobar, and an inner cell that contains the protein solution. The design of this high-pressure cell has been described in detail elsewhere (Ferdinand, 2000). A unique feature of the cell design is to isolate the sample from the pressurizing fluid and the metal walls of the outer cell by enclosing the sample in the inner cell. This inner cell consists of a flexible Teflon sleeve that fits tightly around the two sapphire windows of the outer cell. The distance between the windows determined the sample path length: 2 mm. Changes in the path length due to deformation of the high-pressure cell at kilobar pressures were accounted for based on an independent calibration of this correction (Ferdinand, 2000).
Pressure was generated using a pressure generator and measured at the cell using a Viatran Model 345 transducer (0–60,000 psi, <±60 psi nonlinearity; Viatran, Grand Island, NY) and meter (±1 psi sensitivity). A dedicated PC connected to the SANS data acquisition computer was used to control pressure. Temperature was controlled by circulating ethylene glycol through a constant-temperature bath provided by NIST (±0.01°C sensitivity) and the aluminum jacket that houses the high-pressure cell. The jacket temperature at the outer edge of the cell was monitored using a thermocouple accurate to ±0.1°C. This temperature was found to be within ±0.2°C of the temperature inside the high-pressure cell. The uncertainty in the temperature inside the cell was estimated to be <0.5°C with a stability of ±0.1°C over the course of an experiment.
Wild-type SN was expressed and purified to >98% as determined by SDS-PAGE following the procedure described previously by Shortle and Meeker (1986). All experiments were performed at 25°C and a protein concentration of 9.86 mg/ml in D2O and 50 mM bis-Tris-buffer adjusted to pH 5.5. These solution conditions were chosen to match those reported in previous studies of pressure-induced unfolding of SN (Panick et al., 1998). Solutions were prepared by exchanging H2O for D2O in successive dilutions using Amicon Ultra Centrifugal Filter Tubes with a 5000-MW cutoff (Millipore, Bedford, MA). The samples were stored at 4°C before transferring them to the high-pressure cell for the SANS measurements.
RESULTS AND DATA ANALYSIS
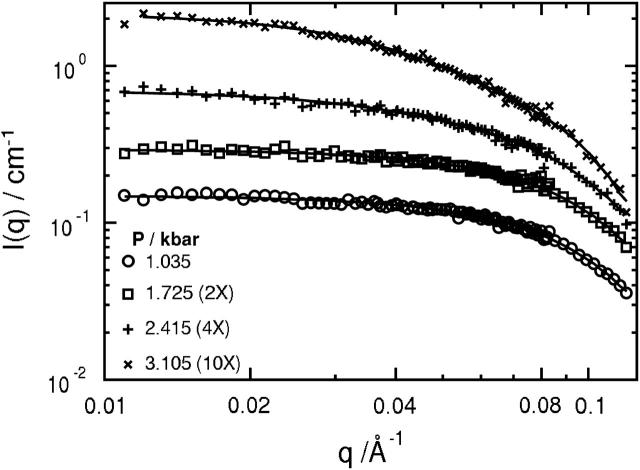
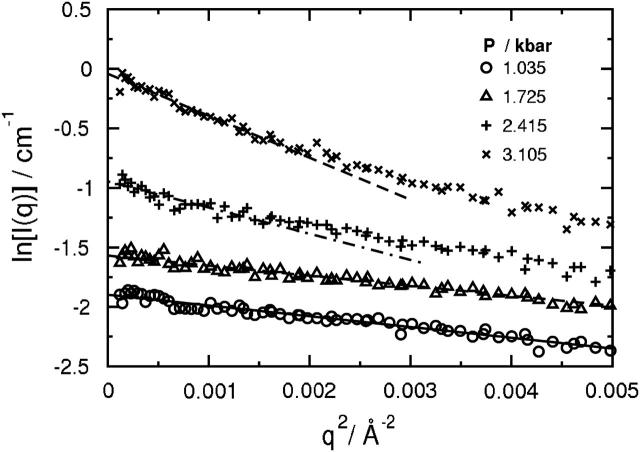
Scattering spectra at 25°C for representative pressures between 1.0 and 3.1 kilobars are shown in Fig. 1. These pressures span the midpoint of the folding/unfolding transition at ∼2.1 kilobar at 25°C (Panick et al., 1999). The spectra were measured as a function of decreasing pressure after first measuring the scattering intensity, I(q), at 1.0 kilobar. The reproducibility of I(q) at low pressures corresponding to the refolded state of SN confirmed the reversibility of the folding/unfolding transition. Decreasing rather than increasing pressure has an added advantage of reducing the equilibration time at each pressure since the folding and unfolding rates of SN increase with decreasing pressure (Vidugiris et al., 1995). This effect can be large; for example, SN unfolds in approximately an hour in response to a pressure jump of a few kilobars, but refolds in less than a minute in response to a comparable decrease in pressure (Woenckhaus et al., 2001). At low q, the spectra are fit using the Guinier approximation
 |
(1) |
where Rg is the radius of gyration and I(0) is the forward scattering intensity. In each case, a linear plot of ln[I(q)] versus q2 is obtained for qRg < 1.0 (Semisotnov et al., 1996), as shown in Fig. 2. At higher pressures, the q-range over which this inequality holds shifts to lower values with the expected increase in Rg as the protein unfolds.
FIGURE 1.
Measured scattering intensities as a function of the magnitude of the scattering wave vector for a solution of 9.86 mg/ml SN in D2O and 50 mM bis-Tris-buffer at pH 5.5, 25°C, and selected pressures between 1.0 and 3.1 kilobars. The lines through the data at each pressure are obtained from the P(r) shown in Fig. 3 as discussed in the text. The spectra at the three higher pressures have been offset by factors indicated in parentheses in the figure legend.
FIGURE 2.
Guinier plots of the measured scattering spectra in Fig. 1. The linear fits to the data at low q using Eq. 1 were uniformly constrained to q-values such that qRg < 1.0. The results at the three higher pressures have been offset as indicated in the legend for Fig. 1.
The radius of gyration and forward scattering intensity can also be calculated from the pair distance distribution function, P(r), defined as the distribution of distances between pairs of scattering points within the protein and given by the inverse Fourier transformation of the measured scattered intensity,
 |
(2) |
We obtained P(r) using the indirect Fourier transformation method implemented in GNOM (Svergun, 1991), and then calculated Rg and I(0) from the standard relations
 |
(3) |
and
 |
(4) |
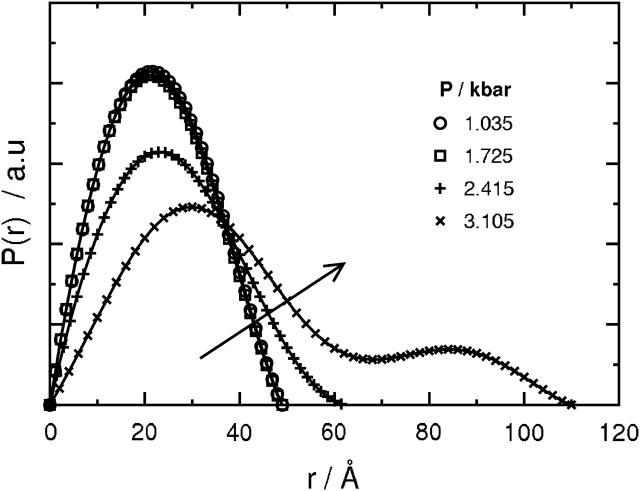
where Dmax is the maximum dimension of the protein. The only requirement in applying Eqs. 3 and 4 is an estimate of Dmax. These values of Rg and I(0) are considered to be more reliable than those derived from the Guinier analysis since the approach makes use of the measured I(q) over the entire q-range (Glatter and Kratky, 1982). The P(r) derived from the I(q) in Fig. 1 using Eq. 2 are shown in Fig. 3.
FIGURE 3.
Pair distance distribution functions for a solution of 9.86 mg/ml SN in D2O and 50 mM bis-Tris-buffer at pH 5.5, 25°C derived from the measured scattering intensities in Fig. 1 at the same four pressures. The arrow indicates the direction of increasing pressure. Dmax corresponds to the first nonzero value of r at which P(r) = 0.
The symmetrical, bell-shaped P(r) curves at 1.0 and 1.7 kilobars confirm the globular shape of SN in its folded state that is observed in the x-ray crystal structure (Hynes and Fox, 1991). These two curves also virtually superimpose, indicating that the protein retains its globular shape for pressures as high as 1.7 kilobars. At 2.4 kilobars, P(r) is still bell-shaped, but the distribution becomes slightly skewed to larger values of r. At 3.1 kilobars, P(r) becomes distinctly bimodal. In addition, the value of Dmax increases from ∼48 Å at 1.0 and 1.7 kilobars to a value of 110 Å at 3.1 kilobars. The value of Dmax at the lower two pressures is comparable to the maximum dimension extracted from the x-ray crystal structure (Hynes and Fox, 1991). We do not attach physical meaning to Dmax at intermediate pressures since an interpretation is complicated by the presence of both folded and unfolded states of SN.
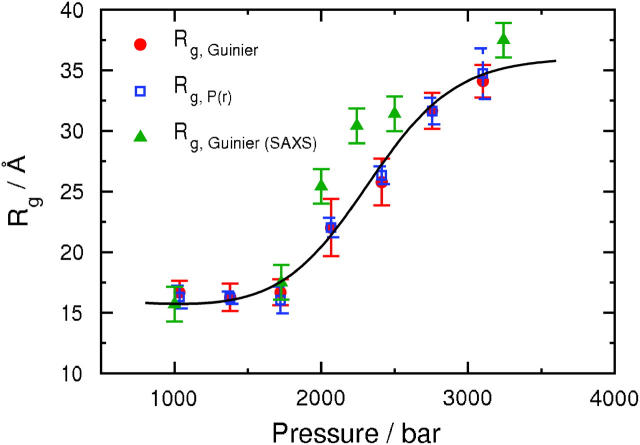
The values of Rg as a function of pressure derived from P(r) and the Guinier analysis are in excellent agreement over the entire range of pressures, as shown in Fig. 4. These values are also compared with those obtained from a Guinier analysis of small-angle x-ray scattering (SAXS) measurements at the same solution conditions (Panick, et al., 1998). We note good agreement at high and low pressures, but slightly higher SAXS values for Rg at intermediate pressures. Consequently, the midpoint of the folding/unfolding transition is ∼2.5 kilobars for our SANS results compared to ∼2.1 kilobars for the SAXS results (Panick, et al., 1999). Nonetheless, both results show that the application of pressure produces a twofold increase in Rg across the folding/unfolding transition for SN at 25°C, from 16.3 Å at 1.0 kilobar to 34.7 Å at 3.1 kilobar.
FIGURE 4.
Pressure dependence of Rg for a solution of 9.86 mg/ml SN in D2O and 50 mM bis-Tris-buffer at pH 5.5, 25°C, and selected pressures between 1.0 and 3.1 kilobars. The circles are obtained from the Guinier plots in Fig. 2, and the squares correspond to values calculated from P(r) using Eq. 3. Also shown for comparison are the Rg values (triangles) obtained from small-angle x-ray scattering measurements across the pressure-induced folding/unfolding transition of SN at the same solution conditions (Panick et al., 1998). The fit to the data is based on the two-state thermodynamic model for the folding/unfolding transition (Eqs. 11 and 12) applied to  .
.
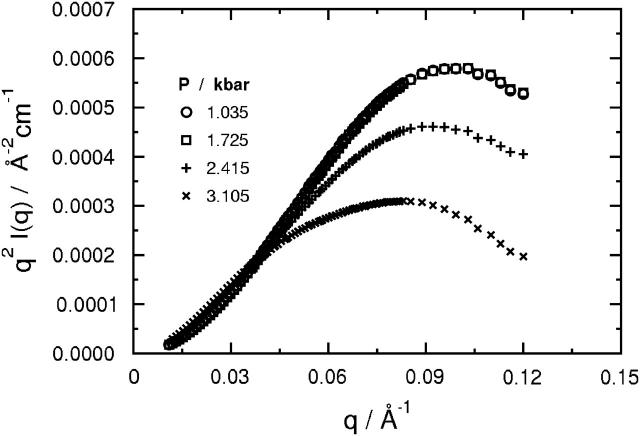
Kratky plots of q2I(q) versus q at the same four representative pressures are shown in Fig. 5. At 1.0 and 1.7 kilobars, these plots have a maximum characteristic of a globular protein (Semisotnov et al., 1996), and superimpose, indicating that SN has a globular shape over this pressure range, consistent with the P(r) in Fig. 3. This characteristic maximum persists at higher pressures, but is lower in magnitude and shifted to lower q-values, indicating an increase in Rg and a concomitant decrease in the overall compactness of the protein structure. The presence of a distinct maximum at 3.1 kilobars indicates that SN still retains its globular shape at this pressure.
FIGURE 5.
Kratky plots of q2I(q) as a function of q for a solution of 9.86 mg/ml SN in D2O and 50 mM bis-Tris-buffer at pH 5.5, 25°C, and selected pressures between 1.0 and 3.1 kilobars. The I(q) correspond to the fits of the data in Fig. 1 calculated from the P(r) in Fig. 3 using Eq. 2.
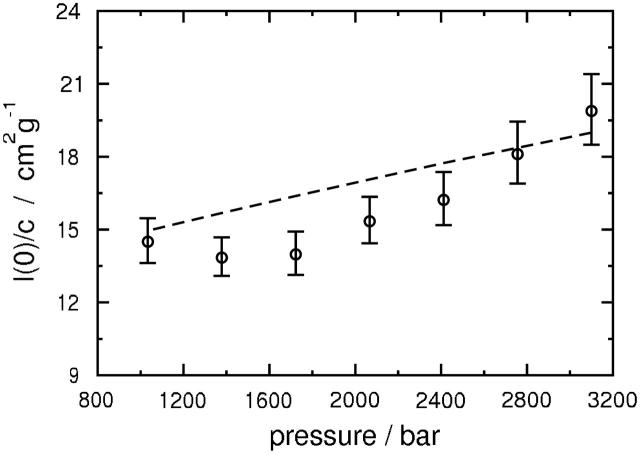
Forward scattering intensities obtained from P(r) using Eq. 4 and the Guinier analysis were also found to be in excellent agreement; therefore, only those values calculated from P(r) are shown in Fig. 6 where the forward scattering intensity divided by SN concentration is plotted as a function of pressure,
 |
(5) |
Here c is the protein concentration in mass per unit volume, NA is Avogadro's number, M is the protein molecular weight, ∑bi is the total scattering length of SN, Vp is the protein partial specific volume, and ρs is the scattering length density of the solvent. This quantity is constant within experimental uncertainties for pressures <1.7 kilobar, and then increases with pressure across the folding/unfolding transition. The increase in I(0)/c can be attributed to the effects of pressure on Vp, solvent density, and protein aggregation. We expect Vp to decrease with pressure, and the maximum change to be <1% over the pressure range of interest (Royer, 2002; Seemann et al., 2001). The decrease in Vp will also be offset by an increase in ρs through the solvent density, since these two quantities appear as a product in Eq. 5. Thus, the effect of pressure on the protein partial specific volume will have only a minor influence on the pressure dependence of I(0)/c. The effect of pressure on solvent density is reflected in both the protein concentration and the scattering length density of the solvent, and accounts for most but not all of the observed increase. The remaining contribution can be attributed to protein aggregation as a consequence of the pressure-induced unfolding of SN. Assuming a simple monomer-dimer equilibrium, this contribution amounts to the formation of ∼5% by weight SN dimers, which has only a minor effect on the calculated Rg and P(r).
FIGURE 6.
Pressure dependence of the forward scattering intensity normalized by the protein concentration for a solution of 9.86 mg/ml SN in D2O and 50 mM bis-Tris-buffer at pH 5.5 and 25°C. The dashed line is calculated from Eq. 5 using experimental liquid densities for D2O (Bridgman, 1935) and assuming a pressure-independent partial specific volume for SN of 0.708 cm3/g (Royer, 2002). Error bars account for uncertainties in both the measured protein concentration and I(0).
The free energy change and volume change for unfolding SN were estimated from a singular value decomposition (SVD) analysis (Segel et al., 1998) of the measured SANS spectra combined with a thermodynamic analysis based on the two-state model for the folding/unfolding transition. Pressure-independent P(r) for both the folded and pressure-unfolded states of SN were also derived. In the SVD analysis, the set of measured scattering spectra over the entire range of pressures, I(q,k), is expressed in the form a M × N matrix A with each column representing I(q) at a single pressure k. Here, M is the number of discrete measurements of I(q) in each scattering spectrum and N is the number of pressures at which these scattering intensities were measured. The matrix A is then expressed as a product of matrices,
 |
(6) |
where U is a M × N matrix with columns that form a complete set of orthogonal basis vectors, and P is the product of two matrices, one a N × N diagonal matrix with non-negative diagonal elements or the singular values corresponding to the weights of the basis vectors, and a second N × N matrix whose elements define the pressure dependences of these weights. Thus, each column of P contains the set of pressure-dependent superposition coefficients corresponding to each basis vector, such that the elements, a(q,k), of A representing the scattering wave vector q and the pressure k can then be written as
 |
(7) |
where uj(q) and pj(k) are elements of U and P, respectively. The truncated sum given by
 |
(8) |
is the optimal approximation to all a(q,k), when the standard deviation of the n-component fit to the data expressed as
 |
(9) |
approaches a value of 1.0 since each element of A is normalized by the experimental standard deviation corresponding to that measurement. The smallest value of n for which σn ∼ 1.0 is the minimum number of orthogonal basis functions needed to describe the entire data set to within experimental uncertainties. Here, we used the magnitudes of singular values, the q-dependence of the basis vectors, and σn ∼1.0 as the criteria for selecting this minimum number of basis functions.
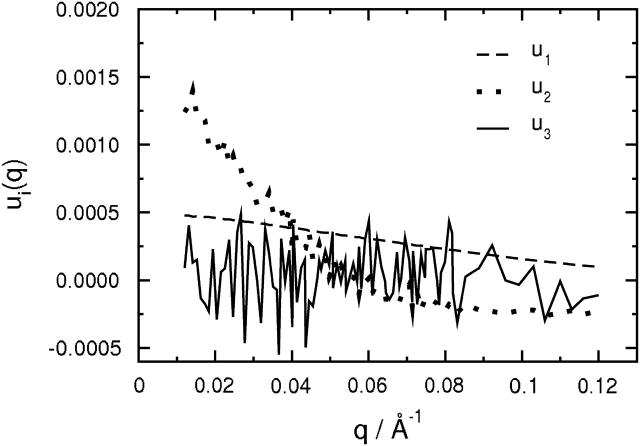
The scattering intensities used in the SVD analysis were derived from P(r) and were normalized to I(0) at 1.0 kilobar (Perez et al., 2001). We found that two basis vectors were needed to fit the entire set of measured I(q,k) to within experimental uncertainties. Fig. 7 illustrates this result by plotting the q-dependence of the first three basis vectors derived from the SVD analysis. Only the first two show meaningful q-dependences, whereas the third corresponds to noise. In Fig. 8, the measured I(q) at 1.0 and 3.1 kilobars are compared to spectra reconstructed using one (SVD-1) or two (SVD-2) basis vectors. The SVD-2 reconstruction clearly provides a more accurate representation of I(q) for both the folded and unfolded states.
FIGURE 7.
The first three basis functions, ui(q), i = 1,2,3 as a function of scattering angle, q, obtained from the SVD analysis of SANS spectra.
FIGURE 8.
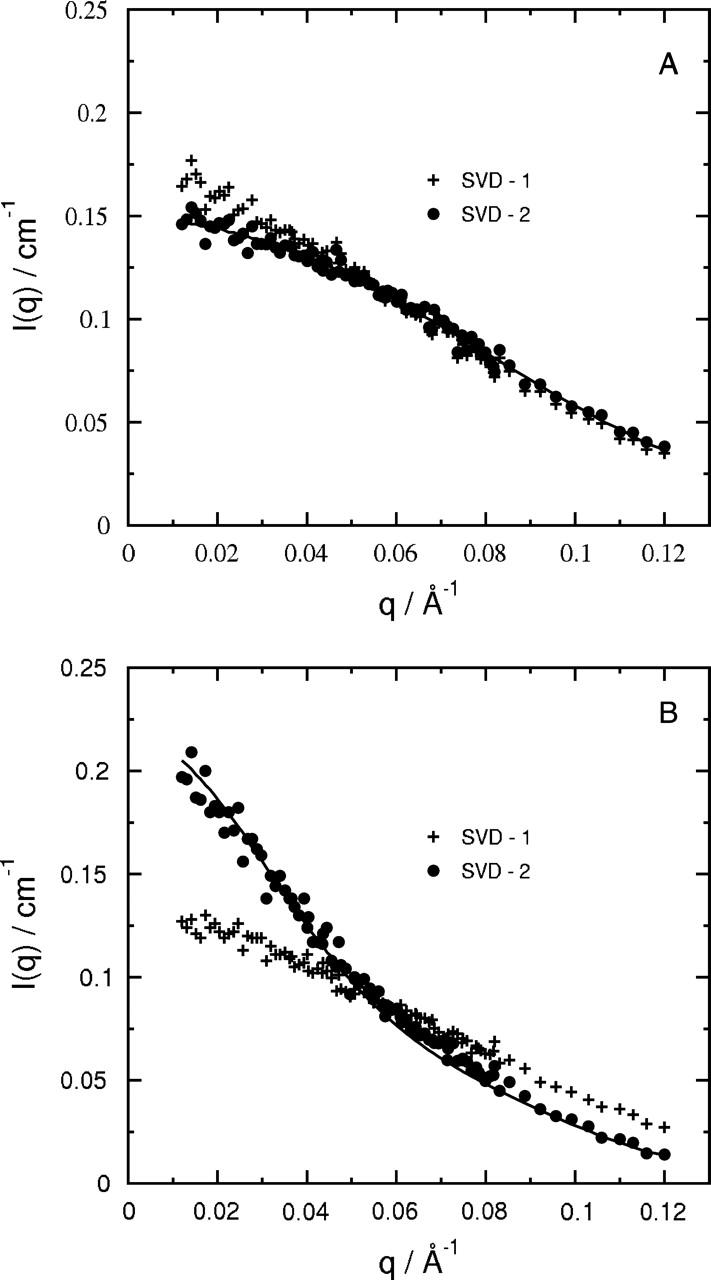
The one- and two-component SVD reconstruction of the SANS profiles. (A, B) Pressure values of 1.035 and 3.105 kbar, respectively. The line is I(q) derived from best-fit P(r), same as shown in Fig. 1.
Assuming a two-state model holds for the pressure-induced unfolding of SN, the measured scattering intensities at a given pressure k can be expressed as
 |
(10) |
where IF(q) and IU(q) are the pressure-independent scattering intensities for the folded and pressure-unfolded states, respectively, and fF(k) and fU(k) are the corresponding fractions of the molecules in each state. The free energy of unfolding, ΔG(p), is defined in terms of ratio of these fractions,
 |
(11) |
where
 |
(12) |
Here ΔG° and ΔV° are the free energy and the volume change of unfolding, respectively, at the reference pressure p0, which we take to be one atmosphere. From the SVD analysis, I(q,k) is expressed in terms of the two basis vectors, u1 and u2,
 |
(13) |
whereas IF(q) and IU(q) are given in terms of the same two basis vectors and their corresponding weights, p1 and p2,
 |
(14a) |
 |
(14b) |
Combining Eqs. 10, 13, and 14, we obtain the following relationships at each pressure k,
 |
(15) |
This set of equations is solved for fF(k) and fU(k) and the weights p1(k) and p2(k) for k = 1, 2, …, N to give ΔG° = 3.4 ± 0.6 kcal/mol and ΔV° = −58 ± 11 ml/mol. These values are in excellent agreement with those obtained from high-pressure fluorescence measurements: ΔG° = 3.2 ± 0.6 kcal/mol and ΔV° = −70 ± 10 ml/mol at 21°C (Panick et al., 1999); high-pressure Fourier-transform infrared spectroscopy: ΔG° = 4.0 ± 1.6 kcal/mol and ΔV° = −77 ± 20 ml/mol at 25°C (Panick et al., 1998); and high-pressure NMR measurements: ΔG° = 3.2 ± 0.5 kcal/mol and ΔV° = −83.3 ± 20 ml/mol at 24°C (Lassalle et al., 2000).
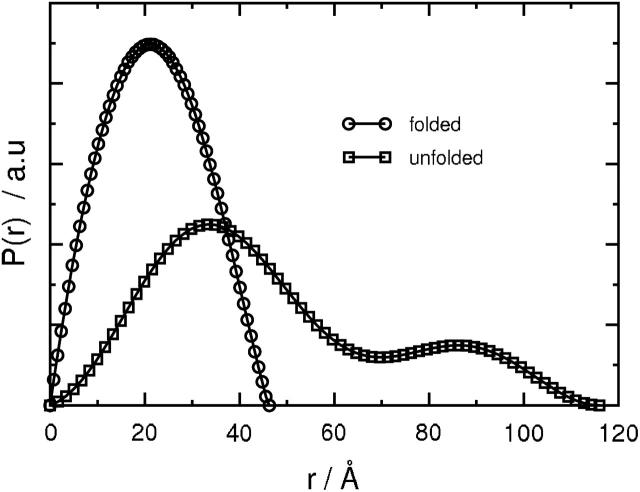
The SVD analysis also gives I(q) for the folded and the pressure-unfolded states of SN, which can be converted into pressure-independent pair distance distribution functions for these two states. The results are shown in Fig. 9. For the folded state, the P(r) is unimodal with Dmax ∼ 46 Å, whereas for the pressure-unfolded state, a bimodal P(r) is obtained with Dmax ∼ 115 Å.
FIGURE 9.
Pressure-independent pair distance distribution functions for the folded and pressure-unfolded states of SN obtained from the SVD analysis assuming a two-state model for the folding/unfolding transition of this protein.
Molecular dynamics simulations
The native structure of SN was taken from the crystal structure determined by Hynes and Fox (1991). This structure was inserted into a cubic box ∼74 Å on a side containing 13,705 TIP3P water molecules (Neria et al., 1996). Water molecules within 4 Å of the heavy atoms of SN were then removed, resulting in 11,891 water molecules in the system. The native state of SN was simulated using NAMD (Kalé et al., 1999) and the CHARMM27 force field (MacKerell et al., 2000). Configurations were saved every 1 ps during a 1-ns constant NPT simulation with a time step of 1 fs after equilibrating the system for 200 ps. The system temperature was held constant at 298 K by applying the Langevin dynamics method to all nonhydrogen atoms with a damping coefficient of 1 ps−1. The system pressure was maintained at 1 bar using a Nosé-Hoover Langevin piston (Hoover, 1985) with a period of 200 fs and a decay set to 100 fs. Periodic boundary conditions were imposed and electrostatic interactions determined using the particle-mesh Ewald method implemented in NAMD (Darden et al., 1993). A cutoff of 12 Å was applied to nonbonded and direct electrostatic interactions. Water hydrogen-oxygen bond lengths were constrained to within 10−5 Å using the SHAKE algorithm (Ryckaert et al., 1977). These procedures were also applied to all subsequent simulations at higher pressures.
Previous simulations of protein unfolding after a pressure jump showed only the elastic relaxation of the protein in response to hydrostatic pressure (Paci, 2002). Moreover, the application of several kilobars of pressure in MD simulations slows protein conformational dynamics to such an extent that the observation times for unfolding become prohibitively large even for current high-performance computing capabilities (Bagchi et al., 1997). To circumvent these constraints, we combined random insertions of water into the protein interior with MD simulations at progressively higher pressures to produce the onset of pressure unfolding. The procedure we derived is as follows. The final configuration from the MD simulation of SN at 25°C and 1 bar was taken and contact pairs of amino acids within the protein interior were identified. The interior of SN consists of 28 amino acids that are solvent-inaccessible as determined by the DSSP algorithm (Kabsch and Sander, 1983) implemented in ASA-View (Ahmad et al., 2004). These amino acids are listed in Table 1. As expected, most of the residues are hydrophobic. A pair of residues in the interior was defined to be in contact if the distance between their respective β-carbon atoms was <7 Å. For glycine, this distance was calculated from α-carbon atom. We identified 59 such contact pairs for the native state of SN. Next, a water molecule from the surrounding bulk solution was randomly inserted at a point along the line that defined each contact pair. Since the protein interior is well packed, there are few cavities large enough to accommodate a water molecule. Thus, the insertions invariably produced high-energy steric overlaps that needed to be eliminated. This procedure involved first minimizing the total energy of the system with the inserted water molecules held fixed to remove overlaps between these water molecules and the surrounding amino acids, followed by a second energy minimization to remove overlaps between the inserted water molecules themselves. The two minimizations were carried out for 5000 and 1000 steps, respectively, and were followed by a 50-ps MD simulation to anneal the system. After 10 cycles of energy minimization and annealing, the number of contact pairs was reduced by ∼50% with no decrease in this number observed over the last few cycles. A 1-ns MD simulation was then performed at 25°C and 1 bar. Additional water molecules were then inserted into the final configuration from this simulation using the same procedure without the annealing step. After 10 cycles, the system pressure was gradually increased to 2 kilobars in a 250-ps MD simulation. Subsequent pressure jumps in increments of 2 kilobars were performed following this procedure. The number of contact pairs became invariant at ∼16–18 for pressure jumps to 6 and 8 kilobars; therefore, 8 kilobars was taken to be the pressure for a 3-ns MD simulation.
TABLE 1.
Amino acids defining the solvent-inaccessible interior of SN
| Asp19 | Val39 | Gly88 | Leu103 |
| Gly20 | Gly55 | Ala90 | Val104 |
| Asp21 | Ala58 | Tyr91 | Gly107 |
| Val23 | Thr62 | Ile92 | Ala109 |
| Leu25 | Val66 | Ala94 | Asn118 |
| Phe34 | Val74 | Val99 | Leu125 |
| Leu36 | Asp77 | Asn100 | Ala13 |
Fig. 10 shows representative structures for SN in the folded state at 1 bar and in three different stages of unfolding at various times during this 8-kilobar MD simulation. Also shown is the P(r) for each structure calculated using CRYSON (Svergun et al., 1995) and GNOM (Svergun, 1991). For SN in the folded state (Fig. 10 A), P(r) is unimodal, as expected for the globular structure depicted, with Dmax ∼40 Å. The slightly smaller Dmax compared to Dmax ∼46 Å obtained from SANS (Fig. 9) can be attributed to 13 missing amino acid residues from the terminal loop regions in the crystal structure that was used in MD simulations. This structure for the folded state of SN is significantly different from that at the beginning of the 8-kilobar simulation (Fig. 10 B). Of the three major helices in the folded structure, only the C-terminal helix remains essentially intact, whereas the other two become partially unraveled. In addition, the β-barrel in the folded state has all but disappeared, although some residual β-sheet structure persists. The distinguishing feature of SN in this initial 8-kilobar state is its expanded structure relative to the folded state. This expansion is also reflected in the calculated P(r), which remains unimodal, but has broadened, and Dmax has also increased to ∼53 Å. Some clustering of amino acids into two subdomains can also be seen, which becomes more apparent in the 1.5-ns structure (Fig. 10 C). This structure clearly depicts the two subdomains—the smaller one contains the stable C-terminal helix, and the larger one contains a remnant of the β-barrel and the N-terminal loop region. The calculated P(r) continues to broaden, and Dmax has now increased to nearly 60 Å. At 2.5 ns (Fig. 10 D), the two subdomains have moved further apart, and P(r) now shows bimodal character with a distinct shoulder on the original unimodal distribution. Also shown in this panel is P(r) calculated for the protein excluding the smaller subdomain. The resulting distribution is unimodal with a peak that corresponds to the primary peak of the original bimodal distribution and the shoulder has now completely disappeared, suggesting that this shoulder corresponds to the smaller subdomain. As the protein expands during the simulation, the possibility exists that it can interact with its periodic images. We determined that protein atoms in adjoining unit cells were at least 20 Å apart in the most expanded state corresponding to the maximum Rg at the end of the 3-ns trajectory, which is sufficiently far apart to dismiss artifacts that might arise due to such protein-protein interactions.
FIGURE 10.
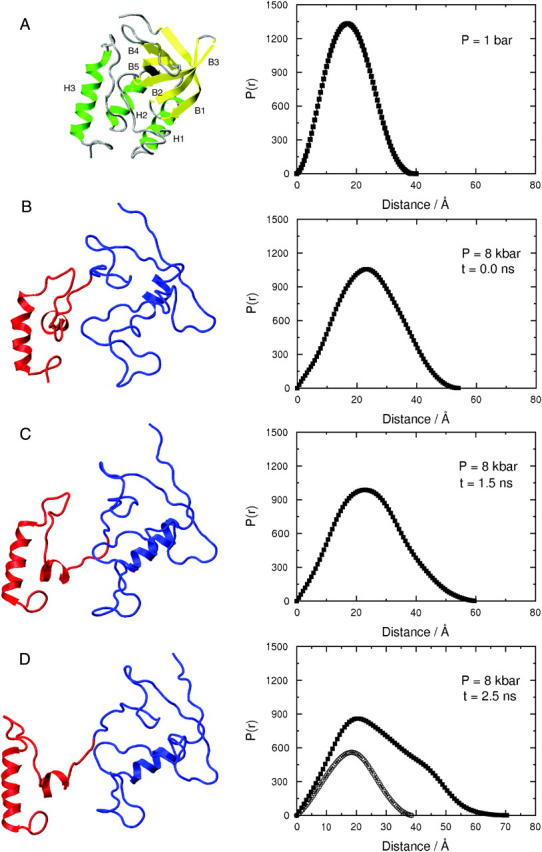
Representative structures of SN and the corresponding pair distance distribution functions derived from MD simulation. (A) The structure in the folded state at 1 bar. Helices (green) are marked H1–3 and β-strands (yellow) as B1–5. (B–D) Structures at 8 kilobars and time intervals of 0, 1.5, and 2.5 ns, respectively. The two subdomains are shown in red and blue. The units of P(r) are arbitrary.
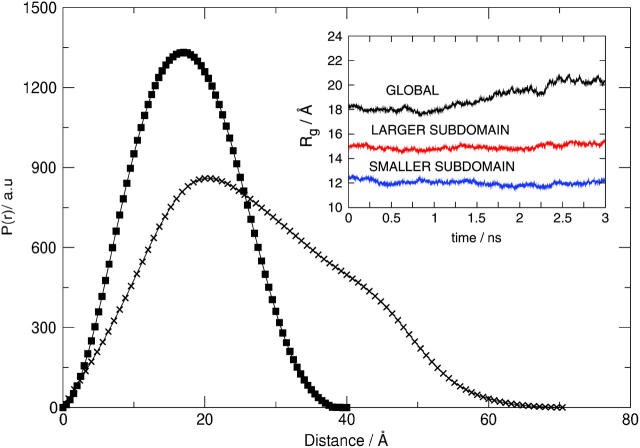
Fig. 11 shows P(r) obtained from simulation for the folded state of SN at 1 bar and for the partially unfolded state at 2.5 ns into the MD simulation at 8 kilobars. These two distributions are qualitatively similar to the two distributions for the folded and unfolded states of SN derived from the SANS spectra (Fig. 9). The inset of Fig. 11 shows radii of gyration for the two subdomains and the entire protein as a function of time over the entire 3-ns MD simulation. The radii of gyration for the two subdomains are essentially constant at roughly 12.5 and 15.0 Å over the entire trajectory. In contrast, Rg for the protein increases from ∼18 to 20.5 Å during the 3-ns trajectory, which indicates that the increase in Rg as the protein unfolds is in large part due to the relative motion of the two subdomains as they move apart. The Rg of 20.5 Å at the end of the 3-ns trajectory is close to the midpoint of the folding/unfolding transition in Fig. 4 when the correction is made for the missing 13 amino acids in the crystal structure used in the MD simulations. Thus, this trajectory roughly corresponds to the initial stages of unfolding.
FIGURE 11.
Pair distance distribution functions derived from MD simulations of SN in the folded state at 1 bar and in a partially unfolded state at 8 kilobars and 2.5 ns. (Inset) The radius of gyration for the two subdomains of SN (see D in Fig. 10) and the entire protein as a function of time derived from the MD simulation at 8 kilobars.
DISCUSSION
The picture that emerges from the SANS measurements of the pressure-induced unfolding of SN is remarkably similar to that derived from earlier high-pressure SAXS measurements (Panick et al., 1998). Both studies show an approximately twofold increase in Rg across the folding/unfolding transition, such that the values of Rg at 3.1 kilobars and 25°C (Fig. 4) are within experimental uncertainties: 35 ± 2.1 Å (SANS) and 37 ± 1.4 Å (SAXS). In addition, the P(r) derived from SANS and SAXS spectra show a similar broadening with a transition from a unimodal to a bimodal distribution as the protein unfolds, indicating that pressure denaturation produces a globular structure that is less compact and elongated relative to the native structure. These distributions also yield similar values for Dmax of the folded and unfolded structures. From SANS, the values are 48 and 110 Å, respectively, compared with 45–48 and 112 Å, respectively, obtained from SAXS. This picture of unfolding is also supported by Kratky plots of the SANS spectra (Fig. 5). The shift in the characteristic maximum in these plots to lower q with increasing pressure provides further evidence that the globular structure of SN is retained whereas the overall compactness decreases across as the protein unfolds. Conversely, Kratky plots of SAXS spectra for the urea-unfolded state have no maximum over a q-range that extends to much higher q; rather, q2I(q) increases almost linearly with q as expected for a Kratky-Porod or persistent coil (Flanagan et al., 1993). Urea denaturation of SN nonetheless produces an unfolded state with a similar Rg ∼33 Å at 8 M urea (Flanagan et al., 1993), and with residual secondary structure identified as a remnant of the β-barrel in native SN that is stabilized by local, non-native interactions with a cluster of four hydrophobic residues (Wang and Shortle, 1995; From and Bowler, 1998). The hydrophobic core of native SN consisting of this β-barrel and portions of two α-helices, which contribute to the stabilization of this residual secondary structure, is thought to also play an important role in the overall topology of the unfolded state of SN (Flanagan et al., 1993, 1992; Wang and Shortle, 1995; Shortle and Abeygunawardana, 1993; Shortle et al., 1990). The pressure unfolded state of SN likewise retains β-like residual secondary structure as revealed by high-pressure Fourier-transform infrared spectroscopy (Panick et al., 1998). In contrast, thermal denaturation produces an unfolded structure with a significantly larger Rg ∼45 Å at 65°C and ambient pressure (Panick et al., 1998), that is close to the value expected for a random coil polymer of the same chain length (Miller and Goebel, 1968), and with essentially no residual secondary structure (Panick et al., 1998). These comparisons support the view that the pressure-unfolded structure of SN is globular, although swollen and elongated relative to the native structure with significant residual secondary structure that reflects the stability of the hydrophobic core of the native structure. Indeed, it is the partial destabilization of this hydrophobic core brought about by water penetration at high pressures that we exploit in our MD simulations to initiate unfolding.
A key structural feature of the unfolded state of SN is its bimodal P(r), which is observed for a broad class of compact unfolded states—e.g., thermally denatured ribonuclease A (Sosnick and Trewhella, 1992), a stable intermediate in the acid denaturation of apomyoglobin (Gast et al., 1994), and a truncated form of SN (WT SNΔ) that is a stable analog of the unfolded state (Flanagan et al., 1993)—although a variety of bimodal distributions have been obtained ranging from a pronounced shoulder on the primary peak to a well-developed second peak. Lattman et al. (1994) found that the clustering of hydrophobic amino acids in particular leads to a bimodal P(r) for amino acid sequences modeled as hydrophobic or polar monomers on three-dimensional cubic lattices, and thus, proposed defining compact unfolded states based on the extent of hydrophobic clustering. Within the context of their model, a bimodal P(r) correlated with the formation of multiple hydrophobic clusters in lattice chain conformations of intermediate compactness. On the other hand, unimodal distributions tended to arise from chain conformations with single hydrophobic clusters. Other structural properties—e.g., radii of gyration, principal axes of rotation, or moments of inertia—showed no such correlations. To some extent, these ideas have already been incorporated into a model for the unfolded state of SN, as well as for WT SNΔ. A number of experimental studies have shown that the primary hydrophobic core in native SN persists in some form in the unfolded state, as discussed above, whereas other studies (Shortle et al., 1990) have shown that a secondary hydrophobic cluster in the native structure is likewise implicated in the unfolded structure. The MD simulation results (Fig. 10) show that the bimodal P(r) for the pressure unfolded state arises as the protein expands to form two subdomains that effectively diffuse apart during initial stages of unfolding. These two subdomains correspond to two hydrophobic clusters as suggested by Lattman et al. (1994)—the larger one consists of a remnant of the β-barrel in the folded state (amino acids 1–98) and the smaller one includes the two helices near the C-terminal of the protein (amino acids 99–149). The initial stages of the unfolding trajectory can be described by a collective, rigid-body motion of the C-terminal helical subdomain away from the larger subdomain, as seen in the time dependence of the radii of gyration for the two subdomains compared to that for the entire protein (Fig. 11). The radii of gyration for the subdomains are constant over the entire trajectory, whereas the radius of gyration for the protein increases as the protein begins to unfold. The importance of these two subdomains in SN folding/unfolding was first recognized by Anfinsen (1972) who proposed that the folding/unfolding transition could be understood in terms of folding/unfolding for the subdomains and the conformational equilibrium between transiently folded subdomains and the tertiary structure of the folded protein. Carra et al. (1994) have since shown that SN unfolding proceeds in two distinct stages, as indicated by two separate heat absorption peaks in the calorimetric melting profile for the protein. The separate peaks were interpreted as originating from the sequential, cooperative unfolding of the two subdomains, which further supports the view that the folding/unfolding transition for SN is organized around two folding centers corresponding to these two subdomains.
The question that naturally arises is: How does the mechanism of water insertions into the protein interior, coupled with the application of pressure that we exploit in our MD simulations to initiate unfolding, lead to the formation of these two subdomains? To answer this question, we generated hydrophobic contact maps from MD simulations of SN in the native state and at 1 bar and 8 kilobars after repeated cycles of water insertions as described above. These maps are shown in Fig. 12. In the native state (Fig. 12 A), there are 34 hydrophobic contacts between the two subdomains, of which 15 are between pairs of solvent-inaccessible amino acids. These 15 hydrophobic contacts are therefore included in the 59 “buried” contact pairs we probed by water insertions. After water insertions at 1 bar (Fig. 12 B), we obtain an average number of 14 hydrophobic contacts between the two subdomains during the first 50 ps of MD simulation at this pressure, and 19 hydrophobic contacts during the last 50 ps of this 1-ns simulation. The increase in hydrophobic contacts between the two subdomains implies that these contacts are stable at 1 bar, and therefore, the water molecules inserted between hydrophobic contact pairs of amino acids do not remain there. In contrast, only five hydrophobic contacts are found between the subdomains during the first 50 ps of MD simulation at 8 kilobars after water insertions at this pressure (Fig. 12 C). This number also decreases to two contacts in a 50-ps interval after 2 ns of MD simulation, indicating that the hydrophobic contacts are destabilized at high pressure. Thus, water insertions alone do not lead to the destabilization of hydrophobic contacts between the two subdomains that appear in the early stages of SN unfolding; pressure must also be applied. Destabilization of these “buried” hydrophobic contacts by water intercalation at high pressure is in essence the mechanism of pressure denaturation of proteins proposed by Hummer et al. (1998). The importance of water in addition to applied pressure was highlighted in an experimental study of pressure-induced dissociation unfolding of the Arc repressor protein (Oliveira et al., 1994), where it was found that adding glycerol as a cosolvent to water increases the pressure required for unfolding. An extrapolation to zero water concentration led to the conclusion that this protein would not pressure-unfold in the absence of water; therefore, water is crucial for pressure-induced protein unfolding.
FIGURE 12.
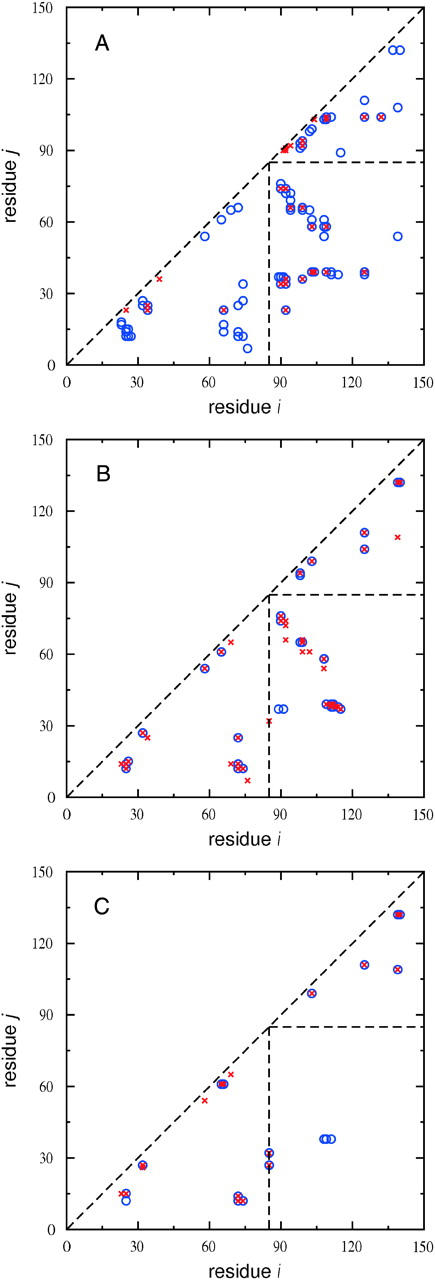
Hydrophobic contact maps of SN calculated from MD simulations of the native state (A) and at 1 bar (B) and 8 kilobars (C) after water insertions as described in the text. The point (i,j) represents a contact between hydrophobic residues i and j if the distance between their β-carbon atoms is <7 Å. This distance is calculated from the α-carbon atom for glycine. All contacts have an occurrence probability >0.5 in the sampled interval of the MD simulation. Contacts are not represented for |i−j| ≤ 3 in A–C. (A) Unfilled circles represent all hydrophobic contacts, and crosses represent those probed by water insertions. (B, C) Unfilled circles represent hydrophobic contacts found in the first 50 ps of MD simulation and crosses represent hydrophobic contacts found in a 50-ps interval at 1 ns (B) and 2 ns (C) of MD simulation. The dashed lines divide contacts into three regions: the two triangles define contacts within the two subdomains of SN, and the lower right-hand rectangle defines contacts between the two subdomains.
Studies of protein denaturation, in general, can be complicated by aggregation as the protein unfolds. The occurrence of aggregation is observed in small-angle scattering experiments as an upturn in I(q) at low q, and a concomitant increase in I(0). An increase in I(0) across the folding/unfolding transition has been observed in a number of SAXS studies of protein denaturation (Sosnick and Trewhella, 1992; Chen et al., 1998; Segel et al., 1999). Although the presence of protein aggregates was not ruled out in these studies, the increase in I(0) was attributed primarily to an increase in the hydration layer of unaggregated protein due to greater solvent accessibility in the unfolded state. Since the density, and therefore, the scattering length density of the hydration layer is greater than that of bulk solvent (Svergun et al., 1998; Merzel and Smith, 2002), the effect is to enhance the SAXS contrast leading to an increase in I(0) across the folding/unfolding transition. We note, however, one SAXS study of the refolding of cytochrome c (Segel et al., 1999) in which the observed increase in I(0) was attributed explicitly to protein dimerization. The increase in I(0)/c with pressure-unfolding observed in our SANS experiments (Fig. 6) was attributed to the effect of increasing pressure on solvent density and protein aggregation due to the pressure-induced unfolding of SN. A change in the hydration layer of SN across the folding/unfolding transition was not invoked. Assuming complete H/D exchange for SN in D2O, the mean scattering length density of the protein is 3.4 × 1010 cm−2 compared to a scattering length density of 6.4 × 1010 cm−2 for D2O. An enhancement in the hydration layer of SN would therefore increase the mean scattering length density of the protein relative to that for D2O, thus lowering the SANS contrast. The effect produces a decrease in I(0) with pressure. Since the opposite behavior is observed, we ruled out changes in the hydration layer of SN as a contributing factor to the pressure dependence of I(0). We note that the observed effect of pressure on I(0) is entirely reversible, suggesting that any aggregation of pressure-unfolded SN is also reversible.
Our SVD analysis of the SANS spectra combined with a two-state thermodynamic model for the folding/unfolding transition yielded a negative volume change for unfolding, ΔV° = −58 ± 11 ml/mol, as expected. The radius of gyration of SN, however, increases by a factor of 2 as the protein unfolds. These results imply that the expanded (unfolded) protein and water pack more efficiently; consequently the solution has a lower total volume at higher pressures. A similar finding was noted by Hummer et al. (1998) in their simulation study of the potential of mean force between two nonpolar molecules in water as a function of pressure. In that study, pressure was found to destabilize the contact configuration between the two molecules relative to a solvent-separated configuration in which a single water molecule is inserted between them. The volume change for the transition from this contact configuration to the solvent-separated configuration is negative, and the radius of gyration for the pair of nonpolar solutes clearly increases as the two molecules move apart.
CONCLUSIONS
We have presented the results of a SANS study of the pressure-induced folding/unfolding transition of SN complemented by MD simulations in which unfolding was induced by randomly inserting water molecules into the protein interior and applying pressure. The SANS results are in excellent quantitative agreement with earlier work—high-pressure SAXS measurements (Panick et al., 1998), in particular—that showed the protein structure in the unfolded state to be globular, although less compact and elongated relative to the native structure. The MD simulations of SN unfolding captured these structural features at the level of qualitatively predicting the behavior of a key experimental descriptor of the unfolding trajectory; i.e., the transition from a unimodal to a bimodal P(r) as SN unfolds. The simulations also provided additional, molecular-level insights into SN unfolding. Specifically, we were able to interpret the bimodal P(r) for the pressure-unfolded state in terms of the separation of two subdomains in the native structure that effectively diffuse apart during unfolding. Another key finding obtained from simulation was the destabilization of hydrophobic contacts between these two subdomains as a result of water insertions at high pressures; these contacts were found to be stable in response to water insertions at atmospheric pressure. Thus, we have shown that high pressure in addition to water insertions into the hydrophobic core is required to induce protein unfolding, as proposed by Hummer et al. (1998).
Although limited to the initial stages of SN unfolding, the insights obtained from simulation proved to be valuable in interpreting our SANS results. Still, several improvements to the water insertion algorithm and the unfolding simulation itself can be made to enhance the utility of the simulations. The most obvious improvement would be to extend the simulations to trajectories further along the unfolding pathway—optimally, to the unfolded state. The complete unfolding trajectory would permit an unequivocal comparison of structural properties of the unfolded state derived from the SANS measurements with those calculated from the simulation, which is likely to offer new insights into the structure of the unfolded state. Extending the current MD simulations of SN unfolding will, however, require modifications to the method described above. Specifically, the SANS results indicate that the maximum dimension of SN in the unfolded state is ∼110 Å, whereas the maximum dimension obtained at the end of the current 3-ns MD simulation is ∼70 Å. Extending the unfolding trajectory will therefore require further elongation of the protein, which can be accommodated in the simulations by allowing the dimensions of the simulation box to be adjusted under the constraint that interactions of the protein with its periodic images remain insignificant. The current MD simulations did not allow for these adjustments, and as such, was limited to 3 ns to avoid protein-protein interactions that could potentially produce artifacts in the unfolding trajectory. The water insertion algorithm can also be improved by including additional pairs of amino acids; notably, those hydrophobic amino acids that are partially solvent-accessible. For example, an inspection of the hydrophobic contact maps at 1 bar (Fig. 12 B) and 8 kilobars (Fig. 12 C) indicates that some native contacts between buried amino acids and hydrophobic amino acids that are partially solvent-accessible persist at 8 kilobars. Contact pairs formed by Ala12 with Val74 and with Ile72 are two such contacts for which the mutations, V74G and I72G, are known to be destabilize the native structure (Shortle et al., 1990). Probing the stability of these contact pairs by water insertions would allow us to determine whether further unfolding of SN at high pressure could be achieved by the destabilization of such persistent contacts.
Finally, we have demonstrated that small-angle scattering measurements augmented by MD simulations can provide valuable complementary information about the pressure denaturation of proteins. The small-angle scattering experiments probe both the size and shape of the species under study with a spatial resolution on the order of nanometers, and can be used to calculate thermodynamic quantities—most notably, the free energy and volume change of unfolding. The MD simulations add to this information a molecularly detailed description of the system at higher spatial resolution on the order of Angströms, and the temporal evolution of the system on timescales of nanoseconds during unfolding. Clearly, our understanding of pressure denaturation and the pressure-unfolded states of proteins, in particular, as well as other self-assembly processes, such as amyloid fibril formation or protein aggregation, can benefit from the combined use of SANS and MD simulations in an approach, such as the one described herein.
Acknowledgments
We thank Bertrand Garcia-Moreno for access to his laboratory for protein purification and characterization, Boulem Hammouda for technical assistance on high-pressure SANS, Shekhar Garde and Tuhin Ghosh for their comments on the simulations, and Henry Ashbaugh, Lawrence Pratt, Gerhard Hummer, and Angel García for numerous insightful discussions over the years.
Financial support from the National Science Foundation (CTS-0078491), a Burroughs Wellcome Fund Predoctoral Fellowship for A.P., and a Camille and Henry Dreyfus Foundation Postdoctoral Fellowship for D.P.B. are gratefully acknowledged. This work is also based upon activities supported by the National Science Foundation under agreement No. DMR-9986442. The work was also supported in part by the National Institutes of Health (grant no. R01 RR14812) and Regents of the University of California. The work at Los Alamos was supported by the U.S. Department of Energy, Contract No. W-7405-ENG-36, under the LDRD program at Los Alamos.
Trade names mentioned do not imply endorsement by the National Institute of Standards and Technology.
Dilipkumar Asthagiri's present address is Group T-12, Los Alamos National Laboratory, Los Alamos, NM 87544.
Dobrin P. Bossev's present address is Dept. of Physics, Indiana University, Bloomington, IN 47405.
References
- Ahmad, S., M. M. Gromiha, H. Fawareh, and A. Sarai. 2004. ASA view: solvent accessibility graphics for proteins. BMC Bioinform. 5:1–12. [DOI] [PMC free article] [PubMed] [Google Scholar]
- Anfinsen, C. B. 1972. The formation and stabilization of protein structure. Biochem. J. 128:737–749. [DOI] [PMC free article] [PubMed] [Google Scholar]
- Bagchi, K., S. Balasubramanian, and M. L. Klein. 1997. The effects of pressure on structural and dynamical properties of associated liquids: molecular dynamics calculations for the extended simple point charge model of water. J. Chem. Phys. 107:8561–8567. [Google Scholar]
- Baldwin, R. L. 1986. Temperature-dependence of the hydrophobic interaction in protein folding. Proc. Natl. Acad. Sci. USA. 83:8069–8072. [DOI] [PMC free article] [PubMed] [Google Scholar]
- Barker, J. G., and J. S. Pedersen. 1995. Instrumental smearing effects in radially symmetrical small-angle neutron-scattering by numerical and analytical methods. J. Appl. Crystallogr. 28:105–114. [Google Scholar]
- Bonafe, C. F., C. M. Vital, R. C. Telles, M. C. Goncalves, M. S. Matsuura, F. B. Pessine, D. R. Freitas, and J. Vega. 1998. Tobacco Mosaic virus disassembly by high hydrostatic pressure in combination with urea and low temperature. Biochemistry. 37:11097–11105. [DOI] [PubMed] [Google Scholar]
- Bridgman, P. W. 1935. The pressure-volume-temperature relations of the liquid, and the phase diagram of heavy water. J. Chem. Phys. 3:597–605. [Google Scholar]
- Carra, J. H., E. A. Anderson, and P. L. Privalov. 1994. Three-state thermodynamic analysis of the denaturation of Staphylococcal nuclease mutants. Biochemistry. 33:10842–10850.8075087 [Google Scholar]
- Carra, J. H., and P. L. Privalov. 1995. Energetics of denaturation and m-values of Staphylococcal nuclease mutants. Biochemistry. 34:2034–2041. [DOI] [PubMed] [Google Scholar]
- Chen, L., G. Wildegger, T. Kiefhaber, K. O. Hodgson, and S. Doniach. 1998. Kinetics of lysozyme refolding: structural characterization of a non-specifically collapsed state using time-resolved x-ray scattering. J. Mol. Biol. 276:225–237. [DOI] [PubMed] [Google Scholar]
- Da Poian, A. T., A. C. Oliveira, L. P. Gaspar, J. L. Silva, and G. Weber. 1993. Reversible pressure dissociation of R17 bacteriophage. The physical individuality of virus particles. J. Mol. Biol. 231:999–1008. [DOI] [PubMed] [Google Scholar]
- Da Poian, A. T., J. E. Johnson, and J. L. Silva. 1994. differences in pressure stability of the three components of Cowpea Mosaic virus: implications for virus assembly and disassembly. Biochemistry. 33:8339–8346. [DOI] [PubMed] [Google Scholar]
- Darden, T., D. York, and L. Pedersen. 1993. Particle mesh Ewald—an n·log(n) method for Ewald sums in large systems. J. Chem. Phys. 98:10089–10092. [Google Scholar]
- Dill, K. A. 1990. Dominant forces in protein folding. Biochemistry. 29:7133–7155. [DOI] [PubMed] [Google Scholar]
- Ferdinand, S. 2000. Pressure-induced changes in microstructure of oil-in-water microemulsions. M.S. Thesis. Johns Hopkins University, Baltimore, MD.
- Flanagan, J. M., M. Kataoka, D. Shortle, and D. M. Engelman. 1992. Truncated Staphylococcal nuclease is compact but disordered. Proc. Natl. Acad. Sci. USA. 89:748–752. [DOI] [PMC free article] [PubMed] [Google Scholar]
- Flanagan, J. M., M. Kataoka, T. Fujisawa, and D. Engelman. 1993. Mutations can cause large changes in the conformation of a denatured protein. Biochemistry. 32:10359–10370. [DOI] [PubMed] [Google Scholar]
- Foguel, D., M. C. Suarez, A. D. Ferrão-Gonzales, T. C. R. Porto, L. Palmieri, C. M. Einsiedler, L. R. Andrade, H. A. Lashuel, P. T. Lansbury, J. W. Kelly, and J. L. Silva. 2003. Dissociation of amyloid fibrils of α-synuclein and transthyretin by pressure reveals their reversible nature and the formation of water-excluded cavities. Proc. Natl. Acad. Sci. USA. 100:9831–9836. [DOI] [PMC free article] [PubMed] [Google Scholar]
- From, N. B., and B. E. Bowler. 1998. Urea denaturation of Staphylococcal nuclease monitored by Fourier transform infrared spectroscopy. Biochemistry. 37:1623–1631. [DOI] [PubMed] [Google Scholar]
- Frye, K. J., C. S. Perman, and C. A. Royer. 1996. Test the correlation between ΔA and ΔV of protein unfolding using m-value mutants of Staphylococcal nuclease. Biochemistry. 35:10234–10239. [DOI] [PubMed] [Google Scholar]
- Gast, K., H. Damaschun, R. Misselwitz, M. Müller-Frohne, D. Zirwer, and G. Damaschun. 1994. Compactness of protein molten globules: temperature-induced structural changes of apomyoglobin folding intermediates. Eur. Biophys. J. 23:297–305. [DOI] [PubMed] [Google Scholar]
- Glatter, O., and O. Kratky. 1982. Small Angle X-Ray Scattering. Academic Press, New York.
- Gorovits, B. M., and P. M. Horowitz. 1998. High hydrostatic pressure can reverse aggregation of protein folding intermediates and facilitate acquisition of the native structure. Biochemistry. 37:6132–6135. [DOI] [PubMed] [Google Scholar]
- Griko, Y. V., P. L. Privalov, J. M. Sturtevant, and S. Venyaminov. 1988. Cold denaturation of Staphylococcal nuclease. Proc. Natl. Acad. Sci. USA. 85:3343–3347. [DOI] [PMC free article] [PubMed] [Google Scholar]
- Hoover, W. G. 1985. Canonical dynamics: equilibrium phase-space distributions. Phys. Rev. A. 31:1695–1697. [DOI] [PubMed] [Google Scholar]
- Hummer, G., S. Garde, A. E. Garcia, M. E. Paulaitis, and L. R. Pratt. 1998. The pressure dependence of hydrophobic interactions is consistent with the observed pressure denaturation of proteins. Proc. Natl. Acad. Sci. USA. 95:1552–1555. [DOI] [PMC free article] [PubMed] [Google Scholar]
- Hynes, T. R., and R. O. Fox. 1991. The crystal-structure of Staphylococcal nuclease refined at 1.7 Å resolution. Proteins Struct. Funct. Genet. 10:92–105. [DOI] [PubMed] [Google Scholar]
- Ionescu, R. M., and M. R. Eftink. 1997. Global analysis of the acid-induced and urea-induced unfolding of Staphylococcal nuclease and two of its variants. Biochemistry. 36:1129–1140. [DOI] [PubMed] [Google Scholar]
- Kabsch, W., and C. Sander. 1983. Dictionary of protein secondary structure: pattern recognition of hydrogen-bond and geometrical features. Biopolymers. 22:2577–2637. [DOI] [PubMed] [Google Scholar]
- Kalé, L., R. Skeel, M. Bhandarkar, R. Brunner, A. Gursoy, N. Krawetz, J. Phillips, A. Shinozaki, K. Varadarajan, and K. Schulten. 1999. NAMD2: greater scalability for parallel molecular dynamics. J. Comput. Phys. 151:283–312. [Google Scholar]
- Kauzmann, W. 1959. Some factors in the interpretation of protein denaturation. Adv. Protein Chem. 14:1–63. [DOI] [PubMed] [Google Scholar]
- Kauzmann, W. 1987. Thermodynamics of unfolding. Nature. 325:763–764. [Google Scholar]
- Lassalle, M. W., H. Yamada, and K. Akasaka. 2000. The pressure-temperature free energy-landscape of Staphylococcal nuclease monitored by 1H NMR. J. Mol. Biol. 298:293–302. [DOI] [PubMed] [Google Scholar]
- Lattman, E. E., K. M. Fiebig, and K. A. Dill. 1994. Modeling compact denatured states of proteins. Biochemistry. 33:6158–6166. [DOI] [PubMed] [Google Scholar]
- MacKerell, A. D., N. Banavali, and N. Foloppe. 2000. Development and current status of the CHARMM force field for nucleic acids. Biopolymers. 56:257–265. [DOI] [PubMed] [Google Scholar]
- Merzel, F., and J. C. Smith. 2002. Is the first hydration shell of lysozyme of higher density than bulk water? Proc. Natl. Acad. Sci. USA. 99:5378–5383. [DOI] [PMC free article] [PubMed] [Google Scholar]
- Miller, W. G., and C. V. Goebel. 1968. Dimensions of protein random coils. Biochemistry. 7:3925–3935. [DOI] [PubMed] [Google Scholar]
- Neria, E., S. Fischer, and M. Karplus. 1996. Simulation of activation free energies in molecular systems. J. Chem. Phys. 105:1902–1921. [Google Scholar]
- Oliveira, A. C., L. P. Gaspar, A. T. Da Poian, and J. L. Silva. 1994. Arc repressor will not denature under pressure in the absence of water. J. Mol. Biol. 240:184–187. [DOI] [PubMed] [Google Scholar]
- Paci, E. 2002. High pressure simulations of biomolecules. Biochim. Biophys. Acta. 1595:185–200 (and references therein.). [DOI] [PubMed] [Google Scholar]
- Panick, G., R. Malessa, R. Winter, G. Rapp, K. J. Frye, and C. A. Royer. 1998. Structural characterization of the pressure-denatured state and unfolding/refolding kinetics of Staphylococcal nuclease by synchrotron small-angle x-ray scattering and Fourier-transform infrared spectroscopy. J. Mol. Biol. 275:389–402. [DOI] [PubMed] [Google Scholar]
- Panick, G., G. J. A. Vidugiris, R. Malessa, G. Rapp, R. Winter, and C. A. Royer. 1999. Exploring the temperature-pressure phase diagram of Staphylococcal nuclease. Biochemistry. 38:4157–4164. [DOI] [PubMed] [Google Scholar]
- Perez, J., P. Vachette, D. Russo, M. Desmadril, and D. Durand. 2001. Heat-induced unfolding of neocarzinostatin, a small all-β protein investigated by small-angle x-ray scattering. J. Mol. Biol. 308:721–743. [DOI] [PubMed] [Google Scholar]
- Royer, C. A. 2002. Revisiting volume changes in pressure-induced protein unfolding. Biochim. Biophys. Acta. 1595:201–209. [DOI] [PubMed] [Google Scholar]
- Ryckaert, J. P., G. Ciccotti, and H. J. C. Berendsen. 1977. Numerical integration of the Cartesian equations of motion of a system with constraints: molecular dynamics of n-alkanes. J. Comput. Phys. 23:327–341. [Google Scholar]
- Seemann, H., R. Winter, and C. A. Royer. 2001. Volume, expansivity and isothermal compressibility changes associated with temperature and pressure unfolding of Staphylococcal nuclease. J. Mol. Biol. 307:1091–1102. [DOI] [PubMed] [Google Scholar]
- Segel, D., A. L. Fink, K. O. Hodgson, and S. Doniach. 1998. Protein denaturation: a small-angle x-ray scattering study of the ensemble of unfolded states of cytochrome c. Biochemistry. 37:12443–12451. [DOI] [PubMed] [Google Scholar]
- Segel, D. J., A. Bachmann, J. Hofrichter, K. O. Hodgson, S. Doniach, and T. Kiefhaber. 1999. Characterization of transient intermediates in lysozyme folding with time-resolved small-angle x-ray scattering. J. Mol. Biol. 288:489–499. [DOI] [PubMed] [Google Scholar]
- Segel, D. J., D. Eliezer, V. Uversky, A. L. Fink, K. O. Hodgson, and S. Doniach. 1999. Transient dimer in the refolding kinetics of cytochrome c characterized by small-angle x-ray scattering. Biochemistry. 38:15352–15359. [DOI] [PubMed] [Google Scholar]
- Semisotnov, G. V., H. Kihara, N. V. Kotova, K. Kimura, Y. Amemiya, K. Wakabayashi, I. N. Serdyuk, A. A. Timchenko, K. Chiba, K. Nikaido, T. Ikura, and K. Kuwajima. 1996. Protein globularization during folding. A study by synchrotron small angle x-ray scattering. J. Mol. Biol. 262:559–574. [DOI] [PubMed] [Google Scholar]
- Shortle, D. 1986. Guanidinium hydrochloride denaturation studies of mutant forms of Staphylococcal nuclease. J. Cell. Biochem. 30:281–289. [DOI] [PubMed] [Google Scholar]
- Shortle, D., and A. K. Meeker. 1986. Mutant forms of Staphylococcal nuclease with altered patterns of guanidine hydrochloride and urea denaturation. Proteins Struct. Funct. Genet. 1:81–89. [DOI] [PubMed] [Google Scholar]
- Shortle, D., W. E. Stites, and A. K. Meeker. 1990. Contributions of the large hydrophobic amino acids to the stability of Staphylococcal nuclease. Biochemistry. 29:8033–8041. [DOI] [PubMed] [Google Scholar]
- Shortle, D., and C. Abeygunawardana. 1993. NMR analysis of the residual structure in the denatured state of an unusual mutant of Staphylococcal nuclease. Structure. 1:121–134. [DOI] [PubMed] [Google Scholar]
- Shortle, D. 1995. Staphylococcal nuclease: a showcase of m-value effects. Adv. Protein Chem. 46:217–247. [DOI] [PubMed] [Google Scholar]
- Silva, J. L., and G. Weber. 1993. Pressure stability of proteins. Ann. Rev. Phys. Chem. 44:89–113. [DOI] [PubMed] [Google Scholar]
- Sosnick, T. R., and J. Trewhella. 1992. Denatured states of ribonuclease A have compact dimensions and residual secondary structure. Biochemistry. 31:8329–8335. [DOI] [PubMed] [Google Scholar]
- Svergun, D. I. 1991. Determination of the regularization parameter in indirect-transform methods using perceptual criteria. J. Appl. Cryst. 24:495–503. [Google Scholar]
- Svergun, D. I., C. Barberato, and M. H. J. Koch. 1995. CRYSOL—a program to evaluate x-ray solution scattering of biological macromolecules from atomic coordinates. J. Appl. Cryst. 28:768–773. [Google Scholar]
- Svergun, D. I., S. Richard, M. H. J. Koch, Z. Sayers, S. Kuprin, and G. Zaccai. 1998. Protein hydration in solution: experimental observation by x-ray and neutron scattering. Proc. Natl. Acad. Sci. USA. 95:2267–2272. [DOI] [PMC free article] [PubMed] [Google Scholar]
- Vidugiris, G. J. A, J. L. Markley, and C. A. Royer. 1995. Evidence of a molten globule-like transition state in protein folding from determination of activation volumes. Biochemistry. 34:4909–4912. [DOI] [PubMed] [Google Scholar]
- Wang, Y., and D. Shortle. 1995. The equilibrium folding pathway of Staphylococcal nuclease: identification of the most stable chain-chain interactions by NMR and CD spectroscopy. Biochemistry. 34:15895–15905. [DOI] [PubMed] [Google Scholar]
- Woenckhaus, J., R. Köhling, P. Thiyagarajan, K. C. Littrell, S. Seifert, C. A. Royer, and R. Winter. 2001. Pressure-jump small angle x-ray scattering detected kinetics of Staphylococcal nuclease folding. Biophys. J. 80:1518–1523. [DOI] [PMC free article] [PubMed] [Google Scholar]


