

Abstract
At the leading edge of a motile cell, actin polymerizes in close apposition to the plasma membrane. Here we ask how the machinery for force generation at a leading edge is established de novo after the global depolymerization of actin. The depolymerization is accomplished by latrunculin A, and the reorganization of actin upon removal of the drug is visualized in Dictyostelium cells by total internal reflection fluorescence microscopy. The actin filament system is reorganized in three steps. First, F-actin assembles into globular complexes that move along the bottom surface of the cells at velocities up to 10 μm/min. These clusters are transient structures that eventually disassemble, fuse, or divide. In a second step, clusters merge into a contiguous zone at the cell border that spreads and gives rise to actin waves traveling on a planar membrane. Finally, normal cell shape and motility are resumed. These data show that the initiation of actin polymerization is separated in Dictyostelium from front protrusion, and that the coupling of polymerization to protrusion is a later step in the reconstitution of a leading edge.
INTRODUCTION
Lamellipodia are the driving organelles in actin-based cell motility (Small et al., 2002). They consist of a dense network of actin filaments which abuts upon the plasma membrane in a zone known as a leading edge. The force for pushing the leading edge forward is thought to be provided by the polymerization of actin, and details of the machinery that couples this process to the membrane are under discussion (Dickinson et al., 2002; Mogilner and Oster, 2003). Actin assembles at the membrane into a dense network, together with proteins that regulate the branching, cross-linkage, and membrane anchorage of the actin filaments. In contact with a substratum, the forces generated by the polymerization of actin are translated into forward propulsion of the entire cell (Pollard and Borisy, 2003).
The protrusion of a leading edge is comparable to the actin-based motility of particles or vesicles within cells. At a leading edge, the Arp2/3 complex is activated, assisted by members of the WASP family. Vesicles are propelled through cells by forming an Arp2/3-containing tail. Bacterial and viral pathogens make use of the cell's machinery to be moved within a cell or to be transmitted from one cell to another (Schafer et a., 1998; Scaplehorn et al., 2002; Cossart, 2004; Millard et al., 2004). The particle movement can be simulated in cell-free systems by incubating beads that are coated with N-WASP, an activator of the Arp2/3 complex, in a mixture of polymerizable actin and four other essential proteins together with ATP (Carlier et al., 2003; Cameron et al., 2004).
The question addressed in this work is how the machinery for force generation is reassembled within a cell after the global depolymerization of actin. In Dictyostelium cells moving on a glass surface, the cortical actin system is differentiated into a loose network of single or bundled filaments and into dense assemblies. Dense assemblies of filamentous actin constitute not only the leading edge; they are also generated beneath the substrate-attached cell surface in the form of short-lived foci and traveling waves (Bretschneider et al., 2004). These actin-based structures are completely destroyed by treating the cells with latrunculin A, an inhibitor of actin polymerization (Spector et al., 1989; Pring et al., 2002) that binds in a cleft between subdomains II and IV of monomeric actin (Morton et al., 2000). Latrunculin A acts by sequestering monomeric actin (Yarmola et al., 2000; Morton et al., 2000). As a consequence, filamentous actin structures fall apart in living cells depending on the rate of actin depolymerization. After the removal of latrunculin A, Dictyostelium cells recover from the treatment, and the reconstitution de novo of leading edges can be recorded.
There are, in principle, two ways in which actin polymerization is recovered after complete depolymerization: 1), polymerization is regained in situ, meaning at the border of the cell where leading edges had been formed before latrunculin A was added; or 2), only at a second step the polymerization is linked to the sites where protrusion is going to occur. Here we provide evidence for this second pathway of actin repolymerization and leading-edge reconstitution in Dictyostelium. As a technique to recognize details of actin organization we use total internal reflection fluorescence (TIRF) microscopy in combination with GFP-tagged constructs of LimE, a LIM domain protein of Dictyostelium (Schneider et al., 2003). By fluorescence as by electron microscopy, a construct lacking the C-terminal coiled-coil domain of the LimE protein (LimEΔcoil) turned out to be the best label for the cortical actin filament network in Dictyostelium cells (Bretschneider et al., 2004). The application of LimEΔcoil-GFP to TIRF microscopy proved to be optimal for distinguishing in live cells the actin-filament system from the background of unpolymerized actin. Under the optical conditions used, fluorophores deeper than 200 nm within a cell are no longer detected, which sets a limit for the contribution of background fluorescence from the cytoplasm.
MATERIALS AND METHODS
Culture and treatment of Dictyostelium cells with latrunculin A and FM4-64
Various cell lines derived from D. discoideum strain AX2-214, expressing GFP- or mRFP-tagged LimE constructs, GFP-ABD120 (Pang et al., 1998), or GFP-actin (Westphal et al., 1997) as probes, were used in this study. LimE-null cells were complemented with full-length LimE-GFP (see Figs. 3 and 4) or with truncated LimEΔcoil that lacks its C-terminal coiled-coil domain and carries GFP at its C-terminus (see Figs. 1 and 2; Figs. 5–7 and 10; and Movies 2 and 3). Wild-type AX2-214 cells were transformed with a pDEX vector to express LimEΔcoil carrying either GFP or mRFP at its N-terminus (see Figs. 8 and 9, and Movies 1 and 4). Disruption of the DdLimE gene and generation of the GFP constructs were described by Schneider et al. (2003). Cells were cultivated in nutrient medium in polystyrene culture dishes at 23 ± 2°C; ∼1 h before an experiment, cells were washed twice in 17 mM K/Na-phosphate buffer, pH 6.0 (in this article referred to as “phosphate buffer”).
FIGURE 3.
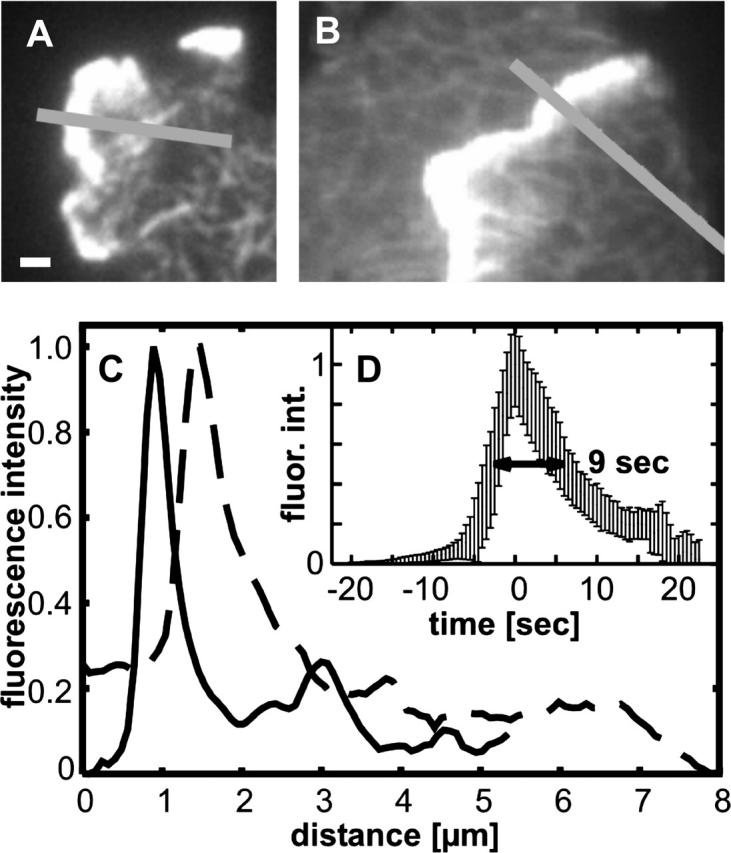
Actin profiles at leading edges, probed with LimE-GFP in LimE-null cells and monitored by TIRF microscopy. (A) High-fluorescence intensity at a leading edge relative to the actin network on bottom of the cell. (B) Profile taken from a time series showing that the cell on the right protrudes its leading edge between substrate and surface of the cell on the left. The leading edge on the right is evidently within the depth of TIRF illumination. (C) The fluorescence intensities along the bars in A (solid line) and B (dotted line) are plotted. Both profiles reveal a zone of high fluorescence intensity, which has a width at half-maximum of <1 μm and a sharp peak in the region behind the leading edge. The background in the extracellular space has been subtracted. In D, the temporal change of actin accumulation during movement of a leading edge over an area on the substrate is plotted as the mean of 11 measurements at different sites of the border (area size corresponding to 243 × 243 nm). A sharp turn from increase to decrease characterizes the temporal profile, which has an average width at half-maximum of 9 s. Fluorescence intensities plotted in C and D were recorded within the linear range of the CCD camera. To depict the filamentous network in A and B, the contrast had to be enhanced to the point that gradation of intensities within the leading edge became indistinguishable. Bar for A and B, 1 μm.
FIGURE 4.

Disassembly of F-actin structures and membrane “pearling” induced by latrunculin A. The fluorescent label is LimE-GFP in LimE-null cells. (A) Time course of the disappearance of actin structures during the incubation of a cell with 5 μM latrunculin A. Time is indicated in seconds before (first frame) and after addition of the drug (following frames). Arrowheads in the 99-s frame point to dense actin assemblies that are transiently formed against the trend of overall depolymerization. (B) A cell incubated for 10 min with 5 μM latrunculin A, showing intense pearling in extensions of the cell surface. Bars, 5 μm in A; 10 μm in B.
FIGURE 1.

Actin depolymerization by latrunculin A, and characteristic patterns of reorganization after removal of the drug by washing in phosphate buffer. The images represent confocal scans through cells of Dictyostelium discoideum at planes close to the substrate-attached cell surface. Structures labeled with three different probes are compared. (A) GFP-actin; (B) GFP-ABD120; and (C) LimEΔcoil-GFP. The panels show, from left to right, cells moving on a glass surface before the treatment with latrunculin A, showing leading-edge labeling with all three probes and actin network structures in B and C; cells after 16–20 min of incubation with 5 μM latrunculin A, in which the labels are uniformly distributed in the cytoplasm and only organelles are spared; patches are the first structures recognized after the wash-out of latrunculin A; waves are typical of a later stage of reorganization before normal cell shape is recovered. Patches are formed within the first 15 min after the removal of latrunculin A, waves are most abundant after 20 to 30 min, and recovered cells are observed after 40 min or longer. For A and B, probes were expressed in a wild-type background, for C the probe was expressed in LimE-null cells. Bar, 10 μm.
FIGURE 2.

A cell expressing LimEΔcoil-GFP as in Fig. 1 C, double-labeled after fixation. The cell forming an actin wave was fixed at 25 min of recovery from latrunculin A treatment. (A) Phase contrast image; (B) TRITC-phalloidin; (C) anti-GFP antibody followed by secondary antibody conjugated with Alexa Fluor 488; (D) superposition of images B and C. Bar, 5 μm.
FIGURE 5.

Stages of recovery from latrunculin A. After an incubation period of 7 min with 5 μM of latrunculin A, the drug was removed by washing in phosphate buffer. Numbers indicate seconds after the beginning of the sequence, which starts at 12 min after the dilution. Actin reorganization is monitored by TIRF microscopy using LimEΔcoil-GFP as a probe in LimE-null cells. At the time of latrunculin A removal, no actin enriched structures were visible in the cell shown. Panels A–F show this cell at consecutive stages of recovery. (A and B) Formation of actin patches on the substrate-attached surface of the cell body and along the pearled extensions, some of which are being retracted into the cell. (C) Cell border expanding after the accumulation of actin around the cell's periphery. (D) Waves of dense actin accumulation traveling beneath the substrate-attached cell surface, and recovery of actin network structures. (E) An intermediate stage showing dispersed actin assemblies. (F) Final stage of recovery. As in untreated cells, the actin system is differentiated into a basal network and dense assemblies. These are represented by foci distributed over the substrate-attached cell surface and by actin accumulation localized to the leading edges. Bar, 5 μm.
FIGURE 6.

Tracks of actin-rich patches in a cell recovering from latrunculin A treatment after removal of the drug. The cell expressed LimEΔcoil-GFP in a LimE-null background and is shown at the beginning (left panels) and the end (right panels) of a period of 145 s. (A and D) TIRF images of the entire cell. (B and E) the area framed in A and B. (C) Selected tracks of patches, numbers in B, C, and E demarcating individual patches. Patches 1 and 2 underwent splitting. Patches 2 and 4 appeared and disappeared within the period analyzed. Patch 2 had a lifetime of 65 s up to its splitting into two patches. Arrows in C indicate direction of patch movement. The frame-to-frame interval was 5 s; circles in C indicate patch positions in consecutive frames.
FIGURE 7.

Assembly of actin patches and protrusion of the cell border. (A) Sequence of TIRF images of a cell expressing LimEΔcoil-GFP in a LimE-null background. The cell was preincubated for 15 min with 5 μM latrunculin A. Numbers indicate seconds, starting at 4 min after dilution of the drug to 1 μM. The time series illustrates the formation of actin patches at the bottom surface of the cell, and expansion of the bottom area upon accumulation of the patches at the cell border. The line in the last frame indicates the scan direction for the kymograph in B–E. Bar, 5 μm. (B) Line scan presented within the linear range of fluorescence intensities. The scan-to-scan interval is 5 s. This kymograph shows that fast spreading correlates with the accumulation of actin patches at the cell border. (C) Same plot as in B, but overexposed to demarcate the cell border. (D) Increase in cell diameter over time, calculated from the plot in C. (E) Velocity of cell border progression. Expansion of the cell diameter per minute was divided by 2 to obtain the average speed of cell border progression.
FIGURE 10.

Three-dimensional organization of polymerized actin assemblies related to cell shape before and during the treatment of cells with 5 μM latrunculin A and after its dilution to 1 μM. The left panels show surface-rendered reconstructions of actin structures labeled with LimEΔcoil-GFP (green) in LimE-null cells, and of the cell membrane labeled with FM4-64 (red). Numbers on the coordinates are micrometers. Surface rendering was performed with OpenDX software (http://www.opendx.org). The middle panels show sections parallel and close to the substrate-attached surface from the same stacks of z scans as used for the 3D reconstructions. The right panels show median cross-sections through these cells along the scanning coordinate indicated in the middle panels. (A) A normal cell protruding three fronts. (B) A latrunculin A-treated cell in which no actin-rich structures are detectable. In this case, surface rendering was not applicable because of the lack of any structure in the cell body with fluorescence intensities beyond the cytoplasmic background. (C) Early phase of recovery of actin polymerization characterized by mobile patches on the substrate-attached cell surface. (D) Transition phase at which actin clusters accumulate at the periphery to push the cell border outward. (E) Stage of actin wave propagation. Bar, 10 μm.
FIGURE 8.

Actin wave dynamics related to spacing of the cell and glass surfaces. By dual wavelength TIRF microscopy the red fluorescence of the actin probe mRFP-LimEΔcoil in wild-type cells, and the green fluorescence of Alexa-Fluor 488 dextran within the space between cell and substrate surfaces were recorded simultaneously. Waves were induced by diluting latrunculin A from 5 μM to 1 μM. The cell is shown at four time points as indicated in seconds after the first frame. (A) Wave patterns labeled with mRFP-LimEΔcoil. (B) The fluorescence of Alexa-Fluor 488 dextran shows darkened areas indicating juxtaposition of the cell and glass surfaces. (The cell of interest is flanked by two other cells at the right border of the frames). (C) Superposition of the mRFP (red) and dextran (green) fluorescence. (D) Scan of fluorescence intensities emitted from Alexa-Fluor 488 dextran (green) and from the mRFP-LimEΔcoil label (red) along a line of 0.5 μm in width. This scanning coordinate is placed perpendicular to a traveling wave front as indicated by the white line in C. The red fluorescence reflects the displacement of actin accumulations, the highest peak corresponding to the wave travelling from the right to the left. The green fluorescence is reduced underneath the cell, owing to the proximity of cell and substrate surfaces. These curves do not show any deviations that would correlate with the peaks of the actin wave. Bar, 5 μm.
FIGURE 9.

Labeling of actin patches and waves (green) combined with membrane labeling (red). Cells expressing GFP-LimEΔcoil in a wild-type background were preincubated for 11 min with 5 μM latrunculin A. After replacement of the drug by phosphate buffer, FM4-64 was added, a red fluorescing dye inserting into the plasma membrane and into the membrane of endosomes and vesicles of the contractile vacuole complex (Heuser et al., 1993; Gerisch et al., 2002). These intracellular vesicles are characterized by mobility which does not require polymerized actin, as shown in Movie 1. The sequence starts at 33 min after the removal of latrunculin A, and time thereafter is indicated in seconds. (A) GFP label; (B) FM4-64 label; (C) Superposition of the two labels upon each other. Arrowheads in the 37-s frame of C indicate sites where the wave propels the cell border forward. Bar, 5 μm.
Latrunculin A, fluorescent dextrans, and FM4-64 were purchased from Molecular Probes (Eugene, OR). A stock solution of 1 mM latrunculin A in dimethylsulfoxide was diluted 100-fold in phosphate buffer and mixed 1:1 with the buffer on top of the cell layer, yielding a final concentration of 5 μM. For full recovery, the cells were washed and incubated with phosphate buffer, and the washing was repeated after ∼40 min. Texas Red dextran (3000 mol wt, neutral) was applied at a final concentration of 2 mg/ml, and Alexa-Fluor 488 dextran (10,000 mol wt) at 0.5 mg/ml in phosphate buffer. Since cells exposed to the fluorescent dextrans were extremely light-sensitive and tended to contract, dithiothreitol was added to a final concentration of 20 mM to record the long time series of wave propagation shown in Fig. 8 and Movie 4. For FM4-64 labeling, a stock solution of 1 mg/ml in DMSO was diluted in phosphate buffer to a final concentration of ∼3 × 10⁻² μg/ml for TIRF microscopy or 1 μg/ml for confocal scanning.
For actin determination, proteins were separated by SDS-Page in 10% minigels and stained with Coomassie BlueR. The gels were scanned using a ScanJet 5370C (Hewlett-Packard, Palo Alto, CA). After subtraction of background the actin bands were analyzed with the program AIDA Version 2.11 (Raytest Isotopenmessgeräte, 45549 Sprockhövel, Germany).
TIRF and confocal microscopy
For live cell imaging, Plexiglas rings (20 mm diameter, 4 mm height) were mounted with silicone vacuum grease or paraffin onto glass coverslips. Cells were allowed to settle on these coverslips. For through-the-objective TIRF standard coverslips and conventional immersion oil were used. Most of the single-color images were acquired on a Zeiss Axiovert 200 M microscope equipped with an α-Plan-Fluar 100×/1.45 NA oil immersion objective in conjunction with a Till Photonics (82166, Gräfelfing, Germany) TIRF condensor and a bandpass GFP filter set (excitation 488/10, DC 498; emission 515/30, Chroma Technologies, Rockingham, VT). An Optovar 1.6× was used to enlarge the image on the camera chip. Fig. 3 B was acquired using a Nikon TE2000 inverted microscope, equipped with the Nikon TIRFM module, a 100×/1.45 NA oil immersion objective and a modified Zeiss filter set 09 (excitation 488/10, FT 510, emission 520 LP).
Simultaneous dual color TIRF (see Figs. 8 and 9, and Movies 1 and 4) was performed using an Olympus IX-70 microscope, a 60×/1.45 NA Plan-Apo objective, and a Till Photonics condensor. A 488/10 filter was used for excitation of both GFP and FM4-64. Red and green fluorescence signals were split using a Multi-Spec dual emission splitter (Optical Insights, Santa Fe, NM) having a 595 nm dichroic for the separation of green and red emissions, which were further passed through 510–565 and 605–655 nm bandpass filters, respectively.
In all three systems, the 488-nm line from an Argon/Krypton ion laser (Innova 90, Coherent, Santa Clara, CA) coupled into an optical single-mode fiber (OZ Optics, Carp, Ontario, Canada) was used for illumination. Images were acquired by a frame-transfer, back-illuminated 16-bit CCD camera (MicroMax 512BFT, pixel size 13 μm, Roper Scientific, Trenton, NJ) using the Metamorph Imaging System (Universal Imaging, 82178, Puchheim, Germany). Laser power was optimized such that sufficient contrast was achieved with minimized optical impact on the cells.
Confocal scans of live cells were obtained using a Perkin Elmer Ultra View (Beaconsfield, UK) spinning disc system on a Nikon Eclipse TE300 inverted microscope, equipped with a 100×/1.4 oil Planapo objective and a Hamamatsu ORCA ER camera model C4742-95-12ERG. For the images shown in Fig. 1, the exposure time was 100 ms; GFP fluorescence was excited at 488 nm, and a 500 nm long-pass filter was used for emission. For Fig. 10, stacks of images were obtained with a step size of 500 nm in the z direction. GFP and FM4-64 were both excited at 488 nm, and the emissions separated by 525 and 700 nm bandpass filters. Green and red emissions were recorded alternately with an exposure time of 50 ms for each channel.
For phalloidin and immunolabeling (Fig. 2), LimE-null cells expressing LimEΔcoil-GFP were fixed for 15 min with picric acid/formaldehyde followed by 70% ethanol according to Humbel and Biegelmann (1992). The cells were labeled with TRITC-phalloidin (0.5 μg/ml, Sigma, St. Louis, MO), and subsequently with affinity-purified rabbit anti-GFP antibody followed by Alexa Fluor 488-conjugated goat anti-rabbit antibody (2 μg/ml, Molecular Probes). Confocal fluorescence images were obtained on a Zeiss LSM 410 equipped with a 100/1.3 oil Plan-Neofluar objective. For TRITC, excitation was at 543 nm and a 590–610 nm filter was used for emission. For Alexa Fluor 488, excitation was at 488 nm and emission was recorded at 510–525 nm.
Line scan analyses (see Fig. 3, and Figs. 7 and 8), tracking of patches (see Fig. 6), and superposition of red/green pseudo-colored image sequences (see Fig. 2, and Figs. 8 and 9) were performed using ImageJ software (http://rsb.info.nih.gov/ij). In Fig. 7, trajectories of cell fronts were traced manually in the binarized time-space plot (see Fig. 7 C) and imported to Microsoft Excel for computing the increase of the cell diameter in time (see Fig. 7 D). Differentiation of the cell diameter with respect to time, and division by 2 gives the averaged velocity of front expansion (see Fig. 7 E).
RESULTS
Actin depolymerization and reassembly monitored in live cells
In search for an optimal fluorescent label to monitor the depolymerization of actin and its reorganization after the treatment of cells with latrunculin A, we have compared three GFP-tagged probes: N-terminally tagged actin, the actin-binding domain of a 120-kDa filamin homolog of Dictyostelium (ABD120), and a truncated version of the Lim-domain containing protein LimE (LimEΔcoil). The calponin-like ABD120 has a molecular mass of 28 kDa, and the truncated LimE, which lacks the coiled-coil region at the C-terminus of the polypeptide sequence, has a molecular mass of 15 kDa. These probes were previously used to study actin network organization in untreated, motile Dictyostelium cells (Bretschneider et al., 2004).
All three probes showed the complete loss of any microscopically detectable actin structure within 10–20 min of treatment with 5 μM latrunculin A. During recovery after wash-out of the drug, these probes revealed two consecutive patterns of dense actin assemblies: first the appearance of separate patches, and subsequently wave patterns associated with the substrate-attached membrane and the lateral cell border (Fig. 1); ∼1 h after the removal of latrunculin A, normal cell shape and motility was restored.
The three fluorescent probes resembled each other in the overall pattern they recognized. However, in terms of optimal resolution of delicate actin structures, GFP-actin was inferior to the two other probes because of a high background produced by unpolymerized actin in the cytoplasm. The cytoplasmic background proved to be slightly lower with the LimEΔcoil probe than with ABD120, in accord with our previous observations on untreated cells (Bretschneider et al., 2004).
To establish that live-cell imaging using LimEΔcoil-GFP as a probe parallels the labeling of filamentous actin in fixed cells using fluorescent phalloidin, we have superimposed the two labels on top of each other. Fig. 2 A shows a cell expressing LimEΔcoil-GFP, fixed during the recovery from latrunculin A treatment. The cell was double-labeled with red fluorescent phalloidin (Fig. 2 B) and with anti-GFP antibody followed by green fluorescent Alexa Fluor 488-conjugated second antibody (Fig. 2 C). Merging of the two labels is indicated by yellow color (Fig. 2 D). In conclusion, the same type of structures is recognized during the repolymerization of actin by four different probes: directly GFP-tagged actin, the calponin-like actin binding domain ABD120, a Lim-protein derived construct, and phalloidin.
Since delicate actin network structures in the cortex of Dictyostelium cells are better resolved by TIRF than by confocal microscopy, we show consistently TIRF images in the following analysis of actin dynamics before and after the treatment of cells with latrunculin A. We will finally turn back to confocal scans for three-dimensional reconstructions of the actin patterns.
Leading-edge dynamics in motile Dictyostelium cells
As a reference for stages of actin reorganization during the recovery from latrunculin A, we illustrate in Fig. 3 the dynamics of actin assembly in untreated Dictyostelium cells. In these motile cells, lamellipodia of various shape are continually extended in different directions. The dynamics of leading edge protrusion and retraction can be studied by TIRF microscopy as long as the front of a cell is in close contact with the substrate (Fig. 3 A). To ensure that the very front is captured by the evanescent illumination, we show in Fig. 3 B a cell that partially spreads underneath another one. The fact that actin networks in both cells can be seen provides evidence that, in this example, the front of the undercutting cell (to the lower right in Fig. 3 B) is illuminated in its entire depth. In this cell, as in the one shown in Fig. 3 A, the intensity of the actin label sharply peaked in the middle of a zone nearly 1 μm in width (Fig. 3 C). These images indicate that the specific actin organization at an advancing cell edge is restricted to a narrow zone wherein the packing density of actin filaments reaches a peak of ∼5-fold the average density in the trailing loose network. Temporal changes in fluorescence intensity, measured at a position stationary relative to the substrate, show that the passage of a leading edge creates a sharp peak with a width at half-maximum of 9 s, indicating that the assembly of actin at the leading edge is promptly followed by disassembly (Fig. 3 D).
Pathway of actin depolymerization by latrunculin A
Within less than half a minute of latrunculin A treatment, the filamentous network in the cortex of Dictyostelium cells breaks down into patches, which are mobile, and the dense accumulation of F-actin at leading edges falls apart into separate clusters (Fig. 4 A). Simultaneously, the actin bundles within filopodia disappear, followed by retraction of these surface extensions. The rapid disruption of the network (second frame of Fig. 4 A) illustrates that maintenance of normal actin organization in the cell cortex requires continuous cycling between the polymerized and unpolymerized state of actin.
Despite the presence of latrunculin A, patches of dense actin assembly appeared de novo at the substrate-attached surface and at the border of the cells. This means that global depolymerization was locally counteracted by the appearance of actin-rich clusters (arrowheads in the 99-s frame of Fig. 4 A and Movie 1). These deviations from a monotonic progression of actin disassembly suggest that nucleation is not completely inhibited at intermediate stages of latrunculin A action.
The final stage of actin depolymerization led to membrane pearling, as previously observed in a fibroblast cell line and explained as an instability phenomenon (Bar-Ziv et al., 1999). The instability occurs in a membrane tube when the shear rigidity in the actin cortex is reduced. At that stage the cell is surrounded by protrusions of the plasma membrane, which consist of spherical expansions spaced by thin tubular connections (Fig. 4 A, 236-s frame, and Fig. 4 B). Combination of FM4-64 to label the plasma membrane with LimΔcoil-GFP to label actin assemblies during latrunculin A treatment revealed a connection of pearling to the site of actin clusters retained at the membrane before the final stage of complete depolymerization (Movie 1). As a result, pearls are often enriched in the fluorescent LimΔcoil label relative to the cytoplasm.
Sequence of actin patterns formed during the recovery from latrunculin A
The complete disappearance of F-actin assemblies in cells treated with latrunculin A provides an excellent starting condition for a step-by-step investigation of the reconstitution of the apparatus responsible for cell motility. The question is whether nucleation sites are retained at the cell border, or if actin repolymerization can be initiated anywhere on the cell surface and subsequently linked to protrusion at a leading edge.
The first phase of actin repolymerization after latrunculin A wash-out was the assembly of dense actin patches irregularly distributed over the bottom surface of the cells. Patches appeared also along the pearled surface extensions of the cells (Fig. 5, A and B). In a second phase, the central region of the bottom surface became depleted of actin clusters, whereas patches accumulated near the border of the cells. These clusters grew in size and fused into a contiguous zone, thus conferring the activity of a protruding front to the cell border (Fig. 5 C). The third and penultimate period of recovery was characterized by the profuse formation of concentric or spiral-shaped actin waves all over the ventral cell surface (Fig. 5 D). Eventually, this wave activity declined (Fig. 5 E) and normal actin network organization, cell shape, and leading-edge activity recovered (Fig. 5 F).
The recovery of normal actin organization and cell movement after the wash-out of latrunculin A takes long enough for the rates of actin synthesis or degradation to be altered. To examine whether the sequence of actin patterns observed during recovery results from an up- or down-regulation of total cellular actin, we have determined actin in parallel to the formation of wave patterns. In Coomassie-Blue stained SDS-gels we did not find any significant net change in total actin during an incubation period of 10 min with 5 μM latrunculin A and within 30 min thereafter in phosphate buffer, which comprised the period of extensive wave formation (results not shown). The total amount of cellular actin varied during the experiment only within the limits of ±15%, suggesting that pattern formation is regulated at the posttranslational level.
The turn from patch movement to spreading fronts and wave dynamics
The globular actin clusters formed during the first phase of recovery slid along the ventral cell surface, able to divide and fuse with other clusters. Their velocities varied from 0 to 11 μm × min−1, with no preferential orientation of trajectories (Fig. 6). Once formed, these patches acted as transitory centers of actin polymerization; they grew in size and faded out independently of each other, indicating that the persistence of each patch depended on an intrinsic balance of actin polymerization and depolymerization.
The most remarkable events in recovery from latrunculin A are 1), the transition from the motility of independent actin clusters to the coordinated protrusion of a leading edge; and 2), the excessive formation of travelling waves. A sequence of events is illustrated in Fig. 7 and in the supplemental Movies 2 and 3. Once established as a contiguous zone along the cell border, the front spread with a speed of 2 μm × min−1. In a next step, the contiguous zone broke into concentric or spiral-shaped waves that travelled on the bottom surface of the cells. The phase of wave formation could be prolonged by diluting latrunculin A from the inhibitory concentration of 5 μM down to 1 μM, rather than completely removing the drug (Movie 2).
Is wave propagation coupled to membrane protrusion?
The question of whether the waves formed during recovery from actin depolymerization travel freely on a planar membrane or in connection with a membrane fold, has been addressed by double labeling, showing the profile of the bottom surface in parallel to wave propagation. There is a choice of two TIRF methods to visualize the profile of a cell surface in contact with a substrate (Axelrod, 2003): 1), to incorporate a fluorescent dye into the plasma membrane (Axelrod, 1981); and 2), to allow an impermeant macromolecule, for instance fluorescent dextran, to diffuse into the liquid space between the cell and substrate surfaces (Gingell et al., 1985). The latter technique has been introduced by Todd et al. (1988) to overcome the ambiguity of interference reflection microscopy in mapping cell-glass contacts. We have applied both TIRF methods to probe for protrusions of the cell surface beneath or in front of a propagating actin wave.
Using the second method, similar results were obtained by combining LimEΔcoil-GFP with Texas Red dextran (3000 mol wt), or red mRFP-LimEΔcoil label for actin with green fluorescent Alexa-Fluor 488 dextran (10,000 mol wt). No change in proximity of the cell surface to the substrate was detectable when a wave traveled over a membrane area (Fig. 8 and Movie 4). The wave pattern shown in Fig. 8 illustrates a characteristic feature observed upon collision of two wave fronts: the waves do not cross each other but fuse laterally, giving rise to wave propagation perpendicular to the initial direction.
Alternatively, cell membranes were labeled by the red fluorescent dye FM4-64, which can be excited with the same 488-nm laser line as GFP. Superposition of the actin and membrane labels confirmed that the actin waves can spread on a planar membrane with no leading edge or membrane fold in front of them (Fig. 9). However, when a wave reached the cell border, it was capable of pushing this barrier forward (Fig. 9, 29- to 105-s frames), demonstrating that wave propagation can be facultatively coupled to leading-edge protrusion.
Three-dimensional organization of actin patches and waves
TIRF microscopy as used in this article reveals high-resolution images of actin-filament structures in the plane of the substrate-attached cell surface. However, TIRF does not provide information on the structure of actin complexes perpendicular to the cell surface. To relate the actin assemblies formed at the bottom surface of the cells to the shape of the cell body, we have scanned cells recovering from actin depolymerization in the z direction using a spinning-disk confocal microscope. Cells expressing LimEΔcoil-GFP to visualize actin structures were labeled with FM4-64 for cell-shape determination.
In Fig. 10 the major stages analyzed by TIRF microscopy are represented in the form of three-dimensional reconstructions. In a normal cell, polymerized actin is most strongly enriched at the leading edges (Fig. 10 A). Latrunculin A treatment results in the destruction of actin assemblies through the entire cell, and pearling occurs most abundantly near the substrate-attached cell surface (Fig. 10 B). The patches formed during the first phase of repolymerization extend ∼2 μm from the bottom surface into the interior of the cell body. Some patches that appear separate when viewed close to the cell surface join to form a common cluster toward the interior (Fig. 10 C). At the turn from freely moving patches to the alignment of actin clusters at the cell border, the accumulation of actin is most pronounced in a zone close to the substrate surface (Fig. 10 D). Finally, the actin waves traveling on the substrate-attached cell surface extend 1–2 μm into the cytoplasmic space (Fig. 10 E). Together, these data show that the crucial events in actin reorganization occur close to the plane of the substrate-attached cell surface that has been visualized at high-resolution by TIRF microscopy. The actin-enriched patches and waves associated with the substrate-attached cell surface grow further into the cytoplasmic space, but they end far below the upper cell membrane.
DISCUSSION
Actin repolymerization occurs separately from membrane protrusion
The question addressed in this study is how leading-edge protrusion is initiated de novo after complete immobilization of a cell through actin depolymerization. Does actin polymerization restart from nucleation sites that are retained at the membrane during the depolymerization of actin, or can repolymerization begin anywhere in the cell and be subsequently coupled to membrane protrusion?
The data presented here provide evidence for the second mechanism. In cells recovering from the inhibition of actin polymerization by latrunculin A, the assembly of actin filaments is dissociated from its linkage to membrane protrusion. In that way the recovery of cell motility is dissected into two steps. First, the newly polymerized actin assembles into round clusters that move independently along the inner face of the plasma membrane. These clusters are transient structures; they may disassemble, fuse, or divide. Second, clusters collide at the cell border where their combined activity is able to advance the plasma membrane (Movie 2).
Actin reorganization as observed in Dictyostelium cells differs from that in Aplysia neuronal growth cones recovering from treatment with cytochalasin D, a plus-end capper of actin filaments. In the growth cones, clusters of short actin filaments survive the treatment. These clusters are either randomly dispersed or accumulated in a rim along the growth cone margin, and reorganization of the actin network occurs preferentially along this lamellar border (Forscher and Smith, 1988).
Actin depolymerization was complete in Dictyostelium cells under our conditions as judged by the absence of any actin-enriched structures detectable by TIRF or confocal scanning microscopy. Although we cannot rule out that short filaments are left that might function as nuclei of repolymerization, neither these hypothetical nuclei nor any other components initiate the repolymerization of actin at the cell border where protrusion will eventually proceed. The turn from patch mobility to front protrusion is of particular interest as it demarcates a sudden switch in the control of polymerization.
Waves that travel in a plane close to the substrate-attached plasma membrane provide a second argument for the uncoupling of actin dynamics from membrane protrusion. These data imply that coordination of local activities into wave fronts does not require any machinery for actin nucleation that is located at the folded membrane of a leading edge. Nevertheless, a wave that travels against a cell border can cause the membrane to protrude, thus creating an activity that is typical of a leading edge (Fig. 9). The separation of actin polymerization from front protrusion during the initial phase of recovery opens a possibility of investigating the coupling of the two processes to each other. In this respect, it is of interest that cells can be arrested in the state of abundant wave formation by diluting latrunculin A from 5 μM down to 1 μM, rather than removing the drug completely.
The uncoupling of actin dynamics from force generation at the leading edge is most evident during the recovery from latrunculin A, but it is not restricted to these special conditions. Actin waves are observed in untreated cells (Bretschneider et al., 2002; Vicker, 2002), and they travel without a membrane fold in front of them, indicating that also in normally moving cells the coupling of wave dynamics to membrane protrusion is facultative (Bretschneider et al., 2004).
In untreated Dictyostelium cells, foci of dense actin assembly and traveling waves are inserted into a dynamic network of actin filaments, these dense structures being distinguished from the underlying network by a high content of the Arp2/3 complex (Bretschneider et al., 2004). With respect to their high Arp2/3 content, the foci and waves are comparable to the zone of ∼1 μm in width that is associated with a leading edge (Fig. 3). Similarly, the patches and waves observed after treatment with latrunculin A are enriched in the Arp2/3 complex (unpublished data). The patches formed after latrunculin A treatment differ from the foci of untreated cells by their lateral mobility. The waves are much more profusely formed in cells recovering from latrunculin A. In following articles we will analyze the role played in the consecutive phases of actin repolymerization by activators of the Arp2/3 complex, such as members of the WASP and SCAR/WAVE families (Pollard and Borisy, 2003) or CARMIL (Jung et al., 2001).
In summary, there are two pieces of evidence indicating that actin dynamics in the cortex of Dictyostelium cells is only facultatively coupled to membrane protrusion. First, actin repolymerization starts with the formation of individually moving patches (Figs. 6 and 7 and Movies 2 and 3). These molecular complexes exist as transient structures that are capable of fusing and splitting into separate units. Secondly, actin waves travel on a planar membrane surface (Fig. 8 and Movie 4), until they meet the cell border where they provide force for pushing the membrane forward (Fig. 9). These data indicate that the wave front is capable of propagating autonomously, which means that its propagation does not rely on any machinery that might be embedded in the curved membrane of a leading edge. From these data three conclusions can be drawn:
The capability of actin polymerization can recover earlier than the molecular machinery that couples actin complexes to the membrane in a way that would empower a front to protrude.
A protruding front can be constructed from building blocks made of clustered actin filaments.
Waves of actin polymerization travel freely on the cytoplasmic face of a planar membrane until they are coupled to the cell border where they push the membrane forward in the form of a leading edge.
SUPPLEMENTARY MATERIAL
An online supplement to this article can be found by visiting BJ Online at http://www.biophysj.org.
Supplementary Material
Acknowledgments
We thank Emmanuel Burghardt, Jana Köhler, and Ursula Mintert for their expert assistance, Martin Aepfelbacher and Andreas Schröder for access to the spinning disc microscope, and Jan Faix for anti-GFP antibody.
This work has been supported by grants of the Deutsche Forschungsgemeinschaft to G.G.
References
- Axelrod, D. 1981. Cell-substrate contacts illuminated by total internal-reflection fluorescence. J. Cell Biol. 89:141–145. [DOI] [PMC free article] [PubMed] [Google Scholar]
- Axelrod, D. 2003. Total internal reflection fluorescence microscopy in cell biology. In Methods in Enzymology, Vol. 361, Biophotonics Part B. G. Marriott and I. Parker, editors. Academic Press, New York. 1–33. [DOI] [PubMed]
- Bar-Ziv, R., T. Tlusty, E. Moses, S. A. Safran, and A. Bershadsky. 1999. Pearling in cells: a clue to understanding cell shape. Proc. Natl. Acad. Sci. USA. 96:10140–10145. [DOI] [PMC free article] [PubMed] [Google Scholar]
- Bretschneider, T., S. Diez, K. Anderson, J. Heuser, M. Clarke, A. Müller-Taubenberger, J. Köhler, and G. Gerisch. 2004. Dynamic actin patterns and Arp2/3 assembly at the substrate-attached surface of motile cells. Curr. Biol. 14:1–10. [DOI] [PubMed] [Google Scholar]
- Bretschneider, T., J. Jonkman, J. Köhler, O. Medalia, K. Barisic, I. Weber, E. H. K. Stelzer, W. Baumeister, and G. Gerisch. 2002. Dynamic organization of the actin system in the motile cells of Dictyostelium. J. Muscle Res. Cell Motil. 23:639–649. [DOI] [PubMed] [Google Scholar]
- Cameron, L. A., J. R. Robbins, M. J. Footer, and J. A. Theriot. 2004. Biophysical parameters influence actin-based movement, trajectory and initiation in a cell-free system. Mol. Biol. Cell. 15:2312–2323. [DOI] [PMC free article] [PubMed] [Google Scholar]
- Carlier, M. F., S. Wiesner, C. Le Clainche, and D. Pantaloni. 2003. Actin-based motility as a self-organized system: mechanism and reconstitution in vitro. C. R. Biol. 326:161–170. [DOI] [PubMed] [Google Scholar]
- Cossart, P. 2004. Bacterial invasion; a new strategy to dominate cytoskeleton plasticity. Dev. Cell. 6:314–315. [DOI] [PubMed] [Google Scholar]
- Dickinson, R. B., F. S. Southwick, and D. L. Purich. 2002. A direct-transfer polymerization model explains how the multiple profilin-binding sites in the actoclampin motor promote rapid actin-based motility. Arch. Biochem. Biophys. 406:296–301. [DOI] [PubMed] [Google Scholar]
- Forscher, P., and S. J. Smith. 1988. Actions of cytochalasins on the organization of actin-filaments and microtubules in a neuronal growth cone. J. Cell Biol. 107:1505–1516. [DOI] [PMC free article] [PubMed] [Google Scholar]
- Gerisch, G., J. Heuser, and M. Clarke. 2002. Tubular-vesicular transformation in the contractile vacuole system of Dictyostelium. Cell Biol. Int. 26:845–852. [DOI] [PubMed] [Google Scholar]
- Gingell, D., I. Todd, and J. Bailey. 1985. Topography of cell glass apposition revealed by total internal-reflection fluorescence of volume markers. J. Cell Biol. 100:1334–1338. [DOI] [PMC free article] [PubMed] [Google Scholar]
- Heuser, J., Q. L. Zhu, and M. Clarke. 1993. Proton pumps populate the contractile vacuoles of Dictyostelium amoebae. J. Cell Biol. 121:1311–1327. [DOI] [PMC free article] [PubMed] [Google Scholar]
- Humbel, B. M., and E. Biegelmann. 1992. A preparation protocol for postembedding immunoelectron microscopy of Dictyostelium discoideum cells with monoclonal antibodies. Scanning Microsc. 6:817–825. [Google Scholar]
- Jung, G., K. Remmert, X. F. Wu, J. M. Volosky, and J. A. Hammer III. 2001. The Dictyostelium CARMIL protein links capping protein and the Arp2/3 complex to type I myosins through their SH3 domains. J. Cell Biol. 153:1479–1497. [DOI] [PMC free article] [PubMed] [Google Scholar]
- Millard, T. H., S. J. Sharp, and L. M. Machesky. 2004. Signalling to actin assembly via the WASP-family proteins and the Arp2/3 complex. Biochem. J. 380:1–17. [DOI] [PMC free article] [PubMed] [Google Scholar]
- Mogilner, A., and G. Oster. 2003. Polymer motors: pushing out the front and pulling up the back. Curr. Biol. 13:R721–R733. [DOI] [PubMed] [Google Scholar]
- Morton, W. M., K. R. Ayscough, and P. J. McLaughlin. 2000. Latrunculin alters the actin-monomer subunit interface to prevent polymerization. Nat. Cell Biol. 2:376–378. [DOI] [PubMed] [Google Scholar]
- Pang, K. M., E. Lee, and D. A. Knecht. 1998. Use of a fusion protein between GFP and an actin-binding domain to visualize transient filamentous-actin structures. Curr. Biol. 8:405–408. [DOI] [PubMed] [Google Scholar]
- Pollard, T. D., and G. G. Borisy. 2003. Cellular motility driven by assembly and disassembly of actin filaments. Cell. 112:453–465 (erratum: Cell. 113:549). [DOI] [PubMed] [Google Scholar]
- Pring, M., L. Cassimeris, and S. H. Zigmond. 2002. An unexplained sequestration of latrunculin A is required in neutrophils for inhibition of actin polymerization. Cell Motil. Cytoskeleton. 52:122–130. [DOI] [PubMed] [Google Scholar]
- Scaplehorn, N., A. Holmstrom, V. Moreau, F. Frischknecht, I. Reckmann, and M. Way. 2002. Grb2 and Nck act cooperatively to promote actin-based motility of vaccinia virus. Curr. Biol. 12:740–745. [DOI] [PubMed] [Google Scholar]
- Schafer, D. A., M. D. Welch, L. M. Machesky, P. C. Bridgman, S. M. Meyer, and J. A. Cooper. 1998. Visualization and molecular analysis of actin assembly in living cells. J. Cell Biol. 143:1919–1930. [DOI] [PMC free article] [PubMed] [Google Scholar]
- Schneider, N., I. Weber, J. Faix, J. Prassler, A. Müller-Taubenberger, J. Köhler, E. Burghardt, G. Gerisch, and G. Marriott. 2003. A LIM protein involved in the progression of cytokinesis and regulation of the mitotic spindle. Cell Motil. Cytoskeleton. 56:130–139. [DOI] [PubMed] [Google Scholar]
- Small, J. V., T. Stradal, E. Vignal, and K. Rottner. 2002. The lamellipodium: where motility begins. Trends Cell Biol. 12:112–120. [DOI] [PubMed] [Google Scholar]
- Spector, I., N. R. Shochet, D. Blasberger, and Y. Kashman. 1989. Latrunculins—novel marine macrolides that disrupt microfilament organization and affect cell growth. I. Comparison with cytochalasin-D. Cell Motil. Cytoskeleton. 13:127–144. [DOI] [PubMed] [Google Scholar]
- Todd, I., J. S. Mellor, and D. Gingell. 1988. Mapping cell glass contacts of Dictyostelium amebas by total internal-reflection aqueous fluorescence overcomes a basic ambiguity of interference reflection microscopy. J. Cell Sci. 89:107–114. [DOI] [PubMed] [Google Scholar]
- Vicker, M. G. 2002. Eukaryotic cell locomotion depends on the propagation of self-organized reaction-diffusion waves and oscillations of actin filament assembly. Exp. Cell Res. 275:54–66. [DOI] [PubMed] [Google Scholar]
- Westphal, M., A. Jungbluth, M. Heidecker, B. Mühlbauer, C. Heizer, J. M. Schwartz, G. Marriott, and G. Gerisch. 1997. Microfilament dynamics during cell movement and chemotaxis monitored using a GFP-actin fusion protein. Curr. Biol. 7:176–183. [DOI] [PubMed] [Google Scholar]
- Yarmola, E. G., T. Somasundaram, T. A. Boring, I. Spector, and M. R. Bubb. 2000. Actin-latrunculin A structure and function. Differential modulation of actin-binding protein function by latrunculin A. J. Biol. Chem. 275:28120–28127. [DOI] [PubMed] [Google Scholar]
Associated Data
This section collects any data citations, data availability statements, or supplementary materials included in this article.