

Abstract
We have developed a mathematical model in concert with an assay that allows us to calculate proton (H+) flux and conductance through a single Fo of the F1Fo ATP synthase. Lipid vesicles reconstituted with just a few functional Fo from Escherichia coli were loaded with 250 mM K+ and suspended in a low K+ solution. The pH of the weakly buffered external solution was recorded during sequential treatment with the potassium ionophore valinomycin, the protonophore carbonyl cyanide 3-chlorophenylhydrazone, and HCl. From these pH traces and separate determinations of vesicle size and lipid concentration we calculate the proton conductance through a single Fo sector. This methodology is sensitive enough to detect small (15%) conductance changes. We find that wild-type Fo has a proton flux of 3100 ± 500 H+/s/Fo at a transmembrane potential of 106 mV (25°C and pH 6.8). This corresponds to a proton conductance of 4.4 fS.
INTRODUCTION
The proton-translocating F1Fo ATPase is a member of the ATPase protein family that bioenergetically interconverts proton motive force with the synthesis of adenosine triphosphate from adenosine diphosphate and inorganic phosphate (Pi). They are found in bacterial cytoplasmic membranes, mitochondrial inner membranes, and thylakoid membranes of chloroplasts. The Fo sector is membrane-bound and the second sector, F1, contains the catalytic sites for adenosine triphosphate (ATP) synthesis or hydrolysis. In Escherichia coli F1 consists of five subunits, α, β, γ, δ, and ɛ. Fo has three subunits, a, b, and c, and contains the channel that facilitates transmembrane proton transport (Boyer, 1997; Capaldi and Aggeler, 2002).
Several previous studies have calculated total proton flux through a known amount of purified Fo from E. coli after F1 has been stripped off of the membrane. Most of these studies have utilized Fo-containing liposomes where the proton flux rate was measured while under a transmembrane potential (Schneider and Altendorf, 1985; Sone et al., 1981; Negrin et al., 1980).
In this study we have improved the basic proton flux assay to calculate the conductance and proton flux for a single purified Fo sector. Early efforts to calculate proton flux per Fo were based on experiments examining the ratio of protons transported to ATP molecules utilized or synthesized, defined as the coupling ratio, H+/ATP (Negrin et al., 1980; Mitchell and Moyle, 1969; Moyle and Mitchell, 1973; Brand, 1977). Cao et al. (2001) showed that proton flux per Fo could be calculated from time-lapse pH assay data. In studies presented here, we have improved Cao's assay and model to increase repeatability, consistency, and accuracy of the Fo proton conductance.
MATERIALS AND METHODS
Vesicle preparation and protein reconstitution
Fo-reconstituted vesicles were prepared similar to the original experimental conditions defined by Schneider and Altendorf (1985) as modified in our lab by Cao et al. (2001). In our current method, powdered E. coli polar lipid (Avanti Polar Lipids, Alabaster, AL) extract and cholesterol (5% w/w) are dissolved in liposome buffer to give a final concentration of 30 mg/ml. The liposome buffer contained 150 mM KH2PO4, 2 mM β-mercaptoethanol, and 1.5% n-octyl β-D-glucopyranoside, titrated with ∼100 mM KOH to pH 7.00. The dissolved liposomes were dialyzed in the dark against 1 L of liposome buffer minus the n-octyl β-D-glucopyranoside, for 30 h with two dialysis solution changes during this period. The liposomes were then removed from the dialysis membrane, and stored in 1-ml cryogenic tubes under liquid nitrogen until needed.
Approximately 5 ml of room-temperature vesicle solution was placed in a culture tube and bath-sonicated at least three times for 20 s or until the sample appeared translucent and optically consistent. The solution was then aliquoted into individual 435-μl volumes. Fo was added to form a lipid/protein ratio ranging from 120:1 to 15:1 and brought up to a final volume of 500 μl. 2.2% Triton X-100 was added and the solution was vortexed for 40 min. This concentration of detergent was determined to give the best protein incorporation and just dissolved the high concentration (30 mg/ml) of lipids. To remove Triton X-100 and fully reconstitute Fo into vesicles, the final solution was incubated at room temperature in the dark with first 75 mg of Bio-Beads (Bio-Rad, Hercules, CA) for 10 h then 150 mg of Bio-Beads for 14 h. The vesicles were sized by 21 passes through a 100-nm polycarbonate membrane mounted in a Lipofast unit (Avestin, Ottawa, ON, Canada) as described in MacDonald et al. (1991).
Proton flux assay
A modification of the Schneider and Altendorf (Boyer, 1997) method was used to determine Fo proton flux. The amount of 3.84 ml of translocation buffer, consisting of 200 mM Na2SO4, 5 mM MgSO4, and 0.2 mM Tricine, pH 7.0 was added to an 8-ml cylindrical glass cuvette. The solution was allowed to equilibrate to temperature and atmospheric CO2. The vessel was suspended in a temperature-controlled water bath 1–2 cm above a stir plate set to the lowest setting so as to minimize electromagnetic noise in the pH probe (Analytical CL 116, Radiometer, Copenhagen, Denmark). The pH probe was connected to a 3.5 digit analog pH meter (PHM 84, Radiometer). The analog output of the pH meter was connected to a 12 bit A/D converter (Microstar Laboratories, Bellevue, WA) in an IBM-compatible PC running custom software on the DasyLab platform (DasyTec, Mönchengladbach, Germany). Data were collected at 2000 Hz, averaged, and stored at 4 Hz. The equipment was calibrated and shielded to decrease signal interference from electromagnetic interference, radio frequency interference, and inductive line noise. This equipment configuration allowed the collection, analysis, and long-term storage of accurate time-lapse pH recordings with a relative accuracy of ±0.0002 pH at a time resolution of ∼1 s. Absolute accuracy of the pH recordings were ±0.01 pH. After a stable baseline was achieved (∼5 min), 50 μl of control (without protein) vesicles or protein-incorporated vesicles were added to the translocation buffer. After equilibration, 3 μl of valinomycin (160 μg/ml ethyl alcohol), a K+ transporter, was added to the solution. This is approximately five times higher than used by Cao et al. (2001) and was raised to avoid the possibility that H+ influx is rate-limited by K+ efflux through valinomycin. After an additional 2–3 min, 3 μl of carbonyl cyanide 3-chlorophenylhydrazone (CCCP, 400 μM in ethyl alcohol, from Sigma, St. Louis, MO), a proton ionophore was added. Finally, the solution was back-titrated by adding 100 μl of 1 mM HCl. During the whole process the solution was constantly stirred and the temperature was held constant at 25°C while continuous pH readings were recorded for later analysis. We found that these concentrations of valinomycin and CCCP were not rate-limiting since doubling or halving the amount did not significantly change the results.
DCCD inhibiting assay
N,N′-dicyclohexylcarbodiimide (DCCD) blocks Fo activity with a Ki of 75 μM (Hernández-Terrones et al., 2003). Block occurs as DCCD covalently binds Asp-61 of the c-subunit to form a stable N-acyl urea (Beechey et al., 1966). Since the block is specific to Fo, treatment by DCCD provides an excellent way to validate that the proton flux being measured is due solely to Fo activity.
DCCD (dissolved in anhydrous ethyl alcohol) was added to 4 ml of translocation buffer and 50 μL of Fo-incorporated vesicles to a final concentration of 100 μM DCCD. This solution was incubated at room temperature for 40 min to facilitate effective DCCD binding. For control, an equal volume of ethyl alcohol was added and incubated in the same fashion.
RESULTS
The purpose of these studies was to develop a mathematical method, using data from our Fo flux assay, to accurately calculate the single channel proton flux of Fo. Fig. 1 gives the general protocol for our proton flux assay. At the start of the experiment, the pH gradient is small (ΔpH ∼ 0) and the membrane potential is small (Ψm ∼ 0), but the potassium gradient is large. The potassium gradient is used to develop a large membrane potential by addition of valinomycin, a K+ ionophore that does not transport H+. The large membrane potential due to K+ efflux drives H+ influx in vesicles with functionally incorporated Fo resulting in the first pH rise (see Fig. 1). The subsequent addition of CCCP, a proton ionophore, allows H+ influx in those vesicles that do not have functional Fo. This second rise is the major signal in control vesicles. At the end of the experiment, there is a back-titration with a standard amount of HCl. For a more detailed description, see Materials and Methods.
FIGURE 1.

The pH response of control and Fo-incorporated lipid vesicles. Before start of the trace, 50 μl of a solution high in K+ (250 mM) and containing vesicles with reconstituted Fo (50 μg) or protein-free (control) were added to 4 ml of a K+-free translocation buffer (see Materials and Methods). The left arrow shows where valinomycin, a K+ ionophore was added. This resulted in the efflux of K+ and the initial development of a membrane potential. This potential drives the influx of H+ and is manifested as the first rise in pH. The small H+ influx in control vesicles is due to a slow leak across the vesicle membrane, but in Fo-containing vesicles the influx is larger due to Fo. After the addition of a proton ionophore (CCCP, middle arrow), vesicles without Fo quickly exchange K+ for H+ causing the second rise in pH. Finally the solution was back-titrated with HCl (right arrow). Note that the total signal (sum of the first and second rises) is much larger for control samples. This has been described by Cao et al. (2001) and is due to small amounts of ion channel contaminants in the Fo preparation that make the vesicles leaky to both K+ and H+. However, the slope of the first pH jump increased monotonically with protein concentration as expected. Note that the pH scale bar is 0.025 pH units.
To calculate single channel proton flux, specific experimental values were extracted from the proton flux data. Fig. 2 is an example of a typical time-lapse pH trace taken during a Fo proton flux assay. The points indicate the values in the trace that delineate data digitally taken from the graph to be used as input to our model. The initial rise of the pH trace indicated by the “10 Sec Slope” line, directly after valinomycin addition, is termed the valinomycin slope (val slope). The valinomycin slope is the key factor defining the total number of H+ pumped/second by all functionally incorporated Fo. When Fo-containing vesicles are treated with DCCD (see Materials and Methods), the val slope is similar to control vesicles (data not shown). Thus, the val slope is due to proton influx through Fo. The curve between the 10-Sec Slope line and Point 3 represents a slow leak of H+ through vesicle membrane lipids (which is not blocked by DCCD). The population distribution of this leak is not a required factor in our model; we only require the total leakage and its rate as correction factors. The difference between Points 3 and 4 represents the total population of vesicles that are devoid of functionally incorporated Fo (since these vesicles do not respond to valinomycin). The difference between Points 4 and 5 is a measure of the buffer strength of the external solution; it represents the total change in pH caused by a known addition of H+. As expected, the measured buffered strength in all of our experiments is nearly constant since all experiments were run at pH 6.8 ±0.1 at 25°C ±0.25.
FIGURE 2.

Key points from a typical proton flux assay used to define values for our model to calculate proton flux. Depicted is a typical time-lapse pH trace from our proton flux assay and its control. The rise between Points 1 and 3 is defined as the valinomycin signal. The difference between Points 2 and 3 is used as a correction factor (see Discussion). The rise between Points 3 and 4 is the CCCP signal. The drop between Points 4 and 5 is due to an HCl back-titration and is used to define ΔpH/ΔH+ in each assay. The total positive change between Points 1 and 4 is defined as the total signal. The line marked “10 Sec Slope” is used to calculate the initial valinomycin slope. All of these factors are used as input to our mathematical model calculating single Fo proton flux. Note that the slopes between the 10-Sec Slope line and Point 3 for both the control and 25-μg protein signals are nearly identical, indicating that the H+ leakage rate across the vesicle population is similar for both samples.
To determine total number of vesicles in the assay cuvette, the lipid concentration must be known. Measured lipid concentrations are listed in Table 1 for a number of different samples and experiments. For each value in the table, two assays were run and averaged. Based on these data, 21.45 mM was used for the lipid concentration in all flux calculations.
TABLE 1.
Lipid determination for a number of different experiments
| Sample name (Exp. and amount of Fo added) | Lipid (mM) |
|---|---|
| 36 10 μg | 22.34 |
| 36 25 μg | 22.14 |
| 37 Control | 20.03 |
| 37 10 μg | 21.34 |
| 37 50 μg | 22.01 |
| 38 Control | 21.98 |
| 38 25 μg | 19.87 |
| 39 Control | 20.34 |
| 39 10 μg | 23.12 |
| 39 25 μg | 22.93 |
| 39 100 μg | 19.89 |
A select number of samples were assayed using the lipid-ash method of Chen et al. (1956) as previously reported (Woodbury and Kelly, 1994). Not all samples were assayed due to the amount of sample necessary to run the assay, and the protein available. The average concentration is 21.45 mM with a standard error of 0.39. The average value is used in all protein proton flux calculations.
Liposome size distribution is another critical factor needed to calculate flux (Negrin et al., 1980). As described in Materials and Methods, we were able to form vesicles with a very tight diameter distribution using a 100-nm sizing filter. Nine representative samples of vesicles were measured using dynamic light scattering (90 Plus, Brookhaven Instruments, Holtsville, NY). Table 2 shows the measured effective diameters and their associated standard errors at all concentrations assayed. For all but one of the averages, the standard error was <2% of the diameter. We used the average diameter of these representative samples, 167 nm, for our calculations with both control and protein-incorporated liposomes. The apparent larger diameter of vesicles with incorporated protein, if real, may be due to lipid/protein interactions.
TABLE 2.
Diameter of vesicles for all assayed protein concentrations
| Amount Fo added | Avg. diameter | Std. error |
|---|---|---|
| 0 μg | 139.9 nm | 1.4 |
| 0 μg | 140.4 nm | 0.56 |
| 10 μg | 161.2 nm | 1.0 |
| 10 μg | 148.9 nm | 1.1 |
| 25 μg | 179.7 nm | 2.0 |
| 50 μg | 190.1 nm | 1.3 |
| 50 μg | 155.7 nm | 3.5 |
| 100 μg | 211.1 nm | 0.93 |
| 100 μg | 150 nm | 10 |
One of the historically confounding factors in flux calculations has been obtaining homogeneous vesicle diameters (Negrin et al., 1980). We greatly reduced this variable by sizing all vesicle preparations and measuring actual vesicle diameter with dynamic-light scattering. As the table indicates, the diameter distribution of our vesicles is fairly consistent. The value used in our model based on these and additional data is 167 nm.
The CCCP signal is another important factor in our model. We used it to back-calculate constants for the Poisson distribution, which describes the distribution of individual Fo values among the vesicle population. The CCCP signal when calculated as a percentage of the total signal gives P(0), or the overall probability of a vesicle containing exactly zero functionally incorporated Fo. This is because vesicles that react to the addition of CCCP did not react to the valinomycin, and therefore have no functionally incorporated Fo.
To be a viable assay the method used should give accurate and repeatable results. As discussed in Methods and Materials the accuracy of the system used to create the time-lapse pH traces has a fluctuation of ±0.0002 pH over 1 s. Fig. 3 shows two pH traces from the same sample taken 26 days apart. The two time-lapse pH traces are very similar. The valinomycin slope, the sample leakage total and rate, and the valinomycin signal total are nearly identical in both assays. The total signal decreased <3%, which may indicate that over time a small number of the vesicles without functionally incorporated Fo are no longer responding in the assay. A number of samples were re-assayed up to seven weeks apart and showed the same repeatability (data not shown).
FIGURE 3.

Time-lapse pH traces for the same sample 26 days apart. The repeatability of the time-lapse pH traces that provide the data for our proton flux calculation is evident by the similarity between these two traces. The pH trace stays relatively consistent for up to seven weeks between assays using the same sample. The sample is stored at room temperature in the dark in sealed culture tubes. The Day 1 graph was shifted by 14 mpH to overlay the two traces.
An important factor in obtaining repeatable assays was running all assays in a temperature-controlled bath. It is commonly known that temperature affects the kinetics of proton binding, with increasing temperature typically enhancing the reaction rate. As shown in Fig. 4, these experiments had a Q10 of 1.6–2.8; in other words, for each 10°C change in temperature the valinomycin slope increased by up to 2.8 times. This temperature dependence has a significant effect on the flux calculation. This and other temperature-dependent data (not shown) indicate that proton flux data using the modified Schneider and Altendorf (Boyer, 1997) method cannot be accurately interpreted without performing each assay in a temperature-controlled environment.
FIGURE 4.

Temperature dependence of proton flux assay. The pH trace of a 100-μg Fo sample run at 10°C increments is representative of many temperature-dependent experiments that were executed. The valinomycin slope is significantly affected by the temperature at which the assay is run. Q10 varies from 1.6 to 2.8. Since the valinomycin slope is one of the most significant factors in our calculation, repeatability cannot be expected if the assays are not all run at the same temperature. The total signal is nearly identical for all temperatures, indicating the total vesicle population is consistent in all samples. The drop in the total signal for 35°C is possibly due to the breakdown of the vesicles at higher temperatures. This same effect was seen in all temperature-dependent experiments.
DISCUSSION
The F1Fo ATPase is a proton pump with the Fo sector bound in the cell membrane and the F1 having the ATP catalytic sites. The mechanism and pathway of proton translocation by the Fo sector has been well investigated but not fully understood. The a- and c-subunits of Fo are integral in the transmembrane conductance of the protons. The a-subunit is believed to provide the channel for the uptake of the proton, which is then transferred to a ring of c-subunits that rotate in the membrane, eventually transferring the proton back to a second channel open to the opposite side of the membrane, resulting in vectorial movement of protons across the membrane as the ring rotates (Junge et al., 1997).
We have developed a mathematical model based on our pH data that allows us to calculate the proton flux per Fo. Examples of the time-lapse pH trace from our assay can be seen in Figs. 1–4. A strength of our method is that the estimate of functionally incorporated Fo does not depend on the measured protein concentration. Instead, functionally incorporated Fo is determined directly from other measured parameters, most importantly the number of vesicles without functionally incorporated Fo.
To illustrate our model we calculate the per-Fo proton flux, using the data from Table 3, which was taken from the digitized pH trace in Fig. 2. We first calculate the total number of vesicles in the sample using the average lipid concentration of 21.45 mM (Table 1). The number of vesicles is then the total surface area of lipid divided by the lipid surface area of the outer and inner leaflets of the vesicle membrane,
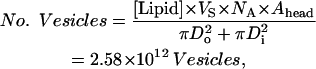 |
where Vs is the sample volume (50 μl), NA is Avogadro's number, Ahead is the average cross-section area of a lipid head (0.70 nm2), Do is the outside vesicle diameter (172 nm, see Table 2), and Di is the inside vesicle diameter (= Do–10 nm).
TABLE 3.
Data elements taken from proton flux assay of Fig. 2
| Factor | Value |
|---|---|
| Val slope | 0.23 mpH/s |
| CCCP signal | 53.41 mpH |
| Sample signal | 69.58 mpH |
| Control total | 90.94 mpH |
| Control val slope | 0.11 mpH/s |
| HCl delta | 23.19 mpH |
| Point 2 | 6879.43 mpH |
| Point 3 | 6885.77 mpH |
The values in the tables were taken from the original (digital) pH trace for control and wild-type Fo at 25 μg in Fig. 2. The valinomycin slope is taken 10 s after Point 1 (valinomycin addition), of the 25-μg signal. The CCCP signal is the signal rise between Points 3 and 4 of the 25-μg signal. Sample total is the signal rise between Points 1 and 4 of the control signal. Control valinomycin slope is taken 10 s after Point 1 of the control signal. HCl delta is the signal drop between Points 3 and 4 of the 25-μg signal, the effect of adding HCl. The pH measurements at Points 2 and 3 are used as factors for correction of the CCCP signal in the calculations.
The total signal we measure (ΔpH Points 1–4) in control experiments is proportional to the trapped (internal) volume of these vesicles. However, the total signal in a protein-containing sample is smaller due to contaminates in the protein sample that allow leakage of ions, as discussed previously. Since only vesicles without leaks contribute to this total signal, the vesicle population of interest is defined by the ratio of the sample total signal (69.6 mpH for this example) to control total signal (90.9 mpH) yielding 1.97 × 10¹² vesicles. Thus, based on the data in Table 3, ∼23% of vesicles are rendered leaky by contaminants and do not contribute to the total measured pH change.
We now determine the number of functionally incorporated Fo. The CCCP signal (ΔpH Points 3–4) represents the population of vesicles without functionally incorporated Fo. Therefore, the ratio of the CCCP signal to the total signal should be the fraction of vesicles with no functionally incorporated Fo. Assuming a Poisson distribution (Lill et al., 1987), this ratio is P(0), i.e., the probability that a vesicle contains zero incorporated Fo. However, P(0) must be increased to include the slow non-Fo leakage observed before Point 3, which represents vesicles that do not contribute to the fast valinomycin signal and therefore do not contribute to the calculation of Fo flux. This correction was not made by Cao et al. (2001) and partly explains the larger flux calculated in the present results. The total rise in the signal from Point 2 to Point 3 (after the fast valinomycin response has ceased) is used as the correction factor. Since this correction factor represents 75 s of the 150 total seconds between Points 1 and 3, the correction factor is multiplied by 2 to adjust for the entire part of the curve of interest. Therefore, after applying the correction factors,
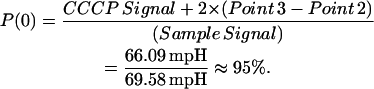 |
Terms are defined as given in Table 3.
The Poisson distribution is given by 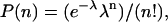 where n = the number of occurrences of an event, λ = variance or Poisson parameter, and P(n) = probability of n occurrences. Since
  then λ = 0.05146. Knowing P(0) allows the calculation of the distribution of all incorporated Fo, P(1) through P(n). The fraction of vesicles with exactly 1 Fo is given by
  that is, 4.9% of all vesicles contain one functionally incorporated Fo. When the total number of Fo values in all vesicles is summed, we obtain 1.02 × 10¹¹ functionally incorporated Fo. Therefore, in this example, the mole ratio of Fo to vesicles is 5.2%.
The total proton flux (molecules per second), Jp, is given by
 |
where terms are defined as given in Table 3 and Acid is the amount of HCl added (100 nmol) to produce the HCl delta signal. Therefore, the number of H+ translocated per single Fo per second is Jp/#Fo = 3.1 × 10³ H+/s/Fo.
All assays were run at an initial membrane potential of 106 mV. The Nernst equation (at T = 25°C) was used to calculate the membrane potential. The liposome buffer had a concentration of 250 mM K+. The vesicles were formed in liposome buffer, representing the internal [K+]. Fifty microliters of vesicles were added to 3840 μl of a K+-free buffer. The trapped volume of the vesicles was determined to be 7.5% making the external [K+] = 2.97 mM. These concentrations were corrected to activities before insertion into the Nernst equation.
CONCLUSION
Single channel proton flux has been an elusive characteristic of Fo to measure. Knowing the proton flux for wild-type and mutant Fo measurements could shed light on the question of why certain mutant Fo measurements appear to have an experimentally greater or smaller proton flux compared to wild-type (Cao et al., 2001). We have developed a repeatable proton flux assay based on very accurate time-lapse pH measurements of vesicles incorporated with functional Fo protein as they are subject to different chemical agents.
From our assay and calculation we determined the average single channel Fo proton flux to be 3200 H+/Fo per second with a standard error of 500. This proton flux is larger than the 70 H+/s/Fo reported by Cao et al. (2001) but less than the 105 H+/s/Fo reported by Lill et al. (1986). Assuming that Fo is never closed, this flux corresponds to a conductance of 4.4 fS at a membrane potential of 106 mV. Feniouk et al. (2004) recently reported a conductance 10 fS by measuring electrochromic absorption transients on Fo from the photosynthetic bacterium Rhodobacter capsulatus. The closeness of these conductance values is surprising considering different bacteria and different assays were used. In fact, the difference may reflect a true variation between these bacteria.
Acknowledgments
This work was supported by National Institutes of Health grant No. GM61272 to W.S.A.B.
References
- Beechey, R. B., C. T. Holloway, I. G. Knight, and A. M. Robertson. 1966. Dicyclohexylcarbodiimide—an inhibitor of oxidative phosphorylation. Biochem. Biophys. Res. Commun. 23:75–80. [DOI] [PubMed] [Google Scholar]
- Boyer, P. D. 1997. The ATP synthase—a splendid molecular machine. Annu. Rev. Biochem. 66:717–749. [DOI] [PubMed] [Google Scholar]
- Brand, M. D. 1977. The stoichiometric relationship between electron transport, proton translocation and adenosine triphosphate synthesis and hydrolysis in mitochondria. Biochem. Soc. Trans. 5:1615–1620. [DOI] [PubMed] [Google Scholar]
- Cao, N. J., W. S. A. Brusilow, J. J. Tomashek, and D. J. Woodbury. 2001. Characterization of reconstituted Fo from wild-type Escherichia coli and identification of two other fluxes co-purifying with Fo. Cell Biochem. Biophys. 34:305–320. [DOI] [PubMed] [Google Scholar]
- Capaldi, R. A., and R. Aggeler. 2002. Mechanism of the F1Fo-type ATP synthase, a biological rotary motor. Trends Biochem. Sci. 27:154–160. [DOI] [PubMed] [Google Scholar]
- Chen, P. S., Jr., T. U. Toribara, and H. Warner. 1956. Microdetermination of phosphorus. Anal. Chem. 28:1156–1158. [Google Scholar]
- Feniouk, B. A., M. A. Kozlova, D. A. Knorre, D. A. Cherepanov, A. Y. Mulkidjanian, and W. Junge. 2004. The proton-driven rotor of ATP synthase: Ohmic conductance (10 fS), and absence of voltage gating. Biophys. J. 86:4094–4109. [DOI] [PMC free article] [PubMed] [Google Scholar]
- Hernández-Terrones, M. G., M. I. Aguilar, B. King-Diaz, and B. Lotina-Hennsen. 2003. Interference of methyl trachyloban-19-oate ester with CF0 of spinach chloroplast H+-ATPase. Arch. Biochem. Biophys. 418:93–97. [DOI] [PubMed] [Google Scholar]
- Junge, W., H. Lill, and S. Engelbrecht. 1997. ATP synthase: an electrochemical transducer with rotatory mechanics. Trends Biochem. Sci. 22:420–423. [DOI] [PubMed] [Google Scholar]
- Lill, H., G. Althoff, and W. Junge. 1987. Analysis of ionic channels by a flash spectrophotometric technique applicable to thylakoid membranes, the proton channel of the chloroplast ATP synthase, and, for comparison, gramicidin. J. Membr. Biol. 98:69–78. [Google Scholar]
- Lill, H., S. Engelbrecht, G. Schönknecht, and W. Junge. 1986. The proton channel CFo, of thylakoid membranes. Only a low proportion of CFo is active with a high unit conductance (169 fS). Eur. J. Biochem. 160:627–634. [DOI] [PubMed] [Google Scholar]
- MacDonald, R. C., R. I. MacDonald, B. P. M. Menco, K. Takeshita, N. K. Subbarao, and L. Hu. 1991. Small-volume extrusion apparatus for preparation of large, unilamellar vesicles. Biochim. Biophys. Acta. 1061:297–303. [DOI] [PubMed] [Google Scholar]
- Mitchell, P., and J. Moyle. 1969. Estimation of membrane potential and pH difference across the cristae membrane of rat liver mitochondria. Eur. J. Biochem. 7:471–484. [DOI] [PubMed] [Google Scholar]
- Moyle, J., and P. Mitchell. 1973. Proton translocation quotient for the adenosine triphosphatase of rat liver mitochondria. FEBS Lett. 30:317–320. [DOI] [PubMed] [Google Scholar]
- Negrin, R. S., D. L. Foster, and R. H. Fillingame. 1980. Energy-transducing H+-ATPase of Escherichia coli. J. Biol. Chem. 255:5643–5648. [PubMed] [Google Scholar]
- Schneider, E., and K. Altendorf. 1985. All three subunits are required for the reconstitution of an active proton channel (Fo) of Escherichia coli ATP synthase (F1Fo). EMBO J. 4:515–518. [DOI] [PMC free article] [PubMed] [Google Scholar]
- Sone, N., T. Hamamoto, and Y. Kagawa. 1981. pH dependence of H+ conduction through the membrane moiety of the H+-ATPase (FoF1) and effects of tyrosyl residue modification. J. Biol. Chem. 256:2873–2877. [PubMed] [Google Scholar]
- Woodbury, D. J., and M. Kelly. 1994. Release of ATP from cholinergic synaptic vesicles during freeze-thaw cycling. Cryobiology. 31:279–289. [DOI] [PubMed] [Google Scholar]