Svistunenko, Dimitri A., and Chris E. Cooper. 2004. A new method of identifying the site of tyrosyl radicals in proteins. Biophys. J. 87:582–595.
Table 1 did not print correctly. The correct table is as follows:
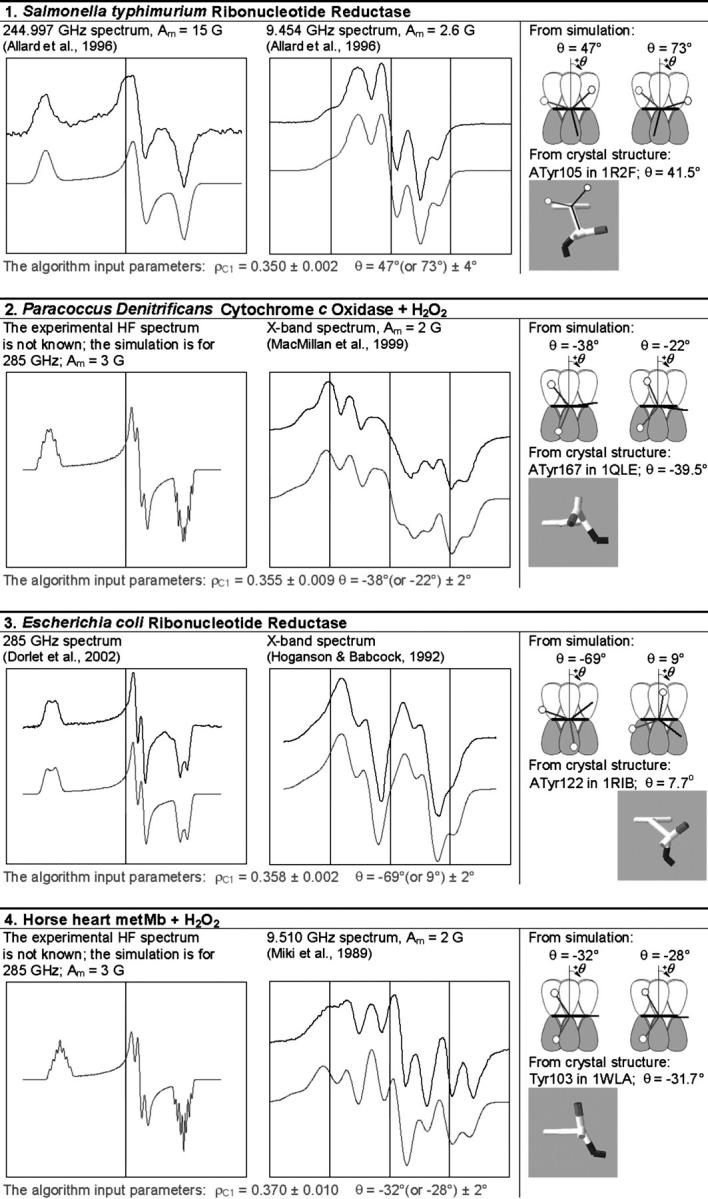
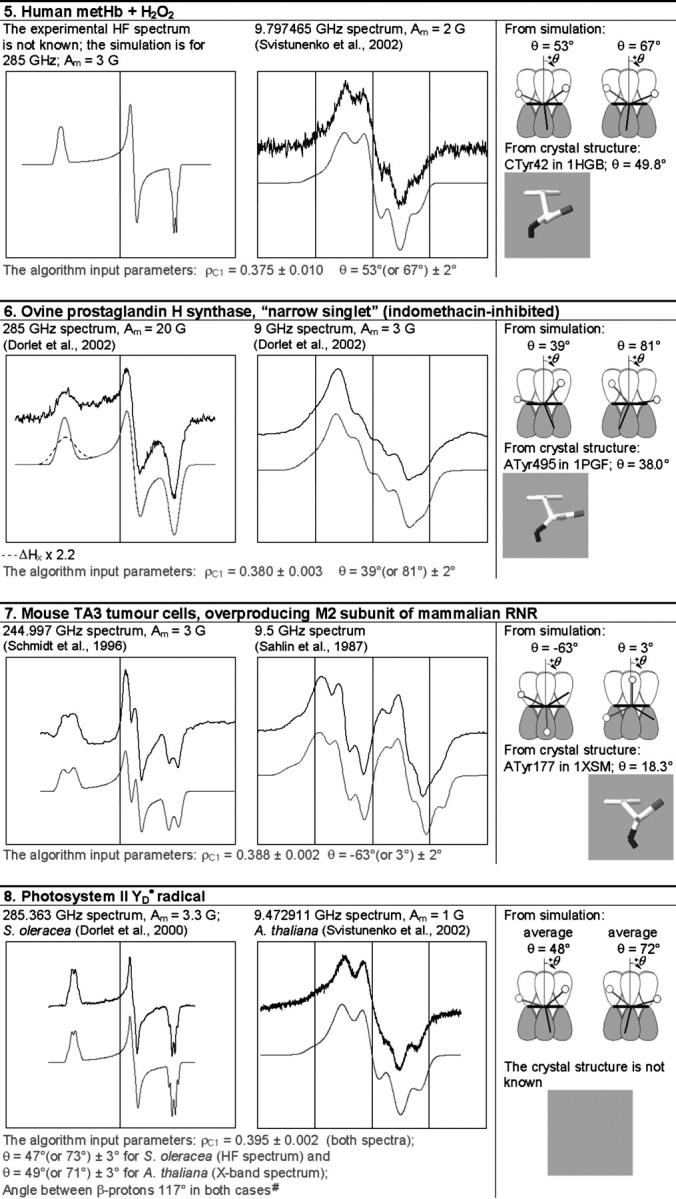
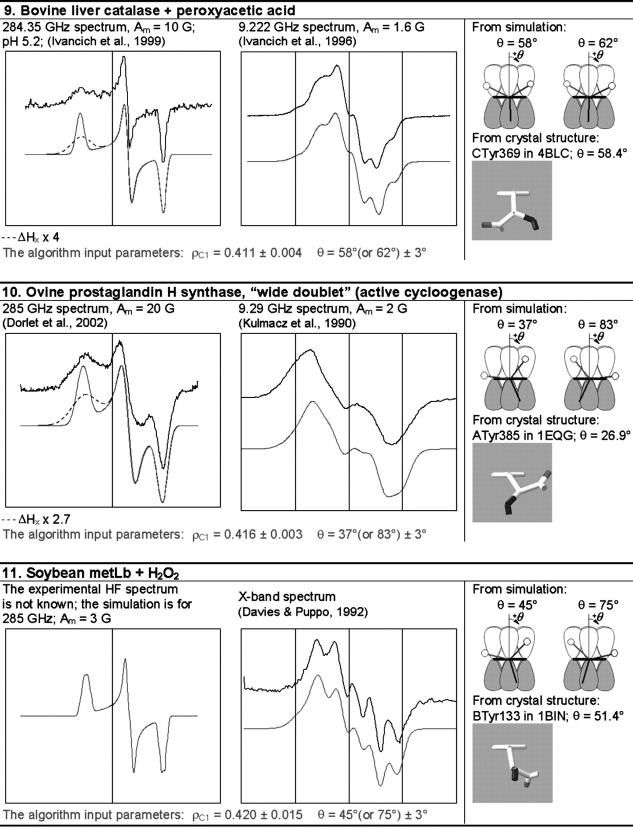
TABLE 1.
The simulation of the HF and X-band EPR spectra of tyrosyl radical in different proteins
In each box, the simulated spectrum is shown below the experimental one. All experimental spectra are taken from the literature. When experimental spectrum is not available, only the simulated one is present. In three cases (6, 9, and 10), the dashed trace corresponds to the spectrum simulated for a greater than the algorithm predicts x-component of the linewidth, all other parameters being generated by the algorithm. The optimal values of the algorithm input parameters ρC1 and θ, used to calculate the simulation parameters (see Supplementary Material, Simulation Data), are indicated under the spectra. The radicals in the table are arranged by ascending ρC1. For each radical, the two optimal θ-angles, equivalent in terms of providing the simulation parameters, are compared with the θ-angle found from the crystal structure, the latter shown under the corresponding optimal angle. The tyrosine number and the Protein Data Bank (http://www.rcsb.org/pdb/) file, e.g., 1R2F for S. typhimurium RNR (Eriksson et al., 1998), are indicated. Other structure files quoted in the table were first presented in the articles: 1QLE (Harrenga and Michel, 1999), 1RIB (Nordlund and Eklund, 1993), 1WLA (Maurus et al., 1997), 1HGB (Liddington et al., 1992), 1PGF (Loll et al., 1996), 1XSM (Kauppi et al., 1996), 4BLC (Ko et al., 1999), 1EQG (Selinsky et al., 2001), and 1BIN (Hargrove et al., 1997). The details of 1), how the errors in optimal ρC1 and θ were determined; 2), how the spectra were plotted on a common magnetic field axis; and 3), how the θ-values were found from the crystal structure, are all described in Software and Methods.
#The algorithm (available in Supplementary Material as the file calculator algorithm.xls) allows us to vary the angle between the projections of the bonds Cβ–Hβ1 and Cβ–Hβ2 to the y–z plane (default value is 120°). The photosynthetic  radical is the only occasion when we exercised this option.


