

Abstract
The kinetic Monte Carlo reaction-path-following technique is applied to determine the lowest-energy water pathway and the coordinating amino acids in bAQP1 and GlpF channels, both treated as rigid. In bAQP1, water molecules pass through the pore between the asparagine-proline-alanine (NPA) and selectivity filter (SF) sites one at a time. The water chain is interrupted at the SF where one water forms three stable hydrogen bonds with protein atoms. In this SF, water's conformation depends on the protonation locus of H182. In GlpF, two water molecules bond simultaneously to the NPA asparagines and pass through the SF in zigzag fashion. No water single-file forms in rigid GlpF. To accommodate a single file of waters requires narrowing the GlpF pore. Our results reveal that in both proteins a proposed bipolar water arrangement is thermally disrupted in the NPA region, especially in the cytoplasmic part of the pore. The equilibrium hydrogen-bonded chain is occasionally interrupted in the hydrophobic zones adjacent to the NPA motifs. The permeation of alkali cations through bAQP1 and GlpF is barred due to a large free-energy barrier in the NPA region as well as a large energy barrier blocking entry from the cytoplasm. Permeation of halides is prevented due to two large energy barriers in the cytoplasmic and periplasmic pores as well as a large free-energy barrier barring entry from the periplasm. Our results, based on modeling charge permeation, support an electrostatic rather than orientational basis for proton exclusion. Binding within the aquaporin pore cannot compensate sufficiently for dehydration of the protonic charge; there is also an electrostatic barrier in the NPA region blocking proton transport. The highly ordered single file of waters, which is drastically interrupted at the SF of bAQP1, may also contribute to proton block.
INTRODUCTION
Aquaporins (AQPs) are members of the major intrinsic protein (MIP) family (Borgnia et al., 1999). They function as channels for rapid bidirectional transport of water (3 × 10⁹ s−1 per channel), but not ions including protons, across cell membranes in response to hydrostatic or osmotic gradients (Preston et al., 1992). Some members of the MIP family are also permeable to small neutral solutes such as glycerol (Borgnia et al., 1999). The efficient blockage of proton transport in AQPs remains a longstanding unresolved question, because protons are able, by tunneling, to shuttle within a hydrogen-bonded single file of water molecules (Akeson and Deamer, 1991; Pomès and Roux, 1996).
Several recent studies provide well-resolved atomic level structures of aquaporins and the glycerol facilitator GlpF from Escherichia coli (Murata et al., 2000; Fu et al., 2000; de Groot et al., 2001; Ren et al., 2001; Sui et al., 2001; Tajkhorshid et al., 2002). Recent determination of a 2.5-Å x-ray structure of wild-type AqpZ from E. coli (Savage et al., 2003), a channel only passing water at high rates, permits characterization of the difference between water (AqpZ) and glycerol (GlpF) proteins from a single species. However, atomic details of the mechanism of water conduction and its dependence on the narrow constriction, and the Asn-Pro-Ala (NPA) motifs in the center of aquaporin channels are controversial. In particular, the mechanism of water selectivity, proton discrimination, and ion exclusion remains highly disputed.
Well-resolved crystal structures provided insight into aspects of water selectivity in AQPs. They revealed a narrow constriction region, the location of nearby helical dipoles, and unfavorable conditions for ions inside the pore. Ren et al. (2001) suggested a curved pathway in AQP1 promotes disruption of a hydrogen-bonded (H-bonded) chain of permeating water molecules, aborting proton conduction. Murata et al. (2000) proposed an H-bond isolation mechanism where proton transfer at the NPA motifs of AQP1 is blocked by isolating one water's hydrogen atoms, keeping them from forming H-bonds with adjacent water molecules in the single-file column. Sui et al. (2001) discuss the role of pore-lining residues on water selectivity and note further that no chain of H-bonded water molecules (proton-wire) spanning the AQP1 pore and suitable for proton tunneling was located in the density map of the bovine AQP1 (bAQP1).
Numerous molecular dynamics (MD) simulations (Jensen et al., 2001, 2003; de Groot and Grubmüller, 2001; Kong and Ma, 2001; Zhu et al., 2001, 2002, 2004; Tajkhorshid et al., 2002; de Groot et al., 2003; Burykin and Warshel, 2003, 2004; Chakrabarti et al., 2004; Ilan et al., 2004) provide further insight into how AQP1 and GlpF channels work. Contrary to earlier speculations (Murata et al., 2000), the MD results of Kong and Ma (2001) indicated that asparagine residues of the NPA motifs in AQP1 are essential for maintaining the water connectivity. In the selectivity filter (SF) water flow was disrupted due to fluctuations in the size of the constriction. In their MD study, de Groot and Grubmüller (2001) observed a similar interruption of contiguous hydrogen-bonded water chains in the SF region of both AQP1 and GlpF. They concluded that the SF is the main filter for protons and other ions. The putative proton-conducting chain was also interrupted within the NPA motifs. Simulations of GlpF (Tajkhorshid et al., 2002; Jensen et al., 2003) led to quite different observations: very little disruption at the SF region and none at the NPA motifs. In addition, they found a bipolar intrachannel water configuration, pivoting about the NPA motifs, that precludes proton conduction; on both sides of the NPA motifs the water molecules' hydrogen atoms point toward the pore exits (Jensen et al., 2003). However, the most recent simulations tend to support an electrostatic rationale for proton exclusion in aquaporins, due to a large electrical barrier in the NPA region (de Groot et al., 2003; Chakrabarti et al., 2004; Ilan et al., 2004), or due to both this barrier and the desolvation energy for proton transfer to the channel interior (Burykin and Warshel, 2003, 2004). However, Burykin and Warshel's (2003, 2004) view is that the NPA motifs make relatively minor contributions to the protonic barrier, which remains very high even if all the residues' electrostatic contributions are suppressed. Hydronium interaction with bulk water near the entrance and with explicit pore water molecules in midchannel (excluding the two flanking the ion) were the major barrier determinants (Burykin and Warshel, 2004).
Because continuum approaches, which lack explicit waters, are inapplicable to aquaporins, only MD can reveal essential details of water permeation. However, the differences among the conclusions based on structure and simulation demonstrate that mechanistic proposals for water selectivity and proton discrimination remain highly controversial. Thus, a fresh perspective on the interaction between aquaporins and water and charge is worthwhile. To examine some possibilities affecting water or charge transport we extend our preliminary study (Miloshevsky and Jordan, 2004a) and carry out kinetic Monte Carlo reaction-path-following (kMCRPF) simulations identifying the reaction pathway (lowest energy path) for water molecules or charged species through the curvilinear aquaporin pores, here treated as rigid. The Monte Carlo (MC) method is especially effective for exploring phase space because it permits large translational and rotational moves whereas MD simulations advance the positions and velocities of all the particles simultaneously, only exploring local regions of phase space (Leach, 2001). kMCRPF simulations provide insights into the mechanism of water transport and identify the role of residues lining the bAQP1 and GlpF pores. They suggest that the mechanism of proton exclusion in water channels might be more complicated than suggested by recent MD studies relying on empirical models of proton-water complexes (de Groot et al., 2003; Burykin and Warshel, 2003, 2004; Chakrabarti et al., 2004; Ilan et al., 2004).
COMPUTATIONAL MODEL
The details of our computational model, exploiting a combination of the Metropolis Monte Carlo (MMC) method (Metropolis et al., 1953) and kinetic Monte Carlo (kMC) techniques (Binder, 1992) were described recently (Miloshevsky and Jordan, 2004b,c). By combining a constrained MMC method with the kMC we developed a bootstrap technique for studying permeation and gating in ion and water channels: kinetic Monte Carlo reaction-path following. kMCRPF predictions of the gating mechanism in gramicidin channels (Miloshevsky and Jordan, 2004b) agreed fully with independent experimental results (Harms et al., 2003). Here we apply the kMCRPF approach to permeation in water channels, using our Monte Carlo ion channel proteins (MCICP) code, based on rigid crystallographic structures of bAQP1 (Sui et al., 2001) and GlpF (Fu et al., 2000) subunits at 2.2-Å resolution (Protein Data Bank entries 1J4N and 1FX8, respectively). “Missing” hydrogens were added using a code option. GlpF and bAQP1 monomers, including all explicit hydrogens (3841 and 3771 explicit protein atoms in GlpF and bAQP1, respectively), are treated in full atomic detail. The model system is illustrated in Fig. 1, with its Z axis oriented along the conductance pathways and the periplasmic side negative. We use partial charges and van der Waals (vdW) parameters of the CHARMM22 all-hydrogen force field (MacKerell et al., 1998) with TIP3P water and, to ensure consistency with the CHARMM22 force field (where polarization effects are not explicitly treated) and immerse the protein in a low dielectric (ɛ = 1) slab. Image planes are perpendicular to the Z axis and the outermost protein atoms, including their vdW radii, are included in the low ɛ-membrane slab. Bulk water regions are treated as continua with ɛ = 80. The monomer's protein pore and mouths were filled with explicit water molecules (∼1200) located in a cylinder of 23-Å radius, centered on the coordinate origin. The reaction field, due to dielectric differences between membrane and bulk regions, is rigorously treated by the method of images (Jackson, 1962; Dorman et al., 1996). vdW and electrostatic interactions are computed with no cutoff. This rigor is possible because of the peculiar advantages of MC. In MC only one particle is moved at each step; this scales with N, the number of particles in the system and adds little to the computational load, due to an efficient implementation scheme that incorporates a number of preferential sampling algorithms. MD computations with no cut-off scale as N2, and are therefore prohibitively costly. During simulations of water permeation, the protein is treated as a rigid body, as done in continuum and Brownian dynamics approaches.
FIGURE 1.

Molecular representation of a bAQP1 monomer. Protein residues and water molecules are depicted as sticks. The image planes are blue panels. Protein atoms are shown in conventional colors: carbons, gray; oxygens, red; nitrogens, cyan; hydrogens, white. The bulk regions are continua with dielectric constant ɛ = 80, a membrane slab is a low dielectric medium (ɛ = 1). The image planes are dark blue panels. The water molecules are shown in the protein mouths. The figure was generated using our MCICP code.
We previously described an efficient on-the-fly technique for calculating the total system energy, needed in the MMC algorithm (Miloshevsky and Jordan, 2004c). A model system is decomposed into separate rigid groups (coarse-grained) with no loss of molecular detail. By excluding contributions from interactions between atoms fixed within each coarse-grained group, energy computations are greatly accelerated. To determine the lowest energy paths, a permeating “tagged” water molecule, cation, or anion was monitored using the kMCRPF technique under applied pressure, thus determining putative water (ion) pathways through the curved bAQP1 and GlpF pores, nonbonded interaction energies (electrostatic + vdW) with the protein and with other water molecules, and potentials of mean force (PMF). Preferential sampling (Owicki and Scheraga, 1977; Mehrotra et al., 1983), initially developed to efficiently simulate dilute aqueous solutions, was adapted and incorporated in kMCRPF to move the “tagged” species and its near-neighbor waters more frequently than those further away. This biases the movement and concentrates on behavior in the part of the system surrounding the “tagged” species. The choice of which water to move depended on its distance, R, from the “tagged” particle, using 1/R weighting; this permits proper equilibration of waters in the vicinity of the “tagged” particle. The “tagged” particle was moved at the same frequency as its immediately neighboring waters. The 1/R sampling introduces a bias, corrected in the MMC acceptance criteria. This strategy greatly improves computational efficiency and concentrates sampling in the neighborhood of the permeating species.
The kMCRPF technique (Miloshevsky and Jordan, 2004c) provides a way to move a “tagged” particle unidirectionally through the aquaporin via small kinetic jumps toward the nearest downhill or lowest energy uphill states (kMC technique) via thermally activated jumps (constrained MMC). The step size along the Z coordinate (the obvious reaction coordinate) is sampled randomly and corresponds to accepted configurations. Depending on the height of the energy barriers typically ∼5000 small kinetic MC steps are needed for full translocation. The X and Y coordinates of the “tagged” particle, its orientational degrees of freedom, and positions and orientations of other explicit waters are unconstrained. For accepted configurations many “relaxing” MC trials (∼100–200) are used to relax the “tagged” particle, fixing the new value of the reaction coordinate, during which the remaining degrees of freedom (rotational and X and Y coordinates) and the surroundings of the “tagged” species relax fully, responding to its small movement along the reaction coordinate. Water rearrangement near the “tagged” species is appraised using preferential sampling.
To maintain a contiguous and correlated water chain inside the pore during the forced translocation of the “tagged” water and to produce a unidirectional water flow we apply a transmembrane hydrostatic pressure difference, modeling the local pressure on a water as a constant external force  only dependent on Z. Here
  is the transmembrane pressure difference, approximated as a linear function, and S is the cross-sectional area of a water. The energy change due to the “hydrostatic” force is
  where
where  is the water displacement along Z; it is added to the total system energy and its influence on water movement implemented in the MMC algorithm. For a noticeable effect on the complete water chain we chose a
  of ∼987 atm, two orders of magnitude greater than typical osmotic pressure differences across cell boundaries (∼7–8 atm).
PMFs for water and charge permeation were calculated via free-energy perturbation (FEP) (Leach, 2001), incorporating a backward sampling into the kMCRPF protocol. With Z as the reaction coordinate, the free-energy difference  between states
  and
and  is accumulated as
  where
where  is the energy difference between states
  and
and  and T is the temperature. In MC simulation an ensemble of configurations is generated from state
  but the energy of the
  state is also calculated. The step size (usually <0.1 Å) between adjacent states is not fixed and, as already described, many “relaxing” MC trials are performed to equilibrate the system for each state
  . This approach is reminiscent of Pearlman and Kollman's (1989) method of dynamically modified windows, where the free-energy slope determined the step value of a coupling parameter. Here, however, the Z increment coordinate is determined from thermally activated kinetic jumps. The total free-energy change along the pore is then the sum of the free-energy changes for the various
  .
.
For AQP1 ∼48 h of CPU time on a Dell workstation PWS650 at 2.8 GHz are needed for determining a PMF by following a “tagged” particle through the pore (∼40 Å). For GlpF somewhat less time is needed. Computational costs would increase were explicit lipids and protein flexibility included. We should stress in this context that our path following technique differs significantly from both umbrella sampling (Chakrabarti et al., 2004) and solvation free-energy computations (Burykin and Warshel, 2003, 2004), because it provides a realistic way of following the diffusing particle during permeation.
Due to electronic polarization, not accounted for by the force field, the effective background dielectric constant of membranes is ∼2 (see Dorman and Jordan, 2004), which halves electrostatic contributions to the energies. Reorientation of the polar side chains and main-chain amides (protein flexibility) also increases the effective background dielectric constant. That study of ionic free-energy profiles in gramicidin provides inferential evidence that, for computations set in an electrical background with ɛ = 1 (as required when using CHARMM force fields) and based on a rigid peptide scaffold with mobile waters, the proper effective ɛ is ∼5. Similar observations by Schutz and Warshel (2001) also suggest that, taken together, these contributions to dielectric shielding lead to effective protein dielectric constants of ∼4–5, indicating that the original profiles should be scaled by this factor. Our approach explicitly includes the influence of charge-charge interactions, pore water reorientation, and electrolyte-induced reaction fields, which, were they ignored, would require using a much larger effective dielectric constant, ɛ ∼ 20 (Schutz and Warshel, 2001).
RESULTS
Equilibrium configuration of the water chain
Explicit waters filled the pore and its mouths. The system was equilibrated with the protein held rigid. The water configuration was monitored during equilibration until stability was achieved with the system energy fluctuating around its mean value. Numerous MC runs starting from different initial configurations were carried out to determine characteristic features of the equilibrium water chain in the bAQP1 and GlpF pores. Fig. 2, A–D, illustrates equilibrium snapshots of water's H-bonded network in bAQP1 and GlpF at 300 K. Only protein atoms of the pore's hydrophilic face are shown.
FIGURE 2.
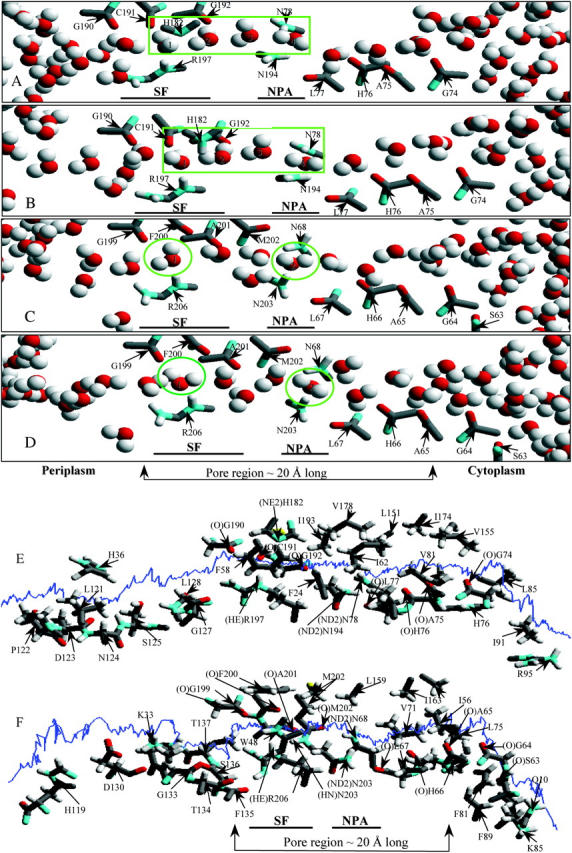
The structure of the H-bonded network of water molecules inside the bAQP1 and GlpF pores. Only the hydrophilic residues lining the pore are illustrated. SF is the selectivity filter region; NPA is the NPA motif. (A and B) The four water molecules, numbered 1 to 4 from left to right, and highlighted by a rectangle, adopt a specific equilibrium orientation in the bAQP1 pore observed in all MC runs. Panel B illustrates the effect of protonation of the NE2 atom of H182. (C and D) Two snapshots from MC simulation revealing the structure of the H-bonded network of water molecules inside GlpF. Two water molecules in the constriction region (SF) and at the NPA motif, highlighted by green circles, adopt specific equilibrium orientations observed in all MC runs. Water pathway along the bAQP1 (E) and GlpF (F) pore. The trajectory of a “tagged” water molecule is represented by the blue curve. Important residues lining the pore (within 4 Å) along the water trajectory are labeled, with individual atoms conventionally colored. For clarity the individual waters are not shown. The figures were generated using our MCICP code.
The equilibrated H-bonded chain in bAQP1 is shown in Fig. 2, A and B. Water molecules 1 and 4 accept H-bonds from the protein. Water 1 (in the SF) accepts an H-bond from the HE hydrogen of R197 and donates both H atoms to the protein (CO of C191 and NE2 of H182). It is oriented perpendicular to the channel axis and is four (or possibly even five) coordinate. Water 4 (at the NPA site) accepts an H-bond from asparagine residues of the NPA motifs and donates both H atoms to two adjacent waters. Other waters either donate or accept a hydrogen from adjacent waters or donate a hydrogen to carbonyls of the channel protein. The four water molecules, highlighted by a green rectangle, adopt a highly ordered conformation. Water molecules external to this region reorient easily due to thermal fluctuations. Fig. 2 B shows the effect of protonating the NE2 atom of H182 (here ND1 is unprotonated with H182 remaining overall neutral). This alters the configuration of water 1, which now donates its H to the adjacent periplasmic water (Fig. 2 B).
Fig. 2, C and D, are illustrative snapshots of water's equilibrium H-bonded network in GlpF at 300 K. Two water molecules, labeled 1 and 2, accept H atoms from R206 and from both the N68 and N203 residues, respectively. Water 1 (in the SF) donates one or both of its H atoms to adjacent water molecules or to COs of G199 or F200. Water 2 (at the NPA site) donates both of its H atoms to two adjacent water molecules. Here all nine pore waters reorient thermally at 300 K, quite different from bAQP1, where the four waters between the SF and the NPA were highly ordered. However, in all equilibrium MC simulations, in both bAQP1 and GlpF, two waters (1 and 4 in bAQP1, 1 and 2 in GlpF) always maintained H-bonds with protein hydrogens in the SF and NPA regions.
Water's lowest energy pathway
A “tagged” water was placed near the NPA site (the coordinate frame origin) and MC simulations carried out at 300 K using the kMCRPF method. Reaction pathways were followed, by moving toward the cytoplasmic and periplasmic sides of both bAQP1 and GlpF proteins, thus determining lowest energy paths and those pore-lining amino acids that coordinate the translocating waters. Water conduction pathways (blue curves) through bAQP1 and GlpF are illustrated in Fig. 2, E and F. Both pores are ∼20-Å long and important amino acids are labeled. For bAQP1 (Fig. 2 E) the hydrophilic pore face is formed from: carbonyl oxygens of G74, A75, H76, and L77 in the cytoplasmic region; side-chain amides of N78 and N194 in midmembrane; carbonyl oxygens of G192, C191, and G190, HE hydrogen of R197, NE2 of H182 in the periplasmic region. For GlpF (Fig. 2 F) the hydrophilic pore face is formed from: carbonyl oxygens of S63, G64, A65, H66, and L67 in the cytoplasmic region; side-chain amides of N68 and N203 in midmembrane; carbonyl oxygens of M202, A201, F200, and G199, HE hydrogen of R206 in the periplasmic region. The residues forming the hydrophilic pore face clearly differ in the two pores' constriction regions.
Pore size
The two pores' effective radii along the water pathways, determined using the MCICP code by squeezing a variable radius sphere along the curvilinear pathway are illustrated in Fig. 3. The vdW radii of pore-lining protein atoms were reduced by a factor of 0.8 to mimic hard spheres. In bAQP1, the pore narrows to ∼1.42 Å, at Z ∼ −7.3 Å in the periplasmic constriction region (SF). In GlpF, the pore narrows to ∼2 Å in the SF and at Z ∼ 6 Å. At Z ∼ −3 Å and Z ∼ 2.5 Å the GlpF pore is wide enough (radius ∼2.8 Å) to accommodate two water molecules radially. In both aquaporins the pore narrows to ∼2 Å at the cytoplasmic entrance. At the NPA motifs (Z ∼ 0 Å) the pore radius is ∼2.25 Å and ∼2.5 Å in bAQP1 and GlpF, respectively. Overall both pores are ∼20-Å long and, along the length of the channel, the GlpF pore is larger.
FIGURE 3.

The effective radius of the pore along the water pathway in bAQP1 and GlpF. The pore radius was determined using the MCICP code.
Water energetics
The nonbonded (electrostatic + vdW) interaction energy between a “tagged” water and its surroundings (the protein monomers, explicit waters, bulk regions) is illustrated in Fig. 4 A. As our approach is kinetically driven, all energy profiles exhibit fluctuations. To ensure a contiguous H-bonded water chain and concerted displacement of waters inside the pore we applied a transmembrane pressure of 100 atm, sufficient to separate water from the SF and/or NPA sites during kMCRPF simulations. Red and blue traces describe water permeation through bAQP1 with the H182 proton on the ND1 and the NE2 atoms, respectively. Protonating NE2 (blue trace), while affecting the orientation of water 1 in the SF (see Fig. 2 B), has no significant effect on water energetics. The green trace monitors water energetics in GlpF.
FIGURE 4.
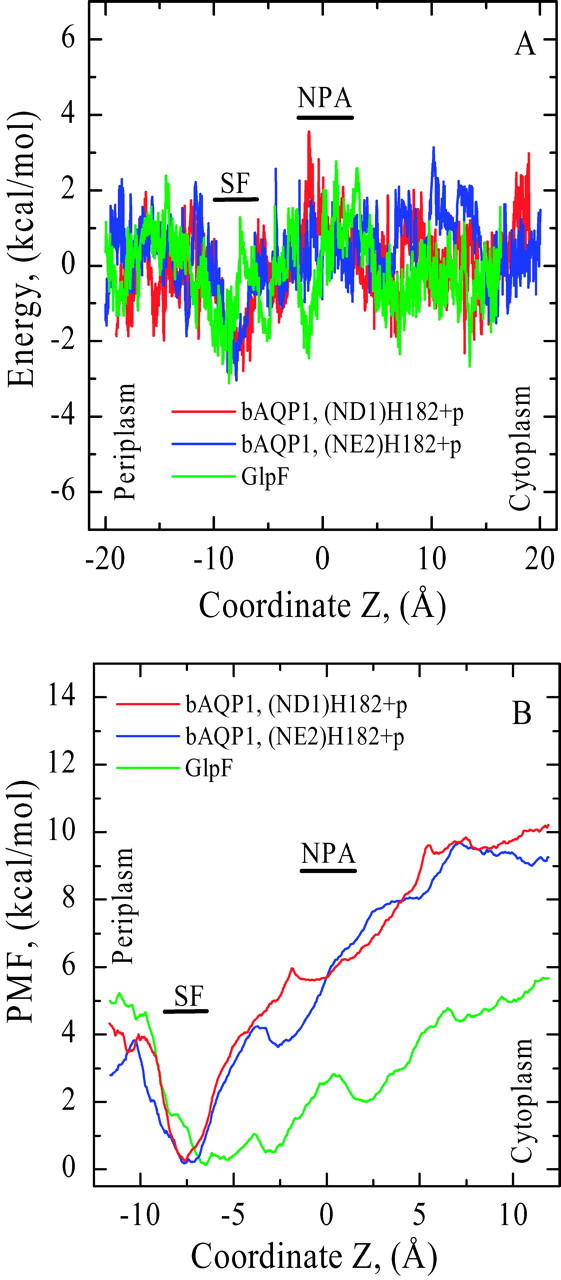
(A) Nonbonded (electrostatic + vdW) interaction energy and (B) PMF profiles for water as functions of Z in both bAQP1 and GlpF. Nonbonded energies are measured relative to the mouths. PMFs are measured relative to the minimum in the SF region (see text); all three curves were shifted equally. Red and blue curves are for bAQP1 with different protonation states of H182; green curves are for GlpF.
PMFs for water permeation through bAQP1 and GlpF are illustrated in Fig. 4 B. The free-energy profiles exhibit broad energy wells in both the bAQP1 and GlpF pores. Both pores are hydrophilic as there is a force promoting water entry into these regions (between Z ∼ −10 Å and Z ∼ +10 Å) from either cytoplasmic or periplasmic mouth. We take the minimum of the PMF in the SF as the reference energy; extending the simulations to bulk water is not possible because of the model system's finite size (image planes bound the outermost protein atoms and confine the explicit waters of the protein mouths). The PMF in the mouths near the image planes clearly is not that of bulk water. Thus, we choose to focus on permeant behavior inside the pore, with the aforementioned reference state.
Ionic energetics
We computed nonbonded interaction energy profiles for K+ ion permeation through both pores (Fig. 5 A). In each case there is a large energy barrier blocking cation permeation at the NPA motifs as the nonbonded energy drops steadily on both sides of the NPA. In bAQP1, moving the H182 proton from ND1 to NE2 creates an additional energy barrier in the SF region (compare red and blue traces). In GlpF (green trace) the energy profile is uniformly below that of bAQP1, significantly so in the region from the SF to the NPA motifs. In these calculations the pore is fully hydrated, and water molecules move along with the ion.
FIGURE 5.
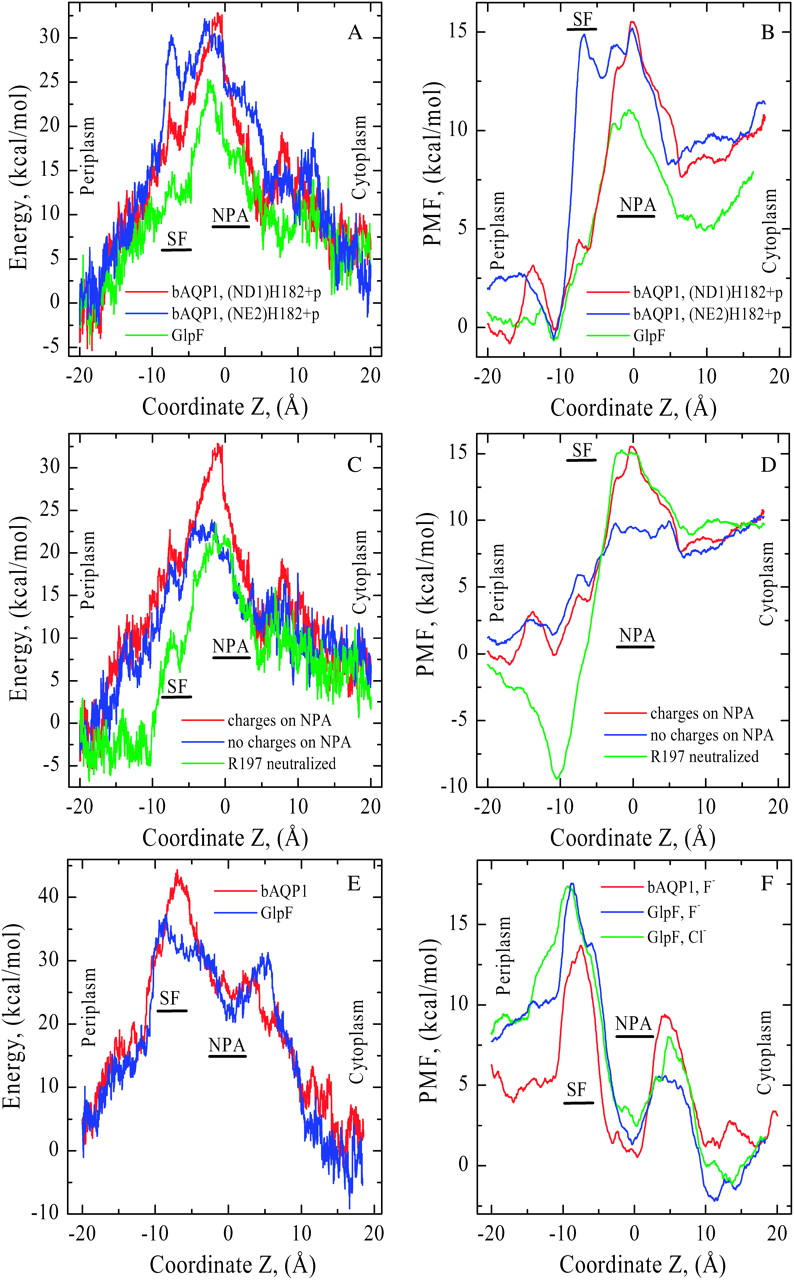
(A) Nonbonded (electrostatic + vdW) interaction energy and (B) PMF profiles for K+ as functions of Z in both bAQP1 and GlpF. Energies are measured relative to the pore mouths and PMFs relative to the SF free energy minimum in bAQP1. Color coding as in Fig. 4. Electrostatic effects due to the side chains of N78 and N194 (blue curve) and the charge of R197 (green curve) on (C) nonbonded energy and (D) PMF profiles in bAQP1. The red curves correspond to native cation energy and PMF profiles. (E) Nonbonded (electrostatic + vdW) interaction energy profiles for F− in both bAQP1 (red curve) and GlpF (blue curve), and (F) PMF profiles for F− in both bAQP1 and GlpF and for Cl− in GlpF (green curve) as functions of Z. In bAQP1, the His proton is sited on ND1 of H182. Energies and PMFs are measured relative to the pore mouths.
PMFs for K+ permeation are illustrated in Fig. 5 B. These demonstrate the major free-energy barrier is in the NPA region in both channels. For protonation of the NE2 atom of H182 the free energy again increases in the SF at Z ∼ −5 Å (compare red and blue curves). The NPA motif free-energy barrier is lower in GlpF (green curve) than in bAQP1. In both pores the free energy is significantly higher in the cytoplasmic (∼10 Å ≤ Z ≤ ∼20 Å) than in the periplasmic (∼−20 Å ≤ ∼−10 Å) mouth due to basic cytoplasmic residues roughly located in a plane perpendicular to the channel axis and forming a semicircle around the axis. These barriers (formed from R161, R162, R163, R164, R236, and R243 in bAQP1 and from K33, R84, and R252 in GlpF) bar K+ entry from the cytoplasm.
The electrostatic effect of the side chains of N78 and N194 and the charge of R197 in bAQP1 on the nonbonded energy and the PMF profiles is illustrated in Fig. 5, C and D, respectively. Discharging the side chains of N78 and N194 decreases the midmembrane free-energy barrier by ∼5 kcal/mol (Fig. 5 D, red and blue curves). There is also a change in profile shape; it is flatter in the NPA region. Were R197 neutralized, a deep free-energy well (∼10 kcal/mol) would appear in the SF and periplasmic mouth (red and green curves), which would trap cations. Naturally these represent nonphysical mutations that might well alter side-chain conformations and conceivably render the protein nonfunctional. They are discussed only to illustrate that in the crystal structure (the native fold), these residues play an important electrostatic role.
As the bAQP1 pore is sterically constricted in the SF region (pore radius is ∼1.4 Å), Cl− passage is forbidden (its hard core radius is ∼1.85 Å); consequently nonbonded energy calculations for bAQP1 were carried out for fluoride, comparable in size to K+. The nonbonded energy profiles for F− permeation through bAQP1 and GlpF show that, although the anion interacts favorably with the NPA asparagines at the NPA motif, there are sizeable barriers on both sides (Fig. 5 E). In the bAQP1 study the H182 proton resided on ND1. Both cytoplasmic and periplasmic pore regions are inhospitable to F− due to repulsion by carbonyl oxygens and the charged glutamate side chains that form bridges with the interhelix NPA loops and control the orientation of carbonyl oxygens inside the pore.
PMFs for F− permeation in both channels and for Cl− permeation in GlpF are shown in Fig. 5 F. In bAQP1, the proton again resided on the ND1 of (neutral) H182. As with the nonbonded energy there are barriers in the PMFs on both sides of the NPA. The shape of the PMFs for F− and Cl− in GlpF (blue and green curves) are very similar. The PMF of F− in bAQP1 is qualitatively akin to the halide PMFs in GlpF. Mirroring the behavior of K+, all three PMFs are higher in the periplasmic mouth (∼−20 Å ≤ Z ≤ ∼−15 Å) than in the cytoplasmic mouth. Anion entry from the periplasm is blocked, due to unfavorable interaction with D130 (see Fig. 2 F).
DISCUSSION
Behavior of water in the bAQP1 and GlpF pores
In bAQP1 we find a single file of six water molecules, four inside the green rectangle (see Fig. 2, A and B) and two in the cytoplasmic pore, oriented by the COs of A75, H76, and L77. Both cytoplasmic and periplasmic vestibules contain many waters. Four water molecules were observed in crystalline bAQP1: two H-bonded waters in the NPA region, one in the SF, and one more on the cytoplasmic side of the pore (Sui et al., 2001). From the electron density maps they concluded that the crystal did not support an H-bonded water chain, i.e., that the last two waters did not H-bond with those of the NPA region. In contrast, Savage et al. (2003) identified five H-bonded water molecules from the x-ray structure of AqpZ: two in the SF and three in the NPA region and cytoplasmic pore. From periplasm to cytoplasm, there are five explicit waters in the crystalline AqpZ structure, separated successively by 3.4 Å, 5.1 Å, 3.0 Å, and 2.9 Å. Although they felt such separations were characteristic for H-bonds, a separation of ∼5 Å appears unlikely for H-bonding. Thus, we assume that, in crystalline AqpZ, the water chain is broken in the hydrophobic zone between the SF and NPA regions. Our simulations commonly show that the water chain is interrupted in the SF where water 1 forms three stable hydrogen bonds with the protein and rarely is H-bonded to its two flanking waters, results confirming the observations of de Groot and Grubmüller (2001). Jensen et al. (2003) made a similar finding: in the SF, water-protein interaction is strong and water-water interaction is relatively weak. Four water molecules, highlighted by a green rectangle, are orientationally highly ordered at equilibrium (see Fig. 2, A and B). Water 3 is in the hydrophobic zone, only coordinating its neighbors, waters 2 and 4, and it does not H-bond with the protein. Equilibrium MC simulations show this water to occasionally separate from water 4 and leave the hydrophobic zone (waters 1–3 shift toward the periplasm), consistent with a lack of electron density in the hydrophobic region of both bAQP1 (Sui et al., 2001) and AqpZ (Savage et al., 2003). The hydrogens of the cytoplasmic water molecule next to water 4 are not always directed cytoplasmically, occasionally rupturing the H-bond with water 4. A water molecule was found here in crystalline AqpZ (Savage et al., 2003), but not in bAQP1 (Sui et al., 2001).
Thermal fluctuations readily reorient all waters on the cytoplasmic side of the pore (compare Fig. 2, A and B) disrupting a proposed bipolar orientation where the NPA is a pivot point for H-bonding, with all water oxygens directed toward the NPA motifs (Tajkhorshid et al., 2002; Chakrabarti et al., 2004). We feel such disruption is quite likely because water rotation is less restricted in AQP1 than in, e.g., gramicidin. Unlike gramicidin, with fifteen carbonyls in each monomer, in aquaporin's cytoplasmic and periplasmic sides, there is one quarter as many, four on each side. Moreover, the hydrophobic zones (de Groot and Grubmüller, 2001) adjacent to the NPA region are not hospitable to water molecules, thus waters self-associate, promoting a contiguous water chain. It has been argued that macrodipoles of α-helices B and E exert strong translational and rotational control of water molecules in the NPA region (de Groot and Grubmüller, 2001; Tajkhorshid et al., 2002) by aligning the water dipoles. However, near helix termini, the net electric field of the macrodipole is essentially that of its terminal charges only, ∼0.5e at the N-terminus and ∼−0.5e at the C-terminus (Gilson and Honig, 1988; Åqvist et al., 1991; Lockhart and Kim, 1993; http://gilsonlab.umbi.umd.edu/ce_www1a.pdf). Calculations based on simplified representations of solvent and protein show that, at short-range, electrostatic effects of the helix are small and not attributable to its macrodipole but rather to a few localized dipoles in the first turn of the helix (Åqvist et al., 1991). Under these conditions, the peptide dipoles within the helix effectively cancel; only the end charges remain uncompensated. Their electric fields are small and short range. We feel they significantly influence the water at the NPA motifs by bonding its oxygen to asparagine residues, but have much less influence on all adjacent waters. Finally, recent work shows that increasing the flexibility of wall atoms or the temperature shifts the water equilibrium in model pores from the liquid to the vapor state (Beckstein and Sansom, 2004), i.e., increasing pore hydrophobicity. We expect that protein flexibility, not included in our study, increases entropy, promoting water disorder in the wider part of the cytoplasmic pore. Thus, this discussion and our MC results both argue against the proposed mechanism of global orientational tuning (Tajkhorshid et al., 2002; Jensen et al., 2003).
GlpF differs sharply (see Fig. 2, C and D); here thermal fluctuations easily break and reform the water chain's hydrogen bonds with the protein and waters. Its pore accommodates more waters (∼9) than bAQP1 (∼6–7). However, waters 1 and 2 always form H-bonds between their oxygens and protein hydrogens. The chain zigzags. Within the pore, one water can coordinate more than two water neighbors. The two equilibrium snapshots (Fig. 2, C and D) show, using the criteria advanced by Pomès and Roux (2002), that waters do not align single file in a rigid GlpF pore. We find significant water occupancy in the NPA region with simultaneous binding of oxygen from two water molecules to the NPA asparagines (Fig. 2 D). Our MC results indicate that, in a rigid GlpF pore, no local restrictions impede water reorientation at the NPA motifs.
In equilibrated bAQP1 we find orientational persistence, but not the proposed water dipole bipolarity (Tajkhorshid et al., 2002). The hydrogens of water 4 (at the NPA) and those of periplasmic single file waters all point toward one pore face, whereas those in the cytoplasmic pore are aligned toward the other (see Fig. 2, A and B). This is because the oxygens of the two rows of pore-lining carbonyls, which point into the pore, are on opposite sides, promoting water inversion in passing by the NPA motifs, as illustrative movies (available at http://people.brandeis.edu/∼gennady/AQP.html) show clearly. When ions enter the pore they disrupt the H-bonded water chains, orienting the nearby flanking waters and totally overriding any influence of the hydrophilic residues in the NPA and SF regions on the water configuration.
In simulations of equilibrated water in GlpF, Chakrabarti et al. (2004) found the ∼20-Å long constriction accommodated nine single-file waters. Taking the water diameter to be ∼2.75 Å, such a single file would appear to require a pore minimally ∼24-Å long. As noted by Chakrabarti et al. (2004), gramicidin, with its single file of some eight waters, is ∼24-Å long. Fitting nine waters single file in the much shorter GlpF is somewhat surprising. Jensen et al. (2003) reported approximately seven waters in the glycerol-free GlpF-G channel where, even in the narrowest region, they observed water-water interchanges (crossings). Because the SF pore radius is only ∼2 Å (Fig. 3), such crossings require flexibility of the pore-lining groups. Jensen et al. (2003) argued in favor of a water single file in GlpF and that water molecules avoid overtaking one another, but this would require the original GlpF pore to narrow, to be significantly deformed from its crystal state, and to collapse toward the channel axis in (300 K) simulation. In GlpF-G simulations the pore narrowed by ∼10–15% relative to GlpF+G (glycerol occupied) in both SF and NPA regions (Jensen et al., 2003). However, it is unclear if this narrowing reflects pore helix rearrangement or is due to the side chains lining the hydrophobic side of GlpF (see Fig. 2 F). When glycerol enters a narrowed GlpF pore, the flexible side chains must rearrange (we believe this is the main cause for the observed pore narrowing) to expand the pore and allow glycerol to permeate. Why GlpF narrows to support a water single file and why it expands easily to accommodate glycerol is unclear. It appears the pore dilates easily. However, our MC results provide strong evidence that a water single file cannot form in the rigid (original) GlpF.
To study water-peptide correlations in different regions of the pores we imposed a transmembrane hydrostatic pressure to force fast unidirectional water flow through both bAQP1 and GlpF from cytoplasm to periplasm. These nonequilibrium results, shown in movies, in which pressure is ∼100 times larger than in laboratory osmotic studies, are not designed for studying PMFs (Zhu et al., 2002, 2004). Because the applied pressure is high, water density is higher in the cytoplasmic mouth during MC simulation, similar to MD results of Zhu et al. (2002). As we simulate a rigid protein, high-pressure structural distortions are necessarily precluded. In bAQP1, water molecules flow smoothly, with restricted rotational mobility of the single file between the SF and the NPA site. As waters move there is gradual exchange of water-water and water-protein hydrogen bonds. The NE2 of H182, which points into the pore (Fig. 2 E), is unprotonated in our movie (the proton resides on ND1). Each water molecule flowing past the SF orients perpendicular to the channel axis, forming three H-bonds with the protein. MD simulations of Kong and Ma (2001) also noted the special role of H182 in water conduction. Water mobility is highest in the cytoplasmic pore. Our movie clearly shows that the hydrogens of these waters are not oriented toward the cytoplasmic exit in translocation. They point at the NPA water; water translocation involves a contiguous H-bonded chain. Thus, we have no evidence supporting a bipolar orientation (Tajkhorshid et al., 2002; Jensen et al., 2003). In GlpF water permeation differs greatly. Under applied pressure both the SF and the NPA sites exhibit significant water occupancy. Water molecules overtake one another inside a rigid GlpF pore and no water single file is observed. Movement of neighboring water molecules is weakly correlated and they are disordered. Due to coordination with more than two neighboring waters, water occupancy of the GlpF pore is energetically unfavorable, a point noted by Fu et al. (2000) as a major reason why water permeates much more poorly through GlpF than through AQP1.
Energetics of water and charge permeation
The nonbonded interaction energies and the PMFs of Fig. 5, A–F, have only qualitative significance. They were originally calculated presuming a rigid protein with a background dielectric constant, ɛ = 1. As discussed in Methods, we reduce energies fourfold to compensate for protein flexibility and electronic polarization. Each PMF of Fig. 5, B, D, and F, is an average of three MC runs. Barrier heights for protonic PMFs in aquaporins are highly controversial. In bAQP1 barriers range from ∼6–7.2 kcal/mol (de Groot et al., 2003) to ∼15 kcal/mol (Burykin and Warshel, 2003), whereas in GlpF they are between ∼4.5 kcal/mol (Chakrabarti et al., 2004) and ∼18 kcal/mol (Ilan et al., 2004). Our scaled cationic energy profiles yield comparable values, barriers of ∼12–15 kcal/mol for bAQP1 and ∼8–10 kcal/mol for GlpF (see Fig. 5 B).
Water's nonbonded interaction energy and PMF profiles (Fig. 4, A and B) demonstrate that it is most stable in the SF where it forms three stable H-bonds with the protein, paralleling the observation that interaction between water and its single-file neighbors is weakest in the SF region (Jensen et al., 2003). Our nonbonded interaction energy profiles, illustrating behavior in the SF, are very similar in shape to electrostatic interaction energy profiles presented by Jensen et al. (2003). Fig. 4 A shows that in the SF of both bAQP1 and GlpF a permeating water's nonbonded energy is below that in other pore regions where it fluctuates about a constant value, results clearly indicative of differences in water energetics in the periplasmic and cytoplasmic halves of the pore. The PMFs show that the SF free-energy wells are comparably deep in both pores (Fig. 4 B). The well is much broader in GlpF than in bAQP1, extending past the NPA site and into the cytoplasmic pore.
Aquaporin interiors are relatively hydrophobic. There is incomplete compensation for hydration energy in transferring an ion from bulk water (Burykin and Warshel, 2003, 2004). Desolvating either cations or anions would create high-energy barriers at the pore entrances. Acidic hydrophilic residues in the SF and NPA regions further electrostatically destabilize cations whereas the channel-lining carbonyls electrostatically destabilize anions. Confirming the predictions of MD simulations (Jensen et al., 2003; de Groot et al., 2003; Chakrabarti et al., 2004) and calculations of solvation free energy upon transfer of hydronium from water to the channel interior (Burykin and Warshel, 2003, 2004) we find the main cationic barrier is at the NPA motifs (Fig. 5 B) and that the positively charged arginine in the SF contributes little to cation rejection. Were the arginine artificially discharged (Fig. 5 D), conditions would be favorable for cation entry from the periplasm, trapping it in the SF and probably blocking the pore, which underscores the functional importance of this arginine's positive charge. Unlike Burykin and Warshel (2003, 2004) we ignore possible mutationally induced protein refolding, but focus on electrostatic effects conserving the native crystal structure. Discharging the NPA residues reduces the barrier by ∼5 kcal/mol (see Fig. 5 D), a drop similar to that found by Burykin and Warshel (2004) in making these residues nonpolar and permitting protein relaxation. Both studies agree a barrier remains when the NPA motif is discharged. However, our PMF profile (Fig. 5 D, blue curve) shows the NPA and cytoplasmic mouth barriers (the latter presumably due to six arginines) are then comparable, effectively eliminating a pure NPA contribution. We postulate that the electrostatic effect of the NPA motif is essential for preventing charge transport and that the cytoplasmic barrier would be strongly affected were the cytoplasmic arginines and other polar residues neutralized, conclusions that differ from those of Burykin and Warshel (2003, 2004). Fig. 5, E and F, show there are energy barriers on either side of the NPA, which prevent anions from accessing the attractive NPA regions, a feature similar to the hydroxide exclusion observed by de Groot et al. (2003). From these results it is clear that the proteins' hydrophilic and charged residues (see Fig. 5, C and D) contribute significantly to aquaporin charge exclusion. Both the NPA region and the rows of carbonyls contribute to energy profile shapes, a point stressed by Chakrabarti et al. (2004) who noted that the proteins' charge distributions essentially determine the free-energy profiles opposing proton transport. This picture is felt by Burykin and Warshel (2004) to be incomplete; they find the barrier also reflects electrostatic interaction with explicit pore waters. Our finding is closer to that of Chakrabarti et al. (2004); charge mutation of specific residues clearly alters the electrostatic profile.
Similarities between K+ and hydronium models
Our results show that the PMFs for K+ permeation (a point charge in a Lennard-Jones sphere) through aquaporins are much like those for proton transport (de Groot et al., 2003; Chakrabarti et al., 2004; Ilan et al., 2004), which are based on empirically parameterized models designed to simulate the interaction of an excess proton with bulk liquid water. Structural similarity between the electrostatic potential energy of a cationic probe charge and the PMF for proton transport was also observed in MD simulations based on the PM6 model (Chakrabarti et al., 2004). The empirical models treat hydronium (H3O+) as a well-defined entity using various charge parameterizations (empirical valence bond (EVB) model, Warshel and Weiss, 1980; Åqvist and Warshel, 1993; and as applied to AQP1, Burykin and Warshel, 2003), (Q-HOP model, de Groot et al., 2003), (MS-EVB2 model, Schmitt and Voth, 1999; Day et al., 2002; Ilan et al., 2004), (PM6 model, Chakrabarti et al., 2004).
There are steep barriers to either side of the NPA motifs (Fig. 5, A and B); proton transport is entirely uphill. EVB treatments (Warshel, 1991; Schmitt and Voth, 1998, 1999; Vuilleumier and Borgis, 1997, 1999, 2000; Day et al., 2002; Burykin and Warshel, 2003) describe quantum delocalization by resonance mixing. Due to the steepness of the barrier, the energy difference between primary EVB states is large; therefore resonance coupling is small and delocalization is limited. Consequently the similarity between point charge and protonic profiles is to be expected. However, quantum effects may yet matter. Ab initio studies suggest that in bulk water there are two basic delocalized structures, the Eigen  and Zundel
  cations, which are roughly equally probable (Tuckerman et al., 1995; Lobaugh and Voth, 1996; Sagnella and Tuckerman, 1998; Marx et al., 1999). Empirical models attempt to interpret complex proton behavior: i), based on solvation of
  rather than on solvation of the
  complex (Wei and Salahub, 1994; Lobaugh and Voth, 1996; Sagnella and Tuckerman, 1998), and ii), without accounting for possible effects of pore-lining hydrophilic residues. This may influence the relative contributions that solvation and electrostatics make to proton rejection.
Aquaporin interiors are lined with hydrophilic residues, which can H-bond with water molecules. In bAQP1, water oxygens accept H-bonds from asparagine and arginine residues at the NPA and SF sites, respectively, producing local threefold hydronium coordination, mimicking that in the Eigen complex with a protein nitrogen substituted for one water oxygen. This could alter proton transport pathways in the pore (Taraphder and Hummer, 2003), and conceivably affect the energy profile. In AQP1, the Q-HOP approach indicated that a proton predominantly hops to H182 and exits the pore periplasmically (de Groot et al., 2003). Although proton hops to asparagine hydrogens were not considered, it was noted that the proton is more mobile in the NPA region than elsewhere. It should be noted that asparagine has a very low affinity for proton transfer. NMR experiments on amide proton exchange on both sides of an eremomycin dimer (Batta et al., 2001) found the NH2 group of the asparagine side chain to be completely hydrophobic relative to proton exchange with water.
Proton transport calculations in AQP1 explicitly considered only the two water molecules on either side of the H3O+ (Burykin and Warshel, 2004). This is an  trimer with three accessible valence states. Extended delocalization, which has not been considered, could conceivably have important energetic effects, a question requiring further study. In concluding that proton transport is controlled by solvation, quite like the transport of other ions (Burykin and Warshel, 2003), the change in solvation free energy upon transferring H3O+ from bulk water into the channel was evaluated using an effective potential (Burykin and Warshel, 2004). However, the physical mechanisms of ion and proton transport differ crucially. An ion diffuses through the pore. Proton transport involves the dislocation of a structural defect where atoms move only fractions of Ångstroms, whereas the structural defect moves ∼5 Å (Marx et al., 1999). The empirical models are parameterized and optimized using both experiment and ab initio MD to mimic proton transport in bulk water (hopping rate, density of vibrational states, etc.). However water's aquaporin environment (a water single file surrounded by an ordered protein) differs vastly from bulk water; consequently there remain substantial uncertainties related to describing protein channels with such models.
Limitation
There is an important caveat. As indicated from the outset, we treat the aquaporins as rigid, so effects of peptide flexibility on the reaction pathway and permeation energy cannot be described. By fixing the protein structure our MC model partially overlaps with the Brownian simulation approach where structure is also held fixed (Kuyucak et al., 2001). When compared with high-resolution protein structures, MD simulations demonstrate overall protein stability, suggesting these crystal structures are reasonably representative of equilibrium. MD never suggests that equilibrium channel conformations differ drastically from high-resolution crystal structures. Protein flexibility, an important contributor to the “protein dielectric constant” (Schutz and Warshel, 2001), will certainly perturb the lowest energy pathways and the corresponding energy profiles, which is why we scaled our energy profiles (Fig. 5, A–F). However, in the absence of a gating rearrangement, we expect that the average positions of pore-lining protein atoms are near those in the crystal structure. If this assumption is correct, then dramatic flexibility-induced changes in the permeation trajectories and observed water behavior are not to be expected, although energies will be modulated and water disorder may be larger.
Supporting evidence for this position is found by comparing our PMFs for cation permeation in GlpF with the corresponding profile due to Chakrabarti et al. (2004). Profile shapes are qualitatively similar in both periplasmic and cytoplasmic regions. In both, the energy barrier is near the NPA motifs. Further support is given by noting that our profiles for anion permeation through AQP1 qualitatively mimic results of de Groot et al. (2003). Naturally there are some quantitative differences, but the MD results differ sharply among themselves.
CONCLUSIONS
Both channels exhibit two highly ordered water molecules, one in the SF region and the other at the NPA site, producing an L defect in the H-bonded water chain, with their oxygens bound to protein hydrogens. In bAQP1 the H-bonded water chain is interrupted in the SF where water is roughly oriented in the plane perpendicular to the channel axis and forms three stable hydrogen bonds with protein atoms. The water conformation in this SF depends on the protonation locus in H182. In the GlpF pore there are no local restrictions on water molecule reorientation in either SF or NPA. Our MC results reveal that a proposed bipolar water arrangement is thermally disrupted in the NPA region in both proteins, particularly in the cytoplasmic part of the pore and that the equilibrium H-bonded chain is occasionally interrupted in the hydrophobic zones adjacent to the NPA.
bAQP1 and GlpF behave very differently when water is pushed through under applied pressure. In bAQP1 waters pass through the pore between the NPA and SF sites one at a time. The translocating H-bonded water chain displays no bipolar water orientation. In GlpF, two water molecules can simultaneously bond to the NPA asparagines and pass through the SF in zigzag fashion; no water single file is observed in the rigid GlpF pore. Formation of a single file requires narrowing GlpF.
Protein structure significantly affects water permeation and ion rejection in aquaporins. In bAQP1 the protein also controls the single-file alignment of water molecules. The water PMFs lead to wide wells in both bAQP1 and GlpF pores. Water molecule entry into the pore is favorable from both the cytoplasmic and periplasmic mouths.
A large free-energy barrier in the NPA region forbids alkali cation permeation through bAQP1 and GlpF. The PMFs show that for both aquaporins there is a large free-energy barrier in the cytoplasmic mouth rejecting alkali cation entry. Halide permeation is prevented by free-energy barriers in the periplasmic and cytoplasmic pores and by a large free-energy barrier in the periplasmic mouth rejecting anions.
Our modeling of charge permeation through these pores supports an electrostatic rather than reorientational basis for proton exclusion in aquaporins. Unlike the case of gramicidin, the AQP structure cannot compensate for dehydration of the protonic charge; in addition the electrostatic barrier in the NPA region would reject protons. In our view, properly describing redistribution of the protonic charge over larger complexes that include the possibility of proton hops to protein residues will reduce both solvation and electrostatic effects. It is also possible that our observation of highly ordered water single file and of a drastic interruption of an H-bonded water chain in the SF of bAQP1 also contribute to proton rejection. We hope future experimental study can resolve the current theoretical controversy.
Acknowledgments
We thank Benoît Roux for providing us with the CHARMM parameters for fluoride.
This work was supported by a National Institutes of Health grant (GM-28643).
References
- Akeson, M., and D. W. Deamer. 1991. Proton conductance by the gramicidin water wire. Model for proton conductance in the F0F1ATPases? Biophys. J. 60:101–109. [DOI] [PMC free article] [PubMed] [Google Scholar]
- Åqvist, J., H. Luecke, F. A. Quiocho, and A. Warshel. 1991. Dipoles localized at helix termini of proteins stabilize charges. Proc. Natl. Acad. Sci. USA. 88:2026–2030. [DOI] [PMC free article] [PubMed] [Google Scholar]
- Åqvist, J., and A. Warshel. 1993. Simulation of enzyme reactions using valence bond force fields and other hybrid quantum/classical approaches. Chem. Rev. 93:2523–2544. [Google Scholar]
- Batta, G., F. Sztaricskai, M. O. Makarova, E. G. Gladkikh, V. V. Pogozheva, and T. F. Berdnikova. 2001. Backbone dynamics and amide proton exchange at the two sides of the eremomycin dimer by 15N NRM. Chem. Commun. 5:501–502. [Google Scholar]
- Beckstein, O., and M. S. P. Sansom. 2004. The influence of geometry, surface character and flexibility on the permeation of ions and water through biological pores. Phys. Biol. 1:42–52. [DOI] [PubMed] [Google Scholar]
- Binder, K. 1992. The Monte Carlo Method in Condensed Matter Physics. Springer-Verlag, Berlin, Germany.
- Borgnia, M., S. Nielsen, A. Engel, and P. Agre. 1999. Cellular and molecular biology of the aquaporin water channels. Annu. Rev. Biochem. 68:425–458. [DOI] [PubMed] [Google Scholar]
- Burykin, A., and A. Warshel. 2003. What really prevents proton transport through aquaporin? Charge self-energy versus proton wire proposals. Biophys. J. 85:3696–3706. [DOI] [PMC free article] [PubMed] [Google Scholar]
- Burykin, A., and A. Warshel. 2004. On the origin of the electrostatic barrier for proton transport in aquaporin. FEBS Lett. 570:41–46. [DOI] [PubMed] [Google Scholar]
- Chakrabarti, N., E. Tajkhorshid, B. Roux, and R. Pomès. 2004. Molecular basis of proton blockage in aquaporins. Structure. 12:65–74. [DOI] [PubMed] [Google Scholar]
- Day, T. J. F., A. V. Soudackov, M. Čuma, U. W. Schmitt, and G. A. Voth. 2002. A second generation multistate empirical valence bond model for proton transport in aqueous systems. J. Chem. Phys. 117:5839–5849. [Google Scholar]
- Dorman, V. L., and P. C. Jordan. 2004. Ionic permeation free energy in gramicidin. A semi-microscopic perspective. Biophys. J. 86:3529–3541. [DOI] [PMC free article] [PubMed] [Google Scholar]
- Dorman, V., M. B. Partenskii, and P. C. Jordan. 1996. A semi-microscopic Monte Carlo study of permeation energetics in a gramicidin-like channel: the origin of cation selectivity. Biophys. J. 70:121–134. [DOI] [PMC free article] [PubMed] [Google Scholar]
- de Groot, B. L., A. Engel, and H. Grubmüller. 2001. A refined structure of human aquaporin-1. FEBS Lett. 504:206–211. [DOI] [PubMed] [Google Scholar]
- de Groot, B. L., T. Frigate, V. Helms, and H. Grubmüller. 2003. The mechanism of proton exclusion in aquaporin-1 water channel. J. Mol. Biol. 333:279–293. [DOI] [PubMed] [Google Scholar]
- de Groot, B. L., and H. Grubmüller. 2001. Water permeation through biological membranes: mechanism and dynamics of aquaporin-1 and GlpF. Science. 294:2353–2357. [DOI] [PubMed] [Google Scholar]
- Gilson, M. K., and B. Honig. 1988. Energetics of charge-charge interactions in proteins. Proteins. 3:32–52. [DOI] [PubMed] [Google Scholar]
- Fu, D., A. Libson, L. J. W. Miercke, C. Weitzman, P. Nollert, J. Krucinski, and R. M. Stroud. 2000. Structure of a glycerol conducting channel and the basis for its selectivity. Science. 290:481–486. [DOI] [PubMed] [Google Scholar]
- Harms, G. S., G. Orr, M. Montal, B. D. Thrall, S. D. Colson, and H. P. Lu. 2003. Probing conformational changes of gramicidin ion channels by single-molecule patch-clamp fluorescence microscopy. Biophys. J. 85:1826–1838. [DOI] [PMC free article] [PubMed] [Google Scholar]
- Ilan, B., E. Tajkhorshid, K. Schulten, and G. A. Voth. 2004. The mechanism of proton exclusion in aquaporin channels. Proteins. 55:223–228. [DOI] [PubMed] [Google Scholar]
- Jackson, J. D. 1962. Classical Electrodynamics. John Wiley, New York.
- Jensen, M. Ø., E. Tajkhorshid, and K. Schulten. 2001. The mechanism of glycerol conduction in aquaglyceroporins. Structure. 9:1083–1093. [DOI] [PubMed] [Google Scholar]
- Jensen, M. Ø., E. Tajkhorshid, and K. Schulten. 2003. Electrostatic tuning of permeation and selectivity in aquaporin water channels. Biophys. J. 85:2884–2899. [DOI] [PMC free article] [PubMed] [Google Scholar]
- Kong, Y., and J. Ma. 2001. Dynamic mechanisms of the membrane water channel aquaporin-1 (AQP1). Proc. Natl. Acad. Sci. USA. 98:14345–14349. [DOI] [PMC free article] [PubMed] [Google Scholar]
- Kuyucak, S., O. S. Andersen, and S. H. Chung. 2001. Models of permeation in ion channels. Rep. Prog. Phys. 64:1427–1472. [Google Scholar]
- Leach, A. R. 2001. Molecular Modelling: Principles and Applications. Prentice Hall, Harlow, England; New York, NY.
- Lobaugh, J., and G. A. Voth. 1996. The quantum dynamics of an excess proton in water. J. Chem. Phys. 104:2056–2069. [Google Scholar]
- Lockhart, D. J., and P. S. Kim. 1993. Electrostatic screening of charge and dipole interactions with the helix backbone. Science. 260:198–202. [DOI] [PubMed] [Google Scholar]
- MacKerell, A. D., Jr., D. Bashford, M. Bellott, R. L. Jr. Dunbrack, J. D. Evanseck, M. J. Field, S. Fischer, J. Gao, H. Guo, S. Ha, D. Joseph-McCarthy, L. Kuchnir, et al. 1998. All-atom empirical potential for molecular modeling and dynamics studies of proteins. J. Phys. Chem. B. 102:3586–3616. [DOI] [PubMed] [Google Scholar]
- Marx, D., M. E. Tuckerman, J. Hutter, and M. Parrinello. 1999. The nature of the hydrated excess proton in water. Nature. 397:601–604. [Google Scholar]
- Mehrotra, P. K., M. Mezei, and D. L. Beveridge. 1983. Convergence acceleration in Monte Carlo computer simulation on water and aqueous solutions. J. Chem. Phys. 78:3156–3166. [Google Scholar]
- Metropolis, N., A. Rosenbluth, M. Rosenbluth, A. Teller, and E. Teller. 1953. Equations of state calculations by fast computing machines. J. Chem. Phys. 21:1087–1091. [Google Scholar]
- Miloshevsky, G. V., and P. C. Jordan. 2004a. Details of water and ion permeation in AQP1 and GlpF water channels studied by Monte Carlo simulations. Biophys. J. 86:466a (Abstr.). [DOI] [PMC free article] [PubMed] [Google Scholar]
- Miloshevsky, G. V., and P. C. Jordan. 2004b. Gating gramicidin channels in lipid bilayers: reaction coordinates and the mechanism of dissociation. Biophys. J. 86:92–104. [DOI] [PMC free article] [PubMed] [Google Scholar]
- Miloshevsky, G. V., and P. C. Jordan. 2004c. Anion pathway and potential energy profiles along curvilinear bacterial ClC Cl− pores: electrostatic effects of charged residues. Biophys. J. 86:825–835. [DOI] [PMC free article] [PubMed] [Google Scholar]
- Murata, K., K. Mitsuoka, T. Hirai, T. Walz, P. Agre, J. B. Heymann, A. Engel, and Y. Fujiyoshi. 2000. Structural determinants of water permeation through aquaporin-1. Nature. 407:599–605. [DOI] [PubMed] [Google Scholar]
- Owicki, J. C., and H. A. Scheraga. 1977. Preferential sampling near solutes in Monte Carlo calculations on dilute solutions. Chem. Phys. Lett. 47:600–602. [Google Scholar]
- Pearlman, D. A., and P. A. Kollman. 1989. A new method for carrying out free energy perturbation calculations: dynamically modified windows. J. Chem. Phys. 90:2460–2470. [Google Scholar]
- Pomès, R., and B. Roux. 1996. Structure and dynamics of a proton wire: a theoretical study of H+ translocation along the single-file water chain in the gramicidin A channel. Biophys. J. 71:19–39. [DOI] [PMC free article] [PubMed] [Google Scholar]
- Pomès, R., and B. Roux. 2002. Molecular mechanism of H+ conduction in the single-file chain of the gramicidin channel. Biophys. J. 82:2304–2316. [DOI] [PMC free article] [PubMed] [Google Scholar]
- Preston, G. M., T. P. Carroll, W. B. Guggino, and P. Agre. 1992. Appearance of water channels in Xenopus oocytes expressing red cell CHIP28 protein. Science. 256:385–387. [DOI] [PubMed] [Google Scholar]
- Ren, G., V. S. Reddy, A. Cheng, P. Melnyk, and A. K. Mitra. 2001. Visualization of a water-selective pore by electron crystallography in vitreous ice. Proc. Natl. Acad. Sci. USA. 98:1398–1403. [DOI] [PMC free article] [PubMed] [Google Scholar]
- Sagnella, D. E., and M. E. Tuckerman. 1998. An empirical valence bond model for proton transfer in water. J. Chem. Phys. 108:2073–2083. [Google Scholar]
- Savage, D. F., P. F. Egea, Y. Robles-Colmenares, J. D. O'Connell III, and R. M. Stroud. 2003. Architecture and selectivity in aquaporins: 2.5 Å X-ray structure of aquaporin Z. Plos. Biol. 1:334–340. [DOI] [PMC free article] [PubMed] [Google Scholar]
- Schmitt, U. W., and G. A. Voth. 1998. Multistate empirical valence bond model for proton transport in water. J. Phys. Chem. B. 102:5547–5551. [Google Scholar]
- Schmitt, U. W., and G. A. Voth. 1999. The computer simulation of proton transfer in water. J. Chem. Phys. 111:9361–9381. [Google Scholar]
- Schutz, C. N., and A. Warshel. 2001. What are the dielectric “constants” of proteins and how to validate electrostatic models? Proteins. 44:400–417. [DOI] [PubMed] [Google Scholar]
- Sui, H., B.-G. Han, J. K. Lee, P. Walian, and B. K. Jap. 2001. Structural basis of water-specific transport through the AQP1 water channel. Nature. 414:872–878. [DOI] [PubMed] [Google Scholar]
- Tajkhorshid, E., P. Nollert, M. O. Jensen, L. J. W. Miercke, J. O'Connell, R. M. Stroud, and K. Schulten. 2002. Control of the selectivity of the aquaporin water channel family by global orientational tuning. Science. 296:525–530. [DOI] [PubMed] [Google Scholar]
- Taraphder, S., and G. Hummer. 2003. Dynamic proton transfer pathways in proteins: role of sidechain conformational fluctuations. Physica A. 318:293–301. [Google Scholar]
- Tuckerman, M., K. Laasonen, M. Sprik, and M. Parrinello. 1995. Ab initio molecular dynamics simulation of the solvation and transport of hydronium and hydroxyl ions in water. J. Chem. Phys. 103:150–161. [Google Scholar]
- Vuilleumier, R., and D. Borgis. 1997. Molecular dynamics of an excess proton in water using a non-additive valence bond force field. J. Mol. Struct. 436–437:555–565. [Google Scholar]
- Vuilleumier, R., and D. Borgis. 1999. Transport and spectroscopy of the hydrated proton: a molecular dynamics study. J. Chem. Phys. 111:4251–4266. [Google Scholar]
-
Vuilleumier, R., and D. Borgis. 2000. Wavefunction quantization of the proton motion in a
 dimer solvated in liquid water. J. Mol. Struct. 552:117–136. [Google Scholar]
 - Warshel, A. 1991. Computer Modeling of Chemical Reactions in Enzymes and Solutions. Wiley, New York.
- Warshel, A., and R. M. Weiss. 1980. An empirical valence bond approach for comparing reactions in solutions and in enzymes. J. Am. Chem. Soc. 102:6218–6226. [Google Scholar]
- Wei, D., and D. R. Salahub. 1994. Hydrated proton clusters and solvent effects on the proton transfer barrier: a density functional study. J. Chem. Phys. 101:7633–7642. [Google Scholar]
- Zhu, F., E. Tajkhorshid, and K. Schulten. 2001. Molecular dynamics study of aquaporin-1 water channel in a lipid bilayer. FEBS Lett. 504:212–218. [DOI] [PubMed] [Google Scholar]
- Zhu, F., E. Tajkhorshid, and K. Schulten. 2002. Pressure-induced water transport in membrane channels studied by molecular dynamics. Biophys. J. 83:154–160. [DOI] [PMC free article] [PubMed] [Google Scholar]
- Zhu, F., E. Tajkhorshid, and K. Schulten. 2004. Theory and simulation of water permeation in aquaporin-1. Biophys. J. 86:50–57. [DOI] [PMC free article] [PubMed] [Google Scholar]