

Abstract
Information about the enzyme kinetics in a metabolic network will enable understanding of the function of the network and quantitative prediction of the network responses to genetic and environmental perturbations. Despite recent advances in experimental techniques, such information is limited and existing experimental data show extensive variation and they are based on in vitro experiments. In this article, we present a computational framework based on the well-established (log)linear formalism of metabolic control analysis. The framework employs a Monte Carlo sampling procedure to simulate the uncertainty in the kinetic data and applies statistical tools for the identification of the rate-limiting steps in metabolic networks. We applied the proposed framework to a branched biosynthetic pathway and the yeast glycolysis pathway. Analysis of the results allowed us to interpret and predict the responses of metabolic networks to genetic and environmental changes, and to gain insights on how uncertainty in the kinetic mechanisms and kinetic parameters propagate into the uncertainty in predicting network responses. Some of the practical applications of the proposed approach include the identification of drug targets for metabolic diseases and the guidance for design strategies in metabolic engineering for the purposeful manipulation of the metabolism of industrial organisms.
INTRODUCTION
For more than a century, substantial scientific efforts have been invested in exploring the cellular metabolism to understand the properties of its elementary components, such as enzymes, and distinct subsystems, such as biosynthetic pathways. As a result, significant advancements have been made in this field, which in turn have led to the appreciation of the importance of studying individual enzymes within the context of metabolic networks and their physiological environment (Bailey, 1991, 1998; Papin et al., 2003). Metabolic flux analysis (MFA) is a framework that addresses an important aspect of this problem through the identification and analysis of the metabolic fluxes, i.e., steady-state reaction rates, in metabolic networks (Papoutsakis, 1984; Vallino and Stephanopoulos, 1993; Varma and Palsson, 1993a,b). The mass balance equations of metabolic intermediates and the balance equations of energy and redox allow the formulation of linear constraints on the chemical reaction rates around each metabolite. Some of the metabolic fluxes can be estimated through measurements of the consumption and production rates of extracellular metabolites, i.e., substrates and products, and through tracer experiments with stable isotopes that allow the estimation of some key intracellular reactions (Klapa et al., 2003; Sauer et al., 1997; Schmidt et al., 1999). This experimental information is used together with the linear constraints to obtain a quantitative estimation of the metabolic fluxes.
Constraints-based analysis (Price et al., 2003; Varma and Palsson, 1993a,b) is another MFA approach based also on the linear constraints on the metabolic reaction rates, and it allows the investigation of a broad range of properties of metabolic networks, such as the flux distribution in the metabolic network, that can support optimal growth rate, physiological responses of the flux distribution after gene deletion, medium requirements, and network robustness (Price et al., 2003).
MFA has been widely applied to interpret cellular physiology as well as to design experiments for redirecting metabolic fluxes for improved biological performance in medical and biotechnological applications (Stephanopoulos and Vallino, 1991; Varma and Palsson, 1993a,b; Yarmush and Berthiaume, 1997). However, MFA is limited in its ability to identify how fluxes in the metabolic networks are reconfigured in response to environmental and genetic changes since information about the kinetic properties of individual enzymatic steps in the metabolic networks is not considered within the analysis.
A variety of conceptual approaches have been developed to introduce kinetic information into the study of metabolic networks (Teusink et al., 2000; Vaseghi et al., 1999). Metabolic control analysis (MCA), initially called metabolic control theory, was one of the first frameworks developed for the study of metabolic networks with respect to their sensitivity to biochemical and environmental variations (Kacser and Burns, 1973). MCA offers a rigorous theoretical means for the quantification of the steady-state and dynamic responses of fluxes and metabolite concentrations induced by the changes of system parameters such as enzyme activities (Hatzimanikatis and Bailey, 1997; Kacser and Burns, 1973). Since its establishment, this conceptual framework has undergone extensive developments (Fell and Sauro, 1985; Hatzimanikatis and Bailey, 1996, 1997; Heinrich and Rapoport, 1974; Kholodenko and Westerhoff, 1993; Reder, 1988) and attracted significant attention as a powerful tool in basic biology, biophysics, biotechnology, and medicine (Berthiaume et al., 2003; Bowden, 1999; Cascante et al., 2002; Schuster, 1999; Westerhoff and Kell, 1996).
However, a persisting hurdle in MCA is the lack of comprehensive knowledge of the kinetic properties of the enzymes in a metabolic network. Although such information is available for many enzymes (Schomburg et al., 2002) and biochemical techniques allow measurements of the kinetic properties of a number of enzymes (Schmidt et al., 1999; Teusink et al., 2000), such information is generally obtained from in vitro studies, and in most of the cases, details about the in vivo kinetic properties of the enzymes are not accessible. In addition, even when the intracellular properties are inferred through sophisticated experiments, these measurements are subject to variations resulting from differences in experimental systems and conditions. Furthermore, most experiments conducted on living organisms to measure their metabolic properties yield results that are essentially ensemble averages. Thus, these results are inherently subject to extensive variations due to the differences between individual cells.
The uncertainty in enzyme kinetic parameters and its impact on the prediction of the metabolic properties have attracted considerable attention. A number of approaches have been proposed that employ parameter space sampling procedures and statistical analysis tools to study characteristics of metabolic network under parameter variations (Almaas et al., 2004; Alves and Savageau, 2000; Petkov and Maranas, 1997; Pritchard and Kell, 2002; Thomas and Fell, 1994). In this study, we introduce a computational framework that enables the statistical characterization of the kinetic responses of metabolic networks. It integrates information from biochemistry, genomics, cell physiology, and MFA, while taking into account the uncertainty associated with the kinetic information of enzymes in the network. Based on a previously developed (log)linear MCA formalism (Hatzimanikatis and Bailey, 1996, 1997; Hatzimanikatis et al., 1996), the number of metabolic parameters required for the analysis are reduced to a minimum, and the high degree of uncertainty, as well as the partial knowledge about the kinetic properties of the enzymes in metabolic pathways, are addressed using a Monte Carlo method that relies on large-scale computation. Statistical analysis of the simulation results allows us to identify and characterize quantitatively the rate-limiting steps in two characteristic metabolic networks: a branched biosynthetic pathway and the glycolysis pathway in yeast.
METHODS
Mathematic modeling of metabolic networks
For any metabolic system, the dynamics of the metabolite concentrations can be expressed by the equation that describes the metabolite mass balances,
 |
(1) |
where x is the metabolite concentration vector, N is the stoichiometric matrix, v is the metabolic flux vector, pe is the enzyme activity parameter vector, which includes both kinetic parameters and enzyme concentrations, and ps is the vector of other system parameters such as temperature and pH (for nomenclature and dimensions, see Table 1). Reversible fluxes are decomposed into two separate and opposite irreversible fluxes. The values of the metabolic fluxes are in general functions of metabolite concentrations, enzyme kinetic parameters, and other system parameters, such as pH and temperature. In particular, the forward and backward rate expressions of the same enzymatic reaction share some of the kinetic parameters.
TABLE 1.
MCA nomenclature
 |
In many metabolic networks, the concentration of some of the metabolites are subject to conservation constraints. Common examples include the compounds involved in energy (ATP, ADP, and AMP) and redox metabolism (NAD and NADH). The total amount of each group of these compounds, which are called conserved moieties, remains invariant over the characteristic response time of the metabolic network, although individual compound levels may vary (Heinrich et al., 1977; Reich et al., 1976). Consideration of the conserved moieties requires the introduction of a third parameter vector, pm, which represents the total concentration of the metabolites in each moiety group. Within each conserved moiety, the conservation constraint requires that the concentration of some compounds depends on the concentration of their counterparts. Accordingly, the original set of metabolite concentrations x is divided into two categories: an independent metabolite concentration vector, xi, and a dependent metabolite concentration vector, xd. Each element of the latter belongs to a different conserved moiety.
Conservation relationships among metabolites in a metabolic network lead to a rank deficiency of the stoichiometric matrix, N, by introducing linearly dependent rows. The rows that correspond to the mass balances of the independent metabolites can be extracted from the stoichiometric matrix, N, and form a new stoichiometric matrix, NR (Heinrich and Schuster, 1996; Reder, 1988). Consideration of the above constraints, leads to the reduction of the mass balance equations of the metabolic network (Eq. 1) into the form
 |
(2) |
where the set of system parameters, p, consists of the conserved moiety concentrations pm, the enzyme activity parameters pe, and other parameters included in ps,
 |
(3) |
(Log)linear kinetic formalism of MCA
Within the MCA framework, concentration control coefficients,  and flux control coefficients,
  are defined as the fractional change of metabolite concentrations and metabolic fluxes, respectively, in response to fractional changes of system parameters (Table 1) (Kacser and Burns, 1973). Following the established (log)linear model formalism (Hatzimanikatis et al., 1996; Reder, 1988), we can linearize and scale the system (Eq. 2) around the steady state, and derive these expressions for the control coefficients (see Supplementary Material for details):
 |
(4) |
 |
(5) |
Here, V is the diagonal matrix whose elements are the steady-state fluxes; Ei and Ed are the matrices of the elasticities with respect to metabolites, defined as the local sensitivities of metabolic fluxes to independent and dependent metabolite concentrations, respectively; IIm, IIe, and IIs are the matrices of the elasticities with respect to parameters, i.e., the local sensitivities of metabolic fluxes to system parameters, pm, pe, and ps, correspondingly (Table 1); and Qi is a weight matrix that represents the relative abundance of dependent metabolites with respect to the abundance of the independent ones. A second weight matrix, Qm, is also defined, for the relative abundance of dependent metabolites with respect to the levels of their corresponding total moieties, which leads to the expression for the matrices of elasticities with respect to parameters, IIm,
 |
(6) |
Numerical calculation of control coefficients
Eqs. 4 and 5 suggest that the values of the flux and concentration control coefficients depend on information from only four levels: system stoichiometry, flux distribution, conserved moiety compositions, and elasticities. Eqs. 4 and 5 lead to the important observation that the control coefficients do not depend explicitly on the concentration of the metabolites. The concentration of the metabolites affects only the values of the elasticities and the local dynamics of the system.
The stoichiometric matrix, N, can be constructed based on established biochemical studies and genomic information (Forster et al., 2003; Kanehisa and Goto, 2000; Krieger et al., 2004), and the reduced stoichiometric matrix, NR, can be readily deduced from system stoichiometry through the identification of the conserved moiety groups (Schuster and Hilgetag, 1995).
The values of the net steady-state fluxes in the matrix V can be estimated based on MFA studies (Varma and Palsson, 1993a,b; Schmidt et al., 1999; Teusink et al., 2000). Furthermore, each reversible flux is decomposed into a forward and a backward flux. We can define the equilibrium coefficient, ρ ε (0, +∞), as the ratio of the forward flux rate and the backward reaction rate,
 |
(7) |
The equilibrium coefficient is a measure of the value of the reversible steps relative to the net flux through the reversible enzyme,
 |
(8) |
A ρ-value close to 1 corresponds to forward and backward fluxes that are much greater than the net flux and indicates that the enzyme operates near thermodynamic equilibrium. The values ρ = 0 and ρ → ∞ correspond to irreversible reactions in the backward and forward directions, respectively. Fluxes in both directions can be calculated from the net flux value and the equilibrium coefficient.
The matrices of elasticities with respect to metabolites, Ei and Ed, depend on the local sensitivities of enzymatic reaction rates to metabolite concentrations. For example, for an enzyme that follows irreversible Michaelis-Menten kinetics,
 |
(9) |
the elasticity with respect to metabolite, ɛi,j, can be calculated as
 |
(10) |
Note that ɛi,j is a function of the scaled substrate concentration xj/Km,i only, and is bounded between 0 and 1. More generally, it can be easily shown that values of the elasticities with respect to metabolites for enzymes that follow other types of common kinetics also lie within well-defined bounds (Segel, 1975) (see Supplementary Material for some examples). For reversible reactions, as well as for reactions with multiple reactants and products, the enzyme elasticities with respect to substrates and products are correlated, since individual elasticities are functions of a common set of metabolite concentrations. For example, the rate expression of a single-substrate single-product reaction that follows reversible Michaelis-Menten kinetics can be written as
 |
(11) |
 |
(12) |
where a and p represent the scaled substrate and product concentrations, respectively, and the subscripts f and b denote the forward and backward reactions, respectively. The elasticities of these rate expressions with respect to substrate and product metabolite can be expressed as
 |
(13) |
 |
(14) |
 |
(15) |
 |
(16) |
These relationships suggest that the elasticities of this enzyme kinetic mechanism are correlated since four elasticities depend on two metabolite concentrations. Furthermore, the elasticities with respect to the reactant are in the range of [0,1] (Eqs. 13 and 16) and those with respect to the product are in the range of [−1,0] (Eqs. 14 and 15) (see Supplementary Material for the elasticities of enzymes with multiple reactants and products in the glycolysis pathway case study).
In most of the common rate expressions for enzyme kinetics (Segel, 1975), as in the following case studies, the reaction rate is proportional to a parameter called maximum reaction rate, vmax, which is the product of the total enzyme concentration and a catalytic rate constant, commonly called maximum specific enzyme activity. Under these conditions, the corresponding elasticity with respect to maximum enzyme activity is equal to 1, and therefore the corresponding elements in the matrix of elasticities with respect to parameters, IIe, are equal to 1. Some of the most common exceptions include the enzyme channeling cases (Kholodenko and Westerhoff, 1993), which will be the subject of future work.
The elements of the weight matrix, Qm, can be estimated based on knowledge about the relative concentration of the metabolites in the conserved moieties (see Results and Discussion, below, on how to obtain such estimates) and the elements of the moiety elasticity matrix, IIm, can be obtained from Eq. 6. Finally, the elements of the elasticity matrix, IIs, describe the effect of changes in other system parameters and can be estimated through information about the enzyme kinetics or perturbation experiments. In the case-studies considered here we do not consider changes in these parameters, and therefore the elasticity matrix, IIs, is not considered in this article.
Monte Carlo simulation and stability analysis
The uncertainty in the quantification of metabolic fluxes, enzyme kinetic properties, and metabolite concentrations, does not allow a precise quantification of the control coefficients. To address this problem, we have developed a Monte Carlo sampling methodology that allows us to describe control coefficients using statistical analysis and representation (Fig. 1). The method consists of the following steps:
Step 1. We define the stoichiometry based on biochemistry and genomics knowledge about the system.
Step 2. Steady-state fluxes are estimated based on experimental measurements and MFA methods.
Step 3. Through stoichiometric analysis, we identify the conserved moieties and we group metabolites into an independent group and dependent group.
Step 4. We assume a distribution for the value of the scaled metabolite concentrations that determine the distributions in the values of the corresponding elasticities. When details about the rate expressions of the enzymes are not available, we either use simple random generation of the elasticity values, or assume ad hoc kinetics. If the system involves conserved species, we also generate random values for the relative individual concentrations.
- Step 5. For the generated elasticity values and relative values of the conserved moieties, we test the local stability of the steady state. Although the values of control coefficients do not depend on metabolite concentration levels, for every randomly generated system, i.e., for a set of elasticities, the metabolite concentration levels will determine the local stability of the system. Thus, for every system in the population of the control coefficients, we generate random values for the metabolite concentration levels within physiological bounds, and we examine the local stability of the system based on the eigenvalues of the Jacobian matrix,
where Xi is a diagonal matrix of the corresponding metabolite concentrations. For feasible values of the control coefficients, all the eigenvalues of this matrix should have negative real parts for each sample.
(17) Step 6. If the steady state is not stable, we discard the set of values and return to Step 4 to generate another random system. If the steady state is stable, we calculate the corresponding control coefficients, store the data, and return to Step 4 for the next iteration.
After repeating this process multiple times, we generate a population of control coefficients. Unstable configurations are rejected and only stable ones are considered for the statistical analysis of the simulated systems. Although stable states that could correspond to locally unstable steady states, such as oscillations, have been observed in some metabolic systems, the current method has been developed for systems whose observable fluxes suggest that the system is operating at stable quasisteady states, i.e., the fluxes remain time-invariant over the observable timescale. In such systems, the naturally occurring condition appears to be stable and we do not introduce any bias by rejecting unstable solutions.
FIGURE 1.
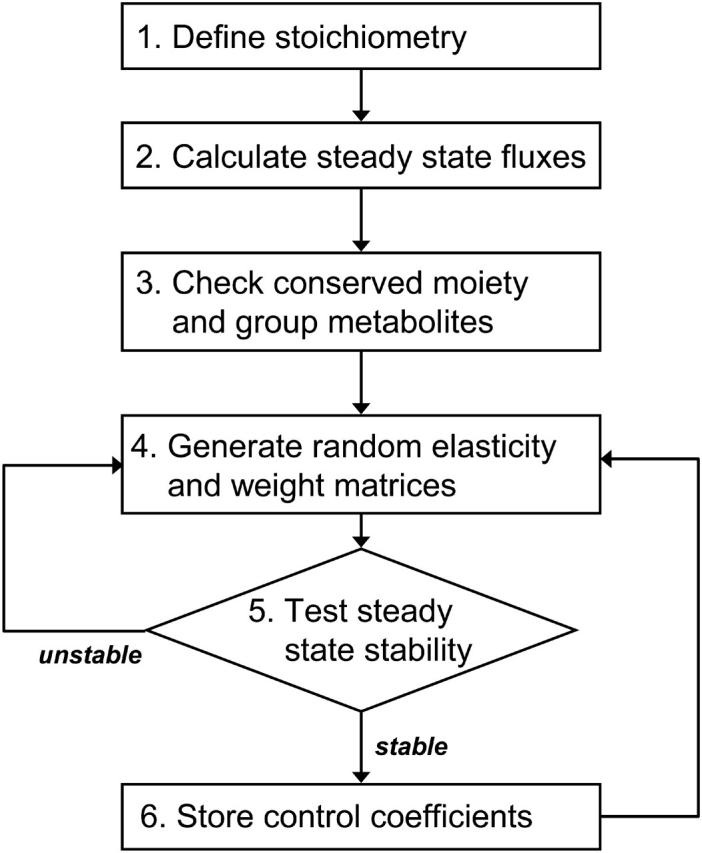
Diagrammatic description of the Monte Carlo simulation algorithm.
Monte Carlo simulations: elasticities
Enzyme elasticities associated with most common kinetic mechanisms are uniquely determined by the scaled metabolite concentrations, which require a complete knowledge about in vivo metabolite concentration levels and enzyme kinetic parameters. In general, such information is not available, and when available, it is subject to uncertainty due to experimental conditions as discussed above. Furthermore, in vivo conditions are very different from the in vitro conditions under which the kinetic parameters have been estimated. To simulate these uncertainties in the elasticities, we introduced the following Monte Carlo sampling technique.
Most of the enzymatic reactions initiate with the binding of the substrate or regulatory metabolite, S, on the active site, A, of the enzyme
 |
(18) |
According to this model, the free active site of the enzyme, A, binds reversibly to metabolite, S, to form the enzyme-substrate complex, AS, with an on-rate constant, kon, and an off-rate constant, koff. The total active site concentration is the sum of the concentration of the free active site and the active site-metabolite complex,
 |
(19) |
where [·] represents the concentration value of the corresponding species. The degree of the saturation of the active site can then be defined as
 |
(20) |
where
 |
(21) |
and the scaled metabolite concentration can therefore be expressed in terms of σA as
 |
(22) |
Assuming that the population of the active site in each species is evenly distributed between nonsaturation and full saturation, we uniformly sample σA by assigning random numbers between 0 and 1. Eq. 22 provides a general way of sampling scaled metabolite concentrations to generate random independent samples of scaled metabolite concentrations, which we can then use to calculate the elasticities with respect to metabolites, and subsequently, the control coefficients. Note that the distributions of the randomized elasticities with respect to metabolites will be determined by the particular enzyme kinetic mechanisms. For example, for enzymes that follow Michaelis-Menten kinetics, the elasticity with respect to the substrate will be uniformly distributed between 0 and 1; whereas for enzymes that follow Hill kinetics, the elasticity with respect to the substrate will be distributed between 0 and the value of the Hill coefficient, nh, following a bimodal distribution with peaks at the limiting values (Fig. 2). These observations are in agreement with the nature of different kinetic mechanisms. Enzymes that follow Hill kinetics switch between an active form and an inactive form, depending on the saturation status. Therefore the elasticity falls into two regimes corresponding to the different enzyme activity states. This type of information about the enzyme kinetics is captured by the Monte Carlo sampling and the uncertainty in the enzyme saturation levels, i.e., the uncertainty in both enzyme kinetics and metabolite concentrations, is translated into uncertainty in the control coefficients, which can be statistically quantified and analyzed. Furthermore, the bounds and distribution of σA can be refined for systems where detailed knowledge of the degree of enzyme saturation is available (Fig. 2).
FIGURE 2.

Uniform sampling of enzyme saturation degrees and randomization of elasticities with respect to metabolites. Histograms of elasticities with respect to metabolites for Michaelis-Menten kinetics and Hill kinetics (Hill coefficient = 2) for uniformly sampled enzyme saturation degree, σ, at three scenarios: uniform sampling between 0 and 1 (upper panels) corresponding to the full range of enzyme saturation degrees; uniform sampling between 0 and 0.5 (middle panel) corresponding to low enzyme saturation; and uniform sampling between 0.5 and 1 (lower panel) corresponding to high enzyme saturation.
Monte Carlo simulations: conserved moieties
The calculation of the conserved moiety weight matrices, Qi and Qm, is illustrated here using the two most prevalent and important conserved moieties in living cells: the adenylates group (AMP, ADP, and ATP) and the pyridine nucleotides group (NAD and NADH). Within each moiety, the individual species will be interconverted to each other through reactions in the metabolic network, but the total amount of each group always remains constant (Andersen and von Meyenburg, 1977; Ball and Atkinson, 1975; Reich, 1974; Reich and Selkov, 1981).
For the adenylates moiety, based on the conservation relationship
 |
(23) |
any of the three cofactors can be selected as a dependent metabolite (e.g., AMP) and the other two (ATP and ADP) will be independent metabolites. From the definition of Qi and Qm, their elements are merely the relative ratios of concentration of the various species within the conserved moiety (Table 1):
 |
(24) |
 |
(25) |
 |
(26) |
Uncertainty should be considered again in the analysis since intracellular metabolite concentrations might be unknown and they usually fluctuate under different cellular states and environments. In general, each of the metabolite concentrations could be uniformly sampled from physiological ranges if experimental measurements exist (Teusink et al., 2000).
For the adenylates pool, in particular, the values of the weight matrix entries are directly connected with the energetic state of the living cell. All three adenylates are important regulators of metabolic reactions and, more generally, many catabolic and anabolic processes are regulated by the energy status of the cell. An index named energy charge (ec) has been defined to reflect cellular energy status by quantifying the relative number of high-energy phosphate bonds in the adenylates moiety (Atkinson, 1968),
 |
(27) |
Although the value of energy charge can vary between 0 and 1, living cells maintain its value within a small range, ∼0.9 in Escherichia coli and 0.8–0.9 in Saccharomyces cerevisiae (Andersen and von Meyenburg, 1977; Ball and Atkinson, 1975). For a given ec value, the steady-state values of intracellular adenylates concentrations have the relations of
 |
(28) |
 |
(29) |
After substituting these relationships into Eqs. 24–26, we can express the elements of Qi and Qm as
 |
(30) |
 |
(31) |
 |
(32) |
These equations suggest that the elements of the adenylates weight matrices can be calculated based on the values for the ec index and the fraction of ATP in the adenylates pool. The viable ranges of the ec index has been experimentally accessed for different organism species and physiological conditions of the cells (Ball and Atkinson, 1975; Chapman et al., 1971). Eqs. 28 and 29 also suggest that, for all adenylates concentrations to be positive, the ATP fraction has to be bounded as
 |
(33) |
Therefore, we uniformly sample ec index values within the physiological range and, for each ec index, we uniformly sample the relative ATP levels between the bounds defined by Eq. 33. Thus, the corresponding indices of the weight matrices are randomized based on these samples (Eqs. 30–32).
Applying similar concepts on the quantification of the pyridine nucleotides moiety, we start from the linear conservation relationship
 |
(34) |
If we choose NAD as the dependent metabolite, the corresponding elements in Qi and Qm are again the relative ratios of moiety concentrations,
 |
(35) |
 |
(36) |
Taking physiological conditions into consideration, the pyridine nucleotides must be largely oxidized for the glycolytic reactions to proceed. An index called the catabolic reduction charge (crc) has been defined to represent the redox status of the cellular condition (Andersen and von Meyenburg, 1977),
 |
(37) |
After the introduction of this index, Eqs. 35 and 36 can be expressed as
 |
(38) |
 |
(39) |
Therefore, we uniformly sample crc values within the physiological range, ∼0.05 in aerobically grown E. coli and 0.001∼0.0025 in S. cerevisiae (Andersen and von Meyenburg, 1977; Holzer et al., 1956) and get the elements of the weight matrices.
Statistical analysis
After feasible configurations of simulation outputs are calculated and collected, statistical properties of the control coefficients are analyzed. The primary tool that we use in the studies presented here is that of the complementary cumulative distribution functions (CCDFs). The complementary cumulative distribution function, denoted here by F(x), measures the probability that the random variable X assumes a value greater or equal to x; that is, F(x) = P(X ≥ x) (Papoulis and Pillai, 2002). For a discrete sample, like the Monte Carlo simulation used in this study,
 |
(40) |
The CCDF will provide a measure of the probability that a control coefficient is greater than a certain value. Further statistical analysis of the populations of the control coefficients could also be performed (Pritchard and Kell, 2002), but it is beyond the scope of this article.
RESULTS AND DISCUSSION
In this section, we will illustrate the application of the MCA Monte Carlo method using two case studies: a prototypical module of biosynthetic pathways; and the more complex yeast glycolytic pathway.
Branched pathway
A primary module of metabolic networks is the branched pathway which, together with the linear pathway, constitutes the major building blocks of most metabolic networks. The splitting ratios of branching fluxes at key nodes essentially determine the overall distribution of metabolic fluxes in most biological systems. We chose the branched pathway presented in Fig. 3 as our first example to illustrate how to apply our framework on actual pathway models and how to interpret the simulation results.
FIGURE 3.

Branched pathway models. Four types of branched biosynthetic pathways consisting of three metabolites: (a) simple irreversible branched pathway; (b) branched pathway with a reversible reaction (ν2); (c) branched pathway with feedback inhibition; and (d) branched pathway with feedback inhibition and crossover activation.
Assuming irreversible Michaelis-Menten kinetics for all five fluxes, we derived an analytical expression for the flux control coefficients (Table 2). The expressions suggest that the flux control coefficients depend on the enzyme elasticities and on the splitting ratios alone. We used the sampling procedure described above and we generated populations of control coefficients for different splitting ratios of the flux through the pathway to study the distribution of the control coefficient of flux through enzyme 2, v2, with respect to the activity of enzyme 2, 
TABLE 2.
MCA elements and analytical results for the branched pathway model with irreversible kinetics
 |
Statistical analysis of the simulated results suggests that the splitting ratio has a critical impact on the control coefficients distributions. When the flux through enzyme 2 is a small portion of the overall flux, i.e., a splitting ratio α = v2/(v1+v2) = 0.1, in 95% of the cases the control coefficients of v2 with respect to  ) will be >0.5, with a mean value 0.84 (Fig. 4). As the splitting ratio α increases from 0.1 to 0.9, the ability to control v2 via manipulation of
  is continuously attenuating, as indicated by decreasing mean values of
  and the dramatic change in the CCDF (Fig. 4).
FIGURE 4.

Effects of splitting ratio on the flux control coefficients in branched pathway. CCDFs of the flux control coefficients  of the branched pathway for different splitting ratios, α = v2/v1. The CCDF measures the probability that the random variable
  is ≥x.
Reversibility also affects the distributions of control coefficients. If v2 is assumed to be a reversible reaction (Fig. 3 b) (see Table 3 for MCA elements of this model), and we consider the control of  over the net flux v2, the value of the equilibrium coefficient has a profound effect on the magnitudes of control coefficients (Fig. 5 a). The closer the flux v2 is to equilibrium, the smaller the control coefficient
  (Fig. 5 b) will be. This illustrates the well-known postulate that enzymes that operate near thermodynamic equilibrium do not have significant control over metabolic fluxes. In addition, this result also captures the fact that reversible reactions can have a significant control of metabolic fluxes if they do not operate near equilibrium, contrary to the common misunderstanding that reversible enzymes do not have control over metabolic fluxes regardless of their operating state with respect to the equilibrium conditions.
TABLE 3.
MCA elements for the branched pathway model with reversible kinetics
 |
FIGURE 5.
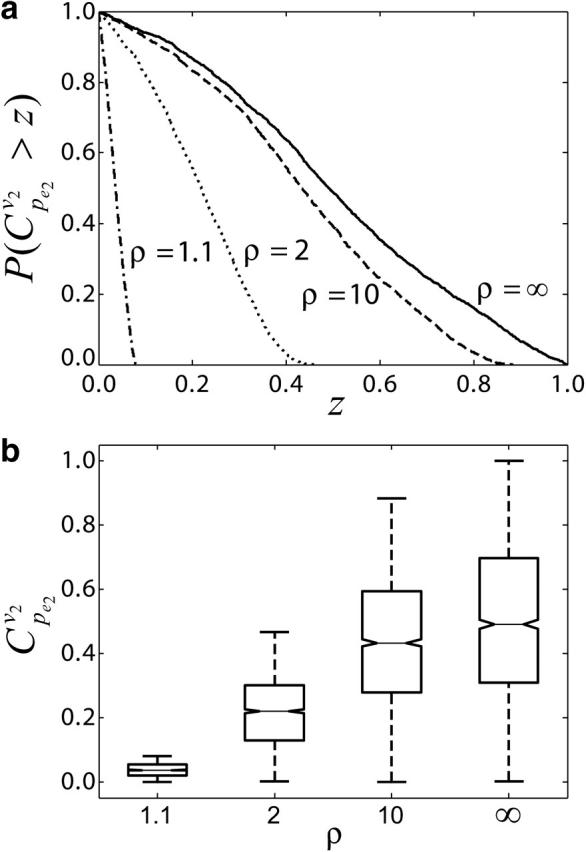
Effects of equilibrium coefficient ρ on control coefficients. (a) CCDFs of the control coefficient  at four different values of the equilibrium coefficient ρ of reaction v2 in the branched pathway with v2/v1 = 0.1. The values are ρ = ∞ (solid line); ρ = 1.1 (dashed line); ρ = 2 (dotted line); and ρ = 10 (dash-dotted line). (b) Box plot of
  distributions, with middle lines representing the median of the distributions; the lower and the upper bounds of the boxes corresponding to the first and the third quartiles; and the dashed lines extending from each end of the box to show the range of the data.
Another critical feature of enzyme-catalyzed reactions is their capacity to adjust according to the metabolic requirements. Such control sometimes is accomplished at the transcription level by enzyme synthesis through induction and repression, which can involve complicated molecular mechanisms. At the enzymes level, inhibition and/or activation of the enzymes by the metabolites in a metabolic network are extensively employed to regulate metabolic fluxes. We studied how the distributions of the control coefficients of the unregulated branched pathway change when we consider two different regulatory structures: 1), a product competitive inhibition scheme (Fig. 3 c); and 2), a product competitive inhibition with crossover cooperative activation scheme (Fig. 3 d).
When product competitive inhibition is present, the kinetic expressions for v2 and v3 are considered to be
 |
(41) |
 |
(42) |
where KI,2 and KI,3 are the inhibition constants. When crossover cooperative activation is included with competitive inhibition, the kinetics of v2 and v3 are expressed as
 |
(43) |
 |
(44) |
where KA,2 and KA,3 are the activation constants. As indicated by the results of Fig. 6 a, the regulation imposed on the enzymes enhances the rigidity of the system and consequently attenuates the ability of controlling the flux through enzyme 2 by manipulating enzyme activity as expected. This observation is in agreement with the metabolic rigidity concept, which states that flux alterations at branching points will be largely constrained by control architectures of the network (Stephanopoulos and Vallino, 1991).
FIGURE 6.
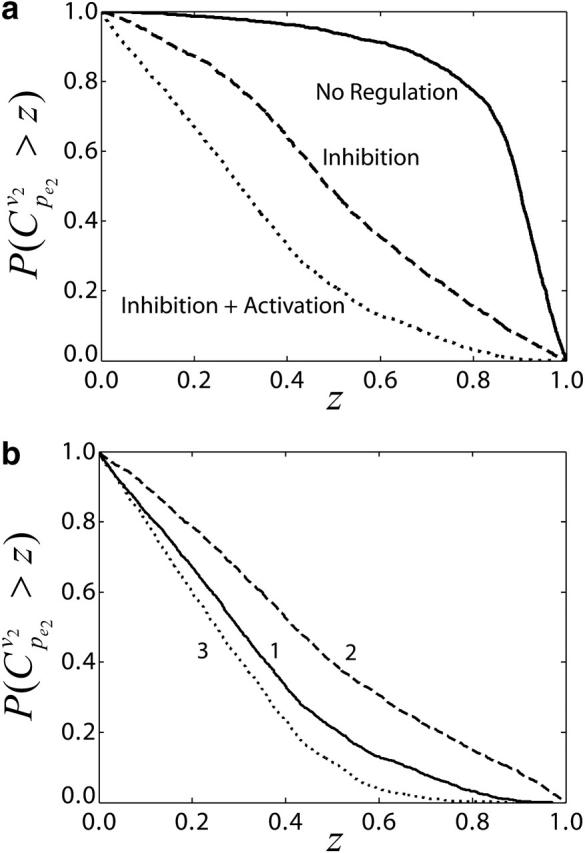
Impacts of enzyme regulation on the control coefficients distributions. (a) CCDFs of control coefficient  for cases of regulatory structures in the branched pathway with v2/v1 = 0.1. No enzyme regulation (solid line); product competitive inhibition (dashed line); and product competitive inhibition and crossover cooperative activation (dotted line). (b) CCDFs of the control coefficient
  for the same regulatory structure (product competitive inhibition and crossover cooperative activation) and for different kinetic mechanisms: (1) cooperative activation (solid line); (2) allosteric activation (dashed line); and (3) generic activation (dotted line).
Different enzyme regulation mechanisms also influence the distributions of control coefficients. To illustrate this, we compared two common types of activations in the inhibition-activation branched pathway model of Fig. 3 d, i.e., cooperative activation and allosteric activation. The kinetics of ν2 and ν3 with allosteric activation are expressed as
 |
(45) |
 |
(46) |
which are very different from the regulation mechanisms described by Eqs. 43 and 44. Despite the differences in the enzyme regulation mechanisms, the differences in the distribution of the control coefficients are not dramatic, although the difference of the means of the two populations of the control coefficients is statistically significant (Fig. 6 b). These results also illustrate that in the absence of knowledge about the kinetic mechanisms we can assume alternative mechanisms, perform the Monte Carlo studies, and evaluate the significance of the alternative mechanisms on the calculation of the control coefficients.
In a more general case when the activation mechanism is unknown for a given enzyme, we can randomize independently the elasticity of inhibitor uniformly within [−1,0] and that of activator uniformly within [0,1]. As shown by curve 3 in Fig. 6 b, the results can still convey useful information for the control property of the system, although the exact mechanism of enzyme kinetics and/or regulation might have a statistically significant impact on the distribution of the control coefficients. The proposed computational methodology offers the possibility to computationally investigate the effects of different enzyme kinetics by assuming alternative kinetics expressions, or by explicit randomization of the elasticities, and comparing the distributions of the control coefficients. Such studies will further provide suggestions on the importance of knowledge of enzyme kinetics in deriving conclusions about rate-limiting enzymes and metabolic system responses to changes in system parameters.
Glycolysis pathway
The glycolysis pathway is the main pathway of glucose catabolism in most of the organisms, and is one of the most complex metabolic pathways. In glycolysis, a molecule of glucose is degraded to two molecules of pyruvate via a series of enzyme-catalyzed reactions. ATP and NADH are the carriers of energy and redox, respectively. Under anaerobic conditions, pyruvate is further transformed into reduced products such as ethanol and lactic acid. This fermentation process is one of the major energy sources for living organisms under respiration-limited conditions. We studied the anaerobic metabolism in yeast to illustrate the application of our framework in such a complex metabolic network.
We based our study on a kinetic model of glycolysis of nongrowing, anaerobic S. cerevisiae developed by Teusink et al. (2000) through the combination of in vitro and in vivo experiments. The model, represented by the pathway shown in Fig. 7, consists of 19 metabolic fluxes (12 reversible and 7 irreversible fluxes) and 17 intermediates including energy and redox cofactors. In addition to the primary product of ethanol, byproducts such as glycerol and succinate are also considered in the system (see Supplementary Material for model details).
FIGURE 7.
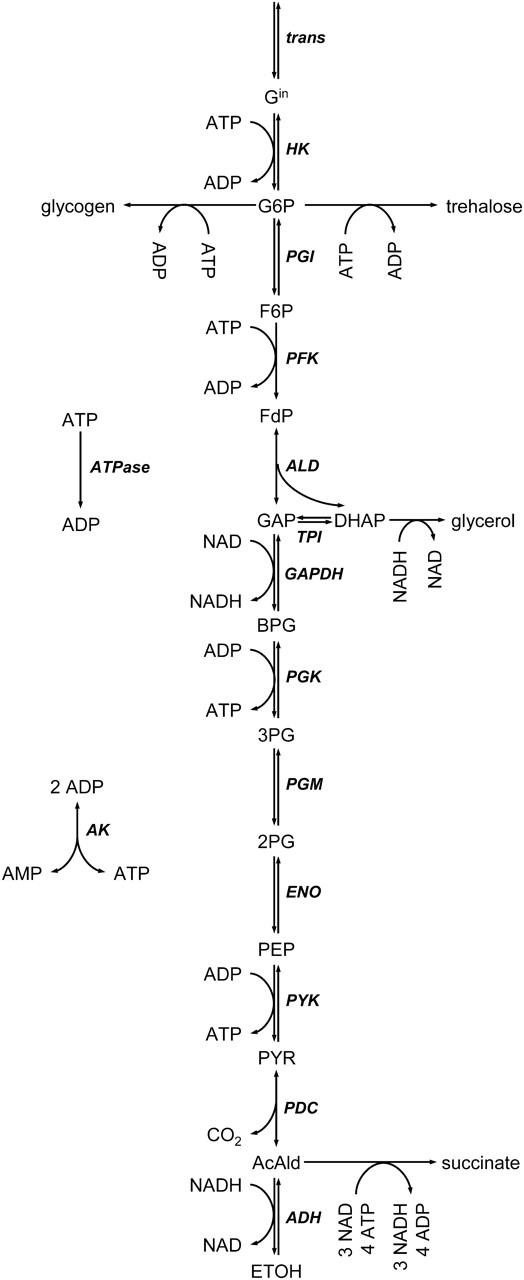
Anaerobic glycolytic pathway model of nongrowing yeast, S. cerevisiae, with glucose as the sole carbon source. Chemical species: Gin, intracellular glucose; G6P, glucose-6-phosphate; F6P, fructose-6-phosphate; FdP, fructose 1,6-diphosphate; GAP, glyceraldehydes-3-phosphate; DHAP, dihydroxy acetone phosphate; BPG, bisphosphoglycerate; 3PG, 3-phosphoglycerate; 2PG, 2-phosphoglycerate; PEP, phosphoenolpyruvate; PYR, pyruvate; AcAld, acetaldehyde; ETOH, ethanol; ATP, adenosine triphosphate; ADP, adenosine diphosphate; AMP, adenosine monophosphate; NAD and NADH, nicotinamide adenine dinucleotide. Pathway steps and enzymes (in bold): trans, glucose cross-membrane transport; HK, hexokinase; PGI, phosphoglucose isomerase; PFK, phosphofructokinase; ALD, fructose 1,6-diphosphate aldolase; TPI, triose phosphate isomerase; GAPDH, glyceraldehydes-3-phosphate dehydrogenase; PGK, phosphoglycerate kinase; PGM, phosphoglycerate mutase; ENO, enolase; PYK, pyruvate kinase; PDC, pyruvate decarboxylase; ADH, alcohol dehydrogenase; ATPase, net ATP consumption; and AK, adenylate kinase.
Considering the mass balance equations around each metabolite node, a 17×31 stoichiometric matrix N was constructed, and two conserved moieties were identified in the system: the pyridine nucleotides ([NADH] + [NAD] = [AN]) and the adenylates ([ATP] + [ADP] + [AMP] = [AP]). The total concentrations of these moieties, [AN] and [AP], were accordingly included into the analysis as additional parameters (described in Methods). NAD and AMP were selected as the dependent metabolites and the reduced stoichiometry matrix, NR, was constructed. Based on the pathway stoichiometry and physiological measurements of product formation rates (Teusink et al., 2000), a steady-state flux distribution was determined by MFA (see Supplementary Material for details).
The elasticities with respect to metabolites are calculated based on the enzyme kinetics mechanism provided by the model (Teusink et al., 2000) (see Supplementary Material for details) and the scaled metabolite concentrations generated by uniformly sampling enzyme saturation degrees. For the calculation of weight matrix indices, ATP was chosen as the independent metabolite of the adenylates moiety and its fraction in the adenylates pool was sampled based on the uniformly randomized energy charge within its physiologically measured range, [0.8–0.9] (Ball and Atkinson, 1975), and Eq. 33. The catabolic reduction charge is randomized within experimental range, [0.001–0.0025] (Holzer et al., 1956). After a Monte Carlo simulation, 5495 random datasets were sampled before the 5000 sample sets, yielding stable solutions (91% stability), and the distribution of the flux control coefficients was determined.
In the yeast anaerobic metabolic pathway, the enzyme alcohol dehydrogenase (ADH) catalyzes the reaction step leading to ethanol production and the flux through this enzyme also reflects the overall flux through the glycolysis pathway since it is the main output flux of the carbon through glycolysis. We analyzed the distribution of the control coefficients of the flux through this enzyme with respect to three key enzymes: phosphofructokinase (PFK), pyruvate kinase (PYK), and the enzyme facilitating the transport of glucose across the plasma membrane (transporter). A large number of enzymes have been identified as hexose transporters. In this study, as in most of the modeling studies, we lump the function and kinetics of each enzyme into a single step. PFK and PYK catalyze phosphoryl group transfer reactions during the glucose breakdown and are major points of regulation in glycolysis (Fig. 7). Similarly, glucose transport has been shown to exert considerable control on the glycolytic flux (Reijenga et al., 2001). Hence, a detailed study of the control coefficients of ADH with respect to these three key enzymes would be of interest for a better understanding of the control of the glycolytic fluxes.
Our result confirmed that glucose uptake exerts the stronger control on the glycolytic flux, with PFK, and to a lesser extent PYK, sharing the control (Fig. 8 a). This implies that the changes in the activity of glucose transporters might lead to significant changes in anaerobic ethanol production. However, the mean values of the control coefficients are relatively low (0.48 for transport, 0.27 for PFK, and 0.09 for PYK), suggesting that overexpression of any of the enzymes alone might not lead to significant changes. This is consistent with experimental studies that have shown that single enzyme overexpression cannot increase glycolytic flux in yeast (Schaaff et al., 1989). Furthermore, our results suggest that simultaneous overexpression of PFK and PYK will also be ineffective in increasing glycolytic flux, since the probability of these enzymes, together, to have a flux control coefficient >0.2, is <0.25. These conclusions are also in agreement with the previously reported experiments on simultaneous overexpression of PFK and PYK (Schaaff et al., 1989). Although these experimental studies have been performed under conditions different from those used to quantify our Monte Carlo model, the statistical nature of our framework allows us to draw some broader conclusions since it could account for the uncertainties introduced due to the relative differences between the two experimental systems.
FIGURE 8.

CCDFs of the control coefficients of flux through ADH with respect to glucose transport, PFK, and PYK activity. (a) Control of ethanol production by three enzymes, transporter (dotted line), PFK (dashed line), and PYK (solid line), based on the kinetic mechanisms provided by Teusink et al. (2000). (b) Control of ethanol production by the conserved pyridine nucleotides moiety (solid line) and adenylates moiety (dashed line) based on the kinetic mechanisms provided by Teusink et al. (2000). (c) Control of ethanol production by three enzymes, transporter (dotted line), PFK (dashed line), and PYK (solid line), for unknown kinetic mechanisms. (d) Control of ethanol production by the conserved pyridine nucleotides moiety (solid line) and adenylates moiety (dashed line) for unknown kinetic mechanisms.
In addition, we studied the control over ethanol production, and glycolytic flux, exerted by the conserved moieties. As indicated by Fig. 8 b, increasing the total level of pyridine nucleotides will likely lead to a decrease of ethanol production, whereas increasing adenylates concentration is more likely to result in an increase of ethanol production. However, the negative values for some of the control coefficients of the ethanol production with respect to the total level of adenylates (Fig. 8 b) suggest that there exist some configurations of elasticities that could lead to a decrease in ethanol production when the total level of adenylates is increasing. Although there is no experimental evidence of such coupling between glycolytic flux and conserved moieties, it illustrates the potential control of the levels of the conserved moieties on metabolic fluxes as previously demonstrated for simpler model systems (Kholodenko et al., 1994).
For many biological organisms under investigation, systematic and detailed descriptions of enzyme kinetic mechanisms are absent. This is a typical challenge when genome-scale metabolic networks are considered (Forster et al., 2003). To examine the possibility of applying our framework to such systems, we assumed no information of enzyme kinetic expressions of the glycolysis model and randomized all elasticities with respect to metabolites by uniform sampling between [0,1] for substrates and activator metabolites, and [−1,0] for products and inhibitor metabolites. In this scenario, we observed similar patterns of control coefficients distributions (Fig. 8, c and d) as before (Fig. 8, a and b). However, the distribution of the glycolytic flux control coefficients with respect to PYK and PFK appear to be sensitive to the knowledge about the details of enzyme kinetics, whereas the distribution of the control coefficient with respect to glucose transport remains almost the same. These observations suggest that accurate estimation of the control coefficients of glycolytic flux, with respect to PYK and PFK, will require knowledge of the kinetic mechanism of some of the enzymes in the pathway, while glucose transport is, indeed, one of the most important determining steps of the glycolytic flux. A more detailed analysis of the effects of the knowledge of the kinetic mechanisms of the individual enzymes could help us identify which are the enzymes for which additional knowledge about their kinetics is required.
CONCLUDING REMARKS
The statistical and computational MCA framework presented here combines principles and methods from biochemistry, mathematical modeling, systems engineering, computational biology, and statistics. The framework expands the usefulness of MCA in identifying, quantifying, and ranking the rate-limiting enzymes in complex metabolic networks through statistical evaluation that accounts for the uncertainty involved on the parameters that underlie the value of the flux control coefficients.
In the investigation of biological systems, experimental approaches are limited to the study of relatively small parts of a metabolic network. In contrast, a mathematical model does not adhere to such limitations, and appears to be more advantageous in studying the behavior of large networks. Metabolic flux analysis (MFA) allows the study of large networks but it does not allow the investigation of the network responses to changes in the kinetic parameters of the network. By combining information from MFA with the MCA kinetic description, the Monte Carlo MCA framework developed in this article successfully adopts the merits of both methods, and allows us to infer the global regulation of cellular metabolism using large-scale computations.
The proposed method allows us to study the network properties under uncertainty. Such uncertainty may arise from partial knowledge about the kinetic properties of the enzymes in the network, as well as from variability in the environmental conditions under which the in vitro and in vivo experimental studies are performed. Thus, the analysis of the simulated results could allow the reconciliation of experimental information about the same system from different sources and experimental conditions.
The case studies presented here illustrate that the response of metabolism to changes in cellular and environmental parameters depends on the values of the metabolic fluxes and possibly on the kinetic mechanisms of the enzymes. The sensitivity of the distribution of the control coefficients on the kinetic mechanisms used for the estimation of the elasticities, suggests that uncertainty in the reaction mechanism and in the value of the elasticities of some enzymes, contribute significantly to the uncertainty of control coefficients. Simulation studies using alternative kinetic mechanisms will help us identify the enzymes whose kinetics have the most significant effect on the uncertainty of the predicted system properties. To address this problem quantitatively we have developed a framework, based on uncertainty propagation methodologies, that identifies the relative contribution of the uncertainties in the elasticities of each enzyme to the uncertainty in the estimation of the control coefficients (F. Mu and V. Hatzimanikatis, unpublished). The enzymes with the greatest contribution in the uncertainty of the control coefficients should be the subject of experimental studies that will determine the details of their kinetic mechanism for an accurate prediction of the network properties.
Conserved moieties, enzyme channeling, futile cycles, cofactor coupling, and regulatory interactions contribute significantly to the complexity of metabolic networks. Application of the proposed framework and the related framework for the quantification of uncertainty propagation (F. Mu and V. Hatzimanikatis, unpublished) to such complex pathways will allow us to build a better understanding on how these elements, e.g., levels of conserved moieties and enzyme channeling, contribute to the values of the control coefficients and to the uncertainty in estimating these values since the framework requires no explicit knowledge of kinetic parameters.
The MCA formalism allows the estimation of the response of metabolic networks to relatively small changes in the metabolic parameters. Estimation of the response of metabolism to large changes in the metabolic parameters will require the use of detailed nonlinear models for the kinetics of the enzymes in the pathway. However, at the vicinity of small changes in the metabolic parameters, the results of both formalisms will be equivalent and the distribution of the control coefficients will remain unaffected, unless the nonlinear model operates near critical bifurcation points. An MCA framework, like the one presented here, will provide guidance for studies of nonlinear models under large changes in the kinetic parameters. The ability of our framework to capture the effect of the hypothesized kinetic mechanisms, and the functional form of the corresponding elasticities, on the estimated distributions of the control coefficients will further provide a systematic method and a starting point for the evaluation of the effects of uncertainty in the kinetic mechanisms of the enzymes in nonlinear models.
The identifications of drug targets in metabolic diseases, the metabolic engineering of industrial organisms, and the identification of the genotype-to-phenotype relationship, are some of the important applications of MCA (Cascante et al., 2002). All of these systems involve a great degree of uncertainty, they are subject to wide variations of their extracellular environment, and their ultimate function is the result of a population of individual cells. The ability of the proposed framework to quantify system properties based on a range of system parameters is ideal for studying the properties of multicellular complex systems.
SUPPLEMENTARY MATERIAL
An online supplement to this article can be found by visiting BJ Online at http://www.biophysj.org.
Supplementary Material
Acknowledgments
The authors are grateful for the financial support provided by the Department of Energy (DE-AC36-99GO103), the National Aeronautics and Space Administration (NAG 2-1527), and DuPont through a DuPont Young Professor Award (to V.H.). L.W. received partial support by the Chinese Government through the State Excellence Scholarship program for students studying overseas.
İnanç Birol's present address is Dept. of Chemical and Environmental Engineering, Illinois Institute of Technology, Chicago, IL 60616.
References
- Almaas, E., B. Kovacs, T. Vicsek, Z. N. Oltvai, and A. L. Barabasi. 2004. Global organization of metabolic fluxes in the bacterium Escherichia coli. Nature. 427:839–843. [DOI] [PubMed] [Google Scholar]
- Alves, R., and M. A. Savageau. 2000. Systemic properties of ensembles of metabolic networks: application of graphical and statistical methods to simple unbranched pathways. Bioinformatics. 16:534–547. [DOI] [PubMed] [Google Scholar]
- Andersen, K. B., and K. von Meyenburg. 1977. Charges of nicotinamide adenine nucleotides and adenylate energy charge as regulatory parameters of the metabolism in Escherichia coli. J. Biol. Chem. 252:4151–4156. [PubMed] [Google Scholar]
- Atkinson, D. E. 1968. The energy charge of the adenylate pool as a regulatory parameter. Interaction with feedback modifiers. Biochemistry. 7:4030–4034. [DOI] [PubMed] [Google Scholar]
- Bailey, J. E. 1991. Toward a science of metabolic engineering. Science. 252:1668–1675. [DOI] [PubMed] [Google Scholar]
- Bailey, J. E. 1998. Mathematical modeling and analysis in biochemical engineering: past accomplishments and future opportunities. Biotechnol. Prog. 14:8–20. [DOI] [PubMed] [Google Scholar]
- Ball, W. J., and D. E. Atkinson. 1975. Adenylate energy charge in Saccharomyces cerevisiae during starvation. J. Bacteriol. 121:975–982. [DOI] [PMC free article] [PubMed] [Google Scholar]
- Berthiaume, F., A. D. MacDonald, Y. H. Kang, and M. L. Yarmush. 2003. Control analysis of mitochondrial metabolism in intact hepatocytes: effect of interleukin-1β and interleukin-6. Metab. Eng. 5:108–123. [DOI] [PubMed] [Google Scholar]
- Bowden, A. C. 1999. Metabolic control analysis in biotechnology and medicine. Nat. Biotechnol. 17:641–643. [DOI] [PubMed] [Google Scholar]
- Cascante, M., L. G. Boros, B. Comin-Anduix, P. de Atauri, J. J. Centelles, and P. W. N. Lee. 2002. Metabolic control analysis in drug discovery and disease. Nat. Biotechnol. 20:243–249. [DOI] [PubMed] [Google Scholar]
- Chapman, A. G., L. Fall, and D. E. Atkinson. 1971. Adenylate energy charge in Escherichia coli during growth and starvation. J. Bacteriol. 108:1072–1086. [DOI] [PMC free article] [PubMed] [Google Scholar]
- Fell, D. A., and H. M. Sauro. 1985. Metabolic control and its analysis. Additional relationships between elasticities and control coefficients. Eur. J. Biochem. 148:555–561. [DOI] [PubMed] [Google Scholar]
- Forster, J., I. Famili, P. Fu, B. O. Palsson, and J. Nielsen. 2003. Genome-scale reconstruction of the Saccharomyces cerevisiae metabolic network. Genome Res. 13:244–253. [DOI] [PMC free article] [PubMed] [Google Scholar]
- Hatzimanikatis, V., and J. E. Bailey. 1996. MCA has more to say. J. Theor. Biol. 182:233–242. [DOI] [PubMed] [Google Scholar]
- Hatzimanikatis, V., and J. E. Bailey. 1997. Effects of spatiotemporal variations on metabolic control: approximate analysis using (log)linear kinetic models. Biotechnol. Bioeng. 54:91–104. [DOI] [PubMed] [Google Scholar]
- Hatzimanikatis, V., C. A. Floudas, and J. E. Bailey. 1996. Analysis and design of metabolic reaction networks via mixed-integer linear optimization. AICHE J. 42:1277–1292. [Google Scholar]
- Heinrich, R., S. M. Rapoport, and T. A. Rapoport. 1977. Metabolic regulation and mathematical models. Prog. Biophys. Mol. Biol. 32:1–82. [PubMed] [Google Scholar]
- Heinrich, R., and T. A. Rapoport. 1974. A linear steady-state treatment of enzymatic chains. General properties, control and effector strength. Eur. J. Biochem. 42:89–95. [DOI] [PubMed] [Google Scholar]
- Heinrich, R., and S. Schuster. 1996. The Regulation of Cellular Systems. Chapman & Hall, New York.
- Holzer, H., F. Lynen, and G. Schultz. 1956. Biochem. Z. 328:252–263 [Determination of diphosphopyridine nucleotide/reduced diphosphopyridine nucleotide quotient in living yeast cells by analysis of constant alcohol and acetaldehyde concentrations]. [PubMed] [Google Scholar]
- Kacser, H., and J. A. Burns. 1973. The control of flux. Symp. Soc. Exp. Biol. 27:65–104. [PubMed] [Google Scholar]
- Kanehisa, M., and S. Goto. 2000. KEGG: Kyoto encyclopedia of genes and genomes. Nucleic Acids Res. 28:27–30. [DOI] [PMC free article] [PubMed] [Google Scholar]
- Kholodenko, B. N., H. M. Sauro, and H. V. Westerhoff. 1994. Control by enzymes, coenzymes and conserved moieties. A generalisation of the connectivity theorem of metabolic control analysis. Eur. J. Biochem. 225:179–186. [DOI] [PubMed] [Google Scholar]
- Kholodenko, B. N., and H. V. Westerhoff. 1993. Metabolic channelling and control of the flux. FEBS Lett. 320:71–74. [DOI] [PubMed] [Google Scholar]
- Klapa, M. I., J. C. Aon, and G. Stephanopoulos. 2003. Systematic quantification of complex metabolic flux networks using stable isotopes and mass spectrometry. Eur. J. Biochem. 270:3525–3542. [DOI] [PubMed] [Google Scholar]
- Krieger, C. J., P. Zhang, L. A. Mueller, A. Wang, S. Paley, M. Arnaud, J. Pick, S. Y. Rhee, and P. D. Karp. 2004. MetaCyc: a multiorganism database of metabolic pathways and enzymes. Nucleic Acids Res. 32:D438–D442. [DOI] [PMC free article] [PubMed] [Google Scholar]
- Papin, J. A., N. D. Price, S. J. Wiback, D. A. Fell, and B. O. Palsson. 2003. Metabolic pathways in the post-genome era. Trends Biochem. Sci. 28:250–258. [DOI] [PubMed] [Google Scholar]
- Papoulis, A., and S. U. Pillai. 2002. Probability, Random Variables, and Stochastic Processes. McGraw-Hill, Boston, MA.
- Papoutsakis, E. T. 1984. Equations and calculations for fermentations of butyric-acid bacteria. Biotechnol. Bioeng. 26:174–187. [DOI] [PubMed] [Google Scholar]
- Petkov, S. B., and C. D. Maranas. 1997. Quantitative assessment of uncertainty in the optimization of metabolic pathways. Biotechnol. Bioeng. 56:145–161. [DOI] [PubMed] [Google Scholar]
- Price, N. D., J. A. Papin, C. H. Schilling, and B. O. Palsson. 2003. Genome scale microbial in-silico models: the constraints-based approach. Trends Biotechnol. 21:162–169. [DOI] [PubMed] [Google Scholar]
- Pritchard, L., and D. B. Kell. 2002. Schemes of flux control in a model of Saccharomyces cerevisiae glycolysis. Eur. J. Biochem. 269:3894–3904. [DOI] [PubMed] [Google Scholar]
- Reder, C. 1988. Metabolic control theory: a structural approach. J. Theor. Biol. 135:175–201. [DOI] [PubMed] [Google Scholar]
- Reich, J. G. 1974. Near-equilibrium reactions and the regulation of pathways. Symp. Biol. Hung. 18:159–171. [Google Scholar]
- Reich, J. G., and E. E. Selkov. 1981. Energy Metabolism of the Cell. Academic Press, New York.
- Reich, J. G., E. E. Selkov, T. Geier, and V. Dronova. 1976. Elementary properties of energy-regenerating pathways. Studia Biophys. 54:57–76. [Google Scholar]
- Reijenga, K. A., J. L. Snoep, J. A. Diderich, H. W. van Verseveld, H. V. Westerhoff, and B. Teusink. 2001. Control of glycolytic dynamics by hexose transport in Saccharomyces cerevisiae. Biophys. J. 80:626–634. [DOI] [PMC free article] [PubMed] [Google Scholar]
- Sauer, U., V. Hatzimanikatis, J. E. Bailey, M. Hochuli, T. Szyperski, and K. Wuthrich. 1997. Metabolic fluxes in riboflavin-producing Bacillus subtilis. Nat. Biotechnol. 15:448–452. [DOI] [PubMed] [Google Scholar]
- Schaaff, I., J. Heinisch, and F. K. Zimmermann. 1989. Overproduction of glycolytic enzymes in yeast. Yeast. 5:285–290. [DOI] [PubMed] [Google Scholar]
- Schmidt, K., J. Nielsen, and J. Villadsen. 1999. Quantitative analysis of metabolic fluxes in Escherichia coli, using two-dimensional NMR spectroscopy and complete isotopomer models. J. Biotechnol. 71:175–189. [DOI] [PubMed] [Google Scholar]
- Schomburg, I., A. Chang, O. Hofmann, C. Ebeling, F. Ehrentreich, and D. Schomburg. 2002. BRENDA: a resource for enzyme data and metabolic information. Trends Biochem. Sci. 27:54–56. [DOI] [PubMed] [Google Scholar]
- Schuster, S. 1999. Use and limitations of modular metabolic control analysis in medicine and biotechnology. Metab. Eng. 13:232–242. [DOI] [PubMed] [Google Scholar]
- Schuster, S., and C. Hilgetag. 1995. What information about the conserved moiety structure of chemical reaction systems can be derived from their stoichiometry. J. Phys. Chem. 99:8017–8023. [Google Scholar]
- Segel, I. H. 1975. Enzyme Kinetics: Behavior and Analysis of Rapid Equilibrium and Steady State Enzyme Systems. Wiley, New York.
- Stephanopoulos, G., and J. J. Vallino. 1991. Network rigidity and metabolic engineering in metabolite overproduction. Science. 252:1675–1681. [DOI] [PubMed] [Google Scholar]
- Teusink, B., J. Passarge, C. A. Reijenga, E. Esgalhado, C. C. van der Weijden, M. Schepper, M. C. Walsh, B. M. Bakker, K. van Dam, H. V. Westerhoff, and J. L. Snoep. 2000. Can yeast glycolysis be understood in terms of in vitro kinetics of the constituent enzymes? Testing biochemistry. Eur. J. Biochem. 267:5313–5329. [DOI] [PubMed] [Google Scholar]
- Thomas, S., and D. A. Fell. 1994. Metabolic control analysis—sensitivity of control coefficients to experimentally determined variables. J. Theor. Biol. 167:175–200. [Google Scholar]
- Vallino, J. J., and G. Stephanopoulos. 1993. Metabolic flux distributions in Corynebacterium glutamicum during growth and lysine overproduction. Biotechnol. Bioeng. 41:633–646. [DOI] [PubMed] [Google Scholar]
- Varma, A., and B. O. Palsson. 1993a. Metabolic capabilities of Escherichia coli. 1. Synthesis of biosynthetic precursors and cofactors. J. Theor. Biol. 165:477–502. [DOI] [PubMed] [Google Scholar]
- Varma, A., and B. O. Palsson. 1993b. Metabolic capabilities of Escherichia coli. 2. Optimal growth patterns. J. Theor. Biol. 165:503–522. [DOI] [PubMed] [Google Scholar]
- Vaseghi, S., A. Baumeister, M. Rizzi, and M. Reuss. 1999. In vivo dynamics of the pentose phosphate pathway in Saccharomyces cerevisiae. Metab. Eng. 1:128–140. [DOI] [PubMed] [Google Scholar]
- Westerhoff, H. V., and D. B. Kell. 1996. What biotechnologists knew all along? J. Theor. Biol. 182:411–420. [DOI] [PubMed] [Google Scholar]
- Yarmush, M. L., and F. Berthiaume. 1997. Metabolic engineering and human disease. Nat. Biotechnol. 15:525–528. [DOI] [PubMed] [Google Scholar]
Associated Data
This section collects any data citations, data availability statements, or supplementary materials included in this article.