

Abstract
We have performed experimental measurements and computer simulations of the equilibrium structure and folding of a 21-residue α-helical heteropeptide. Far ultraviolet circular dichroism spectroscopy is used to identify the presence of helical structure and to measure the thermal unfolding curve. The observed melting temperature is 296 K, with a folding enthalpy of −11.6 kcal/mol and entropy of −39.6 cal/(mol K). Our simulations involve 45 ns of replica-exchange molecular dynamics of the peptide, using eight replicas at temperatures between 280 and 450 K, and the program CHARMM with a continuum solvent model. In a 30-ns simulation started from a helical structure, conformational equilibrium at all temperatures was reached after 15 ns. This simulation was used to calculate the peptide melting curve, predicting a folding transition with a melting temperature in the 330–350 K range, enthalpy change of −10 kcal/mol, and entropy change of −30 cal/(mol K). The simulation results were also used to analyze the peptide structural fluctuations and the free-energy surface of helix unfolding. In a separate 15-ns replica-exchange molecular dynamics simulation started from the extended structure, the helical conformation was first attained after ∼2.8 ns, and equilibrium was reached after 10 ns of simulation. These results showed a sequential folding process with a systematic increase in the number of hydrogen bonds until the helical state is reached, and confirmed that the α-helical state is the global free-energy minimum for the peptide at low temperatures.
INTRODUCTION
One of the fundamental processes in protein folding is the formation of α-helices (Eaton et al., 1998, 2000). A major effort has been invested in the understanding of the helix formation mechanism by investigating alanine-based peptides as they form stable helices in solution (Marqusee et al. 1989; Chakrabarty and Baldwin, 1995). The thermodynamics and kinetics of the helix-coil transition have been studied with several experimental methods (Thompson et al., 2000; Jas et al., 2001; Dyer et al., 1998; Callender and Dyer, 2002). As a result, much is known about the folding-process thermodynamics and kinetics of these systems. Thus, the enthalpy change for bringing an alanine residue from a coil to a helix state is about −0.9 kcal/mol and the corresponding entropy change is about −2 cal/(mol K) (Lopez et al., 2002; Shi et al., 2002; Ohkubo and Brooks, 2003). In kinetic measurements helix formation was found to occur on a timescale of ∼280 ns at room temperature (Thompson et al., 2000; Jas et al., 2001).
Because of the relatively long timescale of α-helix formation, simulations of this process have mainly been performed using highly simplified force fields (Ferrara et al., 2000) or using model systems that form helices more readily (Daura et al., 1999). The recently developed replica-exchange molecular dynamics (REMD) algorithm is a novel approach that provides an increased conformational sampling rate sufficient for simulating helix-coil equilibria (Sugita and Okamoto, 1999; Gnanakaran et al., 2003). In REMD several independent trajectories of a system are propagated simultaneously, each at a different temperature. Periodic exchanges between neighboring temperatures effectively enhance the sampling rate at room temperature, allowing for efficient calculation of equilibrium properties. Additionally, as a Boltzmann distribution of states is generated at all the temperatures, it is possible to systematically explore temperature variation of molecular properties, such as peptide melting curves (Gnanakaran et al., 2003).
The REMD approach has been successfully applied to the study of several problems related to peptide folding, and has been the subject of a recent review (Gnanakaran et al., 2003). Garcia and coworkers performed REMD simulations for two helix-forming, 21-residue peptides (Ala-21 and Fs) in explicit water (Garcia and Sanbonmatsu, 2002). They achieved complete sampling of conformational space and generated the melting curves. The calculated melting temperature for Fs was 345 K, quite close to the observed 334 K, after some modification of the standard AMBER force field (Garcia and Sanbonmatsu, 2002). An interesting effect of stabilization of helical hydrogen bonds by side-chain shielding from solvent was observed (Garcia and Sanbonmatsu, 2002). Explicit solvent REMD simulations have also been performed for the GB1 peptide, correctly identifying the β-hairpin as its most stable state (Garcia and Sanbonmatsu, 2001; Zhou et al., 2001).
A relatively large number of REMD simulations with implicit solvent models have been performed, with somewhat mixed results. With a generalized Born/surface area (GB/SA) method and CHARMM force field, Ohkubo and Brooks calculated the variation of conformational entropy with chain length for model peptides, confirming Flory's isolated pair hypothesis (Ohkubo and Brooks, 2003). Using analogous approaches, folding to correct structures was simulated for the “Trp-cage” (Pitera and Swope, 2003) and BBA5 (Rhee and Pande, 2003) “mini-proteins”. Extensive REMD simulations with a highly simplified solvation model were used to explore the reversible folding of a 20-residue three-stranded antiparallel β-sheet (Rao and Caflisch, 2003). In the case of the PSV model protein, implicit solvation simulations reproduced the alpha-helical part of the structure, but showed variability in the β-hairpin region, with lowest RMSD of ∼3.3 Å (Suenaga, 2003). In two cases, significant discrepancies were found in implicit model results. A repeated study of the β-hairpin forming GB1 peptide with GB/SA solvation predicted an incorrect structure exhibiting exposed hydrophobic and buried polar groups (Zhou and Berne, 2002). GB/SA simulations of the Ala21 and Fs peptides also led to some discrepancies, including prediction of a helical-bundle native structure for Fs, rather than a single helix and an exaggerated population of conformers with large end-to-end distances in the unfolded state (Nymeyer and Garcia, 2003). These results indicate that continuum models have to be carefully evaluated for each application, and that further improvements are needed. It has been suggested that an important feature is the correct description of ion pair screening (Zhou and Berne, 2002; Nymeyer and Garcia, 2003; Lazaridis and Karplus, 1999).
In this work we present a joint experimental and computational study of the folding of a 21-residue helix-forming peptide, Ac-WAAAH-(AAARA)3-A-NH2. In the experimental part far ultraviolet (UV) circular dichroism (CD) measurements are performed as a function of temperature. The thermal unfolding curve with respect to increasing temperature is also measured. These studies show that the peptide exists as an α-helix at low temperatures and generate the experimental thermodynamic parameters. Computationally, two REMD simulations are performed using the CHARMM program with the GB/SA solvation model, employing eight replicas at 280, 300, 321, 343, 367, 393, 420, and 450 K. The first simulation is started with all replicas in helical conformations, and thermodynamic equilibrium is reached in the final 15 ns of the 30-ns trajectories. Based on these results we calculate theoretical melting curves and analyze intermediate structures in the unfolding pathway. The second simulation is started with all replicas in the extended structure, and the α-helical conformation is reached after ∼2.8 ns simulation time. These results are used to confirm that the α-helix is the global free-energy minimum of the peptide, study the folding process, and estimate the rate of conformational exploration in REMD simulations.
METHODS
Experiment
The peptide Ac-WAAAH-(AAARA)3-A-NH2 was purchased from California Peptide Research (Napa, CA), and was >96% pure. Temperature-dependent far UV CD measurements were made with a Jasco 710 spectropolarimeter (Tokyo, Japan) in 20 mM acetate buffer at pH 4.8, to assure the protonation of the histidine. The sample concentration was 158 μM.
The fractional population of the helical state is obtained from the thermal unfolding curve following the equation (Thompson et al., 2000; Jas et al., 2001)
 |
(1) |
where θ222 is the molar ellipticity per residue at a fixed wavelength of 222 nm, the helix fraction fh = K(T)/(1 + K(T)), n = 22 is the total number of residues including N and C caps, θα + θαT(T − T0) is the temperature-dependent ellipticity per residue in the helical conformation with θα = −4.3 × 10⁴ deg × cm2/dmol, θαT = +145 deg × cm2/(dmol K), θαw = −4.41 × 10⁴ deg × cm2/dmol, T0 = 273 K, and nα = 4.10 residues is introduced to account for the length-dependent mean-residue ellipticity. The corresponding parameters for the coil state are θr = +600 deg × cm2/dmol, θrT = −40 deg × cm2/(dmol K) and θrw = −2.53 × 10 deg × cm2/dmol. These parameters have been taken from Thompson et al. (2000).
The enthalpy change ΔH and entropy change ΔS for the helix-coil transition were obtained by fitting the fraction helix values fh(T) to the van't Hoff equation (Chang, 1981)
 |
(2) |
with equilibrium constant K = fh/(1 − fh).
Computation
The simulated system was the blocked 21-residue peptide Ac-WAAAH-(AAARA)3-A-NH2. The histidine residue was in the protonated state (CHARMM residue HSP), corresponding to the experimental conditions. Two initial structures were generated, an ideal α-helix with (φ, ψ) = (−57°, −47°) and a fully extended conformation. After a brief energy minimization, each structure underwent an equilibration MD simulation for 100 ps at 300 K. The equilibrated structures were used as starting points for replica-exchange simulations using the MMTSB tool set (Feig et al., 2001) with the CHARMM program as the molecular dynamics engine (Brooks et al., 1983). In the replica-exchange molecular dynamics we simulated eight replicas, running at temperatures of 280, 300, 321, 343, 367, 393, 420, and 450 K. Our REMD cycle consisted of 200 steps of molecular dynamics (0.4 ps) followed by attempted exchange between trajectories with neighboring trajectories (Sugita and Okamoto, 1999). Two separate REMD simulations were generated. The first, which will henceforth be called the “equilibrium simulation,” used the same equilibrated α-helical structure described above to start all eight trajectories. This simulation was carried on for 75,000 cycles, or 30 ns, with equilibrium achieved at all temperatures after 15 ns. We use the 15- to 30-ns fragment of this simulation to sample the equilibrium fluctuations of the peptide, including calculation of the melting curve. In the second simulation, which will be denoted as the “folding simulation,” all eight trajectories were started with the equilibrated extended structure and carried on for 37,500 cycles, or 15 ns. This simulation is used to verify that the α-helix is really a stable structure of the peptide that may be reached from an arbitrary initial state, and to estimate the rate of conformational exploration by REMD. The exchange acceptance ratio was ∼30% in both simulations.
The Nose-Hoover algorithm was used to maintain a constant temperature within each trajectory, with a coupling constant of 50 (Nose, 1984; Hoover, 1985; Frenkel and Smit, 1996). The velocity Verlet integrator (Frenkel and Smit, 1996; Swope et al., 1982) was used, with a time step pf 2 fs, with all bonds involving hydrogen atoms constrained by SHAKE (Ryckaert et al., 1977). The energy function consisted of three parts: CHARMM vacuum energy, GB solvation free energy, and a nonpolar buried surface-area term. The CHARMM vacuum energy included the standard all-atom version 22 force field for proteins (MacKerell et al., 1998) with the CMAP correction (Feig et al., 2003), which brings the protein backbone force field into agreement with high-level quantum chemistry calculations. Nonbonded interatomic interactions (electrostatic and van der Waals) were calculated without cutoffs. The electrostatic contribution ΔGelec from solvent water were calculated using the GB molecular volume (GBMV) method implemented within CHARMM (Lee et al., 2002), using a solvent dielectric constant of 80. The nonpolar solvation term was modeled as proportional to molecular solvent-accessible surface area (SASA) ΔGnpol = aSASA. This term was calculated within the GBMV module with a probe radius of 1.4 Å and with a microscopic surface tension a = 6 cal/(mol Å2). This nonpolar solvation term reproduces experimental solvation free energies of alkanes in water (Simonson and Brunger, 1994). We have verified that our GB/SA solvation term as described above gives reasonable agreement between calculated and experimental solvation free energies for a set of 50 model organic compounds.
We employed two methods of calculating the population of the α-helical structure from the simulations, based on hydrogen bonds and backbone conformations. The presence of an α-helical hydrogen bond at residue i was assumed when the distance between the carbonyl oxygen of residue i and backbone nitrogen of residue i + 4 was <4 Å. Varying this distance by ±0.4 Å did not markedly change the hydrogen-bond distributions. Very similar results were also obtained using the combined O…H distance and C–O…H angle criterion as described in Ohkubo and Brooks (2003). The fractional population of the helical state was then taken as the average number of α-helical hydrogen bonds at a given temperature divided by 17, the maximum possible number of such hydrogen bonds in the 21-residue peptide. The second method of determining helix populations started by defining the backbone conformation of residue i as α-helical if the (φ, ψ) dihedrals defining its backbone conformation were within 30° distance from the average helical conformation in protein crystals (−62°, −41°) (Barlow and Thornton, 1988). Choosing an alternate reference conformation, e.g., (−57°, −47°), did not markedly change the results. Applying the Lifson-Roig criterion that n consecutive residues in the α-helical conformation contribute a segment of length n − 2 in the helical state, the helix population was calculated by dividing the average total number of residues assigned to the helical state by the maximum possible number, i.e., 19. In this case, coordinates of the blocking groups were employed to define the φ of residue 1 and the ψ of residue 21. Melting curves were calculated by averaging the fraction of “helix” states over structures at a given temperature, employing both the hydrogen bond and residue conformation criteria. Statistical uncertainties were calculated by dividing the trajectories into four consecutive fragments and evaluating the standard errors of the mean helix populations, including the Student t coefficients for the 95% confidence level. The thermodynamic parameters ΔH and ΔS were calculated as described in the experimental section, by weighted least-squares fit to the van't Hoff equation (Taylor, 1997).
In calculating the number of helical fragments, we used the definition of three consecutive broken hydrogen bonds as a break in the helix (Ohkubo and Brooks, 2003). The distance between the Trp and His side chains was calculated as the distance between the centers of mass of the nonhydrogen atoms beyond Cβ.
The Lifson-Roig parameters w and v for the helix-coil transition were calculated as described in Ohkubo and Brooks (2003), by minimization of the deviation between calculated and model values of the helix fraction and number of helical fragments in a grid search through parameter space.
All simulations were performed using the program CHARMM (Brooks et al., 1983; MacKerell et al, 1998) on a 16-processor Linux cluster with 1.5 GHz Athlon CPUs. On this cluster we were able to generate ∼7,500 REMD cycles (3 ns on each of eight processors) per week. The total simulation time was 8 × 45 = 360 ns.
RESULTS
Experiment
We analyzed the temperature-dependent far UV CD spectra (Fig. 1 A) to characterize quantitatively the equilibrium structural and thermodynamic properties of the 21-residue peptide. CD spectra were recorded every 10 K from 273 K to 363 K. Singular value decomposition (SVD) was applied to the combined temperature-dependent CD spectra to resolve the spectral components. Two well-resolved components have been identified (Fig. 1 B) from the SVD analysis. The first component is a nicely resolved typical α-helical spectrum with minima at 222 nm and 207 nm and a maximum at 190 nm. The second component is a very well-defined typical random-coil spectrum with a minimum at around 200 nm. All other components are just noise. The well-resolved first and second components from SVD indicate the presence of an equilibrium between two states, the α-helix and random coil. The molar ellipticity at 222 nm, θ222, as a function of temperature is shown in Fig. 1 C. This thermal unfolding curve was fitted with a two-state model to obtain the thermodynamic parameters ΔH = −11.6 kcal/mol, ΔS = −39.1 cal/(mol K). The melting temperature was Tm = ΔH/ΔS = 296 K. These values are presented in Table 1 and found to be consistent with the previous measurement (Thompson et al., 2000; Jas et al., 2001).
FIGURE 1.

Far-UV CD measurements for 21-residue helical peptide. (A) Measured CD spectra as a function of temperature. Spectra were recorded every 10 K from 273 K to 363 K in 20 mM acetate buffer and at pH 4.8. (B) SVD of the combined temperature-dependent CD spectra. First and second components are shown here, as all other components were noise. (C) Equilibrium thermal unfolding curve. The molar ellipticity at 222 nm is shown versus temperature (○). Inset shows the amplitude vectors (•) of the first component from SVD as a function of temperature. The continuous solid lines show the fit of the data to the two-state thermodynamic model with parameters from Table 1. (D) Fraction of helix content (○) is shown as a function of temperature. The solid line is the fit to the data with the two-state thermodynamic model.
TABLE 1.
Thermodynamic parameters for helix formation in the Ac-WAAAH-(AAARA)3 -A-NH2 peptide
The inset (Fig. 1 C) shows the amplitude vector (solid circles) of the first component from SVD as a function of temperature. This is almost identical to the directly measured thermal unfolding curve at 222 nm. A two-state fit to the amplitude vectors of the first component of SVD reproduced ΔH and Tm identical to those obtained from the unfolding curve. The fraction helix content (Fig. 1 D) is obtained from the thermal unfolding curve (open circles, Fig. 1 C) with Eq. 1, described in the Methods section.
Computation: equilibrium simulation
Convergence
In this simulation all trajectories were started from an equilibrated α-helical structure. To monitor the establishment of thermodynamic equilibrium, we calculated melting curves, i.e., distributions of population of the helical state versus temperature over 5-ns fragments of the trajectory. The results showed a stable distribution developing after the initial period of 15 ns. Thus, we have used the second 15 ns of the trajectory to analyze the equilibrium distributions of properties of the peptide. The results are described below.
Melting curves
To generate melting curves corresponding to the experimental ones, we used two properties reflecting the average local structural similarity to a helix—the average fraction of α-helical hydrogen bonds and the average fraction of residues with backbone (φ, ψ) dihedrals in the α-helical conformation (see Methods for details). The melting curves and their fits to a two-state model are shown in Fig. 2. The plots show a structural transition of low cooperativity, with a midpoint Tm at a temperature of ∼330 K for the backbone conformation curve and ∼350 K for the hydrogen bond curve.
FIGURE 2.

Equilibrium simulation. Melting curves calculated from population of α-helical hydrogen bonds (○) and population of residues in α-helical backbone conformation (⋄). The error bars show 95% confidence intervals. Lines show fit to van't Hoff equation using ΔH and ΔS from Table 1.
The thermodynamic parameters obtained by fitting the temperature changes of local helix content to the van't Hoff equation are presented in Table 1. The two curves yield essentially identical values with the enthalpy change, ΔH, of about −10 kcal/mol and entropy change, ΔS, of about −30 cal/(mol K). Although the calculated melting temperature is exaggerated compared to the measured value of 296 K, the computed enthalpy and entropy change are in qualitative agreement with experimental data for our system and for helical peptides in general (Richardson and Makhatadze, 2004). The results agree with the expectation that unfolding of an ordered helical peptide leads to structure that is higher in energy and more disordered.
The helix population calculated from backbone conformations using the Lifson-Roig criterion (see Methods) is a measure of the hydrogen bond content, and thus should be compatible with infrared measurements of helicity. Since CD measurements are sensitive to actual backbone conformations, it is interesting to calculate a melting curve based on the total fraction of residues within a 30° radius of the idealized α-helix. This curve (not shown) corresponds to a melting temperature of ∼350 K, ΔH = −7 kcal/mol, and ΔS = −20 cal/(mol K). Thus, this method leads to thermodynamic parameters qualitatively similar to those described above.
Free energy profile for helix unfolding
The free energy profiles for helix unfolding are shown in Fig. 3. These plots are obtained as w(n) = −kT lnP(n), where P(n) is the probability of finding a structure with n hydrogen bonds, shown below in Fig. 3. The fully helical state with n = 17 is the most thermodynamically stable at the lowest temperatures. Population of the metastable intermediate with n = 13 is seen at temperatures below the melting point, T = 280, 300, 321, and 343 K. Above the calculated melting point, at T = 393, 420, and 450 K, the fully unfolded state with n = 0 becomes the most stable. Interestingly, in the 367 K trajectory, which is closest in temperature to the melting point, the potential of mean force has a very broad minimum at about n = 8–9, i.e., half the maximum possible number of hydrogen bonds.
FIGURE 3.

Equilibrium simulation. Potential of mean force for helix unfolding, w(n) = −kT lnP(n), where P(n) is the probability of finding a structure with n hydrogen bonds (shown in Fig. 6). Curves in the bottom panel shifted to zero at n = 17; curves in the top panel shifted to zero at n = 0.
Overall structural fluctuations
The structures sampled at the eight simulation temperatures may be described by distributions of position (Fig. 4) and dihedral angle (Fig. 5) deviations from an ideal helix, the number of α-helical hydrogen bonds (Fig. 6), and end-to-end distance (Fig. 7). At the lowest temperatures, 280–321 K, the distributions exhibit a significant peak corresponding to highly helical structures, clearly separated from the remaining conformations. Based on the peak positions of the various distributions, we can characterize these highly helical structures as having 2.2-Å backbone atom root-mean-square position deviation (RMSD) or 30° root-mean-square backbone dihedral angle deviation (RMSA) from the ideal helix, exhibiting 15 or more helical hydrogen bonds (out of a maximum of 17 for a 21-residue peptide) and having an end-to-end distance close to the 30 Å expected for an ideal helix.
FIGURE 4.

Equilibrium simulation. Distributions of backbone atom RMSD from ideal helix structure.
FIGURE 5.

Equilibrium simulation. Distributions of backbone dihedral angle RMSD from ideal helix structure.
FIGURE 6.

Equilibrium simulation. Distributions of number of helical hydrogen bonds.
FIGURE 7.

Equilibrium simulation. Distributions of peptide end-to-end distances, based on distance between Cα 1 and 21.
As the temperature is increased, the height of the helix-like peak decreases, and the distributions of the different properties become broader. There appear to be two stages in the change of the distribution shape with temperature. At the lower temperatures, 300–321 K, we see the growth of a second peak corresponding to structures with RMSD of 2.2–5.0 Å and RMSA of 30–60°, 12–14 helical hydrogen bonds, and end-to-end distances <30 Å. These structures may be described as distorted or broken helices. As the temperature is increased further in the 343–450 K range, the distributions become progressively broader, with depopulation of the highly helical and distorted helix peaks, and growth of population of conformations significantly different from a helix, exhibiting RMSD of 3–10 Å, RMSA of 60–180°, 0–11 helical hydrogen bonds, and a broad range of end-to-end distances, including values both shorter and longer than an ideal helix (at 450 K this range is 5–55 Å). The elongated structures exhibit some similarity to a polyproline II (PPII) helix. For the idealized PPII structure with (φ, ψ) = (−78°, 149°) (Creighton, 1993) constructed using CHARMM, the RMSD from ideal helix was 11 Å, the RMSA was 170°, the end-to-end distance was 62 Å, and number of hydrogen bonds was n = 0. For comparison, the fully extended conformer with 180° dihedrals has an RMSD of 14 Å, RMSA of 130°, zero hydrogen bonds, and 74-Å end-to-end distance.
Structural variation along the peptide chain
The deviations from backbone helical conformations for individual residues are shown in Fig. 8. A systematic increase of distance from the helical structure is seen for all residues as the temperature is increased. The largest increase in distance from the helix in the dihedral angle space with rising temperature, corresponding to the lowest thermodynamic stability of the helical conformation, occurs at the termini. This is especially marked for residues 4–6, for which deviations from helical structure may be correlated with the low population of hydrogen bonds originating at the preceding residues 2 and 3.
FIGURE 8.

Equilibrium simulation. Distances from helical backbone conformations for individual residues.
The average number of helical fragments as a function of temperature is plotted in Fig. 9. This number is close to 1 at the lowest temperatures, increases to a maximum of ∼1.5 close to 360 K, and falls off at higher temperatures, reaching ∼0.4 at our highest temperature of 450 K. Our values are close to the results reported by Ohkubo and Brooks for a 15-residue alanine homopeptide (Ohkubo and Brooks, 2003) obtained using the param19 CHARMM force field and a different implementation of the GB method.
FIGURE 9.

Equilibrium simulation. Average number of helical fragments as a function of temperature.
Tryptophan-histidine interactions
We have analyzed the sampled values of distance between the two side chains in terms of systematic variations with temperature and correlations with helix content. Fig. 10 shows the distributions of the Trp-His side-chain distance as a function of temperature. Overall, the average Trp-His distance exhibits systematic increases with rising temperature, rising from 7.6 Å at 280 K to 11.9 Å at 367 K. Analogously, the fraction of structures with short Trp-His contacts (<8 Å) systematically decreases with rising temperature, falling from 60% at 280 K to 12% at 367 K. The correlation coefficient r between the local measures of helix content (fraction of helical hydrogen bonds present and fraction of residues in helical backbone conformations; see Melting curves) and the average Trp-His distance are between −0.97 and −0.98. The correlation coefficients between the measures of local helix content and fraction of structures with Trp-His distances below 8 Å are between 0.90 and 0.92. These correlations are statistically significant at above 99.8%. Thus, there is a significant correlation between the presence of short Trp-His distances and helix content. Further, we have calculated the fraction of structures with short Trp-His distances over the subpopulations of the “helix” and “coil” (Fig. 11). The results show a larger fraction of shorter Trp-His separations for the helix state at the lower temperatures. Thus, our simulation results indicate that Trp fluorescence should be a monitor of not just the local structure at the N-terminus, but also the global structural equilibrium in the peptide.
FIGURE 10.

Equilibrium simulation. Distributions of Trp…His side-chain distances.
FIGURE 11.

Equilibrium simulation. Comparison of fraction of structures with short Trp…His contacts (<10 Å) between “helix” and “coil” states (defined as having more or less than 8.5 helical hydrogen bonds, respectively).
Sampled conformations
Examples of conformations sampled in the equilibrium simulation are shown in Fig. 12. The structures are chosen as representative examples of the various sampled conformations, arranged by number of helical hydrogen bonds. More structures are presented on our web site (Jas and Kuczera, 2004).
FIGURE 12.

Equilibrium simulation. Sample structures from the 300 K simulation along the unfolding pathway.
A summary of the sampled conformation space is provided by (φ, ψ) maps, shown in Fig. 13. At 300 K the right-handed α-helical region, around (−60°, −40°), is the most highly populated, with smaller contributions from the PPII helix around (−78°, 149°) and left-handed α-helix. Raising the temperature to 343 K and 450 K progressively broadens the distribution of sampled conformations. Most of the sampled conformations fall into the standard sterically allowed regions of the map, corresponding to right-handed α-helices, β-strands (−139°, 135°), PPII helices, and left-handed α-helices (Creighton, 1993; Kentsis et al., 2004). Additional population is found in regions around (70°, −30°) and (70°, 150°), which correspond to local minima on the CMAP-corrected CHARMM version 22 potential energy surface of the alanine dipeptide, obtained by fitting to high-level quantum chemical calculations (Feig et al., 2003).
FIGURE 13.
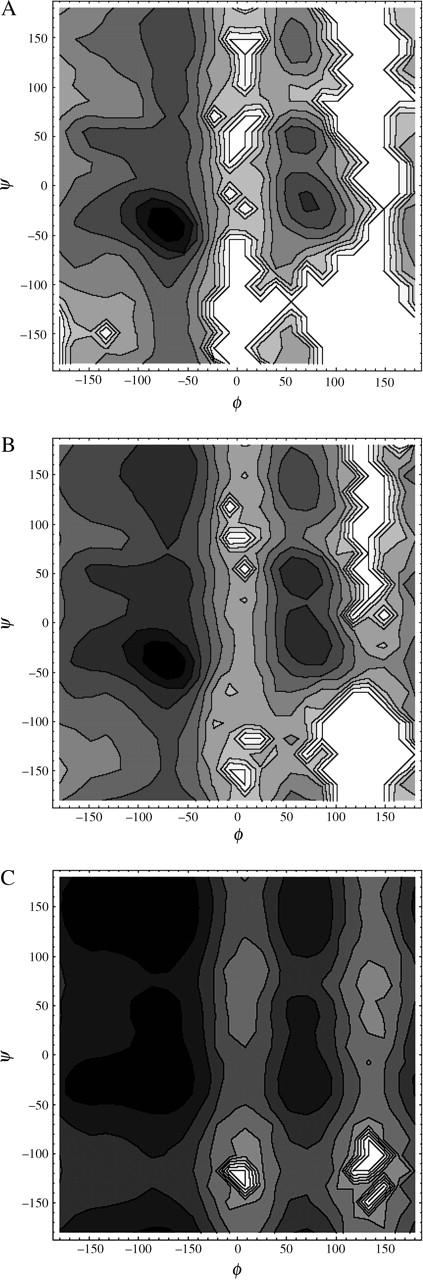
Equilibrium simulation. Distribution of backbone (φ, ψ) dihedrals accumulated for all 21 residues over a given temperature, converted to a free energy plot with 1-kcal/mol contours. Darkest shading corresponds to the lowest free energy. (a) 300 K; (b) 343 K; (c) 450 K.
To estimate the populations of the different regular conformations of the peptide, we have calculated the trajectory average fractions of residues residing within a 30° radius of the idealized α-helix at (φ, ψ) = (−62°, 41°), β-strand at (−139°, 135°), and PPII helix at (−78°, 149°). The populations of α, β, and PPII structures estimated in this way were 64%, 1%, and 5% at 343 K; 45%, 3%, and 9% at 367 K; and 12%, 8%, and 19% at 450 K, respectively. Thus, the PPII helix is the major regular structure occupied by the unfolded peptide. The populations of the β-strand and PPII conformations tend to increase with increasing temperature, but they remain a relatively small fraction of the wide range of available structures.
Computation: folding simulation
Appearance of the folded structure
The evolution of the number of helical hydrogen bonds and RMSD from an ideal α-helix for the 300 K trajectory of the folding simulation is presented in Fig. 14. Due to the replica exchanges, this does not correspond to an evolution in real time, but rather a random walk through conformational space. At the beginning of the simulation there is a systematic motion from the extended toward the helical structure. All trajectories were started in the same extended conformation, with no hydrogen bonds and RMSD from ideal helix of ∼14 Å. The 300 K replica quickly (after ∼250 cycles or 100 ps) reaches a state with RMSD of 5–9 Å and n = 1–5 hydrogen bonds. A distorted helix structure with RMSD of 2–3 Å and n = 5–12 is reached after ∼2500 cycles of REMD (1 ns). A fully helical structure, with 17 α-helical hydrogen bonds and RMSD from ideal helix of 1 Å is first sampled at ∼7000 cycles, or 2.8 ns. Based on this single trajectory, the folding process appears to progress in a sequential manner.
FIGURE 14.

Folding simulation. Evolution of the number of helical hydrogen bonds (top) and backbone position RMSD from ideal helix (bottom) in the 300 K trajectory.
The experimentally observed timescale for helix formation for this peptide is 280 ns at room temperature (Thompson et al., 2000; Jas et al., 2001). Assuming that a single standard MD trajectory would reach the helix state in that time, we can estimate that the REMD approach gives a 100-fold acceleration of the conformational sampling rate, or ∼12-fold per processor used.
Comparison of folding with equilibrium simulation
The folding simulation at 300 K samples some of the same highly ordered structures as found in the equilibrium simulation. The question whether the same distributions of properties are reached is addressed in Fig. 15, which shows the melting curves calculated from the three consecutive 5-ns fragments of the folding simulation. After a period of lower α-helix content in the first 5 ns, the variation of average helix content with temperature becomes indistinguishable from the equilibrium results, within the statistical errors. Overall, we can conclude that in the final stages of the folding simulation the peptide performs structural fluctuations exploring conformations essentially identical to those found in the equilibrium trajectories. Sample structures from the folding simulation are in Fig. 16.
FIGURE 15.

Folding simulation. Convergence of melting curves to equilibrium results. (A) Melting curve based on residue backbone conformations. (B) Melting curve based on average number of hydrogen bonds.
FIGURE 16.

Folding simulation. Sample structures from the first 2.8 ns of the 300 K trajectory showing approach toward fully helical conformation.
DISCUSSION
The melting curve and its features, the melting point and transition enthalpy and entropy, are the main experimental data we can use to test our calculation results. The melting temperature of the peptide estimated from the simulations is in the 330–350 K range, significantly higher than the measured value of 296 K. It appears that simulations generally tend to overestimate the melting temperatures for small model peptides, especially if continuum solvation is employed. Pitera and Swope obtained Tm of ∼400 K for the “Trp-cage” system, using AMBER and a GB/SA solvation model with a surface tension of 5 cal/(mol Å2) (Pitera and Swope, 2003). For the Fs peptide, which differs from our system only by alanine substitutions at positions 1 and 5, Garcia and Nymeyer found a melting temperature of 380 K using a similar method (Nymeyer and Garcia, 2003). In explicit water they obtained a melting temperature of ∼400 K for Fs with the standard AMBER force field, and 345 K after force field modification, compared to an experimental value of 334 K (Garcia and Sanbonmatsu, 2002).
The thermodynamic parameters ΔH and ΔS of the coil-to-helix transition are in qualitative agreement with experimental results. The calculated values of −10 kcal/mol enthalpy change and −30 cal/(mol K) entropy change have the correct sign but are lower in magnitude than the observed values, −12 kcal/mol and −39 cal/(mol K), respectively. Given the simplified nature of our solvation model, this agreement is satisfactory. The experimental enthalpy change in our peptide, −0.6 kcal/mol per residue, is also somewhat lower than reported values for alanine peptides of −0.9 ± 0.1 kcal/mol (Lopez et al., 2002), whereas our measured entropy change of about −1.9 cal/(mol K) per residue agrees with the reported value of −2.2 ± 0.4 cal/(mol K) (Shi et al., 2002).
From the 300 K trajectory averages of helix population based on backbone (φ, ψ) dihedrals, 78% (Fig. 2), and number of helical fragments, 1.08 (Fig. 9), we calculated the Lifson-Roig model parameters for the peptide helix-coil transition using the approach of Ohkubo and Brooks (2003). The results were w = 1.86 and v = 0.11. These values are within the ranges of 1.12–2.12 for w and 0.06–0.30 for v reported by Garcia and coworkers in explicit solvent simulations with the AMBER force field (Nymeyer and Garcia, 2003) and comparable to results obtained by Ohkubo and Brooks using the CHARMM param19 force field with GB solvation, Fig. 3 of Ohkubo and Brooks (2003).
In their GB/SA simulations of the Fs peptide, Garcia and coworkers found unphysical collapsed structures among the folded states and exaggerated end-to-end distances and relatively narrow range of sampled conformations among the unfolded states (Nymeyer and Garcia, 2003). Our simulations do not find these properties for our peptide. A single helix is the stable form of our peptide close to room temperature, with the fully helical conformation with 17 hydrogen bonds being the global free-energy minimum. The distribution of the number of helix fragments as a function of temperature exhibits a maximum with an average number of 1.5 fragments close to the melting point, which is similar to the explicit solvent simulations of Garcia and coworkers (Nymeyer and Garcia, 2003) and continuum model results for alanine homopeptides (Ohkubo and Brooks, 2003). For our system, the end-to-end distance distributions tend to be quite broad (Fig. 7). At 367 K, just above the melting temperature, this distribution is biased toward distances below the 30 Å expected for an ideal helix, which agrees with the results of explicit solvent simulations for the related Fs peptide (Nymeyer and Garcia, 2003). At higher temperatures our end-to-end distance distributions become roughly symmetric, with comparable contributions from structures both shorter and longer than a helix. Also, our distribution of sampled backbone conformations (Fig. 13) is similar to that found by Garcia and Sanbonmatsu in explicit solvent (Nymeyer and Garcia, 2003). The only significant difference in the (φ, ψ) maps is that the explicit solvent simulations do not sample the (70°, 150°) region seen in our study. This may be a result of differences in details of force field parametrization (Feig et al., 2003).
Recently, there has been both experimental and computational evidence that a segmented poplyproline II helix is the favored state of unfolded polyalanine peptides; see (Kentsis et al., 2004; Mezei et al., 2004) for a more detailed discussion. Our simulation results confirm that the PPII helix is the major regular conformer adopted by the unfolded peptide. We find that the PPII population tends to increase with increasing temperature, reaching ∼9% at 367 K. This is lower than PPII populations of ∼40% reported for shorter peptides in explicit solvent simulations and experimental studies (Kentsis et al., 2004). It has been proposed that specific solvation effects play an important role in stabilizing the PPII state (Mezei et al., 2004). Our results suggest that at least a part of the PPII stabilization may be reproduced considering only continuum solvation.
Overall, several aspects of the helix formation thermodynamics have been qualitatively reproduced by the simulations. To achieve better agreement, molecular models with both explicit and implicit solvation will need to be improved.
Conclusions
We have performed a combined experimental and computational study of folding of the helix-forming peptide Ac-WAAAH-(AAARA)3-A-NH2. Experimentally, circular dichroism spectroscopy was employed to confirm the presence of helical structure of the peptide and to measure the thermal unfolding curve. The observed melting temperature was 296 K, with a folding enthalpy of −11.6 kcal/mol and entropy of −39.6 cal/(mol K). Computationally, REMD simulations of the peptide were performed using a GB/SA solvation model. Simulations of the melting equilibrium yielded an exaggerated predicted melting temperature of 330–350 K, with reasonable thermodynamic parameters of ΔH = −10 kcal/mol and ΔS about −30 cal/(mol K). Our simulations predicted that the fully helical state with 17 hydrogen bonds is the global free-energy minimum close to room temperature. A broad distribution of the number of helical hydrogen bonds was seen close to the melting temperature, centered at about half the maximum possible number, i.e., 8.5. The unfolded structures tended to sample a wide range of conformational space in the (φ, ψ) map and a wide range of end-to-end distances, with some bias toward structures shorter than a helix. The PPII helix was the major regular conformer populated by the unfolded peptide. These last two properties were in qualitative agreement with recent explicit solvent simulations of a related peptide.
The peptide that is the subject of our study is designed with a tryptophan (Trp-1) and histidine (His-5) at the N-terminus, and its conformational changes have been observed by monitoring Trp fluorescence. Our analysis of the variation of the Trp…His side-chain distance with temperature in the REMD simulations showed that this coordinate is sensitive to the global conformation of the peptide. Thus, the simulations confirm that fluorescence changes of the tryptophan may be used to monitor the helix-coil equilibrium of the peptide.
In one of our REMD simulations, which started from the extended structure, the fully helical conformation of the peptide was reached after ∼2.8 ns. These results showed a sequential folding process with a systematic increase in the number of hydrogen bonds until the fully helical global free-energy minimum state is reached. Based on comparison with the experimental helix-folding timescale of 280 ns, we can estimate that the REMD method gives about 100-fold acceleration of conformational sampling for our system.
Our GB/SA REMD simulations were able to correctly reproduce a number of aspects of folding for our helical peptide. The high population of the α-helical structure below the melting temperature was in agreement with CD measurements. The folding enthalpy and entropy change were also in reasonable agreement with experimental results. The distribution of end-to-end distances of the unfolded states was in qualitative agreement with a recent explicit solvent simulation of a related system (Nymeyer and Garcia, 2003). Also, the population of the PPII conformation by the unfolded peptide agrees qualitatively with recent experiments and explicit solvent simulations (Kentsis et al., 2004). The main discrepancy in our results is the significant exaggeration of the melting temperature over the measured value, signifying an overstabilization of the helical state in our computational model. Overall, we conclude that REMD simulations using the GB/SA solvation model may be a useful tool in computational studies of peptide folding, providing interesting insights into the folding and unfolding pathways. To improve the quality of the results, more work is needed on protein force fields and the continuum models for electrostatic and van der Waals interactions.
Acknowledgments
We acknowledge the group of Prof. C. L. Brooks III at the Scripps Research Institute for making publicly available the MMTSB tool set, which includes the software for REMD simulations, and Dr. Michael Feig, currently at Michigan State University, for helpful discussions about using MMTSB. Simulations were performed on the 16-processor Athlon cluster at the Molecular Graphics and Modeling (MGM) Laboratory at the University of Kansas. We are grateful to Dr. Gerald Lushington, MGM laboratory director, for help with running simulations on the cluster.
This work was supported in part by American Chemical Society Petroleum Research Fund grant 37412-AC4 and by American Heart Association grant 0360061Z.
References
- Barlow, D. J., and J. M. Thornton. 1988. Helix geometry in proteins. J. Mol. Biol. 201:601–619. [DOI] [PubMed] [Google Scholar]
- Brooks, B. R., R. Bruccoleri, B. Olafson, D. States, S. Swaminathan, and M. Karplus. 1983. CHARMM: a program for macromolecular energy, minimization and dynamics calculations. J. Comput. Chem. 4:187–217. [Google Scholar]
- Callender, R., and R. B. Dyer. 2002. Probing protein dynamics using temperature jump relaxation spectroscopy. Curr. Opin. Struct. Biol. 12:628–633. [DOI] [PubMed] [Google Scholar]
- Chakrabarty, A., and R. L. Baldwin. 1995. Stability of alpha-helices. Adv. Protein Chem. 46:141–176. [PubMed] [Google Scholar]
- Chang, R. 1981. Physical Chemistry with Applications to Biological Systems. Macmillan, New York.
- Creighton, T. E. 1993. Proteins. Structures and Molecular Properties. W. H. Freeman, New York.
- Daura, X., W. F. Van Gunsteren, and A. E. Mark. 1999. Folding-unfolding thermodynamics of a β-heptapeptide from equilibrium simulations. Proteins. 34:269–280. [DOI] [PubMed] [Google Scholar]
- Dyer, R. B., F. Gai, and W. H. Woodruff. 1998. Infrared studies of fast events in protein folding. Acc. Chem. Res. 31:709–716. [Google Scholar]
- Eaton, W. A., V. Munoz, S. J. Hagen, G. S. Jas, L. J. Lapidus, E. R. Henry, and J. Hofrichter. 2000. Fast kinetics and mechanisms in protein folding. Annu. Rev. Biophys. Biomol. Struct. 29:327–359. [DOI] [PMC free article] [PubMed] [Google Scholar]
- Eaton, W. A., V. Munoz, P. A. Thompson, E. R. Henry, and J. Hofrichter. 1998. Kinetics and dynamics of loops, alpha-helices, beta-hairpins, and fast-folding proteins. Acc. Chem. Res. 31:745–753. [Google Scholar]
- Feig, M., J. Karanicolas, and C. L. Brooks III. 2001. MMTSB Tool Set. MMTSB NIH Research Resource. The Scripps Institute, La Jolla, CA.
- Feig, M., A. D. MacKerrel, Jr., and C. L. B. Brooks III. 2003. Force field influence on the observation of α-helical protein structures in molecular dynamics simulations. J. Phys. Chem. B. 107:2831–2836. [Google Scholar]
- Ferrara, P., J. Apostolakis, and A. Caflisch. 2000. Thermodynamics and kinetics of folding of two model peptides investigated by molecular dynamics simulations. J. Phys. Chem. B. 104:5000–5010. [Google Scholar]
- Frenkel, D., and B. Smit. 1996. Understanding Molecular Simulation. Academic Press, San Diego.
- Garcia, A. E., and K. Y. Sanbonmatsu. 2001. Exploring the energy landscape of a beta hairpin in explicit solvent. Proteins. 42:345–354. [DOI] [PubMed] [Google Scholar]
- Garcia, A. E., and K. Y. Sanbonmatsu. 2002. α-Helical stabilization by side chain shielding of backbone hydrogen bonds. Proc. Natl. Acad. Sci. USA. 99:2782–2787. [DOI] [PMC free article] [PubMed] [Google Scholar]
- Gnanakaran, S., H. Nymeyer, J. Portman, K. Y. Sanbonmatsu, and A. E. Garcia. 2003. Peptide folding simulations. Curr. Opin. Struct. Biol. 13:168–174. [DOI] [PubMed] [Google Scholar]
- Hoover, W. G. 1985. Canonical dynamics: Equilibrium phase-space distributions. Phys. Rev. A. 31:1695–1697. [DOI] [PubMed] [Google Scholar]
- Jas, G. S., W. A. Eaton, and J. Hofrichter. 2001. Effect of viscosity on the kinetics of alpha-helix and beta-hairpin formation. J. Phys. Chem. B. 105:261–272. [Google Scholar]
- Jas, G. S., and K. Kuczera. 2004. Images from replica exchange molecular dyanmics simulations of helix folding. http://assam.chem.ukans.edu/∼kuczera/rex21/rex21.html. [DOI] [PMC free article] [PubMed]
- Kentsis, A., M. Mezei, T. Gindin, and R. Osman. 2004. Unfolded state of polyalanine is a segmented polyproline II helix. Proteins. 55:493–501. [DOI] [PubMed] [Google Scholar]
- Lazaridis, T., and M. Karplus. 1999. Effective energy function for proteins in solution. Proteins. 35:133–152. [DOI] [PubMed] [Google Scholar]
- Lee, M. S., F. R. Salsbury, Jr., and C. L. Brooks III. 2002. Novel generalized Born methods. J. Chem. Phys. 116:10606–10614. [Google Scholar]
- Lopez, M. M., D.-H. Chin, R. L. Baldwin, and G. I. Makhatadze. 2002. The enthalpy of the alanine peptide helix measured by isothermal titration calorimetry using metal-binding to induce helix formation. Proc. Natl. Acad. Sci. USA. 99:1298–1302. [DOI] [PMC free article] [PubMed] [Google Scholar]
- MacKerell, A. D., Jr., D. Bashford, M. Bellott, R. L. Dunbrack, Jr., J. D. Evanseck, M. J. Field, S. Fischer, J. Gao, H. Guo, S. Ha, D. Joseph-McCarthy, L. Kuchnir, K. Kuczera, F. T. K. Lau, C. Mattos, S. Michnick, T. Ngo, D. T. Nguyen, B. Prodhom, W. E. Reiher III, B. Roux, M. Schlenkrich, J. C. Smith, R. Stote, J. Straub, M. Watanabe, J. Wiorkiewicz-Kuczera, and M. Karplus. 1998. All-atom empirical potential for molecular modeling and dynamics studies of proteins. J. Phys. Chem. B. 102:3586–3617. [DOI] [PubMed] [Google Scholar]
- Marqusee, S., V. H. Robbins, and R. L. Baldwin. 1989. Unusually stable helix formation in short alanine-based peptides. Proc. Natl. Acad. Sci. USA. 86:5286–5290. [DOI] [PMC free article] [PubMed] [Google Scholar]
- Mezei, M., P. J. Fleming, R. Srinivasan, and G. D. Rose. 2004. Polyproline II helix is the preferred conformation of unfolded polyalanine in water. Proteins. 55:502–507. [DOI] [PubMed] [Google Scholar]
- Nose, S. 1984. A molecular dynamics method for simulation in the canonical ensemble. Mol. Phys. 52:255–268. [Google Scholar]
- Nymeyer, H., and A. E. Garcia. 2003. Simulations of the folding equilibrium of α-helical peptides: A comparison of generalized Born approximation with explicit solvent. Proc. Natl. Acad. Sci. USA. 100:13934–13939. [DOI] [PMC free article] [PubMed] [Google Scholar]
- Ohkubo, Y. Z., and C. L. Brooks III. 2003. Exploring Flory's isolated-pair hypothesis: statistical mechanics of helix-coil transitions in polyalanine and the c-peptide from RNase A. Proc. Natl. Acad. Sci. USA. 100:13916–13921. [DOI] [PMC free article] [PubMed] [Google Scholar]
- Pitera, J. W., and W. Swope. 2003. Understanding folding and design: Replica exchange simulations of Trp-cage miniproteins. Proc. Natl. Acad. Sci. USA. 100:7587–7592. [DOI] [PMC free article] [PubMed] [Google Scholar]
- Rao, F., and A. Caflisch. 2003. Replica exchange molecular dynamics simulations of reversible folding. J. Chem. Phys. 119:4035–4042. [DOI] [PubMed] [Google Scholar]
- Rhee, M. H., and V. S. Pande. 2003. Multiplexed-replica exchange molecular dynamics method for protein folding simulations. Biophys. J. 84:775–786. [DOI] [PMC free article] [PubMed] [Google Scholar]
- Richardson, J. M., and G. I. Makhatadze. 2004. Temperature dependence of the thermodynamics of helix-coil transition. J. Mol. Biol. 335:1029–1037. [DOI] [PubMed] [Google Scholar]
- Ryckaert, J. P., G. Ciccotti, and H. J. C. Berendsen. 1977. Numerical integration of the cartesian equations of motion with constraints: molecular dynamics of n-alkanes. J. Comput. Phys. 23:327–341. [Google Scholar]
- Shi, Z., C. A. Olson, G. D. Rose, R. L. Baldwin, and N. R. Kallenbach. 2002. Polyproline II structure in a sequence of seven alanine residues. Proc. Natl. Acad. Sci. USA. 99:9190–9195. [DOI] [PMC free article] [PubMed] [Google Scholar]
- Simonson, T., and A. Brunger. 1994. Solvation free energies estimated from macroscopic continuum theory: An accuracy assessment. J. Phys. Chem. 98:4683–4694. [Google Scholar]
- Suenaga, A. 2003. Replica-exchange molecular dynamics simulations for a small-sized protein folding with implicit solvent. J. Mol. Struct. 634:235–241. [Google Scholar]
- Sugita, Y., and Y. Okamoto. 1999. Replica-exchange molecular dynamics method for protein folding. Chem. Phys. Lett. 314:141–151. [Google Scholar]
- Swope, W. C., H. C. Andersen, P. H. Berens, and K. R. Wilson. 1982. A computer simulation method for the calculation of equilibrium constants for the formation of physical clusters of molecules. application to water clusters. J. Chem. Phys. 76:637–649. [Google Scholar]
- Taylor, J. R. 1997. An Introduction to Error Analysis, 2nd ed. University Science Books, Sausalito, CA.
- Thompson, P. A., V. Munoz, G. S. Jas, E. R. Henry, W. A. Eaton, and J. Hofrichter. 2000. The helix-coil kinetics of a heteropeptide. J. Phys. Chem. B. 104:378–389. [Google Scholar]
- Zhou, R. H., and B. J. Berne. 2002. Can a continuum solvent model reproduce the free energy landscape for beta-hairpin folding in water? Proc. Natl. Acad. Sci. USA. 99:12777–12782. [DOI] [PMC free article] [PubMed] [Google Scholar]
- Zhou, R. H., B. J. Berne, and R. Germain. 2001. The free energy landscape for beta hairpin folding in explicit water. Proc. Natl. Acad. Sci. USA. 98:14931–14936. [DOI] [PMC free article] [PubMed] [Google Scholar]