Abstract
The rotation of the lever arm of myosin cross-bridges is believed to be responsible for muscle contraction. To resolve details of this rotation, it is necessary to observe a single cross-bridge. It is still impossible to do so in muscle fiber, but it is possible to investigate a small population of cross-bridges by simultaneously activating myosin in a femtoliter volume by rapid release of caged ATP. In earlier work, in which the number of observed cross-bridges was limited to ∼600 by confocal microscopy, we were able to measure the rates of cross-bridge detachment and rebinding. However, we were unable to resolve the power stroke. We speculated that the reason for this was that the number of observed cross-bridges was too large. In an attempt to decrease this number, we used two-photon microscopy which permitted observation of ∼1/2 as many cross-bridges as before with the same signal/noise ratio. With the two-photon excitation, the number of cross-bridges was small enough to resolve the beginning of the power stroke. The results indicated that the power stroke begins ∼170 ms after the rigor cross-bridge first binds ATP.
INTRODUCTION
The rotation of the regulatory domain of myosin cross-bridges is believed to be the event responsible for muscle contraction. This rotation has been studied extensively by measuring polarized fluorescence of light chain exchanged into muscle fibers after synchronous activation of muscle by rapid release of caged ATP (Allen et al., 1996; Goldman, 1998; Hopkins et al., 1998; Irving et al., 1995; Sabido-David et al., 1998). The same method was applied to measure anisotropy of fluorescence of cross-bridges residing in an extremely small observational volume defined by diffraction-limited laser beam and confocal aperture (Borejdo and Akopova, 2003; Borejdo et al., 2004).
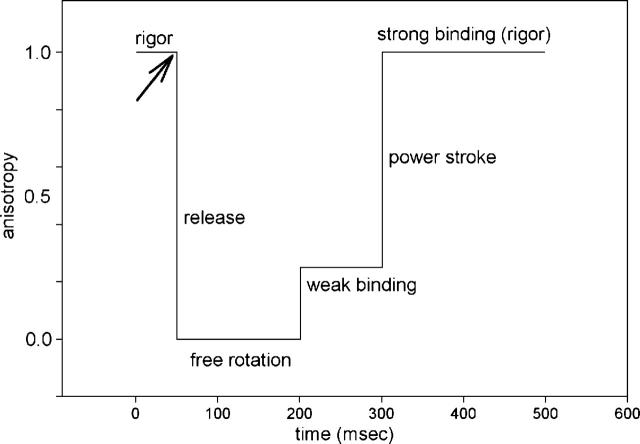
If a small population of cross-bridges were acting in perfect synchrony, the lever arm anisotropy would be expected to change as illustrated in Fig. 1. Beginning with the heads in rigor, when they are immobilized by actin, the first phase after creation of ATP (arrow) is an increase in rotational mobility, reflecting dissociation of heads from thin filaments. At the end of this process, myosin heads rotate freely. The second phase is a partial immobilization, reflecting binding of the heads to thin filament in a short-lived, partially disordered, prepower stroke state (Warshaw et al., 1998). The final phase is the power stroke transition of the weakly bound, partially immobilized heads to a strongly bound, completely immobilized state triggered by product release. However, in the experiments using one-photon (1P) excitation in a confocal microscope, the power stroke was conspicuously absent. After synchronous activation, the cross-bridges started to rotate rapidly (indicating dissociation from actin) after which they were slowly immobilized (indicating binding to actin) (Borejdo and Akopova, 2003; Shepard and Borejdo, 2004). We speculated that the reason for the absence of a clearly defined power stroke was that the observed population of cross-bridges (∼600) was still too large. In an attempt to decrease this number, we use here two-photon (2P) microscopy.
FIGURE 1.
Schematic representation of the expected time course of anisotropy change of a single cross-bridge. Creation of ATP (arrow) is followed by a release of a cross-bridge from thin filaments. For a while (150 ms in this case), the cross-bridge is rotating freely (anisotropy = 0), and eventually binds to actin in a short-lived partially disordered prepower stroke (generically labeled weak) conformation. It remains weakly bound until Pi/ADP dissociates (100 ms in this case) when it produces power stroke and returns to the original, strongly bound configuration.
Measuring anisotropy by 2P has three important advantages over 1P: first, the observed volume, and hence number, of observed cross-bridges is smaller. Second, photobleaching is less destructive. Third, the change in signal is larger. The last two combine to produce at least as good a signal/noise (S/N) ratio as in 1P experiments, despite the fact that the number of cross-bridges contributing to a signal is smaller.
In conventional (1P) confocal microscopy, the thickness of the observational volume is defined by the diameter of the confocal aperture. In previous experiments, the aperture was 35 μm (2.37 Airy units). (It could not be further decreased, because closing it decreased the S/N ratio to the extent that measurements became impossible.) This made the depth of focus equal to ∼4 μm, the volume equal to ∼0.5 μm3, and the number of observed cross-bridges ∼600. On the other hand, in 2P microscopy, which is now possible because of the wide availability of ultrashort-pulsed near-infrared lasers, the signal originates only from the focal plane where the laser power density is high enough to produce 2P absorption (Pawley, 1995). In our experiments, this plane was ∼2 μm thick, allowing us to observe <∼300 cross-bridges.
Despite the fact that number of observed cross-bridges was <½, the S/N ratio was unchanged. This was due to the fact that 2P photobleaching was reduced and that absolute values of 2P anisotropy were larger. It is well known that out-of-focus photobleaching is reduced in 2P because out-of-focus planes are illuminated by less damaging infrared light (IR) light. We show here that, surprisingly, in the case of muscle exchanged with myosin light chains labeled with rhodamine, photobleaching in the plane of focus was also reduced. The anisotropy was larger because absorption/emission of two photons depends on the fourth power—not the second power as in 1P absorption—of cosine of the angle between dye dipole and the direction of polarization of exciting light.
We show here that although 1P and 2P spectra of rhodamine labeled myosin light chain are the same, the time courses of anisotropy during muscle contraction are sufficiently different to determine the onset of the power stroke. With 2P excitation, we were able to determine that the power stroke begins on the average ∼170 ms after a cross-bridge first binds ATP.
MATERIALS AND METHODS
Experimental setup
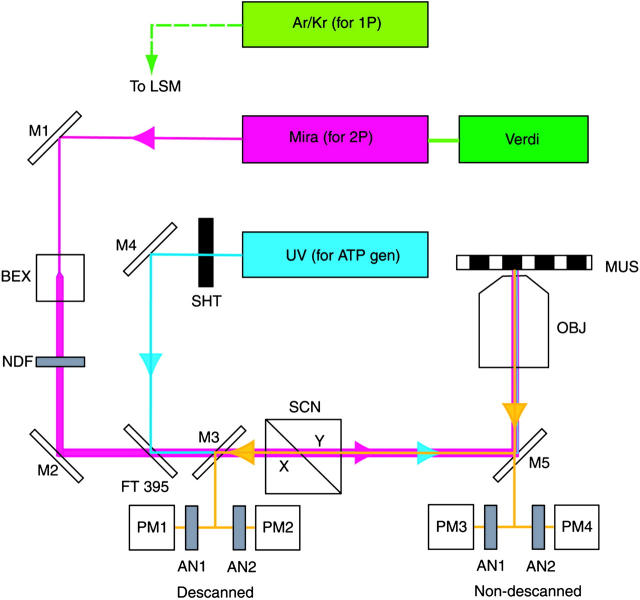
Fig. 2 shows a schematic diagram of the instrument. 2P laser (Mira, Coherent, Santa Clara, CA) pumped by 6.5 W of 532 nm light (green) from a Verdi solid state laser (Coherent) generates femtosecond 820 nm pulses at 80 MHz (magenta). The IR laser beam, directly coupled to the microscope (Zeiss Axiovert 135, Zeiss, Jena, Germany), is expanded by the beam expander (BEX), attenuated by neutral density filters and passed to the X-Y scanner (SCN), which projects the scanned beam onto the objective (OBJ) (Zeiss Apo C 40×, numerical aperture (NA) = 1.2 water immersion) and muscle fiber (MUS). The IR power impinging on muscle is ∼65 mW. Fluorescent light (yellow) is collected by the objective, passed by the same scanner and reflected by the dichroic mirror M3 into photomultipliers 1 and 2, which detect orthogonally polarized light passed by crossed analyzers AN1 and AN2. Since the fluorescent light is scanned again on the way to the detectors, it is termed descanned detection. Alternatively, mirror M5 can be substituted by a dichroic filter to pass the fluorescent light to another set of photomultipliers 3 and 4. Since the fluorescent light does not pass through the scanner, it is termed nondescanned detection. The significant advantage of this mode of detection is that the distance between the detectors and the sample is shortened and that the fluorescent light does not enter the microscope at all, and hence does not pass through the scanner or is not attenuated by the internal optics. Unless otherwise stated, all the experiments were done in nondescanned mode. The 351 + 364 nm light from the ultraviolet (UV) laser (blue) (Enterprise, Coherent) is made collinear with the IR beam by the dichroic filter FT395. A fast-shutter SHT (Vincent Associates, Rochester, NY, model T132) is opened for 10 ms to admit UV light to a muscle fiber. The UV power impinging on muscle is 700 μW, giving a power flux of 9 × 10⁻⁴ mJ/μm2. The 1P excitation by Ar/Kr laser (light green) is achieved as previously described (Borejdo and Akopova, 2003).
FIGURE 2.
The experimental arrangement. IR light (magenta) is focused by the objective on a muscle fiber mounted on a stage of a microscope. The fluorescent light (yellow) is measured by cooled photomultipliers (Hamamatsu 6060-02, Hamamatsu, Japan). The UV light (blue) is used to generate ATP from a caged precursor. The 1P data is obtained using Ar/Kr laser (green).
Chemicals and solutions
5-Dimethyoxy-2-nitrobenzyl-caged ATP (caged ATP) and 5′-iodoacetamido-tetramethyl-rhodamine (5′-IATR or Rh) were from Molecular Probes (Eugene, OR). Rigor solution contained 50 mM KCl, 4 mM MgCl2, 0.1 mM CaCl2, 1 mM DTT, 10 mM TRIS buffer pH 7.5, and 10 mM reduced glutathione. The glycerinating solution was the same as rigor except that 80 mM K-acetate was substituted for KCl and in addition it contained 5 mM EGTA instead of CaCl2, 0.2 mg/mL PMSF, 2 mM mercaptoethanol, and 50% glycerol.
Muscle fibers
Single fibers were dissected from glycerinated rabbit psoas muscle bundles in the glycerinating solution. Fibers were mounted on a microscope slide containing aluminum clips glued ∼5 mm apart. Tautly stretched fibers were attached to clips and covered with a cover glass, which rested on an ∼2 mm layer of Vaseline. Mounted fibers were thoroughly washed with rigor solution. Muscle bundles were stored in glycerol for no more than 3 months. Opened bottles containing glycerinated bundles were discarded after a week.
Expressing and labeling of RLC
The regulatory light chain (RLC) containing a single cysteine at position 73 (Sabido-David et al., 1998) was prepared by expression of RLC in a pT7-7 plasmid in BL21(DE3) cells. The construct was a gift from Dr. S. Lowey (University of Vermont). The preparation and purification were done as described previously in Wolff-Long et al., (1993). Labeling was done as described earlier (Borejdo and Akopova, 2003), except that stock solution of IATR was not used, but the dye was dissolved in methanol just before the experiment. The Rh-RLC adduct contained 14% of rhodamine.
Expressing and labeling of LC1
The pQE60 vector and Escherichia coli M15[pREP4] cells (Qiagen, Valencia, CA) were used for the cloning and expression of essential light chain 1 (LC1). The human fast skeletal muscle essential light chain (ELC) (a gift from S. Lowey) was subcloned into the pQE60 vector using DNA polymerase chain reaction with the 3′ end containing a tag of six histidines. The presence of the His tag at the N-terminus of ELC was confirmed by DNA sequencing. The expressed recombinant proteins were purified on Ni-NTA-agarose columns (Qiagen). Labeling was done as described earlier (Borejdo and Akopova, 2003), except that stock solution of IATR was not used, but the dye was dissolved in methanol just before the experiment; 3.5–7% of purified protein was fluorescently labeled.
Exchanging Rh-RLC and Rh-LC1 into muscle fibers
Labeled RLC was exchanged into fibers as described earlier (Ling et al., 1996), except that exchange was at room temperature; 0.5–1.1 mg/mL labeled ELCs were exchanged with endogenous light chains of myosin in muscle fibers at 30°C using the exchange solution described before (Borejdo et al., 2001). After labeling, the fibers were thoroughly washed with the rigor solution.
Functionality of exchanged fibers
Tension development was studied by an MKB force transducer (Scientific Instruments, Heidelberg, Germany) coupled to an analog counter (model 6024E, National Instruments, Austin, TX). Control (unlabeled) fibers developed normal 0.94 ± 0.05 mN/fiber (mean ± SE, n = 32) maximum isometric tension. Fibers exchanged with fluorescently labeled RLC developed 0.96 ± 0.03 mN/fiber tension. Fibers exchanged with fluorescently labeled LC1 also developed normal tension. We recognize, however, that the degree of exchange with LC1 was too small to make tension measurements a reliable test of functionality. Effect of exchange of LC1 on muscle was assessed, therefore, by measuring static polarization of fluorescence as described earlier (Borejdo et al., 2001). Exchange had no effect on polarization of fluorescence, suggesting that it also had no effect on the functionality of muscle.
Photogeneration of ATP
ATP was photogenerated from a caged precursor by perfusing fibers with 2 mM of 5-dimethyoxy-2-nitrobenzyl-caged ATP in rigor solution. The UV beam was focused by the objective to a Gaussian spot with a width, length, and depth of ∼0.2 × 0.2 × 3 μm; ∼3 s after beginning the scan, a shutter admitting the UV light was opened for exactly 10 ms. The energy flux through the illuminated area during the time ATP stayed in the experimental volume (∼300 μs) was 9 × 10⁻⁴ mJ/μm2. The amount of released ATP was enough for a single turnover of ATP.
Anisotropy of solutions
Isolated myosin, prepared according to Tonomura et al. (1966) was exchanged with Rh-RLC as in Ling et al. (1996). Fluorescence anisotropy was measured in an ISS K2 spectrofluorometer (ISS, Champaign, Illinois). The commercial ISS fluorometer chamber was modified to accept a Ti:Sapphire laser beam, and the spectra were collected using a single photon counting fluorometer SLM8000. The two-photon excited volume was ∼0.3 μm3. To check the mode of excitation, fluorescence intensity of myosin (excited at 822 nm) was monitored as a function of exciting light power. The intensity of the fluorescence induced by two photons must be proportional to the square of instantaneous photon flux. In experiments with myosin subfragment-1, the correlation factor between the square of the incident intensity and observed fluorescence was 1.97. Time-domain lifetime measurements were carried out using compact fluorescence lifetime spectrometer FluoTime 100 (PicoQuant, Berlin, Germany). For excitation (442 nm, 10 MHz, 60 ps width) the diode laser system (PTD 800B with LDH PC 440, PicoQuant) was used. To avoid scattered light, a cutoff filter (500 nm) was used in the emission channel. All measurements were done using magic-angle conditions. Data analysis was performed using multiexponential fluorescence decay fitting software FluoroFit version 3.2.0 (PicoQuant). Experiments were done at 20°C in the rigor solution. Experiments on immobilized proteins were performed at 0°C in 90% glycerol. All samples used in fluorescence measurements had absorption of <0.1.
Absolute value of anisotropy
The static anisotropy is higher in the 2P mode. This is a consequence of the fact that that the absorption/emission of a single photon by a dye molecule depends on the square of the cosine of the angle between dye dipole and the direction of polarization of exciting light. The absorption/emission of two photons, therefore, depends on the fourth power of this angle (Lakowicz. 1986). A complete description of the anisotropy with 2P is complex (Wan and Johnson, 1994) and requires consideration of the tensor properties of the transitions. However, in the case of rhodamine, the two-photon transition appears to be colinear and have the same orientation as the one-photon transition. In this case, the expected anisotropy can be easily predicted based on the usual orientation dependence of electronic transitions. Theoretically, for 1P and 2P, the maximal values of anisotropy are 0.4 and 0.57, respectively (the multiphoton anisotropy values are given in (Gryczynski et al., 1995). The steady-state anisotropy of Rh-RLC incorporated into myosin was 0.370 at 822 nm and 0.261 at 550 nm. The ratio, 1.42, was close to the theoretically predicted ratio of 1.43. Probably, the relative orientation of excitation/emission dipoles is similar in 1P and 2P excitation (Malak et al., 1997).
Fluorescence anisotropy of fibers
Fluorescence was measured with a high-aperture lens (C-Apo, Zeiss, 40×, NA = 1.2). Calculations showed that high NA of the objective causes minimal distortion to the polarized intensities (Burghardt et al., 2001). The subscripts after the intensity indicate the direction of polarization of emitted light relative to the axis of the muscle fiber. The excitation light was always parallel to the axis of fiber. The muscle axis was oriented horizontally on a stage of a microscope. I⊥ and I‖ are recorded by photomultipliers 1 and 2 in descanned mode, and photomultipliers 3 and 4 in nondescanned mode, respectively.
RESULTS
2P spectra of Rh-RLC incorporated into myosin.
Fig. 3 compares 1P and 2P spectra of rhodamine labeled RLC incorporated into myosin. Spectra are identical, regardless of the mode of excitation, in agreement with others (Malak et al., 1997). Significantly, addition of F-actin makes no difference either to the shape or the position of the spectral peak, consistent with no effect of actin on steady-state anisotropy (see below). As shown in Fig. 3, bottom, the two-photon induced fluorescence signals of Rh-RLC (blue, green, red) are only approximately twice lower than the signal of rhodamine B (RhB) in MeOH, which is considered a very good two-photon absorber with one of the highest known two-photon cross sections of 120 GM (Xu and Webb, 1996).
FIGURE 3.
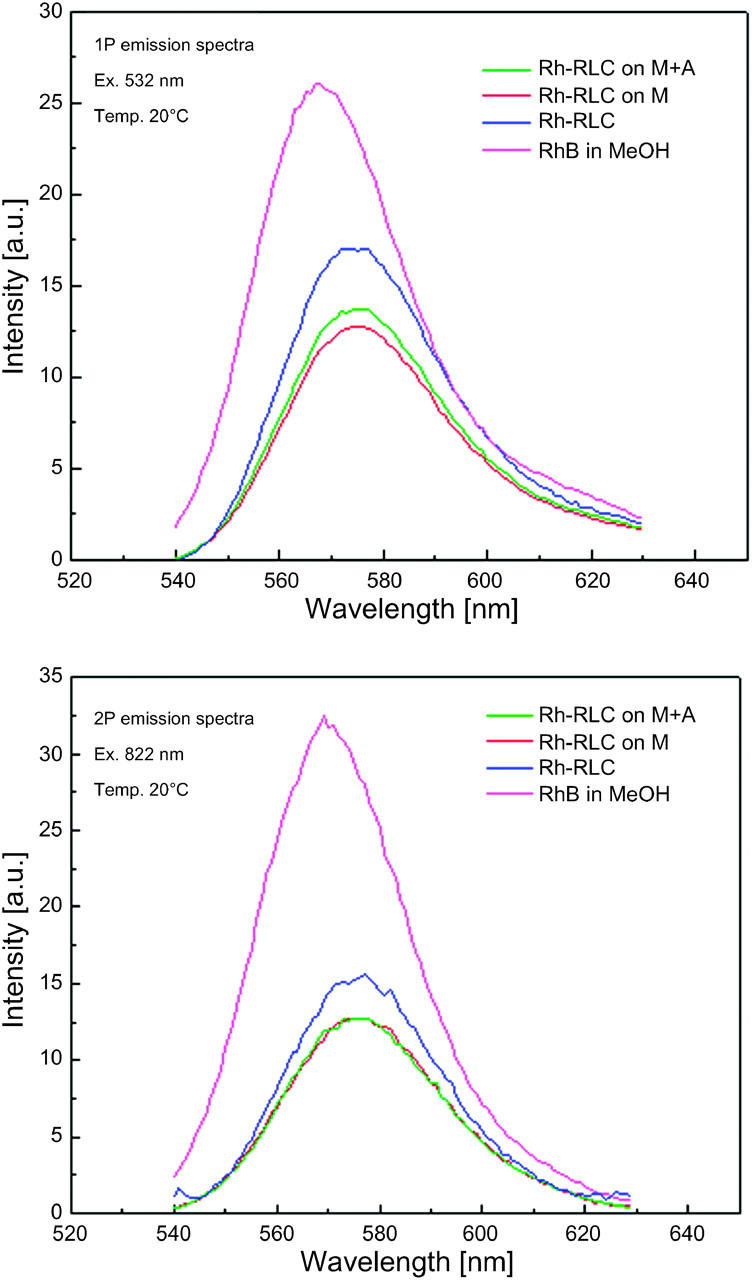
1P (A) and 2P (B) spectra of myosin labeled at RLC with rhodamine. 1P and 2P of Rh-RLC-myosin and Rh-RLC-myosin in the presence of equimolar actin were the same. Final concentration of Rh was 0.25 μM, temperature 20°C. M, myosin; A, actin; glyc, glycerol.
Number of observed cross-bridges
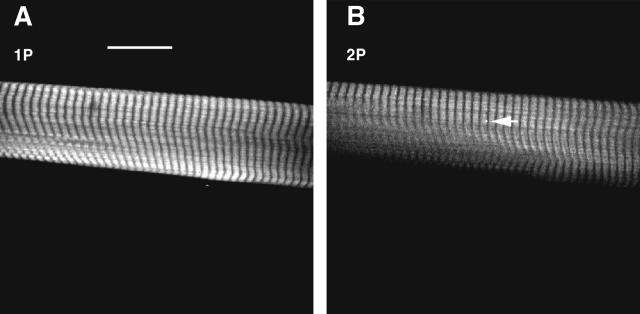
The number of observed molecules is equal to VNC, where V is the observational volume, N is Avogadro's number = 6 × 10²³, and C is the concentration of labeled cross-bridges. The concentration of labeled cross-bridges was measured by comparing the fluorescent intensity of labeled fibers with the intensity of a known concentration of dye. In eight experiments using 1P excitation, fibers exchanged with 1.1 mg/mL LC1 were 4.1 ± 1.4 (mean ± SE) dimmer than 10 μM solution of 5′-IATR in DMF. In eight experiments using 2P excitation, fibers were 5.9 ± 0.8 dimmer than 10 μM control. On average, fibers were 5.0 ± 0.8 dimmer than the control, i.e., the concentration of the dye in the fiber was 2 μM. To measure observational volume, we note that the volume is smaller in 2P than in 1P experiments. The 2P image has a shallower depth of focus. Fig. 4 compares 1P and 2P images of muscle fiber. The entire fiber section (97 × 24 μm) was in focus using conventional 1P imaging (Fig. 4 A), but only the top portion was in focus using 2P imaging (Fig. 4 B). To quantify this effect, we compared the depth-of-focus of the objective in 1P and 2P arrangements. Fig. 5 shows the scan along the z axis of an immobilized fluorescent sphere. Half width at half maxiumum (HWHM) were 2.2 μm and 1.2 μm for 1P and 2P profiles, respectively. The observed volumes were V1P ∼ 0.5 μm3 = 0.5 × 10⁻¹⁵ L and V2P = ∼0.25 × 10⁻¹⁵ L, and the numbers of observed myosins carrying LC1 were ∼600 and ∼300 in 1P and 2P experiments, respectively. Labeling with RLC at room temperature was approximately twice as efficient as labeling with ELC at 30°C. The numbers of observed myosins carrying RLC were ∼1200 and ∼600 in 1P and 2P experiments, respectively.
FIGURE 4.
(A) Confocal (1P) and (B) 2P image of the same area of a muscle fiber. The muscle is labeled with Rh-RLC. To obtain a confocal image, the muscle was illuminated with 568 nm light and viewed through a 35 μm pinhole and an LP 590 nm filter. To obtain a 2P image, the muscle was illuminated with 820 nm light and viewed without a pinhole. A 700 nm short-wavelength pass filter was used to block the intramicroscope reflections of the excitation beam. The two images represent slices through muscle ∼2 μm apart, because the two images are not exactly parfocal. The scale is 20 μm, the sarcomere length 2.62 μm. The round spot in B (pointed to by the arrow) shows the relative size of the illuminated spot.
FIGURE 5.
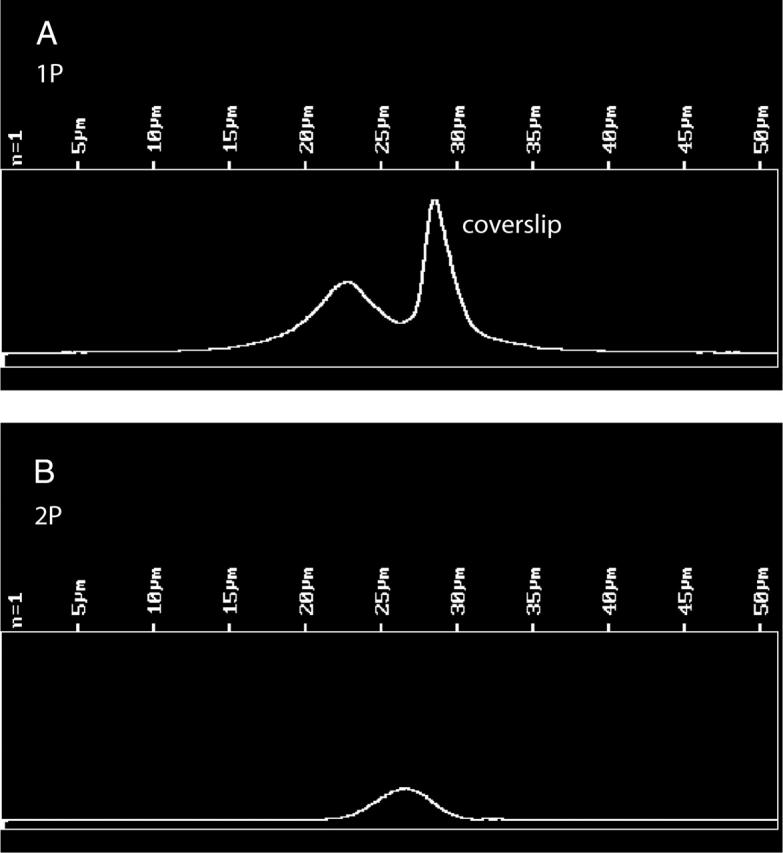
Comparison of the depth-of-focus of 1P and 2P illumination. Fluorescent microspheres of 1 μm (Molecular Probes Orange FluoSpheres) were dried on a coverslip and immobilized in a mounting medium provided with an MP PS-Speck Microscope Point Source Kit (Molecular Probes). A center of a microsphere was scanned in the Z direction in 0.1 μm steps. (A) 1P scan. Pinhole diameter 35 μm. λex = 568 nm, LP 590 nm emission filter. The bright peak at right is the light reflected by a coverslip. The microsphere profile is at left. HWHM of the profile = 2.2 μm. (B) 2P scan. No pinhole. λex = 820 nm, no emission filters, HWHM = 1.2 μm.
2P photobleaching
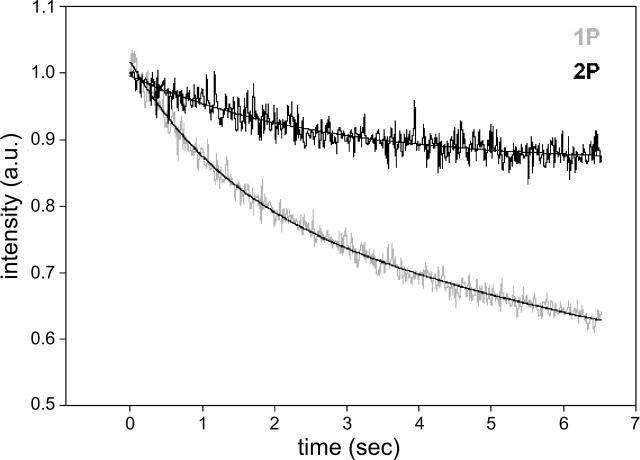
The rate of 2P photobleaching is lower in comparison with the rate of 1P photobleaching. Fig. 6 compares the rate of bleaching of a fiber illuminated with 568 nm (shaded) and 820 nm (black) radiation. A four-parameter exponential fit showed that 1P signal bleached 80% faster than 2P signal. The fact that 1P intensities bleach faster than 2P intensities is unexpected. The out-of-focus areas of a sample are known to bleach slowly (Pawley, 1995), but the intensities shown in the figure originate from the focal plane. Perhaps the effect is due to less toxic environment within the muscle fiber caused by the absence of out-of-plane photobleaching.
FIGURE 6.
Photobleaching of muscle illuminated with visible (568 nm, shaded) and IR (820 nm, black) laser beams. The lasers had the same intensity as used in the experiments. The fluorescence intensities (‖I⊥) have been normalized and fitted with four-parameter exponentials 0.23e−0.687t + 0.78e−0.034t and 0.13e−0.388t + 0.86 for 1P and 2P, respectively.
Anisotropy changes
Fig. 7 A is the time course of 1P anisotropy. Before stimulation, the perpendicular (dark shaded) and parallel (light shaded) intensities bleached at the rates of 0.72 and 1.29 s−1, respectively. The UV pulse was applied at the time indicated by the arrow. Consistent with earlier results (Borejdo and Akopova, 2003), the anisotropy (black) changed rapidly and later recovered slowly to the original level. (Note that I⊥ and I‖ changed in the same direction. Whether they change in the same or opposite direction depends on cross-bridge angle (Burghardt et al., 2001). It is the orthogonal anisotropies, not the intensities, that must change in the opposite direction.) Fig. 7 B shows the time course of anisotropy change of 2P signal from the adjacent area of the same muscle fiber. The polarization of the IR laser illuminating the muscle was parallel to the fiber axis. The perpendicular (dark shaded) intensity bleached at the rate of 0.39 s−1. The parallel (light shaded) intensity was very stable, bleaching at a negligible rate of 0.082 s−1. The resulting anisotropy (black) bleached therefore at a rate primarily determined by the rate of perpendicular intensity. The UV pulse was applied at the time indicated by the arrow (it is much more prominent in the 2P than in the 1P experiment because no confocal aperture was used). The anisotropy changed rapidly and recovered slowly to the original level. The rate of rapid change was too fast to measure. The rate of the slow recovery was 1.57 s−1 and 0.72 s−1 for 1P and 2P experiments. The 1P rate is in good agreement with previous results (Borejdo and Akopova, 2003). In analogy with 1P experiments (Borejdo and Akopova, 2003), we think that the rapid phase of 2P anisotropy change represents cross-bridge dissociation from thin filaments, and the slow recovery corresponds to rebinding of cross-bridges to actin in rigor conformation after photocreated ATP has been depleted.
FIGURE 7.
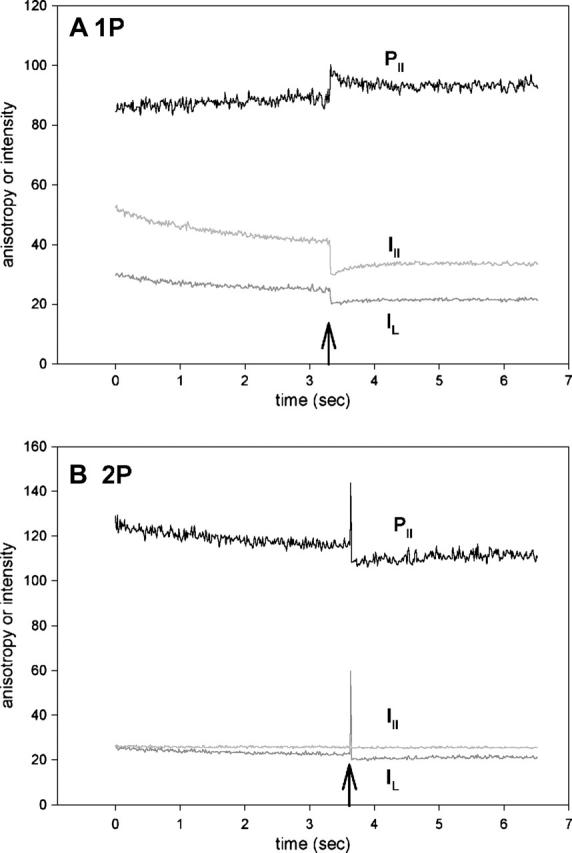
Orthogonal intensities (I⊥, dark shaded; I‖, light shaded) and parallel anisotropy (black) of muscle fiber containing Rh-RLC. To adjust anisotropy values to the same scale as polarized intensities, it is plotted as R‖(t) = [(‖I⊥(t) − ‖I‖(t))/(‖I⊥(t) + 2‖I‖(t))] × 256 + 128, where ‖I⊥(t) and ‖I‖(t)) are the instantaneous fluorescence intensities at time t. Thus the absolute anisotropy r = (R − 128)/256, where R is the measured anisotropy. In A and B they are −0.148 and −0.031 for 1P and 2P, respectively, before the UV flash. However, the absolute values are not reliable because of different sensitivities of the two orthogonal photomultipliers and because of high numerical aperture of the objective. Moreover, the direction of anisotropy change depends on the relative value of the two polarized components, which in turn depends on the sensitivity of the two photomultipliers. In these experiments, the sensitivity was not normalized, so the direction of change, in contrast to the kinetics, is meaningless. (A) 1P signal; (B) 2P signal.
Although photobleaching in 2P experiments is slower than in 1P experiments, it is not altogether absent. To correct for photobleaching, the data were fit to a single three-parameter exponential and the fit subtracted from the raw data. The same was done for 1P anisotropy, allowing direct comparison between the two. The result is shown in Fig. 8 A. The S/N ratio, defined as a ratio of anisotropy change to the standard deviation of the signal before the flash, was 4.3 and 5.1 for 2P and 1P experiments, respectively. In this, and five other experiments, the difference in S/N was not statistically significant.
FIGURE 8.
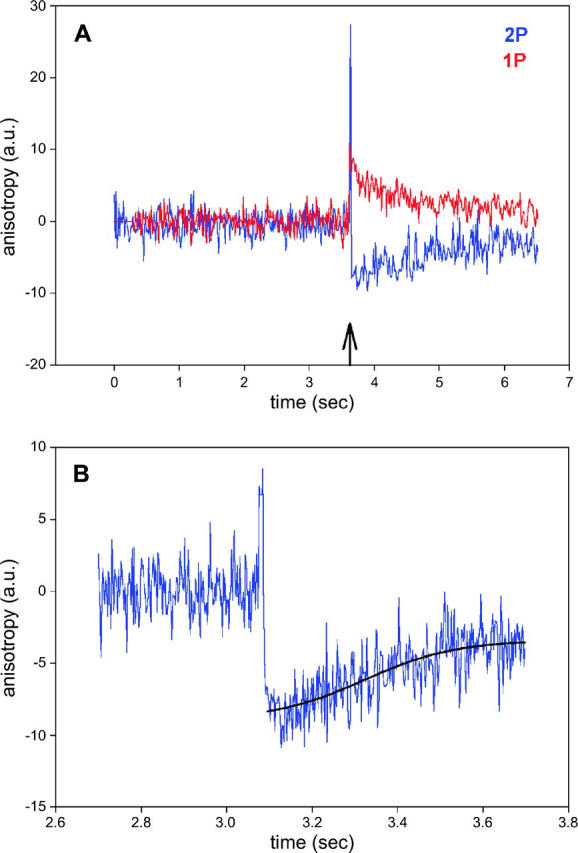
(A) Comparison of 1P (red) and 2P (blue) parallel anisotropy of muscle myosin labeled with Rh-RLC. To correct for photobleaching, the anisotropy data were fitted by a single three-parameter exponential functions (114.0 + 11.3e−0.450t and 85.9 + 16.6(1 − e−0.007t) for 2P and 1P, respectively). The fitted data were subtracted from the original data, so the curves are normalized to 0. The SD's of the signals before the flash were 1.63 and 1.36 for 2P and 1P signals, respectively. (B) 2P parallel anisotropy of muscle exchanged with LC1 (blue). The rising phase of the signal was fitted to a three-parameter sigmoidal (black) r‖ = −8.97 + 5.58/(1 + exp − ((x − 3.32)/0.11)).
The sigmoidal recovery of 2P signal
The anisotropy recovery curve is a superposition of steplike individual responses such as shown in Fig. 1 (see Discussion for details), and it should therefore reflect a power stroke. Although the overall time courses of 1 and 2P anisotropy signals are similar, there is one critical difference between the curves in Fig. 8 A. 1P anisotropy always rises after the UV pulse, and then decays exponentially to the origin. 2P anisotropy, on the other hand, changes rapidly and then remains approximately constant for a few hundred milliseconds before relaxing back to the origin. This sigmoidal character of the recovery is best demonstrated by changes of anisotropy of muscle labeled with fluorescent LC1, where the number of observed cross-bridges is smaller than after labeling with RLC. A typical record is shown in Fig. 8 B. The data have been “detrended” and fitted to a three-parameter sigmoidal. Significantly, data cannot be fit to a three- or four-parameter exponent (nonlinear fit does not converge after 100 iterations). In the example, the inflection occurred 220 ms after the creation of ATP. Fig. 9 shows other examples of the time course of the rising phase of anisotropy change. The data could not be fit by three- or four-parameter exponential rise to the maximum. The average ± SE of the time that the inflection occurred after the creation of ATP was 165 ± 31 ms (n = 10).
FIGURE 9.
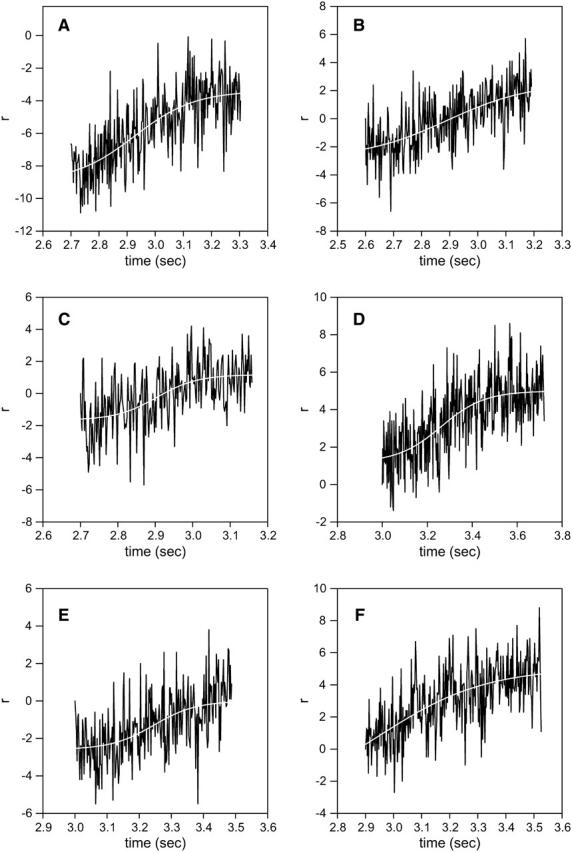
Examples of 2P parallel anisotropy of muscle exchanged with LC1. The rising phase of the signal was fitted (white lines) to a four-parameter sigmoidal with the inflections at the following times after the UV pulse: (a) 220 ms, (b) 289 ms, (c) 200 ms, (d) 260 ms, (e) 240 ms, and (f) 50 ms.
Control
It is conceivable that the observed changes in steady-state anisotropy of muscle fibers result from changes of rotation of the light chain itself (or of the dye alone) due to dissociation of cross-bridges from thin filaments, and do not reflect rotation of the lever arm at all. To check for this possibility, we measured 1P and 2P excitation anisotropies of solutions of Rh-RLC incorporated into myosin (Fig. 10). The 1P and 2P limiting anisotropies of immobilized myosin-Rh-RLC complex (open circles) at 540 and 822 nm are 0.346 and 0.522, respectively, giving the apparent angle between absorption and emission dipoles ∼17°. The 1P and 2P anisotropies of myosin-Rh-RLC at 540 and 822 nm are decreased to 0.253 and 0.370, respectively (red squares). The ratio of 1P/2P anisotropy is close to the predicted value (Gryczynski et al., 1995). Since myosin at low ionic strength is filamentous and does not execute any nanosecond-timescale motions, this decrease indicates collective motion of the probe and of the myosin-bound light chain. The 1P and 2P anisotropies of free Rh-RLC (blue triangles) are only slightly lower than corresponding anisotropies of light chain bound to myosin, suggesting that rotation of RLC on myosin is restricted by the interactions with the heavy chain. The residual 1P and 2P anisotropies of free rhodamine (pink diamonds) at 540 and 822 nm are 0.021 and 0.033, respectively.
FIGURE 10.
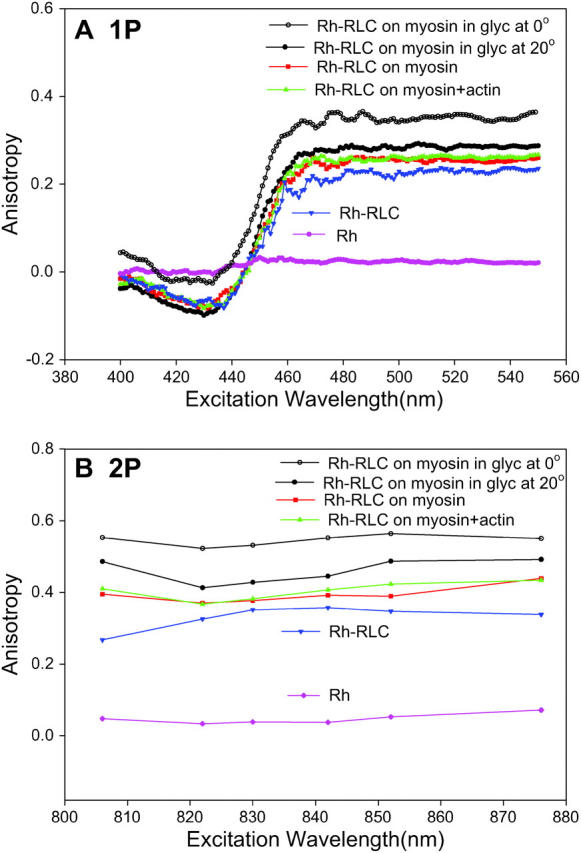
Excitation anisotropy spectra of RLC labeled with rhodamine and incorporated into myosin. (A) 1P measurements. (B) 2P measurements. The dye and myosin were immobilized in 85% glycerol at 0°C (open circles), myosin at low (50 mM KCl) ionic strength (red squares), and myosin bound to equimolar F-actin (green triangles). Controls: free Rh-RLC (blue triangles) and free rhodamine (pink diamonds). Final concentration of rhodamine was 0.25 μM. Equimolar phalloidin added to F-actin to stabilize filaments. λem = 576 nm. Excitation slit = 2 mm, emission slit = 1 mm. All measurements, except of myosin in the presence of glycerol, taken at 20°C.
The most important feature of Fig. 10 is that the addition of equimolar concentration of actin (green triangles) makes no difference to anisotropy of myosin alone (red squares). This suggests that it is unlikely that the observed anisotropy change arises because of the rotation of the light chain itself (or dye alone) due to actin dissociation. In principle, it is possible that anisotropy remains the same because a change in rotational correlation time of rhodamine is exactly compensated by equal change in fluorescence lifetime. However, this is not the case: fluorescence lifetimes in the absence and presence of actin were the same (Table 1). This proves that anisotropy of Rh is unaffected by the formation of actomyosin complex and that anisotropy change observed in fibers reflects lever arm rotation.
TABLE 1.
Lifetimes of Rh, Rh-RLC, and Rh-RLC on myosin and Rh-RLC on myosin + actin measured using fluorescence lifetime spectrometer FluoTime 100
| Compound |
 (ns)* (ns)*
|
αi | τi (ns) |  |
|---|---|---|---|---|
| Rh-RLC | 4.63 | 0.586 | 2.05 | 1.22 |
| 0.414 | 5.90 | |||
| Rh-RLC on myosin | 3.60 | 0.542 | 1.53 | 1.37 |
| 0.458 | 4.44 | |||
| Rh-RLC on myosin + actin | 3.58 | 0.563 | 1.75 | 1.38 |
| 0.437 | 4.50 | |||
| Rh | 2.33 | 0.429 | 1.25 | 1.41 |
| 0.571 | 2.70 |
Excitation 442 nm was from diode laser system (PTD 800B with LDH PC 440). Data analysis was performed using multiexponential fluorescence decay fitting software FluoroFit version 3.2.0.

DISCUSSION
This study shows that by using 2P microscopy, it is possible to resolve the power stroke of a cross-bridge of contracting muscle. The onset of a power stroke demonstrated itself as an inflection in a time course of anisotropy change. On the average, the power stroke occurred ∼170 ms after the beginning of the cross-bridge cycle.
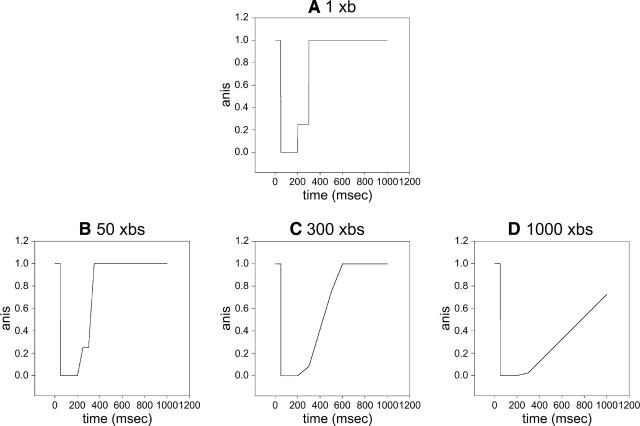
Fig. 11 explains why the appearance of the inflection is indicative of the power stroke. If a single cross-bridge were observed, the anisotropy of lever arm would be expected to change in three steps as illustrated in Fig. 11 A (same as Fig. 1). If the number is >1, the steps are obscured. Due to synchronization imposed by photogeneration of ATP, all the cross-bridges dissociate from actin at the same time (because the rate of dissociation is fast), but they rebind to actin at different times. The amount of time a cross-bridge remains free depends on the its position relative to the actin “target site”(Huxley, 1957). This effect is illustrated by a simple calculation in which the observed population is assumed to consist of 50 (Fig. 11 B), 100 (C), or 1000 (D) cross-bridges, each spending different amounts of time in an unbound state. For simplicity, we assume that these times differ by 1 ms. When the number of observed cross-bridges is small, the step indicating beginning of the power stroke is preserved (Fig. 11 B). In the actual experiments, this step is indicated by the inflection. But when the number of cross-bridges is large enough, stepwise character is lost (C and D). The exact number of cross-bridges necessary for loss of steps is model-dependent, but can be as small as factor of 2. This explains why the mode of detection makes a difference, i.e., that the effect may be unobservable in 1P experiments but present in 2P experiments. But it does not mean that it is impossible to see the inflection in 1P experiments—in 1P, a fiber has to be more lightly labeled; this decreases S/N and makes observations more difficult.
FIGURE 11.
Effect of increasing the number of observed cross-bridges on anisotropy. When a single cross-bridge is observed, the anisotropy changes in a stepwise manner (A) When the number observed is sufficiently small, inflection in anisotropy trace is preserved (B). When a large number is observed, anisotropy changes smoothly (C and D). It is assumed that all cross-bridges dissociate from actin at the same time (at time 0), but remain unbound depending on their position relative to the actin target site. It is assumed here for simplicity that this time differs by 1 ms for each cross-bridge. The inflection in the trace corresponds approximately to the beginning of the power stroke.
In a single turnover experiment such as reported here, the kinetics of orientation change are slowed down by the fact that the observed cross-bridges act against a majority of cross-bridges that are never illuminated. These bridges are always in rigor and constitute an effective resistive load. The result is that the orientation changes are slowed down in comparison with steady-state contraction. In a simple model such as shown here, it was estimated that the rates were slowed down by a factor of 15 (Borejdo and Akopova, 2003). It is therefore likely that in steady-state isometric contraction, the onset of the power stroke lags the beginning of the cross-bridge cycle by ∼11 ms.
We recognize the fact that the power stroke is expected to be small in isometric contraction. However, this probably does not alter our results. Since the cross-bridges executed only a single cycle, they had no opportunity to be restrained by series elasticity. It is also unlikely that the rotational motion of the lever arm occurs exclusively in the azimuthal plane, and that the polar component is too small to be detected. There are theoretical indications that there exists significant polar component (Burghardt and Ajtai, 1994).
It is interesting to note that 5′-IATR, whether free or coupled to the protein, always has two lifetimes. This is consistent with other measurements (Harley et al., 2002) and may be due to sample relaxation, sample heterogeneity, or conformational effects. It is impossible that it is due to the experimental artifact, because the lifetime of rhodamine B in water, measured under exactly the same conditions, gives expected monoexponential decay (τ = 1.706 ns, amplitude 1.0, χ2 = 1.225. The fit to two exponentials gives the same result: τ = 1.704 ns with amplitude 1.0, and τ = 0.09 ns with amplitude 0.0, χ2 = 1.271). It is unlikely that the observed rotational relaxation involves transition between local conformations, because the relative contribution of the two lifetimes did not change with the addition of actin (Table 1).
An important advantage of 2P excitation that cannot be overemphasized is that it is possible to measure signal through the side port of a conventional microscope. This avoids attenuation by microscope optics and reduces the length of the emission light path, thus increasing S/N ratio.
A resolution of each step in cross-bridge cycle in vivo must wait until a single cross-bridge within contracting muscle fiber can be followed.
Acknowledgments
We thank Mr. John Talent for technical assistance.
This work was supported by the National Institutes of Health (R21CA9732 and RO1AR048622), by grant 000130-0008-2001 from the Texas Higher Education Coordinating Board, and by the National Center for Research Resources (RR-08119).
References
- Allen, T. S.-C., N. Ling, M. Irving, and Y. E. Goldman. 1996. Orientation changes in myosin regulatory light chains following photorelease of ATP in skinned muscle fibers. Biophys. J. 70:1847–1862. [DOI] [PMC free article] [PubMed] [Google Scholar]
- Borejdo, J., and I. Akopova. 2003. Orientational changes of cross-bridges during single turnover of ATP. Biophys. J. 84:2450–2459. [DOI] [PMC free article] [PubMed] [Google Scholar]
- Borejdo, J., A. Shepard, D. Dumka, I. Akopova, J. Talent, A. Malka, and T. P. Burghardt. 2004. Changes in orientation of actin during contraction of muscle. Biophys. J. 86:2308–2317. [DOI] [PMC free article] [PubMed] [Google Scholar]
- Borejdo, J., D. Ushakov, R. Moreland, I. Akopova, Y. Reshetnyak, L. D. Saraswat, K. Kamm, and S. Lowey. 2001. The power stroke causes changes in orientation and mobility of the termini of essential light chain 1 of myosin. Biochemistry. 40:3796–3803. [DOI] [PubMed] [Google Scholar]
- Burghardt, T. P., and K. Ajtai. 1994. Following the rotational trajectory of the principal hydrodynamic frame of a protein using multiple probes. Biochemistry. 33:5376–5381. [DOI] [PubMed] [Google Scholar]
- Burghardt, T. P., A. R. Cruz-Walker, S. Park, and K. Ajtai. 2001. Conformation of myosin interdomain interactions during contraction: deductions from muscle fibers using polarized fluorescence. Biochemistry. 40:4821–4833. [DOI] [PubMed] [Google Scholar]
- Goldman, Y. E. 1998. Wag the tail: structural dynamics of actomyosin. Cell. 93:1–4. [DOI] [PubMed] [Google Scholar]
- Gryczynski, I., H. Malak, and J. R. Lakowicz. 1995. Three-photon induced fluorescence of 2,5 diphenyloxazole with a femtosecond Ti:sapphire laser. Chem. Phys. Lett. 245:30–35. [Google Scholar]
- Harley, M. J., D. Toptygin, T. Troxler, and J. F. Schildbach. 2002. R150A mutant of F TraI relaxase domain: reduced affinity and specificity for single-stranded DNA and altered fluorescence anisotropy of a bound labeled oligonucleotide. Biochemistry. 41:6460–6468. [DOI] [PubMed] [Google Scholar]
- Hopkins, S. C., C. Sabido-David, J. E. Corrie, M. Irving, and Y. E. Goldman. 1998. Fluorescence polarization transients from rhodamine isomers on the myosin regulatory light chain in skeletal muscle fibers. Biophys. J. 74:3093–3110. [DOI] [PMC free article] [PubMed] [Google Scholar]
- Huxley, A. F. 1957. A hypothesis for the mechanism of contraction of muscle. Prog. Biophys. Biophys. Chem. 7:255–318. [PubMed] [Google Scholar]
- Irving, M., T. St Claire Allen, C. Sabido-David, J. S. Craik, B. Brandmeier, J. Kendrick-Jones, J. E. Corrie, D. R. Trentham, and Y. E. Goldman. 1995. Tilting of the light-chain region of myosin during step length changes and active force generation in skeletal muscle. Nature. 375:688–691. [DOI] [PubMed] [Google Scholar]
- Lakowicz, J. R. 1986. Principles of Fluorescence Spectroscopy. Plenum Press, New York and London.
- Ling, N., C. Shrimpton, J. Sleep, J. Kendrick-Jones, and M. Irving. 1996. Fluorescent probes of the orientation of myosin regulatory light chains in relaxed, rigor, and contracting muscle. Biophys. J. 70:1836–1846. [DOI] [PMC free article] [PubMed] [Google Scholar]
- Malak, H., F. N. Castellano, I. Gryczynski, and J. R. Lakowicz. 1997. Two-photon excitation of ethidium bromide labeled DNA. Biophys. Chem. 67:35–41. [DOI] [PubMed] [Google Scholar]
- Pawley, J. B., editor. 1995. Handbook of Biological Confocal Microscopy, 2nd ed. Plenum Press, New York and London.
- Sabido-David, C., S. C. Hopkins, L. D. Saraswat, S. Lowey, Y. E. Goldman, and M. Irving. 1998. Orientation changes of fluorescent probes at five sites on the myosin regulatory light chain during contraction of single skeletal muscle fibres. J. Mol. Biol. 279:387–402. [DOI] [PubMed] [Google Scholar]
- Shepard, A., and J. Borejdo. 2004. Correlation between mechanical and enzymatic events in contracting skeletal muscle fiber. Biochemistry. 43:2804–2811. [DOI] [PubMed] [Google Scholar]
- Tonomura, Y., P. Appel, and M. F. Morales. 1966. On the molecular weight of myosin. II. Biochemistry. 5:515–521. [DOI] [PubMed] [Google Scholar]
- Wan, C., and C. K. Johnson. 1994. Time resolved anisotropic 2-photon spectroscopy. Chem. Phys. 179:513–521. [Google Scholar]
- Warshaw, D. M., E. Hayes, D. Gaffney, A. M. Lauzon, J. Wu, G. Kennedy, K. Trybus, S. Lowey, and C. Berger. 1998. Myosin conformational states determined by single fluorophore polarization. Proc. Natl. Acad. Sci. USA. 95:8034–8039. [DOI] [PMC free article] [PubMed] [Google Scholar]
- Wolff-Long, V. L., L. D. Saraswat, and S. Lowey. 1993. Cysteine mutants of light chain-2 form disulfide bonds in skeletal muscle myosin. J. Biol. Chem. 268:23162–23167. [PubMed] [Google Scholar]
- Xu, C., and W. Webb. 1996. Measurements of two-photon excitation cross sections of molecular fluorophores with data from 690 to 1050 nm. J. Opt. Soc. Am. B. 13:481–491. [Google Scholar]


