

Abstract
The ionizable amino acid side chains of proteins are usually located at the surface. However, in some proteins an ionizable group is embedded in an apolar internal region. Such buried ionizable groups destabilize the protein and may trigger conformational changes in response to pH variations. Because of the prohibitive energetic cost of transferring a charged group from water to an apolar medium, other stabilizing factors must be invoked, such as ionization-induced water penetration or structural changes. To examine the role of water penetration, we have measured the 17O and 2H magnetic relaxation dispersions (MRD) for the V66E and V66K mutants of staphylococcal nuclease, where glutamic acid and lysine residues are buried in predominantly apolar environments. At neutral pH, where these residues are uncharged, we find no evidence of buried water molecules near the mutation site. This contrasts with a previous cryogenic crystal structure of the V66E mutant, but is consistent with the room-temperature crystal structure reported here. MRD measurements at different pH values show that ionization of Glu-66 or Lys-66 is not accompanied by penetration of long-lived water molecules. On the other hand, the MRD data are consistent with a local conformational change in response to ionization of the internal residues.
INTRODUCTION
Among the noncovalent interactions responsible for the folding of polypeptide chains into unique three-dimensional conformations, the electrostatic interactions of ionized side chains are the most long-ranged. Numerous experimental and theoretical studies have been motivated by the need to understand how electrostatic interactions give rise to specificity in biological structures and processes by guiding protein folding, assembly, recognition, and catalysis (Davis and McCammon, 1990; Warshel and Åqvist, 1991; Honig and Nicholls, 1995; Nakamura, 1996; Simonson, 2003). All pH-dependent properties of proteins are ultimately governed by the electrostatic interactions of ionizable side chains. This coupling to chemical protonation equilibria allows protein electrostatics to be probed directly through measurements of pKa values (Warshel, 1981; Antosiewicz et al., 1996; Schutz and Warshel, 2001; Forsyth et al., 2002; Simonson et al., 2004). The effect of electrostatic interactions is usually quantified in terms of the shift, ΔpKa, of the pKa value of an ionizable group in a protein relative to the pKa value of the same group in a small reference molecule in dilute aqueous solution.
Most ionizable side chains reside at the protein surface, where they are at least partly exposed to the aqueous solvent. The relatively small pKa shifts of such surface residues are usually attributed to Coulomb interactions among the numerous charged surface groups and with salt ions in the solvent (Tanford and Kirkwood, 1957; Tanford and Roxby, 1972). These Coulomb interactions are enhanced because the protein itself is less polarizable than the aqueous solvent (Schellman, 1953; Hill, 1956).
Individually buried ionizable residues usually have much larger pKa shifts than surface residues (Schutz and Warshel, 2001; Urry et al., 1994; Forsyth et al., 2002). Although buried ionizable residues are relatively rare, they can play key functional roles in a variety of energy transduction processes (Shurki et al., 2004). In the absence of ion-pairing or other nearby charged groups, the pKa shift of a buried residue is dominated by the large electrostatic self-energy in the weakly polarizable protein interior. In a dielectric continuum description, ΔpKa is governed by the Born energy: the difference in the work of charging the ionic group in the protein medium and in a bulk aqueous medium (Bashford and Case, 2000). In this approximation, all polarization effects in the protein are subsumed in an apparent dielectric constant, ɛP. Because a uniform dielectric continuum model is a very crude description of the highly heterogeneous protein interior, the dielectric coefficient, ɛP, becomes a model-dependent scaling factor without transparent physical significance. Its value thus depends on whether self-energies or Coulomb energies are considered as well as on the details included explicitly in the model (formal charges, partial charges, and dipoles (Schutz and Warshel, 2001)). The effective dielectric constant governing the response of the entire protein to an externally applied electric field, which can be computed from the total protein dipole moment fluctuation, is strongly dominated by charged surface residues (Simonson and Brooks, 1996; Pitera et al., 2001). It is therefore not relevant to the self-energy of a deeply buried ionizable residue. Theoretical treatments of pKa shifts range from macroscopic dielectric continuum models, via semimacroscopic partial charge (Honig and Nicholls, 1995; Bashford and Case, 2000) and lattice dipole (Schutz and Warshel, 2001) models, to all-atom simulations (Simonson et al., 2004). Despite considerable sophistication, none of these theoretical approaches at present can reliably predict the large pKa shifts observed for buried residues. This shortcoming may be due in large part to difficulties in handling ionization-induced water penetration and conformational changes in pKa calculations.
Protein engineering can provide valuable insights into protein electrostatics (Sternberg et al., 1987). Particularly informative are the large pKa shifts measured for ionizable residues inserted in place of buried apolar residues. In the present work, we are concerned with the V66E and V66K mutants of staphylococcal nuclease (SNase). These deeply buried glutamic acid and lysine residues exhibit some of largest known pKa shifts, with |ΔpKa| in the range 4–5 (Dwyer et al., 2000; Fitch et al., 2002). To reproduce these large pKa shifts using dielectric continuum models with fixed charge distributions, it is necessary to invoke a protein dielectric constant, ɛP, of 10–12 (García-Moreno et al., 1997; Dwyer et al., 2000; Schutz and Warshel, 2001), which is much larger than would be expected from the predominantly apolar environment of these buried groups. Even with a semimacroscopic lattice dipole model, which explicitly but approximately takes into account the dielectric response of polar groups, the dielectric constant describing the remaining implicit degrees of freedom was unusually large for the V66E and V66K SNase mutants (Schutz and Warshel, 2001). The crystallographic identification of several buried water molecules near the protonated side chain of Glu-66 led to the suggestion that the polarization of these water molecules might account for the anomalously large dielectric constant needed to reproduce the experimental pKa value with macroscopic continuum calculations (Dwyer et al., 2000). This proposal was supported by a subsequent semimacroscopic dielectric continuum calculation that included the buried water molecules near Glu-66 explicitly (Fitch et al., 2002). Although the crystal structures of the V66K mutant do not identify any buried water molecules near the deprotonated Lys-66 (Stites et al., 1991; García-Moreno et al., 1997), it was hypothesized that buried water molecules are present, but that positional disorder and/or partial occupancy prevent them from being resolved in the electron density map at 2.1 Å resolution (Dwyer et al., 2000; Fitch et al., 2002).
The present study was undertaken to determine whether buried water molecules are present near the mutation site in the V66E and V66K mutants of SNase when the protein is in aqueous solution, and to reveal any hydration changes that accompany the ionization of these residues. For this purpose, we have used the 17O/2H magnetic relaxation dispersion (MRD) method, a specialized NMR technique that provides information about the occupancy, orientational order, and residence times of buried water molecules (Halle et al., 1999; Halle and Denisov, 2001). Surprisingly, the MRD results show that the V66E and V66K mutants have the same number of long-lived buried water molecules as the parent protein. This is true whether Glu-66 or Lys-66 is in the charged or in the neutral form. These results appear to contradict the finding of three buried water molecules near Glu-66 in the crystal structure of the V66E mutant (Dwyer et al., 2000). However, this structure was determined after flash-cooling the protein crystal to 95 K and the hydration structure may therefore not reflect the room-temperature equilibrium situation probed by the MRD experiments (Halle, 2004a). To resolve this issue, we report here the room-temperature crystal structure of the V66E mutant. Consistent with the MRD results, we find that the water molecule buried most deeply near the carboxyl group is no longer observable at room temperature. Similar internal hydration differences between structures determined at cryogenic and room temperatures have been observed for several other SNase mutants, including V66D (D. Karp, M. Stahley, G. Gittis, W. Stites, E. Lattman, and B. García-Moreno, unpublished results) and I92E (Nguyen et al., 2004). The present room-temperature crystallography and MRD data thus indicate that the uncharged forms of the ionizable groups of Glu-66 and Lys-66 do not interact directly with buried water molecules. Moreover, the MRD measurements at low and high pH rule out penetration of long-lived buried water molecules as a result of ionization of Glu-66 or Lys-66. The apparent high polarizability in the neighborhood of these residues is therefore not caused by water penetration. On the other hand, the available data are consistent with local conformational changes and/or disorder as a mechanism for stabilizing the buried charges in these mutants.
MATERIALS AND METHODS
X-ray crystallography
The V66E mutant of the hyperstable PHS variant of staphylococcal nuclease (SNase), which contains the three substitutions P117G, H124L, and S128A, was overexpressed in Escherichia coli and purified as described (Shortle and Meeker, 1986). The PHS variant is stabilized by 14 kJ mol−1 (at 20°C) with respect to wild-type SNase (Chen et al., 2000). Crystals of PHS/V66E were grown using hanging drop vapor diffusion methods at 4°C from a precipitating solution of 36% (vol/vol) 2-methyl-2,4-pentanediol and 25 mM potassium phosphate buffer, pH 6.4. The protein concentration was 8.5 mg mL−1 before 1:1 mixing with the precipitating solution in the hanging drop. PHS/V66E nuclease crystallized in tetragonal space group P41 with cell parameters a = b = 48.79 Å and c = 63.79 Å. Crystals appeared after 5–7 days, and were mounted in quartz capillaries for data collection. Diffraction data in the resolution range 50.0–2.1 Å were collected from a single crystal at 23°C using an R-AXIS 4 image plate detector (Rigaku, Danvers, MA). Data were processed and scaled using DENZO and SCALEPACK (Otwinoski and Minor, 1997) to yield a data set with 8484 unique reflections. The Rsym value for the data was 0.072 (0.215 in the highest resolution shell); the data were 96.4% complete (96.0% in the highest resolution shell).
The structure was solved by the molecular replacement phasing method. Using the atomic coordinates for PHS/V66E nuclease determined previously at 95 K as a search model (Dwyer et al., 2000), a unique rotation and translation solution was generated for the room temperature data set using CNS (Brünger et al., 1998). Rigid-body and positional refinement yielded unambiguous electron density maps to 2.1 Å resolution. Nine iterative rounds of model building (Jones et al., 1991), simulated annealing, positional and B-factor refinement (Brünger et al., 1998) yielded a final R-value of 0.194 (0.211 for the highest resolution shell), and Rfree of 0.218 (0.269 for the highest resolution shell). Root mean-square (RMS) deviations of the protein model from ideal geometry were 0.005 Å for bonds, 1.26° for bond angles, and 22.7° for dihedral angles. Amino acids 45–50 belong to a loop that is disordered in solution (Poole et al., 1991) and adopts a variety of conformations in crystal structures (Hynes and Fox, 1991). Because these residues were not well resolved in the electron density map, they were not included in the structural model. Thirty-one water molecules were built into the model in the final five iterations. Only water molecules with both σA-weighted and Fo–Fc electron density (contoured at 1.5 σ and 3.0 σ, respectively) and proximity to a likely hydrogen-bond partner (distance < 3.5 Å) were included. Statistics for the new room-temperature structure of PHS/V66E nuclease, as well as for five previously determined structures of wild-type, PHS, PHS/V66E, wild-type/V66K, and Δ+PHS/V66K nuclease, are summarized in Table 1. Coordinates for the room-temperature structure PHS/V66E have been deposited (accession code 1U9R.pdb).
TABLE 1.
Statistics for crystal structures of staphylococcal nuclease variants
| Crystal structure label | C1 | C2 | C3 | C4* | C5 | C6 |
|---|---|---|---|---|---|---|
| SNase variant | Wild-type | PHS | Δ+PHS/V66K | WT/V66K | PHS/V66E | PHS/V66E |
| PDB accession code | 1EY0 | 1EY8 | — | 2SNM | — | 1U9R |
| Temperature (K) | 297 | 297 | 95 | 298 | 95 | 296 |
| pH | 7.0 | 7.0 | 8.0 | 8.0 | 6.0 | 6.4 |
| Resolution limit (Å) | 1.60 | 1.75 | 2.1 | 1.97 | 2.1 | 2.1 |
| R-value | 0.20 | 0.19 | 0.19 | 0.18 | 0.19 | 0.19 |
| Free R-value | 0.26 | 0.24 | 0.22 | — | 0.27 | 0.22 |
| Residues | 6–141 | 7–141 | 7–43, 50–141 | 7–141 | 7–141 | 7–44, 51–141 |
| Non-hydrogen protein atoms | 1091 | 1076 | 1025 | 1085 | 1079 | 1031 |
| Water oxygen atoms | 82 | 74 | 19 | 41 | 64 | 31 |
| Median B-factor for protein atoms (Å2) | 34.9 | 34.4 | 31.1 | 22.9 | 32.6 | 32.1 |
| Median B-factor for water oxygens (Å2) | 48.8 | 50.7 | 27.2 | 34.1 | 30.8 | 37.3 |
| Reference | Chen et al., 2000 | Chen et al., 2000 | García-Moreno et al., 1997 | Stites et al., 1991 | Dwyer et al., 2000 | This work |
This structure also contains a Ca2+ ion and a 2′-deoxythymidine 3′,5′-diphosphate inhibitor in the active site.
Magnetic relaxation dispersion
MRD measurements were carried out on the V66E and V66K mutants of the Δ+PHS variant of SNase, as well as on the Δ+PHS parent protein itself. Apart from the three mutations in the PHS variant (see above), Δ+PHS contains two further substitutions (G50F and V51N) and a deletion of six residues (44–49) from the flexible Ω-loop (Poole et al., 1991; Hynes and Fox, 1991). As a result of these further modifications, Δ+PHS is stabilized by 28 kJ mol−1 (at 25°C) with respect to wild-type SNase (Fitch et al., 2002).
The proteins were expressed and purified to >98% (as judged by SDS-PAGE) following the method of Shortle and Meeker (1986). The acid/base titration of the proteins was assessed by circular dichroism and fluorescence spectroscopy. Denaturation of Δ+PHS/V66K in the absence of salt was observed below pH 4.5, consistent with previous work (Fitch et al., 2002). For the Δ+PHS/V66E mutant without added salt, denaturation was evident above pH 9, consistent with previous studies of the PHS/V66E mutant (Dwyer et al., 2000). In the presence of 0.2 M Na2SO4, Δ+PHS/V66E was stable up to pH 10. As expected (Dwyer et al., 2000; Fitch et al., 2002), the Δ+PHS parent protein was found to be more stable than either mutant at both low and high pH.
The lyophilized proteins were dissolved in a 58:42% (vol/vol) mixture of D2O and 17O-enriched (35 atom %) H2O (both from Cambridge Isotope Laboratories, Andover, MA). To investigate the effect of ionization of Glu-66 and Lys-66, MRD measurements were performed on solutions of Δ+PHS/V66E at pH 7.0 and 9.5 and on solutions of Δ+PHS/V66K at pH 4.5 and 7.0. The Δ+PHS parent protein was studied at all three pH values. Solution pH (without correction for isotope effects) was adjusted through microliter additions of 0.5–1 M HCl or NaOH. No buffer was used, but all protein solutions contained 133 mM Na2SO4 to enhance the stability of Δ+PHS/V66E at basic pH (see above) (Shortle et al., 1990). At room temperature, the Δ+PHS/V66E and Δ+PHS/V66K solutions showed signs of protein aggregation, which was most pronounced at pH 4.5 and 9.5. The samples were therefore extensively centrifuged, passed through 0.45-μm and 300-kDa filters, and thereafter stored at ∼10°C. The protein concentration in each MRD sample was determined by complete amino acid analysis.
The longitudinal relaxation rate, R1(ω0), of the water 2H and 17O resonances was measured as described in Denisov and Halle (1995a,b) at nine magnetic fields in the range 0.38–14.1 T, using five Bruker (Karlsruhe, Germany) and Varian (Palo Alto, CA) NMR spectrometers with four fixed-field cryomagnets and a field-variable iron magnet. The sample temperature was maintained at 20.0 ± 0.1°C by a thermostated air flow. The relaxation rates of a bulk water reference sample (with the same solvent isotope and salt composition as in the protein solutions) were Rbulk = 2.53 s−1 (2H) and 192 s−1 (17O).
The measured relaxation rates are governed by thermal fluctuations of the orientation-dependent nuclear electric quadrupole coupling at the positions of the 2H and 17O nuclei in water molecules and, in the case of 2H, also by labile SNase deuterons in fast or intermediate exchange with the water deuterons (Abragam, 1961; Halle et al., 1999; Halle and Denisov, 2001). The relaxation dispersion, i.e., the frequency dependence of R1, is produced by long-lived (residence time 10−9–10−6 s for 17O and 10−9–10−4 s for 2H) water molecules in intimate association with the protein and, for 2H, also by labile deuterons with residence times in the same range. The MRD profile, R1(ω0), can be expressed in terms of the spectral density function, J(ω), according to (Halle et al., 1999; Halle and Denisov, 2001)
 |
(1) |
where ω0 = 2π ν0 is the variable 2H or 17O resonance frequency in angular frequency units. The MRD profiles were modeled by a bi-Lorentzian spectral density function,
 |
(2) |
The amplitude parameters α, β, and γ, and the correlation times τβ and τγ, were determined by nonlinear least-squares fits of Eqs. 1 and 2 to the MRD data using the Levenberg-Marquardt algorithm (Press et al., 1992). Fits with a mono-Lorentzian spectral density function (lacking the γ-term in Eq. 2) could not represent the high-frequency tail of the dispersions. Inclusion of a second dispersive term, as in Eq. 2, reduced the χ2 merit function by a factor 5. Reported uncertainties in fitted parameter values are based on uniform relative uncertainties in the measured relaxation rates, adjusted to yield a reduced χ2 close to unity (Press et al., 1992).
The three terms in Eq. 2 represent contributions from different classes of protein-associated water molecules with distinct correlation times. The frequency-independent term, α, is the relaxation enhancement (relative to the bulk solvent relaxation rate) at a frequency of order 100 MHz. This contribution comes from hundreds of mobile (correlation time < 10−9 s) water molecules interacting with the external protein surface, and it can be expressed as (Halle et al., 1999)
 |
(3) |
where Nα is the number of water molecules in contact with the protein surface, and  is the total number of water molecules per protein molecule (the water/protein molar ratio). The rotational retardation factor, τα/τbulk, is the ratio of the water rotational correlation time, τα, averaged over all surface hydration sites, to the rotational correlation time, τbulk, of bulk water.
The frequency-dependent β- and γ-terms in Eq. 2 arise from water molecules fully or partly buried inside the protein or in deep surface pockets. A water molecule with a residence time, τW, much longer than the rotational correlation time, τR, of the protein contributes to the β-dispersion, with the correlation time τβ = τR. A water molecule with a shorter residence time contributes to the γ-dispersion, with the correlation time τγ given by Halle et al. (1999) as
 |
(4) |
The dispersion amplitude parameters β and γ are related to the corresponding numbers, Nβ and Nγ, of long-lived water molecules and their RMS orientational order parameters, Sβ and Sγ, through (Halle et al., 1999)
 |
(5) |
and a similar expression for the amplitude γ. Here, ωQ is the water 2H or 17O rigid-lattice nuclear quadrupole frequency for a protein-bound water molecule (ωQ = 7.6 × 10⁶ rad s−1 for 17O and 8.7 × 10⁵ rad s−1 for 2H). The values of the mean-square order parameters,  and
and  range from 0, for an isotropically disordered water molecule, to 1, for a fully orientationally ordered water molecule (S = 0.94 for a water molecule in ice Ih).
Equation 5 is valid in the fast-exchange limit, where the residence time, τW, of protein-bound water molecules (or labile deuterons) is short compared to the zero-frequency intrinsic spin relaxation time, Tβ = [(ωQSβ)2 τR]−1. This condition provides an upper bound for the residence time of water molecules contributing to the β-dispersion: τW < [(ωQSβ)2 τR]−1 (Halle et al., 1999).
RESULTS AND DISCUSSION
Structural context of Glu-66 and Lys-66
The crystal structures of the V66E mutant have been determined for the PHS variant of SNase, whereas the V66K structures refer to either wild-type or to the Δ+PHS variant (Table 1). The MRD solution studies described here were performed on the Δ+PHS variant and on the V66E and V66K mutants of this variant. The mutations and deletions in the PHS and Δ+PHS variants were introduced to enhance the stability of SNase, thereby allowing the ionization of residues Glu-66 and Lys-66 to be studied in solution. These background substitutions and deletions are at surface locations remote from the buried residue 66 and they produce only local structural changes (Baldisseri et al., 1991; Chen et al., 2000). For example, the Cα RMSD between the crystal structures C3 and C5 (Table 1) is only 0.32 Å (Dwyer et al., 2000). In the present study, which focuses on the local environment of residues Glu-66 and Lys-66, we therefore disregard variations in protein background.
In the crystal structures of the V66E and V66K mutants, the peptide carbonyl oxygen of residue 66 is solvent-exposed and hydrogen-bonded to an external water molecule, but the glutamic acid or lysine side chain is buried in a predominantly apolar environment. These side chains adopt extended conformations, with the carboxyl Oɛ2 atom and the amino Nζ atom 6.8 and 7.5 Å, respectively, from the peptide carbonyl oxygen. The nearest external water molecules are 7–9 Å from the carboxyl oxygens of Glu-66 and 9–10 Å from the amino nitrogen of Lys-66. These ionizable groups are surrounded by several apolar side chains: L14, A17, V23, L36, I92, and V99. In the V66E mutant, there are five protein oxygen or nitrogen atoms (T22.O, T62.O, T62.Oγ, K63.N, and E66.N) but 16 carbon atoms within 5 Å of either Glu-66 carboxyl oxygen. None of these polar atoms is within hydrogen-bonding distance of the carboxyl group. The nearest ionized groups (in the pH range 6–8 of the crystal structures) are Asp-19 (8 Å) and the ion-paired Lys-63 and Glu-67 (7–9 Å), all of which are exposed to external solvent. The environment of the Lys-66 Nζ atom is even more apolar, with 17 carbon atoms but only one or two polar protein atoms (G20.O and T62.O, both >4 Å) within 5 Å. The nearest ionized groups, Asp-19 and Asp-21, are in the active site, 9 Å away.
Because of the scarcity of polar atoms near the ionizable groups of Glu-66 and Lys-66, the charged form of these residues would be strongly destabilized as compared to a solvent-exposed location. Accordingly, these residues exhibit anomalous ionization equilibria in solution (25°C, 100 mM KCl) with apparent pKa values of 8.8 for Glu-66 (Dwyer et al., 2000) and 5.7 for Lys-66 (Fitch et al., 2002). These pKa values are shifted by 4.4 and 4.7 units, respectively, from the reference values for fully hydrated model compounds (Forsyth et al., 2002). The crystal structures discussed here were obtained at pH values (Table 1) where Glu-66 and Lys-66 are in their uncharged forms. The solution MRD experiments reported here, on the other hand, include conditions where these residues are predominantly ionized.
Structural characterization of buried water molecules
Each of the six structural models of SNase variants listed in Table 1 include between 19 and 82 water molecules. These sets of crystallographically identified water molecules should include the long-lived water molecules responsible for the observed frequency-dependence of the water 17O relaxation rate (see below). Previous MRD studies have established that the principal determinant of water residence times in proteins is penetration depth, usually quantified in terms of the external solvent-accessible surface area, AW, of the protein-associated water molecule (Denisov and Halle, 1996; Halle, 1998). Deeply buried (AW = 0) water molecules usually have residence times exceeding 10−8 s, and therefore contribute to the main β-dispersion, governed by the rotational correlation time of the protein (see Materials and Methods). Partly buried (0 < AW < 10 Å2) water molecules are usually located in deep surface pockets and tend to have residence times on the order of 10−9 s at room temperature. They will then contribute to the high-frequency γ-dispersion. The occupancy of a buried hydration site depends on water-protein interactions (Baker, 1995). Usually, the lost water-water interactions in the bulk solvent are compensated by 2–4 hydrogen bonds with the protein (or with other buried water molecules).
On the basis of these criteria, we have identified 10 potentially long-lived water molecules, labeled Wat1–Wat10, in the six crystal structures in Table 1 (see Table 2 and Fig. 1). These water molecules have little or no external-solvent accessibility, their positional order (as judged by the thermal B-factor) is as high as for protein atoms, and they participate in 2.5–4.0 hydrogen bonds (Table 2). This set of 10 water molecules can be subdivided in two different ways. First, we can identify a subset of consensus waters: Wat1–Wat3 and Wat6–Wat10. These eight water molecules are present in each of the six crystal structures in Table 1 (and in several others) with the same hydrogen-bonding partners. (Wat9 is included in the consensus set even though it was not identified in crystal structure C3. This structure includes only 19 water molecules and Wat9 may have escaped detection because of a large B-factor.) The remaining two water molecules, Wat4 and Wat5, are only observed in the V66E mutant. In the alternative subdivision, we can identify five deeply buried water molecules, Wat1–Wat5, without exposure to external solvent in any of the crystal structures (〈AW〉 = 0), and five partly buried water molecules, Wat6–Wat10, with small but nonzero solvent accessibility. The mutually hydrogen-bonded water molecules Wat6 and Wat10 reside in a pocket in the nucleotide-binding active site of SNase.
TABLE 2.
Buried water molecules in staphylococcal nuclease variants
| Label | Occurrence* | 〈AW〉 (Å2)† | 〈Brel〉‡ | 〈NHB〉§ | H-bond partners‖ |
|---|---|---|---|---|---|
| Wat1 | C1–C6 | 0.0 | 0.7 | 2.8 | D77.N; L89.O |
| Wat2 | C1–C6 | 0.0 | 0.8 | 3.0 | V104.O; A109.O; W140.Nɛ1 |
| Wat3 | C1–C6 | 0.0 | 1.0 | 3.5 | G20.N; P42.O; G55.O |
| Wat4 | C5 | 0.0 | 0.8 | 3.0 | G20.O; T22.O; E66.Oɛ2 |
| Wat5 | C5, C6 | 0.0 | 0.9 | 4.0 | D19.O; E66.Oɛ1; Wat9 |
| Wat6 | C1–C6 | 1.0 | 0.9 | 3.3 | Y115.N; N118.O; Wat10 |
| Wat7 | C1–C6 | 1.0 | 0.8 | 3.0 | E73.Oɛ1; G96.N |
| Wat8 | C1–C6 | 2.6 | 0.9 | 3.5 | H8.O; E10.Oɛ2; F76.N |
| Wat9** | C1, C2, C4–C6 | 2.5 (3.5) | 1.2 (0.9) | 2.4 (2.5) | S59.O; (Wat5) |
| Wat10 | C1–C6 | ∼10 | 0.9 | 2.5 | Y113.O; Wat6 |
Refers to the crystal structures in Table 1.
Solvent-accessible area of buried water molecule, averaged over the six crystal structures in Table 1.
B-factor of buried water molecule, divided by median B-factor for protein atoms (Table 1) and averaged over the six crystal structures.
Number of O or N atoms within 3.2 Å and belonging to protein or other buried water molecules, averaged over the six crystal structures.
Consensus hydrogen-bond partners (<3.2 Å), present in all six crystal structures.
Entries within parentheses refer to crystal structures C5 and C6 only.
FIGURE 1.

Room-temperature crystal structure of PHS/V66E staphylococcal nuclease, showing the location of fully (magenta) and partly (yellow) buried water molecules, and a portion of the molecular surface (cyan) near Glu-66 (shown in CPK representation). The water molecules are numbered as in Table 2. The deeply buried Wat4 is only present in the cryostructure and is then located above Wat5.
In the cryogenic structure of V66E, three water molecules are buried near the mutation site: Wat4, Wat 5, and Wat9 (Dwyer et al., 2000). The most deeply buried of these, Wat4, interacts strongly with the carboxyl group (2.6 Å from E66.Oɛ2) and has three peptide carbonyl oxygens at 3.0–3.5 Å (Asp-19, Gly-20, and Thr-22). Closer to the surface, but still fully buried, is Wat5. This water molecule resides in a polar environment, with four protein atoms (I18.N, D19.O, T22.O, and E66.Oɛ1) as well as the third water molecule, Wat9, within hydrogen-bonding distance (3.2 Å). Although Wat5 makes a strong (2.8 Å) hydrogen bond with Wat9, it is too far (3.6 Å) from Wat4 to form a hydrogen bond. Wat9, which is present also in the wild-type, PHS, and WT/V66K variants, is engaged in three strong (2.7–2.8 Å) hydrogen bonds to S59.O, Wat5, and an external water molecule. Although the hydration structure near Glu-66 has been described as a chain of four water molecules (Dwyer et al., 2000), Wat4 is not hydrogen-bonded to the other three, and the fourth water molecule does not interact significantly with the protein (the shortest polar contact is I18.O at 3.8 Å). In regard to MRD observability, we expect the fully buried Wat4 and Wat5 to have residence times longer than 10 ns, whereas Wat9, partly buried in a surface pocket, may have a shorter residence time.
During flash-cooling of a protein crystal, the temperature inside the crystal drops ∼200 degrees on a timescale of 10–100 ms (Kriminski et al., 2003; Halle, 2004a). During this period, temperature-dependent equilibria involving strongly solvent-coupled degrees of freedom will readjust until they are dynamically quenched at a temperature near 200 K (Halle, 2004a). Specific hydration motifs seen in cryostructures must therefore be interpreted with caution, as they might be cryoartifacts. Because water penetration may be a mechanism for stabilization of buried ionizable residues (Dwyer et al., 2000), we have redetermined the structure of the V66E mutant at room temperature (Fig. 1). In general, the room-temperature structure is closely similar to the cryogenic structure, with a Cα RMSD of 0.45 Å. In particular, the Glu-66 side chain adopts the same rotameric state in the two structures. The most significant difference is the hydration pattern near the mutation site: whereas Wat5 and Wat9 are conserved, the most deeply buried water molecule, Wat4, is absent at room temperature. The external water molecule hydrogen-bonded to Wat9 was also not evident in the room-temperature structure, but this may simply be a consequence of a large thermal B-factor (37 Å2 already at 95 K).
The structure of the closely related mutant PHS/V66D has also been determined (at 2.0 Å resolution) at cryogenic and room temperatures (D. Karp, M. Stahley, G. Gittis, W. Stites, E. Lattman, and B. García-Moreno, unpublished results). Here, the difference in hydration structure between the two temperatures is even more striking. At 103 K, one partly buried and two fully buried water molecules are seen near the mutation site. The most deeply buried water molecule is hydrogen-bonded (2.7–2.9 Å) to D66.Oδ2 and to the other two buried waters, each of which is also hydrogen-bonded to an external water molecule. This branched hydration motif is apparently a cryoartifact, since it is absent in the room-temperature structure, which only contains a partly buried water molecule near Asp-66, corresponding to Wat9 in V66E.
The other mutant, V66K, which we have studied by MRD, has also been subjected to crystal structure analysis at cryogenic and room temperatures (Table 1). For this mutant, there are no buried water molecules at the mutation site, except the partly buried Wat9 (also seen in the other SNase variants). The K66.Nζ atom is 7 Å from Wat9 and 9–10 Å from external water molecules.
Protein rotation and surface hydration
To determine the number of long-lived buried water molecules under solution conditions, we recorded water 17O and 2H MRD profiles at 20°C and at three pH values for the SNase variant Δ+PHS and for its two mutants Δ+PHS/V66E and Δ+PHS/V66K. The MRD data are shown in Figs. 2 and 3, along with fitted bi-Lorentzian relaxation profiles according to Eqs. 1 and 2. Unconstrained five-parameter fits to each of the 14 dispersion profiles yielded identical (within the error) values for the correlation times: τβ = 12.6 ± 0.7 ns and τγ = 2.1 ± 0.4 ns. To improve the accuracy, the three amplitude parameters were determined from fits where the two correlation times were fixed at the common values deduced from individual unconstrained fits. The resulting parameter values are collected in Table 3.
FIGURE 2.
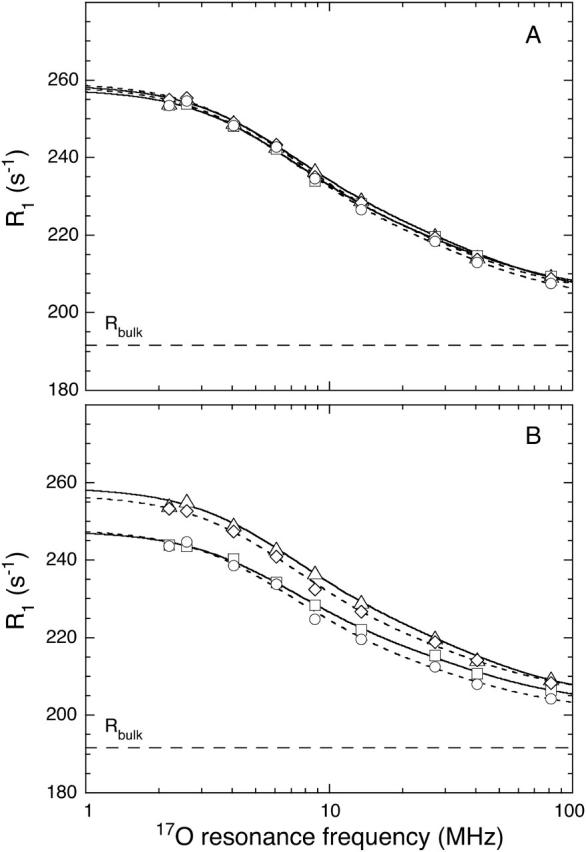
17O relaxation dispersion profiles at 20°C from solutions of (A) the parent protein Δ+PHS at pH 7.0 (▵) and 9.5 (□), and the V66E mutant at pH 7.0 (⋄) and 9.5 (○); and (B) the parent protein at pH 7.0 (▵) and 4.5 (□), and the V66K mutant at pH 7.0 (⋄) and 4.5 (○). The V66E and V66K data have been scaled to the same concentration as for the parent protein (1.59 mM), assuming that the excess relaxation rate (R1−Rbulk) is inversely proportional to NT (see Materials and Methods). The solid (parent protein) and dashed (mutants) curves represent three-parameter fits of a bi-Lorentzian spectral density function (see Materials and Methods, and Table 3). The horizontal dashed line indicates the bulk solvent relaxation rate. Error bars are approximately the same size as the data symbols. Note that the parent protein data at pH 7.0 (▵) are included in both panels.
FIGURE 3.
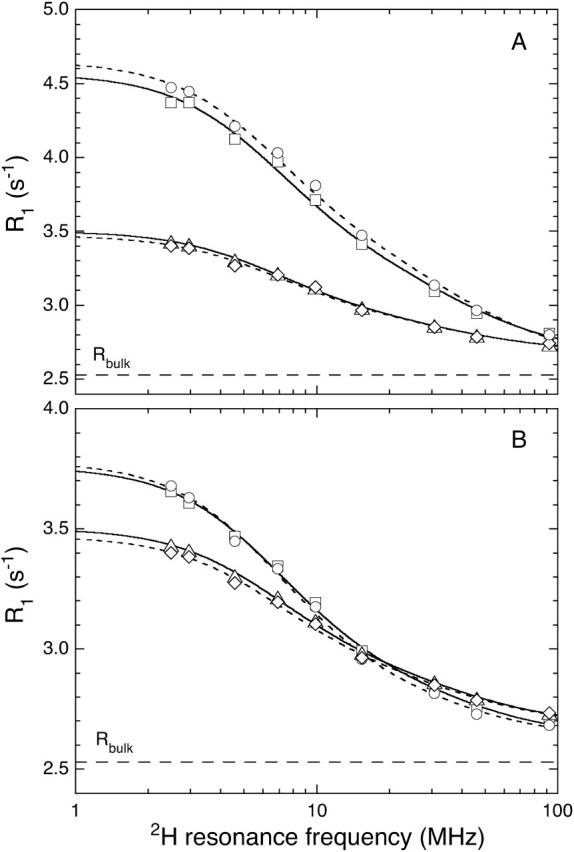
As in Fig. 2, but for 2H.
TABLE 3.
Results of fits to 17O and 2H MRD data from SNase mutants at 20°C
| From 17O MRD data
|
From 2H MRD data
|
|||||||
|---|---|---|---|---|---|---|---|---|
| SNase variant | pH | CP (mM)* |  |
 |
 |
 |
 |
 |
| Δ+PHS | 4.5 | 1.59 | 2.0 ± 0.1 | 1.45 ± 0.04 | 3.8 ± 0.3 | 1.5 ± 0.3 | 3.2 ± 0.1 | 4.8 ± 0.8 |
| Δ+PHS | 7.0 | 1.59 | 2.3 ± 0.2 | 1.70 ± 0.06 | 5.0 ± 0.4 | 2.1 ± 0.2 | 2.2 ± 0.1 | 4.6 ± 0.4 |
| Δ+PHS | 9.5 | 1.59 | 2.5 ± 0.2 | 1.73 ± 0.06 | 4.3 ± 0.4 | 1.9 ± 0.5 | 4.8 ± 0.2 | 12 ± 2 |
| Δ+PHS/V66K | 4.5 | 0.85 | 1.7 ± 0.2 | 1.64 ± 0.06 | 3.3 ± 0.5 | 1.4 ± 0.4 | 3.4 ± 0.2 | 3.9 ± 1.0 |
| Δ+PHS/V66K | 7.0 | 1.44 | 2.4 ± 0.2 | 1.76 ± 0.06 | 4.0 ± 0.5 | 2.1 ± 0.2 | 2.1 ± 0.1 | 4.3 ± 0.6 |
| Δ+PHS/V66E | 7.0 | 1.18 | 2.3 ± 0.2 | 1.81 ± 0.06 | 4.5 ± 0.4 | 2.2 ± 0.3 | 2.1 ± 0.1 | 4.5 ± 0.9 |
| Δ+PHS/V66E | 9.5 | 1.00 | 2.1 ± 0.2 | 1.81 ± 0.07 | 4.6 ± 0.5 | 1.5 ± 0.5 | 4.8 ± 0.2 | 14 ± 2 |
All MRD profiles were subjected to bi-Lorentzian fits with three adjustable parameters and the two correlation times were fixed at the mean values, τβ = 12.6 ns and τγ = 2.1 ns, obtained from unconstrained fits.
Protein concentration in MRD sample.
We identify the longer correlation time, τβ, with the rotational correlation time, τR, of the protein. According to the crystal structures, the single-point mutations V66E and V66K do not affect the size and shape of the protein. The three SNase variants should therefore have the same τR, in agreement with the MRD data. The rotational correlation time for 1.5 mM wild-type SNase in complex with a calcium ion and a mononucleotide inhibitor at pH 6.4 and 35°C has previously been determined from 15N relaxation data: τR = 9.1 ± 0.5 ns (Kay et al., 1989). Using the scaling relation τR ∝ η/T to convert this value to 20°C and the solvent viscosity of the isotope-enriched water in our MRD samples (η = 1.15 cP), we obtain 15.0 ± 0.8 ns. Another 15N relaxation study (Alexandrescu et al., 1996) of the same SNase variant, but at 3 mM and pH 5.3, yields 14.6 ns after η/T scaling. As expected, these values are somewhat larger than our value, τR = 12.6 ns, which refers to the Δ+PHS variant without the solvent-exposed flexible loop residues 44–49 and without the inhibitor.
Here, we are primarily interested in the amplitudes of the β- and γ-dispersions, which are proportional to the number of long-lived (buried) water molecules. Before discussing these parameters, we shall briefly consider the frequency-independent parameter, α. With the aid of Eq. 3, we can transform α into the quantity Nα(τα/τbulk–1), involving the number, Nα, of dynamically perturbed water molecules in contact with the external protein surface and the rotational retardation factor, τα/τbulk, i.e., the relative slowing down, compared to bulk water, of the diffusive rotational motion of water molecules in the hydration layer. Within the experimental uncertainty, the six MRD profiles recorded at pH 7.0 (17O and 2H, three SNase variants) yield the same result, Nα(τα/τbulk–1) = (2.2 ± 0.2) × 103. The number Nα can be estimated by dividing the solvent-accessible surface area of the protein, AP, by the mean area, aW, occupied by a water molecule at the surface. The calculation of AP is complicated by the fact that the disordered residues 1–6 and 142–149 at the ends of the polypeptide chain are usually not resolved in crystal structures. We therefore calculate AP from the crystal structure of Δ+PHS/V66K (García-Moreno et al., 1997) and add a contribution from the 14 unresolved terminal residues, estimated with the aid of the NMR solution structure of SNase (Wang et al., 1997). In this way, we obtain AP = 8400 Å2 (probe radius 1.4 Å). With the conventional value, aW = 15 Å2, this yields Nα = 560. The rotational retardation factor for Δ+PHS nuclease at 20°C then becomes τα/τbulk = 4.9 ± 0.4. This result falls in the range found from previous 17O MRD studies (at 27°C) of a dozen different proteins, τα/τbulk = 5.4 ± 0.6 (mean ± 1 SD) (Halle, 2004b). Since the rotational retardation factor decreases with decreasing temperature (Modig et al., 2004), the agreement would be even closer if the comparison had been made at the same temperature. In regard to surface hydration, SNase can thus be regarded as a typical globular protein.
Buried water in parent and mutant proteins with uncharged Glu-66 or Lys-66
We consider now the amplitude parameters β and γ deduced from the 17O and 2H dispersion profiles of the Δ+PHS parent and of the V66E and V66K variants at pH 7.0 (Figs. 2 and 3). With the aid of Eq. 5, these parameters can be transformed into the quantities  and
and  involving the number of buried water molecules associated with the β- and γ-dispersions and the mean-square orientational order parameters for these water molecules (see Materials and Methods). The finding that τβ = τR (see above) implies that the water molecules responsible for the β-dispersion have residence times, τW ≫ 10 ns (see Materials and Methods). The water molecules that give rise to the γ-dispersion, with τγ = 2.1 ns, must have shorter residence times. With the aid of Eq. 4 and τR = 12.6 ns, we obtain τW = 2.5 ns. This should be regarded as an average over several hydration sites with residence times in a range of ∼1–5 ns.
At pH 7.0, the ionizable groups of Glu-66 (pKa 8.8) and Lys-66 (pKa 5.7) are essentially in their uncharged forms (98 and 95%, respectively), as in the crystal structures of these mutants. The MRD results (Table 3) can therefore be compared directly to crystallographically identified buried water molecules (Table 2). The MRD results clearly demonstrate that neither mutation has a significant effect on the number (or orientational order) of buried water molecules with τW ≫ 10 ns:  from the 17O data and 2.1–2.2 from the 2H data. The difference of 0.4 units may be attributed to a small contribution from labile protein deuterons (Denisov and Halle, 1995b), to a water molecule with a relatively long (10–100 μs) residence time (see below), or to a difference between the 2H and 17O order parameters (Denisov et al., 1997). Also the number of (partly) buried water molecules with τW ≈ 2.5 ns is unaffected (within the experimental accuracy) by the mutations:
  for both nuclei and for all three SNase variants.
The deeply buried Wat4, which is only seen in the 95 K structure of PHS/V66E, is expected to have a long (≫10 ns) residence time and would therefore contribute to  The finding that, for both 17O and 2H,
  is the same for V66E as for the Δ+PHS parent supports the conclusion that Wat4 is a cryoartifact, not present at room temperature. The second water molecule, Wat5 buried near Glu-66, is seen also in the room-temperature structure, but the MRD data provide no evidence for its presence in solution. If Wat5 were present, we would expect either
  or
or  to be significantly larger for the V66E mutant than for the Δ+PHS parent, but this is not the case for any of the two nuclei (Table 3). A possible resolution of this discrepancy is that Wat5 is orientationally disordered and hence has an unusually small order parameter. This would be consistent with the large thermal B-factor of Wat5 in the room-temperature structure (39 Å2), corresponding to an RMS atomic displacement of 1.2 Å. Furthermore, whereas highly ordered internal water molecules typically have three or four short polar contacts (indicating strong hydrogen bonds), Wat5 has no less than five oxygens and two nitrogens within 3.8 Å but only one of these seven potential hydrogen-bond partners is within 3.0 Å (in the room-temperature structure). This suggests that Wat5 can adopt several alternative orientations without sacrificing its polar interactions. If these orientations are sampled on timescales shorter than the correlation time (12.6 and 2.1 ns for the β- and γ-dispersions, respectively), then the effective electric field gradient tensor is orientationally averaged and the order parameter of Wat5 might be reduced to an unobservably small value (S2 ≪ 1).
The MRD data for all three SNase variants at pH 7.0 can be accounted for by two water molecules with τW ≫ 10 ns and five water molecules with τW ≈ 2.5 ns, in total seven buried or partly buried water molecules. These numbers should be regarded as lower bounds, corresponding to high orientational order (S2 ≈ 1). If some of the buried water molecules are orientationally disordered (S2 < 1), their number would be correspondingly greater. In an extreme case, a long-lived buried water might have S2 ≪ 1 and therefore not contribute significantly to the dispersion amplitude. As noted above, this may be the case for Wat5.
Another reason why the MRD-derived quantity  (but not
  ) may indicate a smaller number of buried water molecules than seen in the crystal structure is that the water residence time, τW, may be comparable to or longer than the intrinsic spin relaxation time (see Materials and Methods). This has the effect of reducing
  by the factor (
 where ωQ is the nuclear quadrupole frequency (Halle et al., 1999). In the case of 17O, this factor is 0.9 for τW = 0.45 μs and 0.5 for τW = 6 μs (assuming S2 = 0.7). Owing to the smaller 2H quadrupole frequency, the fast-exchange regime extends to longer residence times, so that the 2H correction factor is 0.9 for τW = 35 μs and 0.5 for τW = 450 μs. The finding that
  is 20% larger for 2H than for 17O could thus be rationalized by one buried water molecule with a residence time in the range 10–100 μs. Nevertheless, the MRD results indicate that nearly all of the buried water molecules have residence times shorter than a few microseconds at 20°C. A buried water molecule with τW >10 ms would not contribute significantly even to the 2H dispersion, but this is an unlikely possibility. The longest residence time so far determined for a water molecule buried in a protein is 0.4 ms at 20°C and this refers to a water molecule with four near-optimal hydrogen bonds, completely buried beneath a disulfide bond (Denisov et al., 1996).
In conclusion, the 17O and 2H dispersions observed at pH 7.0 (Figs. 2 and 3) can be accounted for by the eight buried water molecules identified in all crystal structures of SNase (Table 2). We tentatively assign the β-dispersion (corresponding to τW ≫10 ns) to the deeply buried water molecules Wat1–Wat3. The γ-dispersion can be attributed to Wat6–Wat10, partly buried in deep surface pockets with residence times of a few nanoseconds. However, we cannot exclude a contribution to the γ-dispersion from one or two additional water molecules, not identified in the crystal structures, perhaps because they are displaced by direct protein-protein contacts in the crystal lattice. Finally, and most importantly, the MRD data provide no evidence for the presence of additional buried water molecules in the V66E and V66K mutants not present in the Δ+PHS parent. However, one such water molecule (Wat5) might have escaped detection because of orientational disorder.
Buried water in mutant proteins with charged Glu-66 or Lys-66
We now discuss the MRD data obtained under conditions where Glu-66 and Lys-66 in the V66E and V66K mutants are predominantly in the ionized state. Based on previously determined pKa values (Dwyer et al., 2000; Fitch et al., 2002), we expect Glu-66 to be 83% ionized at pH 9.5 and Lys-66 to be 94% ionized at pH 4.5. To isolate hydration changes caused by the ionization of these residues from other pH-dependent effects, we also studied the Δ+PHS parent protein at pH 4.5 and 9.5. The 17O and 2H dispersion profiles are shown in Figs. 2 and 3, and the resulting parameter values are given in Table 3.
We consider first the effect of Glu-66 deprotonation between pH 7.0 and 9.5. As seen from Fig. 2 A, the four 17O dispersion profiles obtained from the Δ+PHS parent and its V66E mutant at pH 7.0 and 9.5 are virtually identical. Accordingly, no significant effects of the V66E mutation or of the pH change can be seen in any of the MRD parameters (Table 3). Although no crystal structure is available for the V66E mutant at pH values where Glu-66 is deprotonated, the 17O MRD data clearly show that Glu-66 deprotonation is not accompanied by penetration of additional long-lived and ordered water molecules. Furthermore, if an orientationally disordered water molecule (Wat5) is buried near the protonated Glu-66, it does not become substantially more ordered when the carboxyl group is deprotonated. The 2H MRD data are consistent with this picture, but they are masked by a dominant contribution from labile SNase hydrogens for both Δ+PHS and V66E at pH 9.5 (Fig. 3 A and Table 3). As a result of base-catalyzed hydrogen exchange with water, most hydroxyl, amino (if not deprotonated), and guanidino hydrogens in SNase will have residence times in the microsecond range at pH 9.5. These labile hydrogens will therefore be in the fast-exchange limit and will contribute to  albeit with smaller order parameters than for hydrogens in buried water molecules (Denisov and Halle, 1995b). The large increase in
  is caused by labile hydrogens, including (exposed) amide hydrogens, in the intermediate-exchange regime, where the effective correlation time becomes shorter than τR even though the residence time is longer than τR (Halle et al., 1999).
In contrast to the pH invariant hydration behavior of V66E, the 17O dispersion from the V66K mutant does exhibit a significant pH dependence between pH 7.0 and 4.5, where the Lys-66 amino group is protonated. However, because a similar pH dependence is observed for the Δ+PHS parent (Fig. 2 B), it cannot be attributed to the ionization of Lys-66. As seen from Table 3, all three 17O MRD parameters for the Δ+PHS parent are significantly reduced at pH 4.5. Similar reductions are seen for the V66K mutant, although the effect on  is barely significant. We attribute these effects to incipient acid denaturation at pH 4.5. Whereas protonation of Lys-66 leads to partial or global unfolding in the PHS/V66K mutant (Stites et al., 1991; García-Moreno et al., 1997), the more stable Δ+PHS/V66K mutant appears to exist primarily in the native conformation at pH > 4.2, even though Lys-66 is 97% ionized at pH 4.2 (Fitch et al., 2002). Although structural changes were not observed by fluorescence, far-UV CD, or 1H NMR spectroscopy down to pH 4.2, the (Δ+PHS/V66K) − (Δ+PHS) difference potentiometric titration curve suggests that acid denaturation of the mutant already is underway at pH 4.5 (Fitch et al., 2002). All these measurements were done at 25°C and in the presence of 100 mM KCl, whereas the MRD experiments were carried out at lower temperature (20°C) and in the presence of 133 mM Na2SO4, which is known to stabilize the native protein (Shortle et al., 1990). Nevertheless, the MRD data indicate structural changes in the Δ+PHS parent as well as in the V66K mutant at pH 4.5. Although these structural changes may be subtle, the involvement of all three MRD parameters suggests that they are not local. A drop in the intrinsic fluorescence intensity from the Δ+PHS protein between pH 7 and 4 (Fitch et al., 2002) is consistent with the subtle global structural change reflected in the MRD data.
Evidence for partial acid denaturation at pH 4.5 is also provided by the 2H MRD data, through the reduction of the surface hydration parameter Nα(τα/τbulk–1) (Fig. 3 B and Table 3). Although acid unfolding should increase Nα, the dominant effect has been found to be a reduction of the rotational retardation factor, τα/τbulk, presumably caused by disruption of surface hydration sites occupied by strongly dynamically retarded water molecules (Denisov et al., 1998; Halle et al., 2004). The slight reduction of  seen in the 17O data is masked in the 2H data by a labile-hydrogen contribution at pH 4.5. This can be attributed to those carboxyl groups that remain protonated at this pH and to acid-catalyzed exchange of hydroxyl hydrogens (Denisov and Halle, 1995b). The large increase in
  seen at pH 9.5 is not observed at pH 4.5, because amide proton exchange is essentially base-catalyzed.
In conclusion, the MRD data do not provide any evidence for penetration of long-lived and ordered water molecules concomitant with ionization of Glu-66 or Lys-66. Furthermore, any water molecules that might be buried in the unionized forms of the mutants, but escape detection because of orientational disorder, do not become substantially more ordered upon ionization of Glu-66 or Lys-66. The parameters  and
and  which are proportional to the number of long-lived water molecules, do not change at all when Glu-66 is ionized, whereas they decrease slightly when Lys-66 is ionized. The latter effect, which is opposite to what would be expected for ionization-induced water penetration, is attributed to incipient acid denaturation, which might reduce the order parameters of one or more buried water molecules remote from the mutation site.
To exhibit the effect of the V66E and V66K mutations more directly, the MRD data in Figs. 2 and 3 can be displayed as the difference, ΔR1 = R1(mutant) − R1(parent), of the relaxation rates measured for mutant and parent protein at the same pH (and normalized to the same protein concentration). Since the crystal structures show only local structural perturbations in these mutants (see above), the difference dispersion provides a direct visual indication of any hydration changes induced by the mutation. As seen from Fig. 4, the 17O ΔR1 values do not deviate significantly from zero for either mutant at either pH value. To illustrate the sensitivity of the MRD method, Fig. 4 shows the difference-dispersion profiles expected if the mutant contained one more buried water molecule than the Δ+PHS parent. This putative water molecule is taken to be highly ordered (S2 = 1) and its correlation time (which obeys Eq. 4 with τR = 12.6 ns) is indicated in the figure. Taking the experimental error into account, the MRD data allow us to exclude the presence in the V66E or V66K mutant of even a single long-lived (τW > 5 ns) and orientationally ordered (S2 > 0.3) water molecule that is not present in the Δ+PHS parent protein. The only case where a significant difference-dispersion can be discerned is in the 2H data for V66E at pH 9.5 (Fig. 4). Since a corresponding difference dispersion is not seen in the 17O data, it can be attributed to a small difference in the labile-hydrogen contribution (which is very large at this pH). Since the mutant is less stable than the parent, some of the amide hydrogens that dominate the γ-dispersion may exchange faster in the mutant and thereby make a slightly larger contribution to  The absence of a 2H difference dispersion from the Glu-66 carboxyl hydrogen at pH 7.0 indicates that the buried location of this labile hydrogen protects it from exchange on timescales <10−4 s.
FIGURE 4.
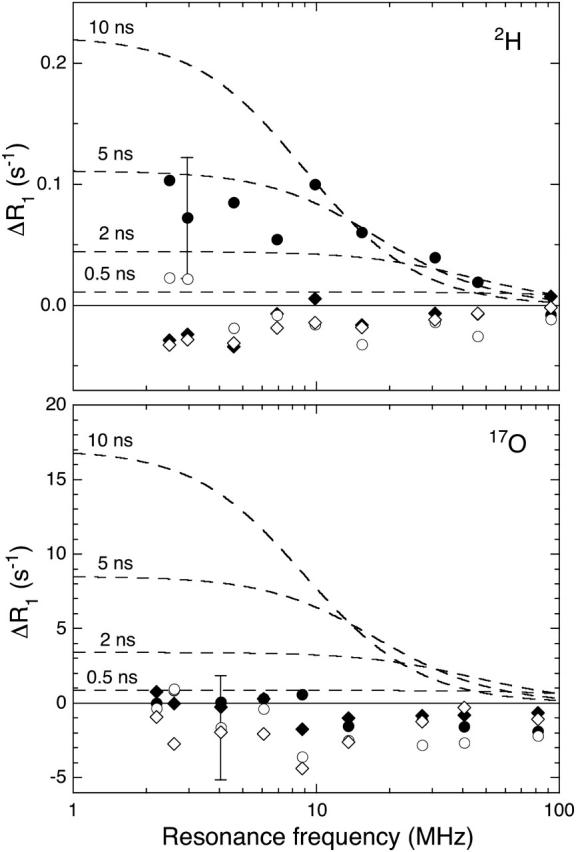
The difference, ΔR1 = R1(mutant) − R1(parent), between the 2H (top) and 17O (bottom) relaxation rates (from Figs. 2 and 3) for V66E at pH 7.0 (♦) and 9.5 (•), and for V66K at pH 7.0 (⋄) and 4.5 (○). An error bar is shown for one of the data points. The dashed curves illustrate the effect of a putative ordered water molecule present in the mutant but not in the parent protein and with the indicated correlation time.
Water penetration versus conformational change
Buried water molecules constitute a ubiquitous and genetically conserved feature of most globular proteins (Baker, 1995), stabilizing the native protein conformation as versatile hydrogen-bond partners and sometimes participating directly in catalytic or binding processes (Meyer, 1992). Another stabilizing role of buried water molecules was suggested soon after the discovery of internal water molecules in high-resolution crystal structures: they may help to spread the charge of buried ionized groups over a larger volume, thus increasing the effective local dielectric constant of the protein interior (Birktoft and Blow, 1972). A recent survey of Asp and Glu residues in native proteins includes a few strongly upshifted pKa values (Forsyth et al., 2002). These carboxyl groups tend to be located in deep surface pockets or near other (deprotonated) carboxylates. Completely buried, non-ion-paired, native carboxyl groups do occur, particularly in larger proteins, but pKa values are rarely available. One example is Glu-108 in carboxypeptidase A (pH 7.5, room temperature), residing in a nonpolar environment with a buried water molecule as the only polar atom within hydrogen-bonding distance (Rees et al., 1983; Kilshtain-Vardi et al., 2003). Another example is Glu-109 in chymosin (pH 6.0, room temperature), with one buried water molecule and a serine hydroxyl group within hydrogen-bonding distance (Gilliland et al., 1990). In both of these structures, the buried water molecule has three oxygen atoms within 2.9 Å. The shortest of these contacts, 2.5–2.6 Å, is with one of the carboxyl oxygens of the buried glutamate. The coordination geometry of these buried water molecules is much closer to planar trigonal than tetrahedral. These geometrical features, as well as the remarkably small B-factors, prompted the suggestion that these water molecules might actually be hydronium (H3O+) ions (Gilliland et al., 1990; Baker, 1995). If this is correct, then we must also entertain this possibility for the carboxyl-coordinating water molecule in the cryostructures of the PHS/V66E and PHS/V66D mutants, which have a similar coordination geometry. In regard to the MRD measurements, a buried hydronium ion would make a similar contribution as a buried water molecule. To transform the neutral hydrogen-bonded pair COOH⋯OH2 into the charge-separated pair COO−⋯+HOH2 requires a proton translocation by merely a few tenths of an Ångström. A short symmetric hydrogen bond could be stabilized by resonance between these two structures, but only if the pKa values of the two hydrogen-bond donors are matched (Perrin, 1994). This is certainly not the case here, the hydronium ion being much more acidic than the carboxyl group (particularly in an apolar environment). We therefore dismiss the possibility that the buried water molecule in any of these structures is a hydronium ion. Also the structure COOH⋯+HOH2 is an implausible alternative to COOH⋯OH2 because of the large self-energy of the buried charge.
The pKa shift of the buried Glu-66 or Lys-66 is determined by the difference between the water → protein transfer free energies of the deprotonated and protonated forms of the ionizable group. For the apolar environment of residue 66 in SNase, both of these terms must be positive, but the dominant term is the one involving the charged form. In a macroscopic dielectric continuum description, this term corresponds to the Born (free) energy. The principal question that we pose here is why the experimentally determined ΔpKa values of Glu-66 and Lys-66 are smaller than predicted theoretically from either macroscopic (García-Moreno et al., 1997; Dwyer et al., 2000) or semimacroscopic (Fitch et al., 2002; Dwyer et al., 2000; Schutz and Warshel, 2001) models. A possible resolution of this problem, suggested by previous crystallographic findings (Dwyer et al., 2000), is that one or more buried water molecules interact favorably with the charged form of the ionizable group. However, all crystal structures discussed so far (Table 1) as well as the solution MRD data obtained at pH 7.0 refer to the uncharged form of the ionizable group and, therefore, do not provide conclusive evidence either for or against the involvement of buried water molecules in the ionization of Glu-66 and Lys-66.
Even if there is no buried water molecule next to the uncharged ionizable group, as indicated by room-temperature crystallography and MRD, one or more water molecules might penetrate the protein once the group is ionized. A simple estimate shows that the attractive interaction between a water molecule and a charged carboxylate or amino group in an apolar environment can easily increase the water occupancy of a preexisting cavity from an unobservably low value to unity. The contribution to ΔpKa from such a water molecule can be regarded as the sum of a favorable interaction term and an unfavorable polarization term, which includes the orientation of the water molecule as well as the transfer of the water molecule from the external solvent to the cavity.
Whether this scenario actually occurs or not can only be decided from data acquired under conditions where Glu-66 and Lys-66 are ionized. This is the case for the MRD data measured at pH 4.5 and 9.5, which demonstrate conclusively that ionization of Glu-66 or Lys-66 does not lead to burial of any long-lived and ordered water molecules in SNase. A water molecule interacting directly with a charged group buried in an apolar environment would almost certainly have a long (>10 ns) residence time and be highly ordered and would thus not have escaped detection by MRD (Fig. 4).
Two mechanisms have been discussed that could enhance the effective local polarizability and thereby reduce the pKa shift: water penetration and local conformational change. The results presented here argue against water penetration, thus leaving ionization-induced reorganization of the protein structure as the dominant mechanism. The MRD data show that all long-lived buried water molecules are conserved at pH 9.5, thus ruling out large-scale conformational changes as a result of ionization of Glu-66. Although the MRD data indicate some structural changes at pH 4.5, these changes are neither localized (since all three MRD parameters are affected) nor produced by ionization of Lys-66 (since similar changes were seen for the Δ+PHS parent protein). However, if ionization of these residues is accompanied by local structural changes, this would not affect the surface hydration parameter, Nα(τα/τbulk–1), significantly, and as long as long-lived hydration sites are neither created nor destroyed, then  and
and  would also be unaffected. The MRD results are thus entirely consistent with a local structural change induced by ionization. More direct evidence for this mechanism has recently emerged from a low-pH crystal structure of the Δ+PHS/V66K mutant, showing that the ionized Lys-66 side chain is highly disordered (D. Karp, M. Stahley, G. Gittis, W. Stites, E. Lattman, and B. García-Moreno, unpublished results).
The dichotomy of water penetration and local conformational change bears some resemblance to the long-standing debate about the relative importance of solvent penetration and local unfolding in the mechanism of amide hydrogen exchange in proteins (Englander and Kallenbach, 1984). However, there is an important difference: here, we are concerned with equilibrium states of the protein, whereas the hydrogen exchange issue hinges on transient intermediates. The present work does not address the mechanism and kinetics of the ionization process. Ionization of a buried COOH group clearly does not involve expulsion of a bare proton, but requires an encounter with a water molecule or a hydroxide ion to which the proton is transferred through a hydrogen bond. Whether this occurs before or after the conformational change remains an open question.
Acknowledgments
This work was supported by grants from the Swedish Research Council (to B.H.) and from the National Institutes of Health (GM-061597) (to B.G.-M.). J. L. S. acknowledges funding support of the Naval Academy Research Council.
References
- Abragam, A. 1961. The Principles of Nuclear Magnetism. Clarendon Press, Oxford.
- Alexandrescu, A. T., W. Jahnke, R. Wiltscheck, and M. J. J. Blommers. 1996. Accretion of structure in staphylococcal nuclease: an 15N NMR relaxation study. J. Mol. Biol. 260:570–587. [DOI] [PubMed] [Google Scholar]
- Antosiewicz, J., J. A. McCammon, and M. K. Gilson. 1996. The determinants of pKas in proteins. Biochemistry. 35:7819–7833. [DOI] [PubMed] [Google Scholar]
- Baker, E. N. 1995. Solvent interactions with proteins as revealed by x-ray crystallographic studies. In Protein-Solvent Interactions. R.B. Gregory, editor. M. Dekker, New York. 143–189.
- Baldisseri, D. M., D. A. Torchia, L. B. Poole, and J. A. Gerit. 1991. Deletion of the Ω-loop in the active site of staphylococcal nuclease. II. Effects on protein structure and dynamics. Biochemistry. 30:3628–3633. [DOI] [PubMed] [Google Scholar]
- Bashford, D., and D. A. Case. 2000. Generalized Born models of macromolecular solvation effects. Annu. Rev. Phys. Chem. 51:129–152. [DOI] [PubMed] [Google Scholar]
- Birktoft, J. J., and D. M. Blow. 1972. Structure of crystalline α-chymotrypsin. V. The atomic structure of tosyl-α-chymotrypsin at 2 Å resolution. J. Mol. Biol. 68:187–240. [DOI] [PubMed] [Google Scholar]
- Brünger, A. T., P. D. Adams, G. M. Clore, W. L. De Lano, P. Gros, R. W. Grosse-Kunstleve, J. S. Jiang, J. Kuszewski, M. Nilges, N. S. Pannu, R. J. Read, L. M. Rice, T. Simonson, and G. L. Warren. 1998. Crystallography and NMR system: a new software suite for macromolecular structure determination. Acta Crystallogr. D. Biol. Crystallogr. 54:905–921. [DOI] [PubMed] [Google Scholar]
- Chen, J., Z. Lu, J. Sakon, and W. E. Stites. 2000. Increasing the thermostability of staphylococcal nuclease: implications for the origin of protein thermostability. J. Mol. Biol. 303:125–130. [DOI] [PubMed] [Google Scholar]
- Davis, M. E., and J. A. McCammon. 1990. Electrostatics in biomolecular structure and dynamics. Chem. Rev. 90:509–521. [Google Scholar]
- Denisov, V. P., and B. Halle. 1995a. Protein hydration dynamics in aqueous solution: a comparison of bovine pancreatic trypsin inhibitor and ubiquitin by oxygen-17 spin relaxation dispersion. J. Mol. Biol. 245:682–697. [DOI] [PubMed] [Google Scholar]
- Denisov, V. P., and B. Halle. 1995b. Hydrogen exchange and protein hydration: the deuteron spin relaxation dispersions of bovine pancreatic trypsin inhibitor and ubiquitin. J. Mol. Biol. 245:698–709. [DOI] [PubMed] [Google Scholar]
- Denisov, V. P., and B. Halle. 1996. Protein hydration dynamics in aqueous solution. Faraday Discuss. 103:227–244. [DOI] [PubMed] [Google Scholar]
- Denisov, V. P., J. Peters, H. D. Hörlein, and B. Halle. 1996. Using buried water molecules to explore the energy landscape of proteins. Nat. Struct. Biol. 3:505–509. [DOI] [PubMed] [Google Scholar]
- Denisov, V. P., K. Venu, J. Peters, H. D. Hörlein, and B. Halle. 1997. Orientational order and entropy of water in protein cavities. J. Phys. Chem. B. 101:9380–9389. [Google Scholar]
- Denisov, V. P., B.-H. Jonsson, and B. Halle. 1998. Hydration of denatured and molten globule proteins. Nat. Struct. Biol. 6:253–260. [DOI] [PubMed] [Google Scholar]
- Dwyer, J. J., A. G. Gittis, D. A. Karp, E. E. Lattman, D. S. Spencer, W. E. Stites, and B. García-Moreno E. 2000. High apparent dielectric constants in the interior of a protein reflect water penetration. Biophys. J. 79:1610–1620. [DOI] [PMC free article] [PubMed] [Google Scholar]
- Englander, S. W., and N. R. Kallenbach. 1984. Hydrogen exchange and structural dynamics of proteins and nucleic acids. Q. Rev. Biophys. 16:521–655. [DOI] [PubMed] [Google Scholar]
- Fitch, C. A., D. A. Karp, K. K. Lee, W. E. Stites, E. E. Lattman, and B. García-Moreno E. 2002. Experimental pKa values of buried residues: analysis with continuum methods and role of water penetration. Biophys. J. 82:3289–3304. [DOI] [PMC free article] [PubMed] [Google Scholar]
- Forsyth, W. R., J. M. Antosiewicz, and A. D. Robertson. 2002. Empirical relationships between protein structure and carboxyl pKa values in proteins. Proteins. 48:388–403. [DOI] [PubMed] [Google Scholar]
- García-Moreno E., B., J. J. Dwyer, A. G. Gittis, E. E. Lattman, D. S. Spencer, and W. E. Stites. 1997. Experimental measurement of the effective dielectric in the hydrophobic core of a protein. Biophys. Chem. 64:211–224. [DOI] [PubMed] [Google Scholar]
- Gilliland, G. L., E. L. Winborne, J. Nachman, and A. Wlodawer. 1990. The three-dimensional structure of recombinant bovine chymosin at 2.3 Å resolution. Proteins. 8:82–101. [DOI] [PubMed] [Google Scholar]
- Halle, B. 1998. Water in biological systems: the NMR picture. In Hydration Processes in Biology. M.-C. Bellisent-Funel, editor. IOS Press, Dordrecht, The Netherlands. 233–249.
- Halle, B. 2004a. Biomolecular cryocrystallography: structural changes during flash-cooling. Proc. Natl. Acad. Sci. USA. 101:4793–4798. [DOI] [PMC free article] [PubMed] [Google Scholar]
- Halle, B. 2004b. Protein hydration dynamics in solution: a critical survey. Philos. Trans. R. Soc. Lond. B Biol. Sci. 359:1207–1224. [DOI] [PMC free article] [PubMed] [Google Scholar]
- Halle, B., V. P. Denisov, and K. Venu. 1999. Multinuclear relaxation dispersion studies of protein hydration. In Biological Magnetic Resonance. N.R. Krishna, and L.J. Berliner, editors. Kluwer Academic/Plenum, New York. 419–484.
- Halle, B., and V. P. Denisov. 2001. Magnetic relaxation dispersion studies of biomolecular solutions. Methods Enzymol. 338:178–201. [DOI] [PubMed] [Google Scholar]
- Halle, B., V. P. Denisov, K. Modig, and M. Davidovic. 2004. Protein conformational transitions as seen from the solvent: magnetic relaxation dispersion studies of water, cosolvent, and denaturant interactions with nonnative proteins. In Handbook of Protein Folding, Vol. I.J. Buchner, and T. Kiefhaber, editors. Wiley-VCH, Weinheim.
- Hill, T. L. 1956. Influence of electrolyte on effective dielectric constants in enzymes, proteins and other molecules. J. Phys. Chem. 60:253–255. [Google Scholar]
- Honig, B., and A. Nicholls. 1995. Classical electrostatics in biology and chemistry. Science. 268:1144–1149. [DOI] [PubMed] [Google Scholar]
- Hynes, T. R., and R. O. Fox. 1991. The crystal structure of staphylococcal nuclease refined at 1.7 Å resolution. Proteins. 10:92–105. [DOI] [PubMed] [Google Scholar]
- Jones, T. A., J.-Y. Zou, S. W. Cowan, and M. Kjeldgaard. 1991. Improved methods for building protein models into electron density maps and the location of errors in these models. Acta Crystallogr. A. 47:110–119. [DOI] [PubMed] [Google Scholar]
- Kay, L. E., D. A. Torchia, and A. Bax. 1989. Backbone dynamics of proteins as studied by 15N inverse detected heteronuclear NMR spectroscopy: application to staphylococcal nuclease. Biochemistry. 28:8972–8979. [DOI] [PubMed] [Google Scholar]
- Kilshtain-Vardi, A., M. Glick, H. M. Greenblatt, A. Goldblum, and G. Shoham. 2003. Refined structure of bovine carboxypeptidase A at 1.25 Å resolution. Acta Crystallogr. D Biol. Crystallogr. 59:323–333. [DOI] [PubMed] [Google Scholar]
- Kriminski, S., M. Kazmierczak, and R. E. Thorne. 2003. Heat transfer from protein crystals: implications for flash-cooling and x-ray beam heating. Acta Crystallogr. D Biol. Crystallogr. 59:697–708. [DOI] [PubMed] [Google Scholar]
- Meyer, E. 1992. Internal water molecules and H-bonding in biological macromolecules: a review of structural features with functional implications. Protein Sci. 1:1543–1562. [DOI] [PMC free article] [PubMed] [Google Scholar]
- Modig, K., E. Liepinsh, G. Otting, and B. Halle. 2004. Dynamics of protein and peptide hydration. J. Am. Chem. Soc. 126:102–114. [DOI] [PubMed] [Google Scholar]
- Nakamura, H. 1996. Roles of electrostatic interactions in proteins. Q. Rev. Biophys. 29:1–90. [DOI] [PubMed] [Google Scholar]
- Nguyen, D. M., R. L. Reynald, A. G. Gittis, and E. E. Lattman. 2004. X-ray and thermodynamic studies of staphylococcal nuclease variants I92E and I92K: insights into polarity of thte protein interior. J. Mol. Biol. 341:565–574. [DOI] [PubMed] [Google Scholar]
- Otwinoski, Z., and W. Minor. 1997. Processing of x-ray diffraction data collected in oscillation mode. Methods Enzymol. 276:307–326. [DOI] [PubMed] [Google Scholar]
- Perrin, C. L. 1994. Symmetries of hydrogen bonds in solution. Science. 266:1665–1668. [DOI] [PubMed] [Google Scholar]
- Pitera, J. W., M. Falta, and W. F. van Gunsteren. 2001. Dielectric properties of proteins from simulation: the effects of solvent, ligands, pH, and temperature. Biophys. J. 80:2546–2555. [DOI] [PMC free article] [PubMed] [Google Scholar]
- Poole, L. B., D. A. Loveys, S. P. Hale, J. A. Gerit, S. M. Stanczyk, and P. H. Bolton. 1991. Deletion of the Ω-loop in the active site of staphylococcal nuclease. 1. Effect on catalysis and stability. Biochemistry. 30:3621–3627. [DOI] [PubMed] [Google Scholar]
- Press, W. H., S. A. Teukolsky, W. T. Vetterling, and B. P. Flannery. 1992. Numerical Recipes in C, 2nd Ed. Cambridge University Press, Cambridge, UK.
- Rees, D. C., M. Lewis, and W. N. Lipscomb. 1983. Refined crystal structure of carboxypeptidase A at 1.54 Å resolution. J. Mol. Biol. 168:367–387. [DOI] [PubMed] [Google Scholar]
- Schellman, J. A. 1953. The application of the Bjerrum ion association theory to the binding of anions by proteins. J. Phys. Chem. 57:472–475. [Google Scholar]
- Schutz, C. N., and A. Warshel. 2001. What are the dielectric “constants” of proteins and how to validate electrostatic models? Proteins. 44:400–417. [DOI] [PubMed] [Google Scholar]
- Shortle, D., and A. K. Meeker. 1986. Mutant forms of staphylococcal nuclease with altered patterns of guanidine hydrochloride and urea denaturation. Proteins. 1:81–89. [DOI] [PubMed] [Google Scholar]
- Shortle, D., W. E. Stites, and A. K. Meeker. 1990. Contributions of the large hydrophobic amino acids to the stability of staphylococcal nuclease. Biochemistry. 29:8033–8041. [DOI] [PubMed] [Google Scholar]
- Shurki, A., M. Strajbl, C. N. Schutz, and A. Warshel. 2004. Electrostatic basis for bioenergetics. Methods Enzymol. 380:52–84. [DOI] [PubMed] [Google Scholar]
- Simonson, T. 2003. Electrostatics and dynamics of proteins. Rep. Prog. Phys. 66:737–787. [Google Scholar]
- Simonson, T., and C. L. Brooks. 1996. Charge screening and the dielectric constant of proteins: insights from molecular dynamics. J. Am. Chem. Soc. 118:8452–8458. [Google Scholar]
- Simonson, T., J. Carlsson, and D. A. Case. 2004. Proton binding to proteins: pKa calculations with explicit and implicit solvent models. J. Am. Chem. Soc. 126:4167–4180. [DOI] [PubMed] [Google Scholar]
- Sternberg, M., F. Hayes, A. Russell, P. Thomas, and A. Fersht. 1987. Prediction of electrostatic effects of engineering of protein charges. Nature. 330:86–88. [DOI] [PubMed] [Google Scholar]
- Stites, W. E., A. G. Gittis, E. E. Lattman, and D. Shortle. 1991. In a staphylococcal nuclease mutant the side chain of a lysine replacing valine 66 is fully buried in the hydrophobic core. J. Mol. Biol. 221:7–14. [DOI] [PubMed] [Google Scholar]
- Tanford, C., and J. G. Kirkwood. 1957. Theory of protein titration curves. General equations for impenetrable spheres. J. Am. Chem. Soc. 79:5333–5339. [Google Scholar]
- Tanford, C., and R. Roxby. 1972. Interpretation of protein titration curves. Application to lysozyme. Biochemistry. 11:2192–2198. [DOI] [PubMed] [Google Scholar]
- Urry, D. W., D. C. Gowda, S. Peng, T. M. Parker, N. Jing, and R. D. Harris. 1994. Nanometric design of extraordinary hydrophobic-induced pKa shifts for aspartic acid: relevance to protein mechanisms. Biopolymers. 34:889–896. [DOI] [PubMed] [Google Scholar]
- Wang, J. F., D. M. Truckses, F. Abildgaard, Z. Dzakula, Z. Zolnai, and J. L. Markley. 1997. Solution structures of staphylococcal nuclease from multidimensional, multinuclear NMR: nuclease-H124L and its ternary complex with Ca2+ and thymidine-3′,5′-biphosphate. J. Biomol. NMR. 10:143–164. [DOI] [PubMed] [Google Scholar]
- Warshel, A. 1981. Calculations of enzymatic reactions: calculations of pKa, proton transfer reactions, and general acid catalysis reactions in enzymes. Biochemistry. 20:3167–3177. [DOI] [PubMed] [Google Scholar]
- Warshel, A., and J. Åqvist. 1991. Electrostatic energy and macromolecular function. Annu. Rev. Biophys. Biophys. Chem. 20:267–298. [DOI] [PubMed] [Google Scholar]