Abstract
Sickle cell disease is caused by a mutant form of hemoglobin, hemoglobin S, that polymerizes under hypoxic conditions. The extent and mechanism of polymerization are thus the subject of many studies of the pathophysiology of the disease and potential treatment strategies. To facilitate such studies, a model system using high concentration phosphate buffer (1.5 M–1.8 M) has been developed. To properly interpret results from studies using this model it is important to understand the similarities and differences in hemoglobin S polymerization in the model compared to polymerization under physiological conditions. In this article, we show that hemoglobin S and normal adult hemoglobin, hemoglobin A, aggregate in high concentration phosphate buffer even when the concentration of hemoglobin is below the solubility defined for polymerization. This phenomenon was not observed using 0.05 M phosphate buffer or in another model system we studied that uses dextran to enhance polymerization. We have used static light scattering, dynamic light scattering, and differential interference contrast microscopy to confirm aggregation of deoxygenated and oxygenated hemoglobins below their solubility and have shown that this aggregation is not observable using turbidity measurements, a common technique for assessing polymerization. We have also shown that the aggregation increases with increasing temperature in the range of 15°–37°C and that it increases as the concentration of phosphate increases. These studies contribute to the working knowledge of how to properly apply studies of hemoglobin S polymerization that are conducted using the high phosphate model.
INTRODUCTION
HbS polymerizes under hypoxic conditions, causing red blood cells to become rigid (Noguchi and Schechter, 1985; Eaton and Hofrichter, 1990). The polymerization of HbS is characterized by its solubility, the concentration of HbS molecules that do not polymerize and remain in the solution phase. The combination of the solution and polymer phase is referred to as a gel. The importance of polymerization in the pathophysiology of sickle cell disease has led to its intense study (Noguchi and Schechter, 1985; Eaton and Hofrichter, 1990) and its understanding in terms of a double nucleation mechanism (Ferrone et al., 1985a,b). The double nucleation mechanism predicts that, as confirmed by DLS (Kam and Hofrichter, 1986), the gel is made of only two phases: HbS tetramers and polymers. No intermediate aggregates are present in equilibrium (Eaton and Hofrichter, 1990; Kam and Hofrichter, 1986).
Further studies on the mechanism of sickle cell hemoglobin polymerization are made difficult by the availability of the sample. Large concentrations of HbS, of the order of 10 mM in heme, are required to induce polymerization under physiological conditions. Direct measurements of solubility require significant volumes. Thus, when trying to evaluate an antisickling agent, sample availability may be limiting. This problem is compounded by the fact that many patients with sickle cell disease undergo chronic transfusion or Hydroxyurea therapy which will dilute the concentrations of HbS in their blood. Moreover, when evaluating the solubility of genetically engineered hemoglobins (including those developed in mouse models) samples are often even more difficult to obtain in large enough quantities. Thus, it is useful to have a model, in vitro system, where the solubility of HbS is lowered.
One model system that is used commonly is that involving high concentration phosphate buffer. In the 1950s Itano observed a large decrease in HbS solubility in concentrated phosphate buffer (Itano, 1953). This model was further developed by Adachi and Asakura in the late seventies and early eighties (Adachi and Asakura, 1978, 1979, 1981, 1982a,b, 1983). These authors showed that in high concentration (1–1.8 M) phosphate buffers, the solubility of HbS could be lowered by ∼3 orders of magnitude (in 1.8 M phosphate) compared to physiological conditions (Adachi and Asakura, 1979). In addition, they showed that HbS polymerizes with a clear delay time (a period in which no polymers are detected that is followed by exponential growth of polymers) indicating that it does so via a similar or identical way as the double nucleation mechanism (Adachi and Asakura, 1978, 1979). Recently, Josephs and colleagues have reported that, based on observations using cryoelectron microscopy, the HbS polymers in 1.5 M phosphate are identical to those in 0.05 M phosphate (Wang et al., 2000). The high phosphate model system has been used by a variety of laboratories (Rao et al., 2000; Yohe et al., 2000; Aroutiounian et al., 2001; Sivaram et al., 2001; Tsai et al., 2001; He and Russel, 2002; Iyamu et al., 2002).
Although many similarities between HbS polymerization in the high phosphate model system and that under more physiologically relevant conditions have been demonstrated, some cautionary notes related to the use of the high phosphate model have also been made (Vedvick et al., 1975; Poillon and Bertles, 1977; Roth et al., 1979; Bookchin et al., 1999; Fabry et al., 2001). These studies demonstrate that, although the high phosphate model provides a convenient way to assess affects on polymerization, caution is needed when applying results from its use to physiology.
In our study, we observe increases in the intensity and angle-dependence of light scattering as well as a decrease in the diffusion coefficient measured by DLS in the high phosphate model system compared to physiological buffer conditions even when the Hb is below the solubility. These observations are contrary to what is observed in more physiologically relevant conditions and can be attributed to an additional phase or species not observed in the physiologically relevant buffer. The additional phase or species appears to be composed of protein aggregates as confirmed by visible light microscopy. In over 20 years of using the high phosphate model, both for clinically relevant studies of HbS polymerization and for biophysical investigations of protein aggregation, this type of aggregation has never been reported before. The presence of more than two phases in the high phosphate model may be indicative of other differences related to the mechanism of polymerization when compared to what happens in vivo. This phenomenon is not noticeable when using turbidity to assess polymerization. It is important to understand any limitations in extending results obtained using the high phosphate model system.
MATERIALS AND METHODS
Preparation of buffers and hemoglobin samples
Normal blood was purchased from the Interstate Blood Bank. Sickle cell blood was obtained from patients with sickle cell anemia. The hemolysate was prepared within 24 h of drawing as described previously (Geraci et al., 1969) and then dialyzed against distilled, deionized water overnight. For most experiments (all but those presented in Fig. 5), the hemoglobin was separated from other red cell proteins components by size exclusion chromatography on a sephacryl TM S-200 column. The samples were kept cold during all preparatory procedures (on ice or at 4°C). Unless otherwise indicated, all chemicals and other supplies were obtained from Sigma (St. Louis, MO).
FIGURE 5.
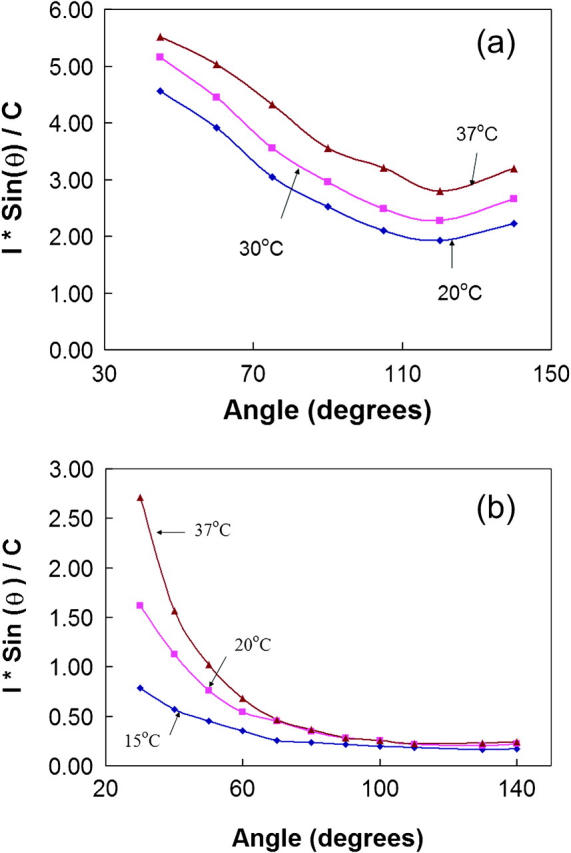
Temperature dependence of SLS from hemoglobin in 1.8 M phosphate buffer. The intensities were normalized by their protein concentrations. (a) HbS at 0.186 mM; (b) HbA at 0.171 mM.
We refer to 1.8 M or 1.5 M potassium phosphate buffer as high concentration phosphate buffer. These were made by dissolving solid monobasic and dibasic potassium phosphate in distilled, deionized water with final pH 7.3. Dextran buffer was prepared by dissolving solid Dextran (average weight, 64–76 kDa) in 0.05 M potassium phosphate buffer yielding a final dextran concentration of 5.1 mM (36 g/dL) with a pH of 7.3.
To make dust-free samples for light scattering experiments, all samples were passed through a 0.2 μm filter (Sigma). Since aggregates may be formed when both hemoglobin A and S are in high phosphate buffer and they would be too large to go through the filter, we did not dialyze Hb against high phosphate buffer. Hb was dialyzed at 4°C in PBS overnight, then mixed with 1.6 M phosphate buffer in a 1:15 volume ratio, yielding a final phosphate buffer concentration 1.5 M. Alternatively, hemoglobin was mixed with 1.9 M phosphate in a 1:18 volume ratio by volume yielding a final buffer concentration 1.8 M.
Unless otherwise indicated, all samples were prepared in equilibrium with room air, so that the Hb was oxygenated. Complete hemoglobin oxygen saturation was confirmed using absorption spectroscopy. For the experiments under deoxygenated conditions, the samples were purged with argon for 30 min, and sodium dithionite was added in 2.5 molar excess to hemoglobin (on a per heme basis). Before adding dithionite, the dithionite sample was placed in a septum-capped bottle and purged with argon for ∼1 h, after which phosphate buffer that had been bubbled with argon was added to make a stock dithionite solution.
For measurements conducted in the dextran containing buffer, the chromatographically pure HbS was concentrated using Centriprep and Centricon concentrating devices (Millipore, Bedford, MA) to ∼2.5 mM. The HbS was then mixed with the dextran containing buffer in a 1:1 ratio by volume through a filter as described above. The final dextran concentration was 18 g/dl and the final HbS concentration was ∼1.25 mM, which is above the solubility of HbS for this concentration of dextran (Bookchin et al., 1999).
Dynamic and static light scattering
A Brookhaven Instruments BI-200AT correlator in conjunction with a BI-200SM light scattering goniometer/photon counting detector (Brookhaven Instruments, Holtsville, NY) and a Spectra Physics 127 He-Ne laser (Spectra Physics, Mountain View, CA) was used to measure scattering intensity and its autocorrelation function from hemoglobin in different buffers. The laser produces a vertically polarized beam with a wavelength of λ = 632.8 nm. The samples, unless otherwise indicated, were in cylindrical cuvettes. All cuvettes were washed at least 10 times by filtered water in a laminar flow hood to make sure they were dust-free. DLS was measured at a scattering angle of 90° and SLS was measured from 40° to 130°. A water bath was used to control the temperature for measurements conducted at other than room temperature. For the measurements of the temperature dependence of the reciprocal of the light scattering intensity and mean particle size of hemoglobin samples that are presented in Figs. 7 and 8, a Zetasizer Nano S instrument (Malvern Instruments, Worcestershire, UK) was used for DLS measurement and scattering intensity was collected at 173° using a laser beam with a wavelength of 632.8 nm. The samples were contained in Quartz Suprasil cuvettes (Hellma USA, Plainview, NY) when they were measured with the Zetasizer Nano S equipment.
FIGURE 7.
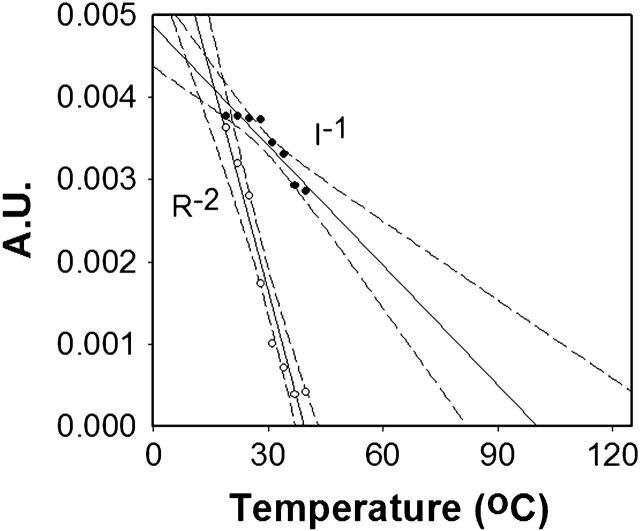
Reciprocal plots. The light scattering intensity, I, and square of radius, R, for a 0.36 mM oxygenated HbS sample in 1.5 M phosphate are plotted as a function of temperature. The dashed lines indicate the confidence intervals at 95% confidence level. The temperature interval for each measurement was 3°C. At each temperature point, we allowed 4 min to reach equilibrium. The light scattering intensity plotted represents the total intensity from both the hemoglobin and the buffer. The attenuation index was fixed at 9 for all measurements points. The y axis has arbitrary units.
FIGURE 8.
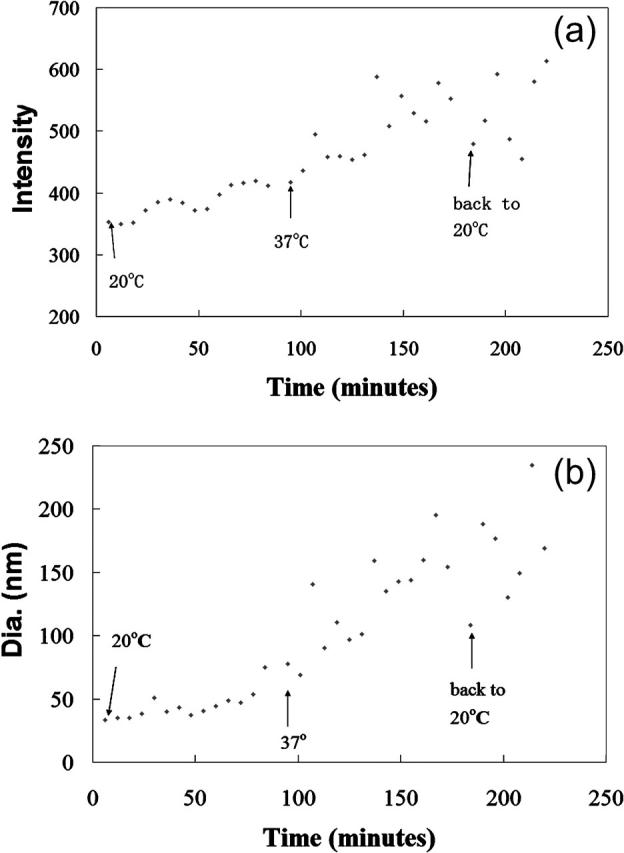
Time dependence of scattering intensity and Z-average diameter of HbS. The data were collected from identical oxygenated HbS samples in 1.5 M phosphate under the same conditions as those for Fig. 7. The samples were measured at 20°C for ∼80 min, temperature-jumped to 37°C and measured for ∼80 min, and then temperature-jumped back to 20°C and measured for ∼40 min The intensity and size information were collected every two minutes and each value shown in both a and b is the average of the values of three observations.
SLS data collected as a function of scattering angle were corrected for the scattering from buffer alone and normalized by the intensity of a benzene standard (R90 8.5 × 10⁻⁶ cm−1; Pike et al., 1975) to obtain Rayleigh ratios (Evans, 1972). The weight-average molecular weight, Mw for each sample was then computed from the reciprocal of the intercept of a plot of Kc/Rθ vs. sin2(θ/2), where c is the concentration, Rθ is the Rayleigh ratio, and K depends on the wavelength of light and properties of the medium (Evans, 1972). Here we used a published value of 0.1942 ml/g for dn/dc for hemoglobin (Huglin, 1972). We also measured the intensity of light scattering from hemoglobin solutions as a function of concentration from 56 μM to 670 μM and found the dependence to be linear up to a concentration of 400 μM (linear correlation coefficient, r = 0.9914 below the highest concentration used in our measurements in high phosphate). Hence, it was not necessary to correct the resultant intercepts for concentration dependence.
DLS data were analyzed by the method of cumulants (Johnson and Gabriel, 1981; Pecora, 1983); to obtain Dtrans, the translational diffusion coefficient, from which particle diameters were calculated by the Stokes-Einstein equation. We took special care to analyze only those samples whose autocorrelation functions were not contaminated by anomalous scattering by dust particles. Thus we only analyzed runs in which the difference between the calculated and experimentally determined baselines of the exponentially decaying autocorrelation functions differed by <1% (Hantgan et al., 1993). When this criterion was met, we used results from second-order cumulants analysis to obtain the sample's Z-average Dtrans (Koppel, 1972; Berne and Pecora, 1990).
Recognizing that Dtrans measurements are inherently sensitive to solvent viscosity, we took care to determine these effects with precision. The relative viscosity of potassium phosphate buffers to water was measured with a Mettler-Toledo DA310M viscometer (Highstown, NJ). We compared the flow time of the buffer, ts, to that of water, tw, to get the relative viscosity of the buffer, η = (ts)(ρs)/(tw)(ρw), where the densities ρs and ρw were measured using a Schott Gerate density meter (Germany). The relative viscosities were 1.85 ± 0.02 and 1.99 ± 0.03 for 1.5 M and 1.8 M phosphate buffers, respectively, at 20°C; and 1.31 ± 0.01 and 1.43 ± 0.01 for 1.5 M and 1.8 M phosphate buffers, respectively, at 37°C. The densities were 1.1895 ± 0.0004 g/ml for the 1.5 M and 1.2084 ± 0.0005 g/ml for the 1.8 M buffer. The viscosities at other temperatures were calculated based on the measured value at 37°C using the trend in the change of the viscosity of water as function of temperature. The difference between the calculated and measured values of 1.5 M phosphate buffer at 20°C was only 3.8%, confirming the validity of our approach to correcting for solvent viscosity effects. The viscosity of the dextran buffer was measured similarly yielding a relative viscosity of 17.3 ± 0.3 at 20°C.
Extinction measurements of deoxygenated HbS
HbS was deoxygenated as described above in 1-cm pathlength square cuvettes and placed in a 0°C ice bath. The extinction of the deoxygenated HbS was measured by scanning the samples between 700 nm and 450 nm on a Perkin Elmer Lambda 9 (Norwalk, CT) spectrometer using a HAAKE K20 water bath (Paramus, NJ) to control the temperature. The samples were temperature jumped from 0°C to 15°C, scanned immediately, and then scanned again after 1.5 h of incubation at this temperature. Measurements were also conducted on samples that were temperature jumped from 0°C to 37°C.
Microscopy measurements
A Nikon E600 microscope with a 100-W tungsten-halogen source, a 60× objective, and DIC optics was used for the microscopy measurements. Hemoglobin samples in high phosphate buffer were held between a microscope slide and a cover slip, using double-sided tape as a spacer with a thickness of ∼0.06 mm. The depth of field was calculated to be ∼30 μm. The concentration of aggregated particles was determined by observing known concentrations of latex spheres with diameter of 1.71 μm (Polysciences, Warrington, PA) in the microscope, counting the spheres in the observation field and comparing their number to that seen in the Hb aggregated sample. We determined the concentration of the latex spheres by counting the number of spheres per unit area using a hemacytometer (Hausser Scientific, Horsham, PA).
RESULTS
Aggregation of oxygenated hemoglobin A and S in high potassium phosphate buffer
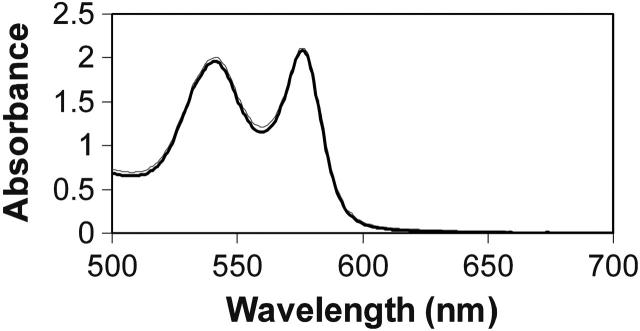
When oxygenated HbS at a concentration of a few hundred micromolar in 1.8 M phosphate buffer is observed using absorption spectroscopy no turbidity can be detected. This is demonstrated in Fig. 1 where the absorption from a 270 μM sample in high concentration phosphate buffers overlays one taken in PBS. However, using SLS, we found that, in all oxygenated preparations, both normal and sickle cell hemoglobin aggregate in high phosphate buffer although no aggregates were observed in PBS. Fig. 2 a shows SLS from hemoglobin A and S in different buffers. The intensities were normalized by their concentrations. The figure shows that there is no significant angular dependence of SLS from HbA in PBS buffer, but those of all hemoglobin samples in high phosphate (1.5 M and 1.8 M) have obvious angular dependences, which indicate aggregates formed in these systems (unless stated otherwise, all samples were oxygenated). Scattering from oxygenated HbS in PBS buffer was also angular-independent up to a concentration of 0.562 mM. Fig. 2 a also shows that light scattering from HbS in 1.8 M buffer was greater than that from HbS in 1.5 M buffer, and these were both stronger than that from the sample in PBS. The normalized scattering intensity at 90° increased by 1.1-, 4.7-, and 7.1-fold, respectively, from HbA in 1.5 M phosphate, HbS in 1.5 M phosphate and HbS in 1.8 M phosphate, compared to that of HbA in PBS. In addition, we observed that HbS scattered ∼1.7-fold more than HbA in the same high phosphate buffer (Fig. 2). The weight-average molecular weights of the aggregated Hb were calculated using Zimm plots such as those shown in Fig. 2 b by extrapolating to zero scattering. These results are summarized in Table 1.
FIGURE 1.
Absorption from oxygenated HbS. The absorption is shown from 500 to 700 nm for an HbS sample in PBS (bold line) and in 1.8 M phosphate buffer. The two spectra mostly overlap demonstrating that both samples are virtually 100% oxygenated. The sample in 1.8 M phosphate was taken in a 0.5 cm pathlength cell and the one in PBS was taken in a 0.2 cm pathlength cell but it is shown multiplied by 2.5 here to compare with the sample in 1.8 M phosphate. The lack of apparent absorption at 700 nm indicates that no turbidity is detected in the sample in 1.8 M phosphate.
FIGURE 2.
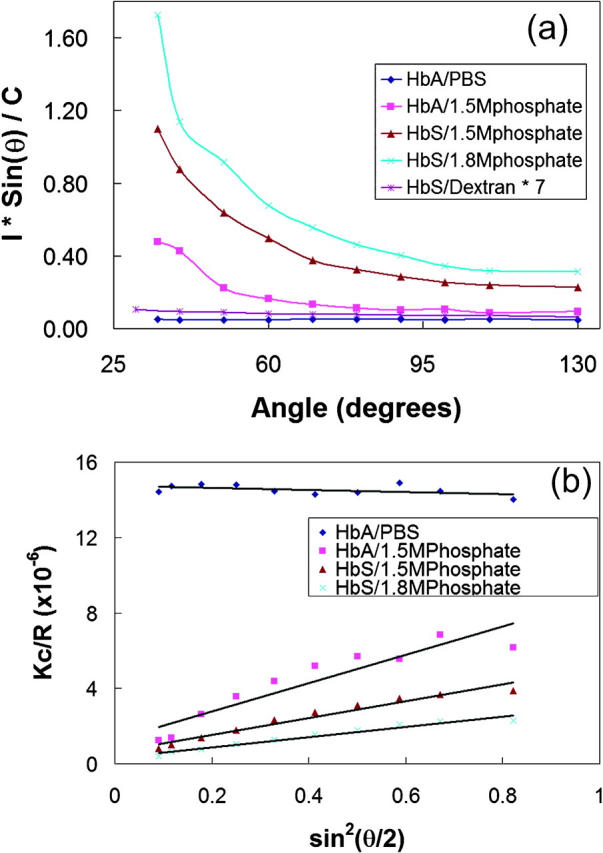
Light scattering from Hb in different buffers. (a) SLS of HbA and HbS as a function of scattering angle. The concentrations of HbA in PBS (⋄), HbA in 1.5 M phosphate (□), HbS in 1.5 M phosphate (Δ), HbS in 1.8 M phosphate (×) and HbS in dextran (intensity multiplied sevenfold, *) were 0.150 mM, 0.129 mM, 0.158 mM, 0.133 mM, and 1.174 mM (heme), respectively. Scattering intensities were normalized by protein concentrations. (b) Zimm plots of the SLS from hemoglobin in different phosphate buffers in Fig. 2 a. Zimm plots show that the molecular weights of hemoglobin in high phosphate are large, but the one of HbA in PBS is in the expected range. The average apparent weight-average molecular weights of hemoglobin in different buffers are summarized in Table 1.
TABLE 1.
SLS apparent average molecular weight and radius of gyration of hemoglobin in different phosphate buffers
| Hb in different buffers | Mw (kDa) | Rg (nm) |
|---|---|---|
| HbA in PBS | 69 ± 4 | — |
| HbA in 1.5 M phosphate | 710 ± 56 | 210 ± 12 |
| HbA in 1.8 M phosphate | 1430 ± 71 | 239 ± 15 |
| HbS in PBS | 70 ± 4 | — |
| HbS in 1.5 M phosphate | 1250 ± 82 | 230 ± 11 |
| HbS in 1.8 M phosphate | 2200 ± 109 | 248 ± 9 |
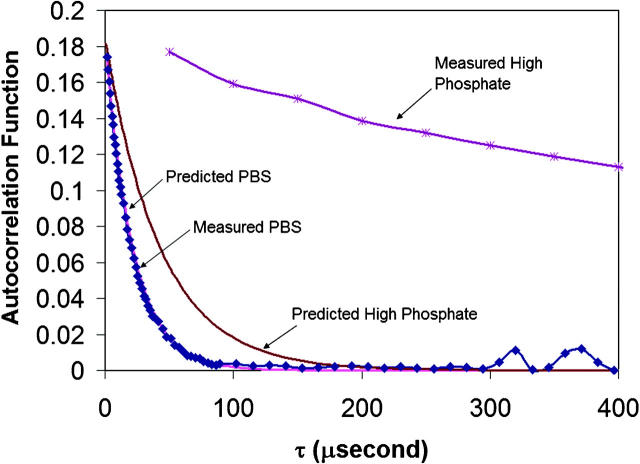
Fig. 3 shows typical DLS autocorrelation functions obtained from DLS of HbS in low phosphate and high phosphate buffers. The sample in high phosphate shows a much slower decay than that in the other buffers, which means that the diffusion coefficient of the molecules in high phosphate is smaller and therefore their effective diameter is larger than those of hemoglobin molecules in low phosphate. Fig. 3 also shows the autocorrelation functions predicted for an Hb tetramer (6.4 nm) in the PBS and high phosphate buffers. That the predicted curve in PBS overlays the measured one confirms that the calculations are valid. The fact that the predicted curve decays much faster than the measured one in high phosphate confirms that the Hb aggregates in that system. The effective diameters of the hemoglobin in different buffers, obtained as described in the methods section, are summarized in Table 2. The diameter of hemoglobin in PBS was ∼6.5 nm (as expected), but those of hemoglobin in high phosphate range from ∼300 nm to 1767 nm (Table 2). The increases in diameter obtained from DLS are also supported by increases in the radius of gyration (Table 1) calculated from slopes of the Zimm plot (Fig. 2 b).
FIGURE 3.
DLS. Reduced first-order autocorrelation functions for HbS in low phosphate (□), and high phosphate (Δ) are shown. The sample concentrations (heme) were 0.562 mM and 0.151 mM, respectively. The time intervals for HbS in low phosphate and high phosphate were 0.8 and 50 μs, respectively, showing the size of the scatterers increases (1.8 M phosphate). Calculated autocorrelation functions are also shown for a hemoglobin tetramer (diameter 6.4 nm) and the viscosities of 1 centipoise in PBS and 1.99 centipoise in high phosphate.
TABLE 2.
Average effective diameter of Hemoglobin A and S in different phosphate buffers from DLS measured at 90°
| Hb in different buffers | D (nm) |
|---|---|
| HbA in PBS | 6.5 ± 0.1 |
| HbA in 1.5 M phosphate | 300 ± 66 |
| HbA in 1.8 M phosphate | 402 ± 33 |
| HbA in 1.8 M phosphate at 37°C | 650 ± 73 |
| HbS in PBS | 6.5 ± 0.1 |
| HbS in 1.5 M phosphate | 540 ± 56 |
| HbS in 1.8 M phosphate | 822 ± 116 |
| HbS in 1.8 M phosphate at 37°C | 1368 ± 305 |
| Deoxy HbS solution in 1.8 M phosphate at 15°C | 1767 ± 170 |
SLS from HbS in dextran buffer was also measured, as shown in Fig. 2 a. Like HbS in low phosphate buffer, the scattering from HbS in dextran had no significant angular dependence, showing that the scatterers in HbS-dextran system were small. We also performed DLS measurements on HbS in dextran buffer but, due to the high viscosity of this medium, feel that the results are only semiquantitative. However, when correcting for the viscosity of dextran buffer we found that the diameter of the scatterers was <6 nm, that for an Hb tetramer. The analysis of the DLS data in Dextran buffer suffer from uncertainties due to using a highly viscous medium but they certainly do not suggest aggregation in this system. Taken together with the SLS data, we can say that we did not find evidence suggesting that Hb aggregates in dextran under oxygenated conditions.
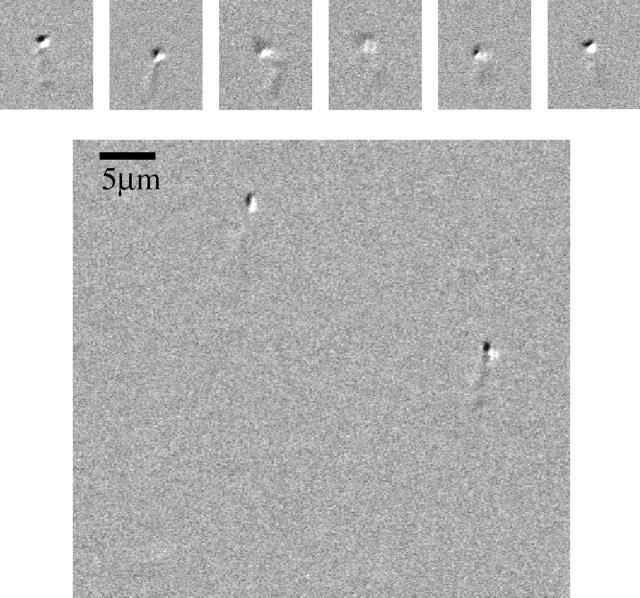
We directly observed Hb aggregates that underwent Brownian motion in 1.8 M phosphate using DIC microscopy (Fig. 4). The size of the particles was estimated to be 0.8 ± 0.1 μm, based on the micrographs. No observable particles were found in Hb samples in PBS buffer or in 1.8 M phosphate buffer with no Hb present. The concentration of the Hb aggregates were estimated to be ∼1.4 × 10⁷ particles per milliliter, indicating that only a small fraction of the Hb was aggregated. Nevertheless, the scattering intensity from an equivalent concentration of 1.7 μm latex spheres was found to be within the range of scattering intensities measured from Hb in 1.8 M phosphate. Thus, the particles observed in microscopy may have been sufficient to account for the observed increased light scattering.
FIGURE 4.
Microscopy of Hb aggregates. The images were taken using DIC microscopy of 0.223 mM oxygenated HbA in 1.8 M phosphate buffer. (Top) A series of images were taken from different frames. The images are not necessarily of the same aggregates. (Bottom) A single image frame showing two aggregates in the field of view.
The fact that there was a low concentration of aggregates formed in the hemoglobin-high phosphate system is supported by DLS analysis from data collected at 173°. Large particles dominate the scattering over small particles less at 173° than at 90°. CONTIN analysis (Pecora, 1983) of DLS measured at 173° showed that in the hemoglobin-high phosphate system there were two major species with different size distributions: one is the hemoglobin tetramer (We use the term hemoglobin tetramer to mean a single, 68 kDa hemoglobin molecule.) and the other is the aggregate. For the sample of oxygenated HbS in 1.5 M phosphate at 25°C, the tetramers species contributed ∼41% of the total intensity whereas the aggregates species contributed ∼58%. As there are two major species, and possibly aggregates with intermediate sizes, that all significantly contribute to the scattering intensity, the weight-average molecular weight and Z-average diameter results in Tables 1 and 2 represent average values and serve as a way to quantify the aggregate information under different conditions.
Temperature dependence of the aggregates
SLS was measured from HbS and HbA at different temperatures in high phosphate buffer (Fig. 5). For the experiments on HbS, light scattering was measured at three temperatures: 20°, 30°, and 37°C. The HbS sample scattered stronger at all measurement angles, increasing by ∼1.17- and 1.40-fold when the temperature was increased from 20°C to 30°C and to 37°C, respectively, at 90°, as shown in Fig. 5 a. The increase in scattering intensities at higher temperature can be attributed to larger aggregates. SLS from HbA in 1.8M phosphate buffer at 15°C, 20°C, and 37°C was also measured and the result (Fig. 5 b) shows that there was also temperature dependence in the formation of HbA aggregates in high phosphate buffer. The temperature dependence of DLS from HbS and HbA in 1.8M phosphate was also studied and the results (summarized in Table 2) show that the size of the aggregates increased by 1.61- and 1.66-fold in going from 20°C to 37°C for HbA and HbS in 1.8 M phosphate, respectively.
Aggregation of HbS in high potassium phosphate buffer under deoxygenated conditions
Our goal was to see if intermediate aggregates form when the concentration of deoxygenated HbS is below the solubility (defined for polymerization). To confirm that no polymerization is detectable when the concentration of HbS is below the solubility, we measured the extinction of these samples (Fig. 6 a). The extinction of a sample at 0°C was the same as that when the sample was temperature jumped from 0°C to 15°C and incubated at this temperature for 1.5 h. As also shown in Fig. 6 a, when the sample was temperature jumped to 37°C the extinction increased significantly indicating the presence of polymers as observed previously (Adachi and Asakura, 1978, 1979, 1981, 1982a,b, 1983).
FIGURE 6.
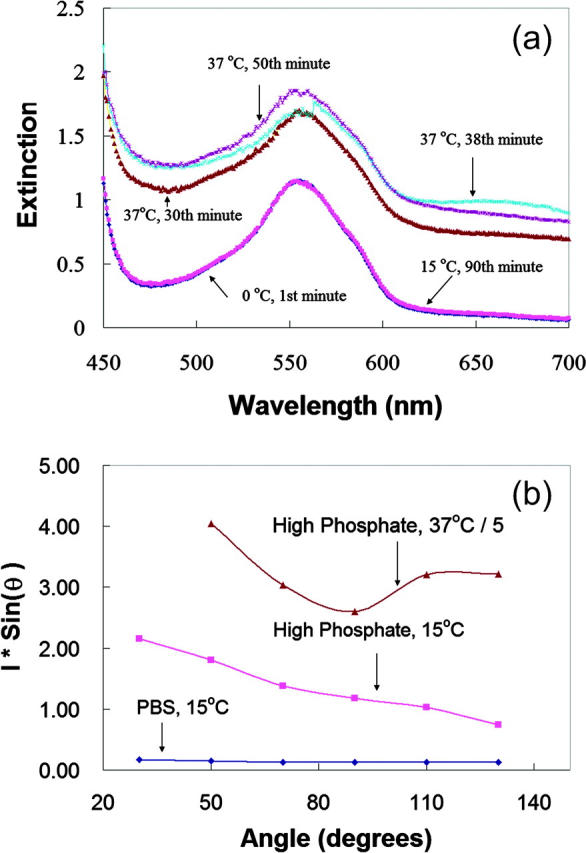
Dexoygenated HbS samples. (a) Extinction (absorbance + turbidity) of deoxygenated HbS samples (0.09 mM) in 1.8 M phosphate. Samples were temperature-jumped from 0°C to 15°C or 37°C and extinction was measured at various times (30 min, 38 min, and 50 min after being jumped to 37°C). The extinction at 0°C and 15°C were exactly same (and overlap each other in the figure), indicating that no HbS polymers formed at 15°C. (b) Angular-dependent light scattering was measured for the deoxygenated HbS samples in 1.8 M phosphate buffer at 15°C (□) and 37°C (intensity divided fivefold, Δ) and in PBS at 15°C (⋄). Polymerization of the sample at 37°C and produced multiple scattering contributing to the oddly-shaped scattering curve.
Both the intensity and angular dependence of light scattering from deoxygenated HbS indicated the presence of aggregates in the HbS sample prepared in 1.8 M phosphate at 15°C (Fig. 6 b). The scattering is compared to an HbS sample with the same concentration in PBS at 15°C and in 1.8 M phosphate at 37°C. DLS from deoxygenated HbS was also measured and the results are summarized in Table 2.
DISCUSSION
We have observed an increase in the angular-dependence and intensity of light scattering from solutions of HbA and HbS in high concentration phosphate buffer compared to low phosphate buffer (PBS). The decays of the autocorrelation function measured using DLS from these solutions were much slower than from solutions in PBS. These observations, coupled with those using DIC microscopy, lead us to conclude that in high concentration phosphate buffers, unlike in physiological buffers, Hb aggregates form even when the concentration of Hb is below the solubility (defined for polymerization). We have observed this phenomenon in oxygenated HbA, oxygenated HbS and deoxygenated HbS. Other observations reported in this manuscript are consistent with previous ones using the high phosphate model to study HbS polymerization (Adachi and Asakura, 1978, 1979, 1981, 1982a,b, 1983). The Hb aggregates do not scatter enough to produce a measurable increase in turbidity (Fig. 6), consistent with the notion that direct measurements of light scattering are more sensitive to aggregation than turbidity (Hantgan, 1984, 1985). This would be especially true in absorbing samples like deoxygenated HbS where even at 700 nm the extinction coefficient is ∼1 mM−1cm−1. The absorbance could mask an increase in extinction due to light scattering so that no increase in turbidity is observed until the sample polymerizes, consistent with our observations (Fig. 6), and previous ones (Adachi and Asakura, 1979, 1981, 1982a,b, 1983).
We found that the intensity and angular dependence of light scattering from the aggregates increased as a function of 1), temperature in going from 15°C to 37°C; 2), phosphate concentration in going from 1.5 M phosphate buffer to 1.8 M buffer; and 3), Hb type, where HbS scattered more and had stronger angular dependence than HbA. These observations are consistent with the temperature and phosphate concentration dependence of CO-ligated horse hemoglobin solubility reported earlier (Green, 1931). The data collected from DLS and changes of radius of gyration indicate that these changes in SLS are (at least partially) due to increases in the size of the aggregates as opposed to the formation of more aggregates. However, further work needs to be done to explore the concentration and size dependence of Hb aggregate formation as a function of temperature, phosphate concentration, and Hb type. Likewise, further study is required to determine if the linear dependence of the intensity of light scattering on Hb concentration that we observed from 56 μM to 670 μM was due to increases in aggregate size or concentration of a particular sized aggregate. The most likely explanation is that the concentration of aggregates increased linearly with Hb concentration (that is heme concentration) since light scattering intensity can be linearly dependent on concentration, but has a nonlinear dependence on the combination of size and molecular weight. In any case, the linear dependence of the intensity of light scattering from these Hb aggregates on heme concentration is in contrast to the dependence of light scattering from polymerizing HbS that shows a very nonlinear dependence due, in part, to the fact that there is a threshold concentration for polymerization.
We suggest that the phenomenon we describe using DLS, SLS, and DIC microscopy are due to Hb aggregates that are likely to be formed from protein that has salted out of the solution. This is consistent with early observations of horse hemoglobin salting out in high phosphate solutions (Green, 1931). Another possibility is that these phenomena are due concentration fluctuations from LLD (Sciortino et al., 1988; Emanuelle et al., 1991; Palma and San Biagio, 1991; San Biagio and Palma, 1992; Galkin et al., 2002; Vaiana et al., 2003). LLD involves the formation of locally high concentrations of protein, and it has been proposed to be involved in the formation of solid protein phases including HbS polymers (Palma and San Biagio, 1991; San Biagio and Palma, 1992; Galkin et al., 2002; Vaiana et al., 2003). Recently, the formation of dense liquid HbS and HbA phases have been observed using DIC microscopy in the presence of polyethylene glycol (PEG) (Galkin et al., 2002). It was found that the threshold temperatures and concentrations for LLD was lowered in high phosphate concentration buffer compared to physiological buffers but no LLD was reported in the absence of PEG (Galkin et al., 2002). The absence of PEG in our samples suggests that protein aggregates, rather than liquid protein droplets, caused increased light scattering and the other phenomenon reported here.
The temperature dependence of the reciprocal of the light scattering intensity (I) and mean particle size (R) serve as a good way to determine if LLD is involved (Emanuelle et al., 1991; Palma and San Biagio, 1991). If LLD is involved, critical fluctuations result in these curves intersecting zero at the same point. Fig. 7 shows data from an oxygenated HbS sample in 1.5 M phosphate and it is seen that I−1 and R−2 approach zero at two different temperature points. Even the most favorable lines, drawn at the boundary of a 95% confidence level interval, clearly do not intersect. Thus, the data shown in Fig. 7 are not consistent with LLD prediction (Emanuelle et al., 1991; Palma and San Biagio, 1991). Moreover, Fig. 8 shows that the intensity (a) and size (b) of the oxygenated HbS sample in 1.5 M phosphate buffer do not follow the time dependence expected from LLD. When the sample was temperature-jumped from 20°C to 37°C, the scattering intensity and size of aggregates at 37°C were greater than the lower temperature. However, the intensity and size of the aggregates did not exponentially increase at 37°C with the growth of time as predicted by LLD. In addition, LLD should be reversible upon restoration of the temperature to 20°C (Galkin et al., 2002), but (Fig. 7) that is not we observed.
CONCLUSIONS
In this article, we have shown that, unlike under physiological conditions, HbS and HbA in high concentration phosphate buffer aggregate, even when their concentrations are below the solubility (defined for polymerization). Although further work will be needed to tell whether the particles that we have observed have any ordered structure, our data collected using DIC microscopy (Fig. 4) and the fact that they do not dissolve upon lowering the temperature (Fig. 8) indicates that they are probably amorphous. This phenomenon was not observed in another model system using dextran.
Our recent observations, combined with earlier reports (Vedvick et al., 1975; Poillon and Bertles, 1977; Roth et al., 1979; Bookchin et al., 1999; Yohe et al., 2000; Fabry et al., 2001), suggest that certain precautions be taken when using the high phosphate model. Although in our system, we did not observe increases in turbidity due to protein aggregation, these aggregates may produce measurable turbidity in some spectrometers or conditions since the measured turbidity depends on the solid angle measured by the detector and on the intensity and angular dependence of scattered light from the aggregates. When light scattering is employed, the phenomenon can be observed. Thus, care must be taken to ensure that one is observing polymerization rather than the type of aggregation discovered here, when using the high phosphate model. In addition, the presence of the type of aggregates observed here in the high phosphate model, may (in principle) affect the kinetics of polymerization. Our results suggest that these aggregates do not form when dextran buffer is used. However, significantly more protein is required to study HbS polymerization in dextran buffer than in high phosphate buffer (Bookchin et al., 1999). So the choice on which to use will depend partially on the availability of protein. Generally, results from experiments such as those on the effects of new mutant or modified hemoglobins on HbS polymerization that are conducted in the high phosphate model should be checked using physiological conditions.
Acknowledgments
We thank Drs. George Holzwarth, Frank Ferrone, and Leslie Poole for technical assistance and helpful discussions.
This work was supported by National Institutes of Health grant No. HL58091 (D.B.K.-S). Additional support was obtained from the Comprehensive Sickle Cell Center Program of the Commonwealth of Pennsylvania (S.K.B.).
Abbreviations used: HbS, sickle hemoglobin; DLS, dynamic light scattering; SLS, static light scattering; D, the diffusion coefficient; θ, the scattering angle; ρ, the density; λ, wavelength; DIC, differential interference contrast; HbA, normal adult hemoglobin; PBS, phosphate buffered saline; LLD, liquid-liquid demixing.
References
- Adachi, K., and T. Asakura. 1978. Demonstration of a delay time during aggregation of diluted solutions of deoxyhemoglobin S and hemoglobin Charlem in concentrated phosphate buffer. J. Biol. Chem. 253:6641–6643. [PubMed] [Google Scholar]
- Adachi, K., and T. Asakura. 1979. Nucleation-controlled aggregation of deoxyhemoglobin-S—possible difference in the size of nuclei in different phosphate concentrations. J. Biol. Chem. 254:7765–7771. [PubMed] [Google Scholar]
- Adachi, K., and T. Asakura. 1981. Aggregation and crystallization of hemoglobin-A, hemoglobin-S, and hemoglobin-C—probable formation of different nuclei for gelation and crystallization. J. Biol. Chem. 256:1824–1830. [PubMed] [Google Scholar]
- Adachi, K., and T. Asakura. 1982a. Effect of liganded hemoglobin-S and hemoglobin-A on the aggregation of deoxy-hemoglobin-S. J. Biol. Chem. 257:5738–5744. [PubMed] [Google Scholar]
- Adachi, K., and T. Asakura. 1982b. Kinetics of the polymerization of hemoglobin in high and low phosphate buffers. Blood Cells. 8:213–224. [PubMed] [Google Scholar]
- Adachi, K., and T. Asakura. 1983. Multiple nature of polymers of deoxyhemoglobin-S prepared by different methods. J. Biol. Chem. 258:3045–3050. [PubMed] [Google Scholar]
- Aroutiounian, S. Kh., J. G. Louderback, S. K. Ballas, and D. B. Kim-Shapiro. 2001. Evidence for carbon monoxide binding to sickle cell polymers during melting. Biophys. Chem. 91:167–181. [DOI] [PubMed] [Google Scholar]
- Berne, B. J., and R. Pecora. 1990. Dynamic Light Scattering With Applications to Chemistry, Biology, and Physics. R.E. Kreiger, Melbourne, FL.
- Bookchin, R. M., T. Balzas, Z. Wang, R. Josephs, and V. L. Lew. 1999. Polymer structure and solubility of deoxyhemoglobin S in the presence of high concentrations of volume-excluding 70-kDa dextran—effects of non-S hemoglobins and inhibitors. J. Biol. Chem. 274:6689–6697. [DOI] [PubMed] [Google Scholar]
- Eaton, W. A., and J. Hofrichter. 1990. Sickle cell hemoglobin polymerization. Adv. Protein Chem. 40:63–279. [DOI] [PubMed] [Google Scholar]
- Emanuelle, A., L. Di Stefano, D. Giacomazza, M. Trapanese, M. B. Palma-Vittorelli, and M. U. Palma. 1991. Time-resolved study of network self-organization from a biopolymeric solution. Biopolymers. 31:859–868. [Google Scholar]
- Evans, J. M. 1972. Manipulation of light scattering data. In Light Scattering From Polymer Solutions. M. B. Huglin, editor. Academic Press, London and New York. 89–162.
- Fabry, M. E., L. Desrosiers, and S. M. Suzuka. 2001. Direct intracellular measurement of deoxygenated hemoglobin S solubility. Blood. 98:883–884. [DOI] [PubMed] [Google Scholar]
- Ferrone, F. A., J. Hofrichter, and W. A. Eaton. 1985a. Kinetics of sickle hemoglobin polymerization. I. Studies Using Temperature-jump and Laser Photolysis Techniques. J. Mol. Biol. 183:591–610. [DOI] [PubMed] [Google Scholar]
- Ferrone, F. A., J. Hofrichter, and W. A. Eaton. 1985b. Kinetics of sickle hemoglobin polymerization. II. A double nucleation mechanism. J. Mol. Biol. 183:611–631. [DOI] [PubMed] [Google Scholar]
- Galkin, O., K. Chen, R. L. Nagel, R. E. Hirsch, and P. G. Vekilov. 2002. Liquid-liquid separation in solutions of normal and sickle cell hemoglobin. Proc. Natl. Acad. Sci. USA. 99:8479–8483. [DOI] [PMC free article] [PubMed] [Google Scholar]
- Geraci, G., L. J. Parkhurst, and Q. H. Gibson. 1969. Preparation and properties of α- and β-chains from human hemoglobin. J. Biol. Chem. 17:4664–4667. [PubMed] [Google Scholar]
- Green, A. A. 1931. Studies in the physical chemistry of the proteins. VIII. The solubility of hemoglobin in concentrated salt solutions. A study of the salting out of proteins. J. Biol. Chem. 93:495–516. [Google Scholar]
- Hantgan, R. R. 1984. A study of the kinetics of ADP-triggered platelet shape change. Blood. 64:896–906. [PubMed] [Google Scholar]
- Hantgan, R. R. 1985. A study of the kinetics and mechanism of ADP-triggered platelet-aggregation. Biochim. Biophys. Acta. 846:64–75. [DOI] [PubMed] [Google Scholar]
- Hantgan, R. R., J. V. Braaten, and M. Rocco. 1993. Dynamic light scattering studies of αIIbβ3 solution conformation. Biochemistry. 32:3935–3941. [DOI] [PubMed] [Google Scholar]
- He, Z. N., and J. E. Russel. 2002. A human embryonic hemoglobin inhibits Hb S polymerization in vitro and restores a normal phenotype to mouse models of sickle cell disease. Proc. Natl. Acad. Sci. USA. 99:10635–10640. [DOI] [PMC free article] [PubMed] [Google Scholar]
- Huglin, M. B. 1972. Light Scattering from Polymer Solutions. Academic Press, New York, NY.
- Itano, H. A. 1953. Solubilities of naturally occurring mixtures of human hemoglobin. Arch. Biochem. Biophys. 47:148–159. [DOI] [PubMed] [Google Scholar]
- Iyamu, E. W., E. A. Turner, and T. Asakura. 2002. In vitro effects of NIPRISAN (Nix-0699): a naturally occurring, potent antisickling agent. Br. J. Haematol. 118:337–343. [DOI] [PubMed] [Google Scholar]
- Johnson, C. S., and D. A. Gabriel. 1981. Laser light scattering. In Spectroscopy in Biochemistry. J. E. Bell, editor. CRC Press, Boca Raton, Fl. 177–272.
- Kam, Z., and J. Hofrichter. 1986. Quasi-elastic laser light scattering from solutions and gels of hemoglobin S. Biophys. J. 50:1015–1020. [DOI] [PMC free article] [PubMed] [Google Scholar]
- Koppel, D. E. 1972. Analysis of macromolecular polydispersity in intensity correlation spectroscopy: the method of cumulants. J. Chem. Phys. 57:4814–4820. [Google Scholar]
- Noguchi, C. T., and A. N. Schechter. 1985. Sickle hemoglobin polymerization in solution and in cells. Annu. Rev. Biophys. Biophys. Chem. 14:239–263. [DOI] [PubMed] [Google Scholar]
- Palma, M. U., and P. L. San Biagio. 1991. Spinodal lines and flory-huggins free-energies for solutions of human hemoglobins HbS and HbA. Biophys. J. 60:508–512. [DOI] [PMC free article] [PubMed] [Google Scholar]
- Pecora, R. 1983. Quasi-elastic light scattering of macromolecules and particles in solution and suspension. In Measurement of Suspended Particles by Quasi-Elastic Light Scattering. B. A. Dahneke, editor. John Wiley, New York.
- Pike, E. R., W. R. M. Pomeroy, and J. M. Vaughan. 1975. Measurement of Rayleigh ratio for several pure liquids using a laser and monitored photon-counting. J. Chem. Phys. 72:3188–3192. [Google Scholar]
- Poillon, W. M., and J. F. Bertles. 1977. Effects of ethanol and 3,4,-Dihydro-2,2-Dimethyl-2H–1-Benzopyran-6-Butyric acid on solubility of sickle hemoglobin. Biochem. Biophys. Res. Commun. 75:636–642. [DOI] [PubMed] [Google Scholar]
- Rao, M. J., A. Malavalli, B. N. Manjula, R. Kumar, M. Prabhakaran, D. Philip Sun, N. T. Ho, C. Ho, R. L. Nagel, and A. S. Acharya. 2000. Interspecies hybrid HbS: Complete neutralization of Val6(beta)-dependent polymerization of human beta-chain by pig alpha-chains. J. Mol. Biol. 300:1389–1406. [DOI] [PubMed] [Google Scholar]
- Roth, E. F., R. M. Bookchin, and R. L. Nagel. 1979. Deoxyhemoglobin S gelation and insolubility at high ionic-strength are distinct phenomena. J. Lab. Clin. Med. 93:867–871. [PubMed] [Google Scholar]
- San Biagio, P. L., and M. U. Palma. 1992. Solvent-induced forces and fluctuations: a novel comparison of human hemoglobin S and A. Comments Theoret. Biol. 2:453–470. [Google Scholar]
- Sciortino, F., K. U. Prasad, D. W. Urry, and M. U. Palma. 1988. Spontaneous concentration fluctuations initiate bioelastogenesis. Chem. Phys. Lett. 153:557–559. [Google Scholar]
- Sivaram, M. V. S., R. Sudha, and R. P. Roy. 2001. A role for the alpha 113 (GH1) amino acid residue in the polymerization of sickle hemoglobin – evaluation of its inhibitory strength and interaction linkage with two fiber contact sites (alpha 16/23) located in the AB region of the alpha-chain. J. Biol. Chem. 276:18209–18215. [DOI] [PubMed] [Google Scholar]
- Tsai, C. H., S. C. Larson, T. J. Shen, N. T. Ho, G. W. Fisher, M. F. Tam, and C. Ho. 2001. Probing the importance of the amino-terminal sequence of the beta- and gamma-chains to the properties of normal adult and fetal hemoglobins. Biochemistry 40:12169–12177. [DOI] [PubMed] [Google Scholar]
- Vaiana, S. M., M. B. Palma-Vittorelli, and M. U. Palma. 2003. Time scale of protein aggregation dictated by liquid-liquid demixing. Proteins. 51:147–153. [DOI] [PubMed] [Google Scholar]
- Vedvick, T. S., H. M. Konenig, and H. A. Itano. 1975. Deoxyhemoglobin-S — solubility vs erythrocyte sickling. Clin. Biochem. 88:288–290. [DOI] [PubMed] [Google Scholar]
- Wang, Z., G. Kishchenko, Y. Chen, and R. Josephs. 2000. Polymerization of deoxy-sickle cell hemoglobin in high-phosphate buffer. J. Struct. Biol. 131:197–209. [DOI] [PubMed] [Google Scholar]
- Yohe, M. E., K. M. Sheffield, and I. Mukerj. 2000. Solubility of fluoromethemoglobin S: effect of phosphate and temperature of polymerization. Biophys. J. 78:3218–3226. [DOI] [PMC free article] [PubMed] [Google Scholar]


