Abstract
It is known from ensemble spectroscopy at cryogenic temperatures that variants of the Aequorea green fluorescent protein (GFP) occur in interconvertible spectroscopically distinct forms which are obscured in ensemble room temperature spectroscopy. By analyzing the fluorescence of the GFP variants EYFP and EGFP by spectrally resolved single-molecule spectroscopy we were able to observe spectroscopically different forms of the proteins and to dynamically monitor transitions between these forms at room temperature. In addition to the predominant EYFP B-form we have observed the blue-shifted I-form thus far only seen at cryogenic temperatures and have followed transitions between these forms. Further we have identified for EYFP and for EGFP three more, so far unknown, forms with red-shifted fluorescence. Transitions between the predominant forms and the red-shifted forms show a dark time which indicates the existence of a nonfluorescent intermediate. The spectral position of the newly-identified red-shifted forms and their formation via a nonfluorescent intermediate hint that these states may account for the possible photoactivation observed in bulk experiments. The comparison of the single-protein spectra of the red-shifted EYFP and EGFP forms with single-molecule fluorescence spectra of DsRed suggest that these new forms possibly originate from an extended chromophoric π-system analogous to the DsRed chromophore.
INTRODUCTION
The discovery, further development, and application of fluorescent proteins as tools for visualizing biological processes have had a tremendous impact on cell, molecular, and developmental biology. The palette of fluorescent proteins has been considerably expanded since the original discovery of the green fluorescent protein (GFP) from the jellyfish Aequorea victoria, both by mutagenesis of this protein and by discovery of similar fluorescent proteins from other species, to include proteins fluorescing from the blue to far red (Tsien 1998; Matz et al., 1999; Labas et al., 2002; Wiedenmann et al., 2002). Fluorescent proteins (FPs) exhibit a remarkable photophysical versatility that has been studied extensively by ensemble and single-molecule spectroscopy techniques (Chattoraj et al., 1996; Lossau et al., 1996; Dickson et al., 1997; Striker et al., 1999; Garcia-Parajo et al., 2000; Heikal et al., 2000; Volkmer et al., 2000; Cotlet et al., 2001; Malvezzi-Campeggi et al., 2001; Blum et al., 2002; Winkler et al., 2002). The intrinsic complexity of these molecules complicates the ability to accurately and quantitatively interpret data using FPs as reporters and sensors of the cellular environment and of molecular processes in cells.
Fluorescent proteins exhibit intrinsic fluorescence dynamics generally involving distinct photophysical states of the chromophore that reflect changes in solution conditions, chromophore environment, and subtle structural variations of the protein matrix. Creemers et al. have demonstrated the existence of three spectroscopically different, interconvertible forms for a number of Aequorea GFP variants at cryogenic temperatures (Creemers et al., 1999, 2000, 2002). These forms are the A-form with neutral chromophore, the B-form with deprotonated, anionic chromophore, and an I-form with anionic chromophore which is an intermediate involved in an excited state proton transfer between the A- and the B-forms. The B-form is the predominant form in the enhanced yellow fluorescent protein (EYFP), whereas the I-form is the main species in the S65T variant, closely related to the enhanced green fluorescent protein (EGFP) analyzed here. Although these cryogenic experiments have established some limits on the heights of the energy barriers between the various forms, the details of these barriers are not fully known.
For EYFP, Creemers et al. were also able to prove transitions from the B- to the I-form and from the I-form to the A-form, which is not excited with wavelengths typically used to analyze the predominant EYFP B-form. This transition from the B-form via the I-form to the A-form was suggested as a possible origin of the dark times of EYFP observed at the single-molecule level. In recent work, the switching of FPs between dark and fluorescent states has been attributed to a cis-trans conformational change which removes an effective quenching reaction, a mechanism suggested to explain the irreversible photoconversion from the nonfluorescent to a stable bright-red fluorescent form (“kindling”) of the chromoprotein asCP (Chudakov et al., 2003).
The spectral diversity of the fluorescent proteins is further illustrated by the possibility to photoactivate GFP variants by irradiation with blue light to exhibit red-shifted fluorescence (Elowitz et al., 1997). So far the mechanism and origin of this photoactivated red fluorescence is unknown.
We have used spectrally resolved single-molecule spectroscopy to gain further insight into the diversity of, and transition dynamics between, different photophysical forms of the fluorescent proteins. With these methods, we are able to discriminate the spectrally distinct forms which would otherwise be obscured by bulk averaging.
MATERIALS AND METHODS
The enhanced green fluorescent protein (EGFP: F64L, S65T) and enhanced yellow fluorescent protein (EYFP: S65G, V68L, S72A, T203Y) plasmids for bacterial expression were a gift of Prof. David Piston (Vanderbilt University, Nashville, TN). The coding sequence of EGFP and EYFP were inserted into the pRSETa vector (Invitrogen, Carlsbad, CA), thereby adding six histidines to its amino terminus (6His-tag). The expression of 6 His-tagged EGFP or EYFP in Escherichia coli BL21(DE3) cells was induced by 1 mM isopropyl-beta-D-thiogalactopyranoside (IPTG) overnight. To purify EGFP or EYFP the clarified cell lysate was adsorbed on Nickel-NTA agarose overnight at 4°C, and the protein was eluted with 250 mM imidazole. The eluted fractions were dialyzed overnight against 100 mM Tris buffer, pH 8.5, containing 100 mM NaCl, and lyophilized for storage.
The single-molecule studies were performed with a classical scanning stage confocal fluorescence microscopy set up for optical single-molecule detection and spectroscopy (for details see Blum et al., 2001). A single mode argon-ion laser served as light source for excitation at 488 nm and 514 nm. The excitation intensity was stabilized by a feedback control loop and was in the order of 0.5 kW/cm2, well below the fluorescence saturation intensity of EYFP and EGFP (Harms et al., 2001).
The collected fluorescence light was separated from scattered excitation light by an appropriate holographic notch filter (Kaiser Optical Systems, Ann Arbor, MI). When exciting with 514 nm the effect of the absorption of the holographic notch filter can be seen up to ∼530 nm. Spectra with emission below 530 nm are cut off at the blue end of the spectrum. We thus used only spectra with a maximum redder than 540 nm when determining statistics concerning fluorescence maximum positions for excitation at 514 nm.
Sample preparation of the FPs was accomplished by preparing a dilution series in 100 mM Na cacodylate buffer, pH 7.5. The diluted solution was finally mixed with a solution of 2 g Polyvinylalcohol (“PVA”, Mowiol 40-88, Hoechst, Frankfurt Main, Germany) in 100 ml cacodylate buffer. The FP/PVA solution was then spincoated onto a microscopy cover slide and dried under ambient conditions.
Great care was taken to assure that the prepared samples were free of fluorescing contaminations. The buffer and PVA solutions were first irradiated with intense white light and subsequently with 5W of laser light from an argon-ion laser operating in “all lines” mode to bleach any fluorescing contaminants in the solutions. Sample preparation was carried out under a cleanroom laminar flow bench. The microscopy cover slides used as substrate were kept under sulphuric acid, rinsed first with triple-distilled water immediately before sample preparation, and then with methanol (Merck, Uvasol, Darmstadt, Germany) before drying.
The absence of fluorescing impurities in the buffer, the PVA, and the cover slides was verified by preparing negative control samples of buffer and PVA matrix alone on cover slides treated as above.
All single-molecule experiments were carried out at room temperature and at ambient conditions. Fluorescence intensity images were obtained by raster scanning the sample and detecting the emission intensity with an avalanche photo diode (SPCM 200, EG&G, Gaithersburg, MD). From these images distinct fluorescence spots were selected for spectrally resolved investigations. Fluorescence spectra were acquired by a spectrometer (SpectraPro 300i, Acton Research, Acton, MA) and a liquid nitrogen cooled CCD camera (LN/CCD-100PB, Princeton Instruments, Trenton, NJ). We recorded spectral sequences as a rapid succession of single-molecule fluorescence spectra until final bleaching of the molecule. The acquisition time per spectrum was 1 s, with a dead time lag between succeeding spectra of <25 ms. A background spectrum, recorded in the absence of sample but with all other conditions being the same, was subtracted from each spectrum.
To determine the maximum intensity and peak position of each fluorescence spectrum systematically and with high accuracy, a double Gaussian curve was fitted to each raw single-molecule spectrum. A double Gaussian curve is the minimum required for a good fit to the simple vibronic progression of the FP emission spectra, whereas more components overfit the spectra.
RESULTS AND DISCUSSION
The predominant B-form and the blue-shifted I-form of EYFP
Since it is not possible to efficiently excite all EYFP forms with one excitation wavelength, we decided on excitation with 488 nm because this wavelength excites the predominant B-form as well as the intermediate I-form. The A-form with neutral chromophore is not excited above 440 nm, and thus under these conditions, the A-form behaves as a “dark” state.
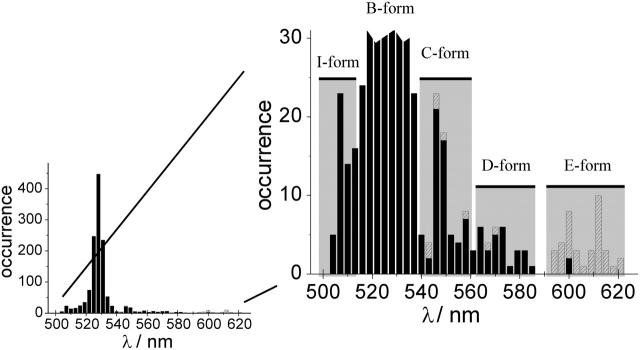
With 488 nm excitation at room temperature, we recorded fluorescence spectra of 400 single EYFP molecules yielding 1288 single-molecule spectra acquired with a 1 s integration time per spectrum. The fluorescence maxima were determined by fitting a double Gaussian to each spectrum, and the maximum positions were assembled into the histogram presented in Fig. 1. The most probable fluorescence maximum is centered at ∼528 nm, in close accordance with the ensemble fluorescence spectrum. These spectra originate from EYFP molecules in the predominant B-form; an example of single-protein B-form fluorescence is given in Fig. 2 b.
FIGURE 1.
Histogram of the maximum positions of single EYFP protein emission spectra. Black columns, λex = 488 nm; shaded columns, λex = 514 nm and spectra with maximum red shift beyond 540 nm. Left, most spectra have their emission maximum distributed around 528 nm, which is in good accordance with the bulk spectrum. Right, zoomed section of the histogram. Emission maxima outside of the B-form position distribution are clearly visible. The spectral positions of the different forms are indicated by shaded columns in the background. On the blue-shifted side a population of proteins emitting in the I-form with emission maximum below 510 nm can be seen, whereas on the red-shifted side above 540 nm, contributions from the emission of three more, so far unknown forms, are visible.
FIGURE 2.
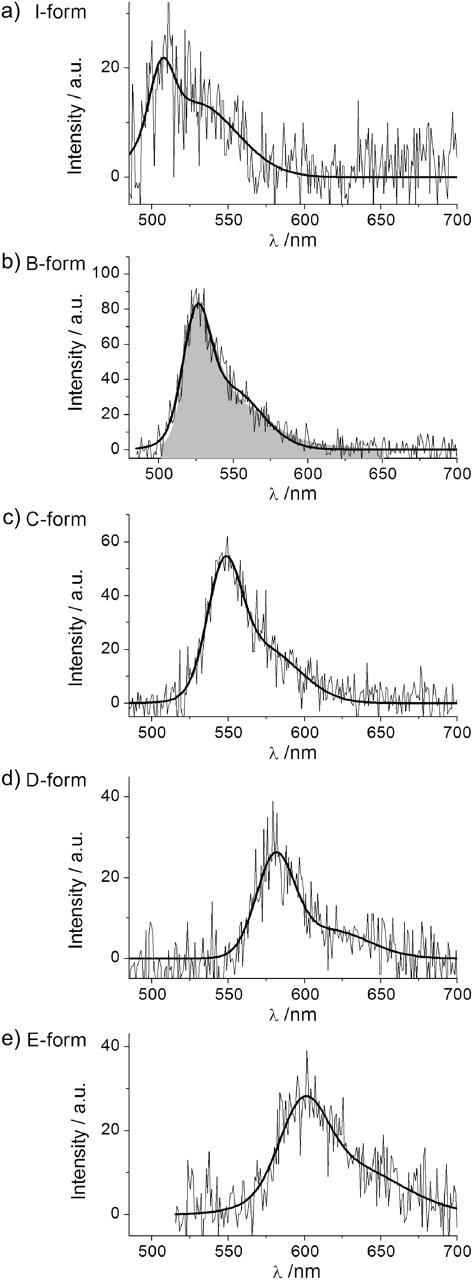
Single-protein emission spectra of the different EYFP forms, (a–d): λex = 488 nm, (e): λex = 514 nm. In b, the ensemble EYFP fluorescence spectrum is depicted in shaded area.
However, there clearly are secondary fluorescence maxima outside this main distribution. For 488 nm excitation the most clearly visible secondary maximum is centered at ∼508 nm. We associate this distribution with the I-form of EYFP which exhibits fluorescence with maximum below 510 nm (Creemers et al., 2002). An example of isolated I-form fluorescence is presented in Fig. 2 a.
While observing the emission of single EYFPs, we observed 12 single proteins out of a total of 400 (3%) with typical I-form fluorescence, of which 9 (2.3%) exhibited spectral dynamics to or from the predominant B-form fluorescence. In Fig. 3 a spectral sequence demonstrating the transition from the B-form to the I-form is shown. At first the typical EYFP B-form spectrum is visible, followed by a dark time and the appearance of the I-form emission. After this no more fluorescence could be observed. The observed single-molecule spectra reveal that the EYFP I-form, which has so far only been identified at cryogenic temperatures, is populated at room temperature and interconversions to or from the predominant B-form are observable.
FIGURE 3.
Spectral sequence showing the transition from the predominant EYFP B-form to the blue-shifted I-form with a dark time of ∼1 s between the emission of the different forms.
Although the details of the molecular basis of the origin of the EYFP I-form are still unclear, it is known that the red shift of the bulk fluorescence of EYFP compared to EGFP is mainly due to the π-stacking interactions between the amino acid residue of tyrosine introduced at position 203 instead of threonine, and the chromophoric π-system (Wachter et al., 1998). We compared the single-molecule EYFP I-form emission spectra to those of EGFP and found that EYFP I-form spectra and the predominant EGFP spectra are generally undistinguishable (see Fig. 4). We therefore speculate that in the EYFP I-form the π-stacking between the amino acid residue of tyrosine and the chromophoric π-system is disturbed by a conformational change in the chromophore surrounding, e.g., by a turn or tilt of the phenolic group of the tyrosine residue. This interruption of π-stacking interactions could result in the blue-shifted I-form spectra.
FIGURE 4.
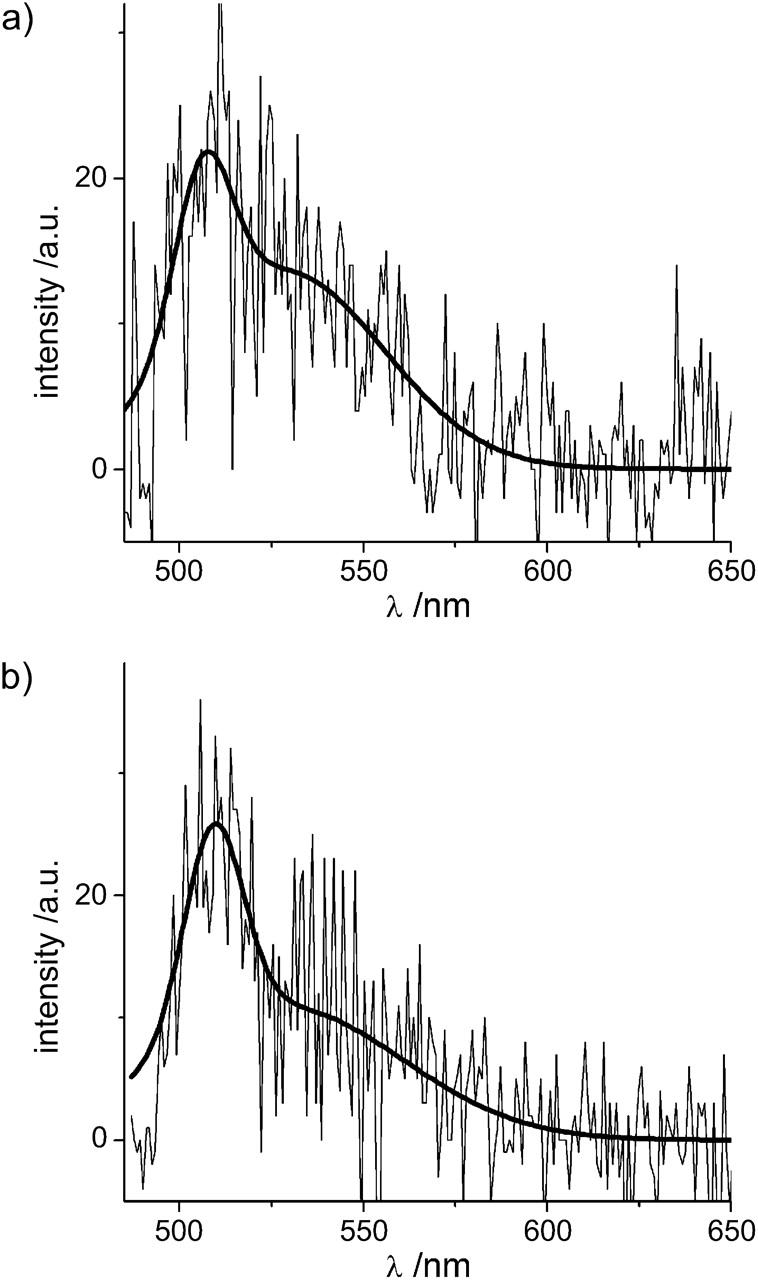
Single-molecule EYFP I-form emission spectra (a) and the predominant EGFP spectra (b) are generally indistinguishable.
It has been supposed that some of the observed long-lived dark periods of EYFP are due to the change of the protein into the A-form with neutral chromophore which is not excited at 488 nm (Creemers et al., 2002). As we were able to demonstrate that both the predominant B-form and the I-form are populated and stable enough to be detected by single-molecule spectroscopy at room temperature, indications for transitions to the A-form should be observable. As the I-form is the intermediate form between the A- and the B-form (Creemers et al., 2002), transitions between these forms should be observed as changes from B-form to I-form fluorescence to a nonfluorescent state (as the A-form is not excited in our chosen setup). When the fluorescence recurs the inverse behavior should be observed, that is, the change from a dark-state to B-form fluorescence should proceed via the I-form emission.
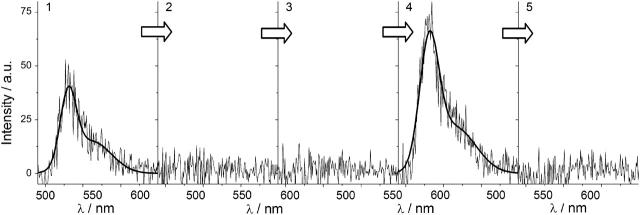
Overall, only nine molecules (2.3%) of all the analyzed proteins showed I-form fluorescence during transitions between B-form fluorescence and a dark state. On the other hand, 78 (19%) of the 400 proteins analyzed showed reversible photobleaching with emission recurring after a dark time of >1 s. Of these reversibly bleached proteins none exhibited I-form fluorescence both before and after a dark period, as would have been expected. Since we were generally able to observe the fluorescence of the I-form of EYFP and only a much smaller fraction of proteins showing reversible bleaching exhibited I-form fluorescence before or after a dark time, we conclude that a transition to the A-form does not exclusively account for the observed dark times. Although the A-form was not excited within our setup we believe that transitions from the B-form to the A-form via the I-form are not the dominant mechanism accounting for the dark periods of EYFP that we have observed.
A typical spectral series without any indication for intermediate I-form fluorescence is depicted in Fig. 5 where the fluorescence recurs at the same spectral position after a dark period of ∼2 s. Instead of a change in the chromophore charge, the observed dark periods may originate from a structural change in the chromophore environment resulting in an effective deactivation of the chromophores excited state. In that case the absorption would remain unchanged but the fluorescence would be quenched, e.g., due to a mechanism similar to the cis-trans conformational change suggested to explain the “kindling” of the chromoprotein asCP (Chudakov et al., 2003), which yields a fluorescent state from an otherwise nonfluorescent molecule.
FIGURE 5.
Typical spectral sequence observed for reversible bleaching of EYFP. Before and after the dark period of ∼2 s, the proteins exhibits B-form fluorescence with a maximum at the same spectral position. No sign of I-form fluorescence can be observed.
Red-shifted forms
Besides the emission spectra of the I- and B-forms of EYFP, we further found a number of fluorescence spectra exhibiting a maximum beyond 540 nm (see Fig. 1, also zoomed section), which could not be attributed to any known form of EYFP. We therefore decided on additional experiments exciting EYFP at 514 nm which is likely to more efficiently excite these red-shifted forms. At 514 nm excitation we investigated 270 single EYFPs yielding 957 single-molecule spectra of 1 s each. Spectra with emission maximum above 540 nm were added to the histogram of maximum positions (Fig. 1, shaded columns).
In our investigation, we found a total of 43 single EYFPs (∼6%) that exhibited an emission with a maximum position beyond 540 nm at some time during the observation window. In some cases, the molecules exclusively displayed a red-shifted emission during the entire observation period before bleaching, whereas in others, the individual proteins exhibited spectral dynamics between B-form fluorescence and the red-shifted emission.
The red-shifted spectra do not group into easily distinguishable accumulations of emission maximum positions which would clearly point to different forms. We attribute the spread of the emission maximum positions first to the relatively low number of observed EYFPs emitting in this spectral area. It is clear that more photostable emitters will be overrepresented in the histogram in contrast to fast-bleaching emitters, thus skewing the statistics. Secondly the range of wavelengths sampled by a single molecule in the red-shifted emitting forms is actually exceptionally broad, i.e., we have observed a single EYFP molecule exhibit spectral diffusion of the emission maximum between 585 nm and 565 nm within 5 s (data not shown). Although the maximum positions are not clearly centered on definite wavelengths, some trends are discernible. The observed distribution of single-molecule emission maxima beyond 540 nm can be grouped into three accumulations, each characteristic of one more spectral form of EYFP (see Fig. 1, zoomed section).
We arbitrarily named the three forms as follows: the form with emission maximum approximately at 550 nm is termed “C-form”; the form with emission maximum approximately at 575 nm is termed “D-form”; and the most bathochromically shifted form with its emission maximum at ∼600 nm is denoted “E-form” (for examples of single-molecule spectra of these forms see Fig. 2, c–e).
Altogether, we found 15 single EYFPs with C-form emission (λmax∼550 nm), of which 5 showed spectral transitions between B-form and C-form emission. Further we found 19 single EYFPs exhibiting the characteristic D-form fluorescence (λmax∼575 nm), of which 9 showed transitions to or from the B-form. We also found 9 single EYFPs with E-form fluorescence (λmax∼600 nm), of which 7 showed transitions to or from the predominant B-form.
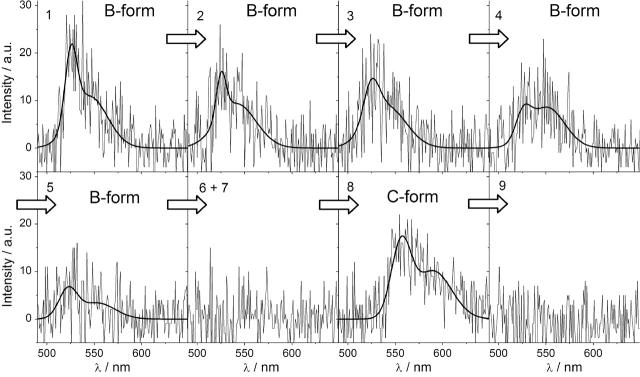
In Fig. 6, a full spectral series showing the transition from the EYFP B-form to the C-form is depicted. During the first five seconds stable B-form emission with maximum at 527 nm with only minor spectral diffusion of ± 1 nm is visible. After that a dark time with no measurable emission of ∼2 s follows, before the C-form fluorescence spectrum with its maximum at 556 nm appears. From the ninth integration interval of 1 s on no more emission is visible. Comparable transitions were observed between the B-form and the D-form as well as between the B-form and the E-form.
FIGURE 6.
Transition from the predominant EYFP B-form to the newly found C-form. For the first 5 s, only B-form emission can be observed, followed by a dark time of ∼2 s before C-form emission appears.
The nature of the transitions between the B-form and the different red-shifted forms shows that in all cases extensive dark times can occur between the disappearance of the B-form emission and the occurrence of the other spectral form, whereas in other cases the possible dark times were shorter than our time resolution of 1 s. For all three different transitions we found a distribution of dark time durations between the appearances of the spectrally different forms. The observation of dark times indicates a two-step process, first to a nonemitting intermediate which then slowly converts into the red-shifted emitting form.
Single-molecule experiments with the GFP variant EGFP showed that the formation of new red-shifted fluorescing forms are not solely characteristic of EYFP. For EGFP we also found three red-shifted forms fluorescing roughly at the same spectral positions and occurring with comparable frequencies (∼7%) as the three red-shifted EYFP forms. As for the EYFP data presented earlier, we observed transitions between the long wavelength forms and the predominant EGFP form, the I-form, with a distribution of dark times between the appearances of the spectral forms. The similarities between the red-shifted EGFP and EYFP forms in respect of spectral position, fraction of proteins showing red-shifted fluorescence, and dark time distribution between the appearance of the different forms, hint to a similar origin of the forms in both variants.
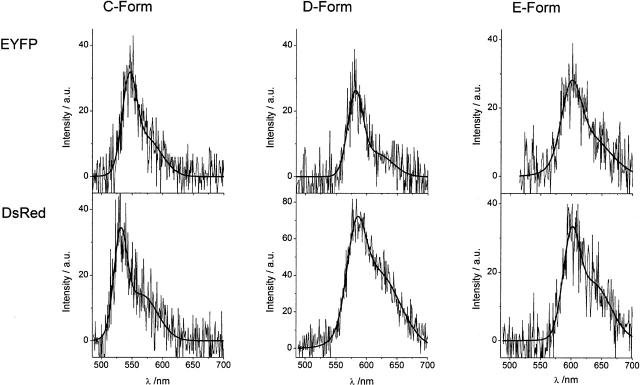
Fluorescence in the spectral area where D- and E-form fluorescence is found is well known from other fluorescent proteins like DsRed (Matz et al., 1999; Wiedenmann et al., 2002). We therefore compared the red-shifted single-molecule EYFP spectra with single-molecule DsRed spectra recorded under comparable conditions, whereupon we found profound similarities. For DsRed we found three emitting forms with emission maximum positions corresponding to the maximum positions of the EYFP C-, D-, and E-form. In Fig. 7, we present EYFP C-, D-, and E-form spectra and their DsRed equivalents. Since we observed only a small number of EYFP C-form and equivalent DsRed spectra we were not able to find as close a correspondence as those observed for the EYFP D- and E-form and their DsRed equivalents. We attribute the differences in the exact spectral position and the shape of the spectra to the intrinsic variability of the individual single-molecule spectra.
FIGURE 7.
Comparison between the emission spectra of the newly identified red-shifted EYFP forms and DsRed single oligomer spectra. The spectra show distinct similarities, whereas differences in the shape and exact position of the spectra are attributed to the individual nature of the proteins. The similarities lead to the conclusion that the red-shifted emission of the EYFP forms is due to an extended chromophoric π-system comparable to the DsRed chromophore.
The EYFP D- and E-form spectra correspond to single-molecule DsRed spectra belonging to distributions of the regular DsRed form dominating the ensemble emission and a light induced “superred” form of DsRed already mentioned in the literature (Cotlet et al., 2001; Malvezzi-Campeggi et al., 2001). In DsRed, a green fluorescing intermediate, with a GFP like chromophore, is initially formed before an additional dehydrogenation within the remnants of Gln66 forms an acylimine extension of the chromophoric π-system resulting in the typical red fluorescence of DsRed (Baird et al., 2000; Gross et al., 2000). In principle an analogous reaction should be possible in EGFP and EYFP. We hence hypothesize that the D- and E-form fluorescence of EYFP and EGFP originates from a DsRed like chromophore, possibly formed from the EYFP or EGFP chromophore by elongating the chromophoric π-system by an acylimine extension in the same manner as the DsRed chromophore matures from the green-emitting to the red-emitting form. Nothing is known yet about the origin of the C-form spectra, especially as the corresponding DsRed form has also not been observed so far.
There are interesting parallels between the red-shifted-emitting forms we have found and the red-shifted emission of photoactivated GFP variants. The possibility to induce red-shifted emission from GFP variants in solution by irradiating the sample with blue light under low oxygen concentrations was discovered by Elowitz et al. in 1997 and used to monitor protein mobility in living cells (Elowitz et al., 1999). This bulk photoactivation of GFP variants leads to the formation of red fluorescence with peaks centered at 600 nm and 590 nm as well as a shoulder at 560 nm. The bulk fluorescence spectrum of photoactivated GFP variants is rather unusual for an ensemble without subensembles because of the two maxima and the shoulder on the short wavelength side of the spectrum. This indicates that the observed emission is the result of the superposition of the emission of different subensembles.
The two emission maxima of photoactivated GFP correspond well to the fluorescence from the D- and E-, and the shoulder in the bulk emission to the C-form fluorescence. We speculate that photoactivation under the conditions reported changes the relative occurrences of the newly discovered spectral forms, and that the superposition of the fluorescence of the three red-shifted-emitting forms we observed yields the observed bulk spectrum. The hypothesis that the observed single-molecule formation of red-shifted forms account for the observed bulk behavior is further supported by Elowitz et al.'s observation that the photoactivated red-shifted emission forms via a nonemitting intermediate. These investigators found that after exposing GFP variants to brief pulses of 488 nm light a slow brightening of red fluorescence occurs which indicates a two-step process in the same manner as we have observed in the transitions in the single-protein experiments. Finally our finding that EGFP as well as EYFP shows red-shifted fluorescence coincides with the finding of Elowitz et al. that all tested GFP variants can be photoactivated.
In bulk experiments, the photoactivated red fluorescence remained stable for at least 24 h. In contrast to ensemble experiments, the observation of a single chromophore uncovers reactions averaged out in the bulk. Thus we were able to observe a number of transitions back from the red-shifted forms to the predominant B-form, which indicates that the transition back to the blue-shifted form is photoinduced as well. That there was no need for special oxygen reduction to generate red-shifted fluorescence in our single-molecule experiment might be due to the embedding of the proteins in the PVA matrix or to the high-excitation power applied compared to bulk photoactivation.
CONCLUSION
We have demonstrated that spectrally resolved room temperature single-molecule spectroscopy is capable of identifying spectrally different subensembles, even when these forms are scarcely populated. We were able to observe spectroscopically different forms of EYFP and EGFP. For EYFP we presented isolated emission spectra of the predominant B-form as well as of the blue-shifted I-form which has so far only been seen at cryogenic temperatures. The observation of isolated I-form emission spectra shows that the I-form is populated and relevant in spectroscopic experiments at room temperature. We further found that the EYFP I-form spectra are indistinguishable from single-molecule spectra of the predominant form of EGFP which suggests that the blue-shifted fluorescence of the EYFP I-form originates from a disturbance in the π-stacking between the chromophoric π-system and the phenolic group of the amino acid residue at position 203. The relatively small fraction of observed EYFP I-form fluorescence before or after a dark period suggests that transitions from the B-form to the A-form via the I-form are not the dominant mechanism responsible for the frequently observed dark periods.
For EYFP as well as for EGFP, we identified three more, so far unknown, forms with red-shifted fluorescence. We observed transitions between the predominant forms and the red-shifted forms via a nonfluorescent intermediate. The spectral positions and the formation via a nonfluorescent intermediate hint that the red-shifted forms account for the possible photoactivation observed in bulk experiments. The comparison of the single-molecule emission spectra of the red-shifted EYFP and EGFP forms displays distinct similarity to single-molecule DsRed spectra, and thereby suggests that at least the two most red-shifted forms have a DsRed like chromophore with elongated chromophoric π-system.
Our entire data set shows that EYFP and EGFP, especially under single-molecule detection conditions is not a photostable one color system. On the contrary, the fluorescent proteins turn out to be spectrally highly dynamic systems exhibiting changes of intensity of the respective spectra as well as spectral switching to spectrally clearly different forms (Figs. 3–5). The observed spectral dynamics and versatility are a manifestation of the intrinsic flexibility and variability in the protein environment surrounding the chromophore which can only be observed on the single-molecule level due to ensemble averaging in bulk experiments.
The knowledge of the existence of more spectrally distinct forms of the FPs and the suggested underlying molecular origins of these forms might help to construct optimized FPs, e.g., with minimized intrinsic dynamics or optimized photoinduced transitions.
The observed, sometimes drastic changes in EYFP and EGFP emission do affect the suitability of these proteins in FRET experiments. EGFP is a potential FRET donor with mRFP or DsRed as acceptor, whereas EYFP is used as FRET acceptor with the cyan fluorescent protein as a FRET donor. The changes in EYFP emission observed are bound to have a corresponding effect on the chromophore absorption. The observed variations consequently result in changes in the spectral overlap between donor and acceptor and thus the FRET efficiency. This is surely an unwanted effect which has to be considered, especially when the system is not monitored in a spectrally resolved manner, but rather, as is usual, in a single donor and a single acceptor channel.
References
- Baird, G., D. Zacharias, and R. Tsien. 2000. Biochemistry, mutagenesis, and oligomerization of dsRed, a red fluorescent protein from coral. Proc. Natl. Acad. Sci. USA. 97:11984–11989. [DOI] [PMC free article] [PubMed] [Google Scholar]
- Blum, C., F. Stracke, S. Becker, K. Müllen, and A. Meixner. 2001. Discrimination and interpretation of spectral phenomena by room-temperature single-molecule spectroscopy. J. Phys. Chem. A. 105:6983–6990. [Google Scholar]
- Blum, C., V. Subramaniam, F. Schleifenbaum, F. Stracke, B. Angres, A. Terskikh, and A. Meixner. 2002. Single molecule fluorescence spectroscopy of mutants of the discosoma red fluorescent protein DsRed. Chem. Phys. Lett. 362:355–361. [Google Scholar]
- Chattoraj, M., B. A. King, G. U. Bublitz, and S. G. Boxer. 1996. Ultra-fast excited state dynamics in green fluorescent protein: multiple states and proton transfer. Proc. Natl. Acad. Sci. USA. 93:8362–8367. [DOI] [PMC free article] [PubMed] [Google Scholar]
- Chudakov, D., A. Feofanov, N. Mudrik, S. Lukyanov, and K. Lukyanov. 2003. Chromophore environment provides clue to “kindling fluorescent protein” riddle. J. Biol. Chem. 278:7215–7219. [DOI] [PubMed] [Google Scholar]
- Cotlet, M., J. Hofkens, S. Habuchi, G. Dirix, M. Van Guyse, J. Michiels, J. Vanderleyden, and F. De Schryver. 2001. Identification of different emitting species in the red fluorescent protein DsRed by means of ensemble and single-molecule spectroscopy. Proc. Natl. Acad. Sci. USA. 98:14398–14403. [DOI] [PMC free article] [PubMed] [Google Scholar]
- Creemers, T., A. Lock, V. Subramaniam, T. Jovin, and S. Völker. 1999. Three photoconvertible forms of green fluorescent protein identified by spectral hole-burning. Nat. Struct. Biol. 6:557–560. [DOI] [PubMed] [Google Scholar]
- Creemers, T., A. Lock, V. Subramaniam, T. Jovin, and S. Völker. 2000. Photophysics and optical switching in green fluorescent protein mutants. Proc. Natl. Acad. Sci. USA. 97:2974–2978. [DOI] [PMC free article] [PubMed] [Google Scholar]
- Creemers, T., A. Lock, V. Subramaniam, T. Jovin, and S. Völker. 2002. Redshifted mutants of green fluorescent protein: reversible photoconversion studied by hole-burning and high resolution spectroscopy. Chem. Phys. 275:109–121. [Google Scholar]
- Dickson, R., A. Cubitt, R. Tsien, and W. Moerner. 1997. On/off blinking and switching behavior of single molecules of green fluorescent proteins. Nature. 388:355–358. [DOI] [PubMed] [Google Scholar]
- Elowitz, M., M. Surette, P. Wolf, J. Stock, and S. Leibler. 1997. Photoactivation turns green fluorescent protein red. Curr. Biol. 7:809–812. [DOI] [PubMed] [Google Scholar]
- Elowitz, M. B., M. G. Surette, P.-E. Wolf, J. B. Stock, and S. Leibler. 1999. Protein mobility in the cytoplasm of Escherichia coli. J. Bacteriol. 181:197–203. [DOI] [PMC free article] [PubMed] [Google Scholar]
- Garcia-Parajo, M., G. Segers-Nolten, J. Veerman, J. Greve, and N. van Hulst. 2000. Real-time light-driven dynamics of the emission in single green fluorescent protein molecules. Proc. Natl. Acad. Sci. USA. 97:7237–7242. [DOI] [PMC free article] [PubMed] [Google Scholar]
- Gross, L., G. Baird, R. Hoffman, K. Baldridge, and R. Tsien. 2000. The structure of the chromophore within DsRed, a red fluorescent protein from coral. Proc. Natl. Acad. Sci. USA. 97:11990–11995. [DOI] [PMC free article] [PubMed] [Google Scholar]
- Harms, G., L. Cognet, P. Lommerse, G. Blab, and T. Schmidt. 2001. Autofluorescent proteins in single molecule research: applications to live cell imaging spectroscopy. Biophys. J. 80:2396–2408. [DOI] [PMC free article] [PubMed] [Google Scholar]
- Heikal, A., S. Hess, G. Baird, R. Tsien, and W. Webb. 2000. Molecular Spectroscopy and dynamics of intrinsically fluorescent proteins: coral red (DsRed) and yellow (citrine). Proc. Natl. Acad. Sci. USA. 97:11996–12001. [DOI] [PMC free article] [PubMed] [Google Scholar]
- Labas, Y. A., N. G. Gurskaya, Y. G. Yanushevich, A. F. Fradkov, K. A. Lukyanov, S. A. Lukyanov, and M. V. Matz. 2002. Diversity and evolution of the green fluorescent protein family. Proc. Natl. Acad. Sci. USA. 99:4256–4261. [DOI] [PMC free article] [PubMed] [Google Scholar]
- Lossau, H., A. Kummer, R. Heinecke, F. Pöllinger-Dammer, C. Kompa, G. Bieser, T. Jonsson, C. M. Silva, M. M. Yang, D. C. Youvan, and M. E. Michel-Beyerle. 1996. Time-resolved spectroscopy of wild-type and mutant green fluorescent proteins reveals excited state deprotonation consistent with fluorophore-protein interactions. Chem. Phys. 213:1–16. [Google Scholar]
- Malvezzi-Campeggi, F., M. J.ahnz, K. Heinze, P. Dittrich, and P. Schwille. 2001. Light-induced flickering of DsRed provides evidence for distinct and interconvertible fluorescent states. Biophys. J. 81:1776–1785. [DOI] [PMC free article] [PubMed] [Google Scholar]
- Matz, M., A. Fradkov, Y. Labas, A. Savitsky, A. Zaraisky, M. Markelov, and S. Lukyanov. 1999. Fluorescent proteins from non-bioluminescent Anthozoa species. Nat. Biotechnol. 17:969–973. [DOI] [PubMed] [Google Scholar]
- Striker, G., V. Subramaniam, K. Seidel, and A. Volkmer. 1999. Photochromocity and fluorescence lifetimes of green fluorescent protein. J. Phys. Chem. B. 103:8612–8617. [Google Scholar]
- Tsien, R. 1998. The green fluorescent protein. Annu. Rev. Biochem. 67:509. [DOI] [PubMed] [Google Scholar]
- Volkmer, A., V. Subramaniam, B. Birch, and T. Jovin. 2000. One- and two-photon excited fluorescence lifetimes and anisotropy decays of green fluorescent proteins. Biophys. J. 78:1589–1598. [DOI] [PMC free article] [PubMed] [Google Scholar]
- Wachter, R., M. Elsliger, K. Kallio, G. Hanson, and J. Remington. 1998. Structural basis of spectral shifts in the yellow-emission variants of green fluorescent protein. Structure. 6:1267–1277. [DOI] [PubMed] [Google Scholar]
- Wiedenmann, J., A. Schenk, C. Röcker, A. Girod, K. Spindler, and G. Nienhaus. 2002. A far-red fluorescent protein with fast maturation and reduced oligomerization tendency from Entacmaea quadricolor (Anthozoa, Actinaria). Proc. Natl. Acad. Sci. USA. 99:11646–11651. [DOI] [PMC free article] [PubMed] [Google Scholar]
- Winkler, K., J. Lindner, V. Subramaniam, T. Jovin, and P. Vohringer. 2002. Ultrafast dynamics in the excited state of green fluorescent protein (wt) studied by frequency-resolved femtosecond pump-probe spectroscopy. Phys. Chem. Chem. Phys. 4:1072–1081. [Google Scholar]


