

Abstract
We report protocols and techniques to image and mechanically manipulate individual fibrin fibers, which are key structural components of blood clots. Using atomic force microscopy-based lateral force manipulations we determined the rupture force, FR, of fibrin fibers as a function of their diameter, D, in ambient conditions. As expected, the rupture force increases with increasing diameter; however, somewhat unexpectedly, it increases as FR ∼ D1.30±0.06. Moreover, using a combined atomic force microscopy-fluorescence microscopy instrument, we determined the light intensity, I, of single fibers, that were formed with fluorescently labeled fibrinogen, as a function of their diameter, D. Similar to the force data, we found that the light intensity, and thus the number of molecules per cross section, increases as I ∼ D1.25±0.11. Based on these findings we propose that fibrin fibers are fractals for which the number of molecules per cross section increases as about D1.3. This implies that the molecule density varies as ρ(D) ∼ D−0.7, i.e., thinner fibers are denser than thicker fibers. Such a model would be consistent with the observation that fibrin fibers consist of 70–80% water and only 20–30% protein, which also suggests that fibrin fibers are very porous.
INTRODUCTION
Blood clotting is of central importance to our well-being and life and has thus been studied for many decades. Blood clots (thrombi) usually form in the event of injury or damage to blood vessels to prevent the loss of blood. Moreover, blood clots often form in undesired locations, i.e., in blood vessels around the heart or brain, resulting in heart attacks or strokes. Blood clots, which mainly consist of a meshwork of fibrin fibers attached to platelets, ultimately have the task of creating a blockage that stems the flow of blood. Since this is essentially a mechanical task, there has been much interest in determining the response of clots to mechanical stresses. In the past, the bulk mechanical properties of whole clots were investigated extensively (Ferry et al., 1951; Roberts et al., 1973; Gerth et al., 1974; Mockros et al., 1974; Glover et al., 1975; Shen et al., 1975; Nelb et al., 1976, 1981; Janmey et al., 1982, 1983; Shen and Lorand, 1983; Ryan et al., 1999a,b). However, to our knowledge, there are no experimental data available on the strength or mechanical properties of individual fibrin fibers. This situation is akin to knowing the appearance and bulk properties of a fishing net without knowing the mechanical properties of the strings and knots.
This lack of data on the individual strand level has been due to the unavailability of suitable protocols and instrumentation to perform such measurements. Our work is beginning to close this gap.
Formation of blood clots
Fibrinogen is a 340,000 Dalton protein, consisting of two identical halves, each comprised of three peptide chains (Aα, Bβ, γ), which are held together by a network of disulfide bonds. Recent x-ray crystallography data (Brown et al., 2000; Yang et al., 2001; Doolittle, 2003) corroborated electron microscopy studies (Hall and Slayter, 1959; Williams, 1981) having shown that fibrinogen is a trinodular structure of ∼45 nm in length and 4.5 nm in diameter. Upon activation, thrombin proteolytically removes fibrinopeptides A and B from the central node of fibrinogen thus converting it into fibrin and exposing binding sites (knobs) A and B on the central domain. These knobs interact with binding sites (hole a and b) on the end domains. Fibrinopeptide A is cleaved first and upon the exposure of knob A, fibrin monomers assemble in a half-staggered fashion into two-stranded protofibrils. Upon growing to sufficient length, typically ∼15 monomers, the protofibrils aggregate laterally to from fibers that branch into a three-dimensional network. Release of fibrinopeptide B (exposure of knob B) aids lateral aggregation; however it is not absolutely required for lateral aggregation (Blomback et al., 1958).
Especially the latter steps in fibrin assembly, namely the lateral association of long protofibrils into thick fibrin strands and ultimately into an entwined network, are not yet fully understood despite decades of effort. Our data suggest a particular structural arrangement of the inside of a fibrin fiber, in particular, that the molecule density varies as ρ(D) ∼ D−0.7, and may thus be useful for testing lateral aggregation models.
Rheological and mechanical properties of a blood clot
Essentially, blood clots have the mechanical task of stemming the flow of blood and the importance of studying the mechanical properties of blood clots for advancing our understanding of the clotting process has been recognized long ago. Accordingly, the viscoelastic behavior of blood clots has been studied for over five decades (Hartert, 1948; Ferry et al., 1951; Roberts et al., 1973; Gerth et al., 1974; Mockros et al., 1974; Shen et al., 1974, 1975; Glover et al., 1975; Nelb et al., 1976, 1981; Janmey et al., 1982, 1983; Shen and Lorand, 1983; Ryan et al., 1999a,b) using techniques targeted to bulk material properties, not individual fibers. Most of those measurements were carried out with a plate or cone rheometer, with which the viscoelastic properties, such as the loss and storage moduli, G″ and G′, and the loss tangent tanδ = G″/G′, of materials, can be determined.
The loss modulus G″ indicates the amount of inelastic (plastic) deformation, whereas the storage modulus G′ indicates elastic deformations and is a measure of clot stiffness and elasticity. The loss tangent, tanδ = G″/G′, is a measure of the ratio of energy lost to energy stored in a cyclic deformation.
From such experiments, it has been found, that the viscoelastic behavior of a fibrin clot is mainly governed by two broad factors (Roberts et al., 1973; Gerth et al., 1974; Glover et al., 1975; Shen et al., 1975; Nelb et al., 1976; Ryan et al., 1999a, 1999b):
The “clot architecture” or “clot structure.” The clot architecture is determined, for example, by such parameters as the branching point density, the curvature and interconnectedness of fibers, the fiber density within a clot and, on a larger scale, the overall architectural structure of the clot.
The properties of the individual fiber. The properties of the individual fiber are affected by the fiber thickness, fiber composition, Cl−-concentration (Di Stasio et al., 1998), or the degree of covalent cross-linking of fibrin monomers by factor XIIIa.
Interestingly, many experimentally controllable parameters, such as the fibrinogen, thrombin, CaCl2, or salt concentration, affect the clot architecture and the properties of the individual fibers simultaneously. For example, an increase in fibrinogen concentration results in thinner fibers but also in more branching points; similarly, an increase in thrombin concentration results in thinner fibers but also in more branching points, and an increase in CaCl2 concentration results in thicker fibers but also in fewer branching points (Ryan et al., 1999b). Thus, in experiments that study whole clot properties, it is often very difficult to determine if it was i), the clot architecture; ii), the properties of the individual fibers; or iii), both, that affected the clot behavior.
Since our approach makes it possible for the first time to examine the individual fibers, it promises to be able to separate the effect of clot architecture and individual fiber properties on whole clot behavior.
Knowing the mechanical properties of the individual fibers would also facilitate developing a good mechanical model of a clot. Despite the accumulated knowledge about clots at the macroscopic and molecular level (i.e., crystal-structure; Brown et al., 2000; Yang et al., 2001), the development of a comprehensive and quantitative model of clotting has not yet been achieved. This failure is partly due to the fact that data on the properties of the individual fibers, against which models could be tested, are missing. Our approach, designed to probe the strengths of fibers on a single-strand basis, will begin to fill this gap.
Physiological importance of clot properties
The physiological importance of the mechanical properties of clots may be demonstrated by a few examples. Patients with an immunoglobulin inhibiting any ligation involving the α-chain have hemorrhagic tendencies. Accordingly, the storage modulus G′ of clots from these patients was found to be four times smaller and the loss tangent ∼9 times higher than the values for fully ligated clots (Lorand et al., 1980; Lorand, 1994; Ryan et al., 1999b). In another study, clots from factor VIII- and factor IX- deficient patients (hemophiliacs) had a clot elastic modulus that was three- to fivefold smaller than clots from healthy patients (Carr et al., 2003). The connection between disease and clot properties is furthermore demonstrated by the increased incidence of myocardial infarction in patients with elevated levels of plasma fibrinogen, which results in less deformable clots (Scrutton et al., 1994).
Manipulation techniques
To date there are several techniques with which the mechanical properties of molecules (force measurements) can be determined. However, with most of them it would not be possible to manipulate fibers and visualize the effect of the manipulation as was done here. One popular technique is atomic force microscopy (AFM) force spectroscopy (in the normal direction) in which a molecule, which is anchored between the tip and the surface, is pulled. This technique would have two caveats were it applied to the type of measurements done here. First, it is not possible to visualize the molecule under investigation, because it is anchored to the scanning tip. Second, the forces required to deform fibrin fibers are often larger than what can commonly be achieved by this technique, since the forces that can be applied to the molecule under investigation are limited by the strength of the tip-molecule and surface-molecule anchor.
Another technique with which it might be possible to manipulate individual fibers is laser tweezers. However, since this technique is only capable of generating a maximum force of ∼100 pN, and since a force of many nanoNewtons is required to significantly deform fibrin fibers, this technique may not be suitable for force measurement on individual fibers. Moreover, the effect of the manipulation is difficult to visualize.
By rolling a fibrin-functionalized microsphere over a fibrin-functionalized glass surface the rupture force between two fibrin monomers was estimated to be on the order of 400 pN (Lorthois et al., 2001). However, because of the limiting range of shear forces that could be applied to the spheres by flow, this number is only semi-quantitative.
Internal, cross-sectional structure of fibrin fibers
When examining the cross-sectional area of individual fibrin fiber in TEM images, it appears as an arrangement of densely packed irregular shapes of different sizes containing a few irregular voids or channels (see Fig. 1 and (Cohen et al., 1982; Morgenstern et al., 1984; Voter et al., 1986a)). However, these results are inconsistent with turbidity studies, which examine fibers in buffer, where it was determined that only ∼20–30% of the volume of the individual fibrin fibers is comprised of protein, whereas ∼70–80% consists of solvent (Carr and Hermans, 1978; Voter et al., 1986b). Apparently, these studies indicate that individual fibrin fibers are rather porous. Since the fibers in the TEM images appear to contain much more than 30% protein content, it may be concluded that the vacuum conditions in a TEM causes a complete dehydration and subsequent collapse of the fibers.
FIGURE 1.
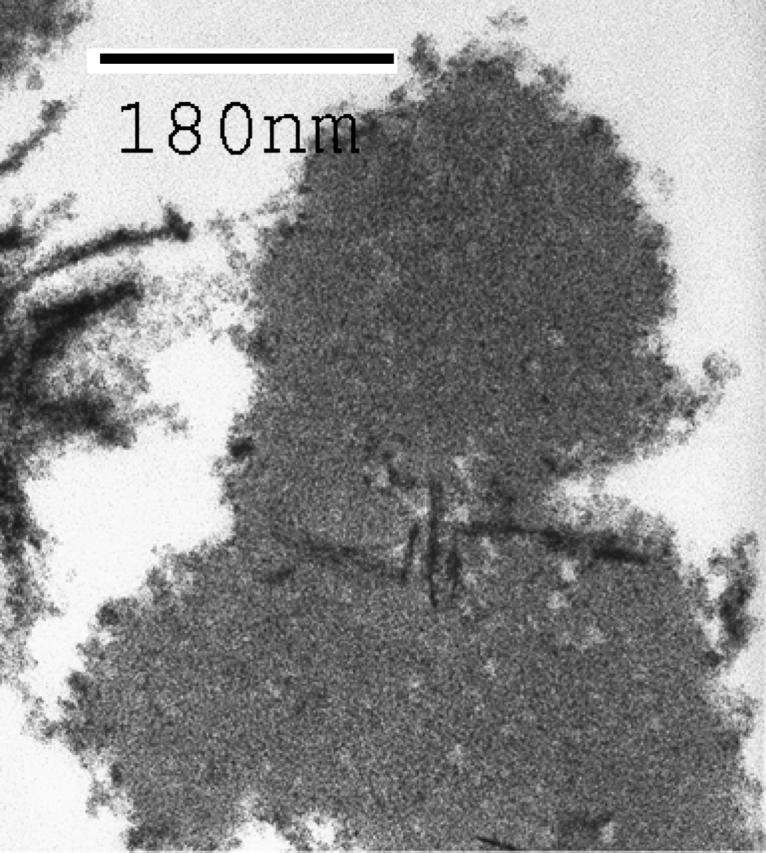
TEM image (90,000×) of the cross section of a fibrin fiber.
AFM imaging of fibrin fibers
Although the real-time polymerization of fibrin fibers was one of the first processes observed by AFM (Drake et al., 1989), surprisingly, there has been little subsequent effort to utilize the imaging and manipulation capabilities of AFMs and other probe microscopes to further study these fibers. After these first, real-time AFM images of the formation of fibrin fibers on mica were obtain in 1989 there has been a ten-year a lull in activity. More work was done recently, resulting in a few, somewhat conflicting reports on how the fibers should be prepared for imaging and on what surfaces they can be formed and imaged. In 2001, Sit et al. presented real-time images of fibers that formed on graphite; however, they also reported that fibrin fibers don't form on mica surfaces (Sit and Marchant 2001), in contrast to the 1989 study (Drake et al., 1989) and our own findings. Differences in the buffer condition and experimental setup may account for these conflicting results. Vikinge et al. (2000) reported AFM images of fibrin fibers on a gold surface when they studied the formation of blood coagulation by surface plasmon resonance. Perhaps, the to-date most interesting AFM images of fibrin fibers in liquid were obtained by Blinc et al. (2000). These researchers formed fibrin and plasma clots on glass surfaces and observed their dissolution by plasmin or recombinant tissue-type plasminogen activator (rt-PA). They found that lysis of fibrin fibers proceeds mainly by a cross-sectional cut-trough, rather than by gradual fiber thinning.
Our study reports a protocol to reproducibly form fibrin fibers on mica, silicon, NH2-functionalized silicon, CH3-functionalized silicon and glass surfaces.
MATERIALS AND METHODS
Preparation of fibrin fibers
An 18 μl solution of fibrinogen (2.0 mg/ml fibrinogen (Factor XIIIa free, Enzyme Research Labs, South Bend, IN), 150 mM NaCl, 10 mM CaCl2, 10 mM Hepes, pH 7.4) were deposited onto the substrate; 2 μl of thrombin solution (1 u/ml thrombin (Enzyme Research Labs, South Bend, IN), 130 mM NaCl, 10 mM Hepes, pH 7.4) were added to the fibrinogen solution on the substrate and briefly mixed by pipetting the solution up and down. The solution was incubated at room temperature for ∼30 min. in a water-saturated atmosphere (to prevent drying) to allow clot formation. The clot was carefully rinsed with distilled water, excess liquid was blotted off with filter paper and the sample was dried in a stream of nitrogen. The clot was imaged in ambient air.
Substrate preparation
Using this method, we have successfully formed and imaged clots on the following substrates. All chemicals were purchased from Sigma (St. Louis, MO) unless otherwise noted.
Freshly cleaved ruby muscovite mica (Paramount, New York, NY). Mica was cut into ∼1-cm2 disks and freshly cleaved with a piece a tape just before deposition.
Clean <100> silicon surfaces. A silicon wafer (Virginia Semiconductors, Fredericksburg, VA) was cut into ∼1-cm2 squares with a diamond. The squares were then rinsed with a strong stream of distilled water (Millipore, Billerica, MA) and dried in a stream of pure nitrogen. The squares were then cleaned in a UV/ozone cleaner (Samco International, Kyoto, Japan) and used for sample deposition right away.
NH2-functionalized silicon. This procedure covalently attaches hydrophilic NH2-groups on the silicon surface. The initial silicon squares were prepared as in 2. After the UV/ozone cleaning step, a drop of aminopropyltriethoxysilane (APTES) solution was placed on the silicon chip and incubated for 30 min, rinsed with isopropanol and distilled water. Successful functionalization was checked by comparing the wetting properties with those of clean silicon.
CH3-functionalized silicon. This procedure covalently attaches hydrophobic CH3-groups to the silicon surface. The initial silicon squares were prepared as in 2. After the UV/ozone cleaning step, the silicon squares were exposed to a saturated hexamethyldisalazane (HMDS) atmosphere for several hours, rinsed with isopropanol and distilled water. The HMDS atmosphere was created in a closed 100 ml glass jar containing ∼5 ml of liquid HMDS at the bottom. Successful functionalization was checked by comparing the wetting properties with those of clean silicon.
Glass. Glass coverslips (Fisher Scientific, Philadelphia, PA) were cleaned in a UV/ozone cleaner (Samco International, Kyoto, Japan), rinsed with distilled water (Millipore) and dried in a flow of pure nitrogen.
Imaging and manipulating fibrin fibers
All imaging and manipulating was done with a nanoManipulator (3rd Tech, Chapel Hill, North Carolina). A more detailed description of this instrument is given in (Falvo et al., 1997; Guthold et al., 1999, 2000). Briefly, the nanoManipulator is a modified AFM (Topometrix Explorer, Veeco Instruments, Woodbury, NY) with the following advanced features:
The AFM data are sent to a graphics interface which displays the data as a real-time three-dimensional image.
The collected image data are also sent to a Phantom controller which uses the data to construct a “feelable” surface. The user can thus fell the image surface, in real time, with a handheld, force-feedback stylus (Phantom, SensAble Technologies, Woburn, MA).
Perhaps most important for our experiments, the nanoManipulator allows for very easy switching between AFM imaging modes and manipulation modes. For example in our experiments, the sample was first imaged in tapping mode, where the AFM tip is oscillated with a frequency of ∼160 kHz perpendicularly to the surface as it scans over the surface. Hence the tip touches the surface only intermittently and lateral forces are nearly eliminated (Fig. 2 A). The sample is not disturbed and images can be obtained easily. Sample manipulations were done in contact mode. In this mode the tip is pushed down onto the surface with a predetermined normal force. The tip is placed carefully next to the fiber and then dragged laterally across the surface through the fiber in a predetermined path. Throughout this process the lateral force that is applied to the sample is measured continuously (Fig. 2, B and C).
FIGURE 2.

Lateral force manipulation scheme. (A) Tapping mode AFM imaging. The tip oscillates over and slightly taps the sample, thus exerting minimal lateral force on the sample. (B) For lateral force manipulations the tip is pressed down with a constant normal force and moved laterally. The twist of the cantilever is measured via a quadrant photodiode. (C) Schematics of a fiber manipulation. The tip contacts the fiber, and stretches it until it ruptures. The drawing is approximately to scale for a 100-nm thick fiber being stretched 700 nm before it ruptures. During a manipulation, two main forces (a force pair) act on the fiber segment that ruptures (dark red): i), the backward distributed frictional force; and ii), the forward applied tip force. Those two forces balance each other and cause the fiber to deform and to eventually rupture. The highest peak in the force versus distance curve is attributed to the rupture event.
Here, all imaging was done in tapping mode in ambient conditions with silicon cantilevers (Nanosensors, Wetzlar, Germany) having a resonance frequency of ∼160 kHz and a spring constant of ∼40 N/m. The actual spring constant was determined as shown below.
Manipulations of the fibers were done in contact mode. The normal force during lateral force manipulations was held constant by the force feedback; typically at a value of 30–40 nA (∼10–14 μN, for the cantilevers used). If a much lower normal force was used, the tip would just slide over the fiber instead of rupturing it. The lateral tip speed during these lateral force measurements was typically 2 μm/s. To determine the effect of the speed on the rupture force, the speed was varied between 0.02 μm/s and 20 μm/s.
For a rectangular cantilever of length L, width w, thickness t and with a tip of height h, the normal force Fn and lateral force Fl that are applied to the sample, can be calculated by Fn = kn(2/3)Lθn, and Fl = klhθl, where θn and θl are the normal and lateral tip displacement (in radians) (Marti, 1999). Using beam mechanics, the normal and lateral force constants of the cantilevers are calculated from  and
and  , where E = 1.69 × 10¹¹ N/m2 and G = 0.5 × 10¹¹ N/m2 are the Young's and shear modulus of the cantilever material (silicon). Although some of the dimensions are specified by the manufacturer, we measured them independently with an inverted optical microscope (Axiovert 200, Zeiss, Göttingen, Germany). The thickness of the cantilever was determined from the relation
  , where f0 is the resonance frequency of the cantilever and ρ = 2330 kg/m3 is the density of the silicon.
Combined optical and AFM imaging. The fibers were prepared as described above with fluorescently labeled fibrinogen and deposited on a glass coverslip (as above). Fluorescently labeled fibrinogen was prepared as follows. Fibrinogen stock solutions in 0.3 M NaCl at a concentration of ∼30 to 40 μM were prepared by dialysis. 1 mg Oregon Green 488 isothiocyanate (F2FITC) mixed isomers (Molecular Probes, Eugene, OR) was dissolved in 0.200 ml dimethyl sulfoxide (DMSO). 0.003 ml of this Oregon Green solution was added to 3.0 ml 0.1 M borate buffer, pH 8.0 to a final concentration of ∼10.6 mM. Final concentrations of fibrinogen and Oregon Green solutions were determined by absorbance photospectroscopy. Four mole of Oregon Green were added per one mole of fibrinogen in the labeling reaction (0.1 M borate buffer, 200 mM NaCl, 30 μM fibrinogen). Labeling was done at room temperature for 1 h.
We build a stage for a Zeiss Axiovert 200 microscope (Zeiss, Göttingen, Germany), so that an AFM can fit on top of the sample. This allowed us to image the fluorescently labeled fibrin sample from underneath to determine the light intensity, whereas the sample could be imaged from the top with the AFM to determine the radius of the fibers.
RESULTS
Images of fibrin fibers on different surfaces
Fig. 3 shows images of fibrin fibers that were formed on mica (A), silicon (B), glass (C), CH3-functionalized silicon (D), and NH2-functionalized silicon (E). This group of substrates includes positively charged groups (NH2), negatively charged groups (mica, glass, silicon) and hydrophobic groups (CH3). Fibers could be formed, imaged, and manipulated on all substrates without having to adjust our protocol.
FIGURE 3.

AFM images of fibrin fibers on (A) mica, (B) silicon, (C) glass, (D) CH3-functionalized silicon, and (E) NH2-functionalized silicon. Scale bar 10 μm, except in C, where it is 5 μm.
In the following section all manipulation experiments were done with fibers that were formed on mica.
Mechanical manipulation of fibrin fibers
In our experiments, the fiber is first imaged, then manipulated and then imaged again to examine the effect of the manipulation. Imaging and manipulating fibers have somewhat conflicting requirements, since the fiber must not move and the tip must exert minimal lateral forces on the fiber when the fiber is imaged. However, when manipulating the fiber, the tip must exert very strong lateral forces on the fiber. To solve this conundrum, the fibers are first imaged in tapping mode, in which the tip lightly taps (oscillates) over the surface (Fig. 2 A). In this mode, minimal forces are exerted on the sample and it is thus an ideal mode for imaging. Next, using the nanoManipulator, the tip is placed close to a fiber and the microscope is switched into contact mode for manipulation. For lateral force measurements, the tip is pressed down at a constant normal force (force feedback is on) and moved sideways. During this operation, the lateral forces applied to the sample are determined, which, in turn yields the mechanical properties of the sample. After the manipulation is completed, the microscope is switched back into tapping mode to view the result of the manipulation. Thus, using this technique, the effects of the manipulation can be viewed, which is not possible in many other manipulation techniques.
Fig. 4, A, B and C, D, respectively, show AFM tapping mode images of a thick (180 nm) and a thin (53 nm) fibrin fiber before and after they were ruptured with the AFM tip. Note that the scale (see scale bars) of the images is slightly different. A 500-nm grid is overlaid on the image of the ticker fiber (the fiber appears wider than 180 nm due to the tip-broadening effect; especially in Fig. 4 B, since the tip broadened after the manipulation). In addition to the fiber being ruptured, a trace that the tip has scratched into the surface can also be seen. Fig. 4, C and F show the lateral force measured by the tip during the manipulation versus the distance traveled by the tip. In Fig. 4 C, the two steps at the very beginning (∼600 nm) and the very end (∼3900 nm) of the trace are due to a reversal in the direction of tip travel and are an indication of the friction between the tip and the surface; i.e., the tip is first moved away from the fiber (for 600 nm) then turned around, moved toward and through the fiber, and then turned around again (for 500 nm). The frictional force between tip and surface (half the step height) may be used as an internal calibration force. Between these steps the tip traveled ∼3300 nm from left to right. In Fig. 4 B, this is the length of the trace scratched into the surface. (Note the dotted vertical lines between Fig. 4, B and C, which aligns the force trace with the image.) At 2200 nm, the tip encounters the fiber, which results in a large increase in force as the tip is pushing against the fiber. The force then increases in a somewhat jagged pattern to a peak value of ∼7800 nN. The fiber then ruptures and the force drops down suddenly to a base value. We interpret the height of this peak as the rupture force of the fiber, which is 7800 nN−1900 nN (peak−base) = 5900 nN in this case.
FIGURE 4.

AFM image of a 180-nm fibrin fiber before (A) and after (B) being ruptured by the AFM tip. (C) Corresponding lateral force versus tip travel during this manipulation. The steps at 600 nm and at 3900 nm in the force trace are due to a reversal in tip travel (i.e., a friction loop); the peak at 2900 nm is the rupture force of the fiber. Dotted vertical line between B and C aligns scratched trace in image (B) with tip travel in (C). (D–F) Images and force curve for the rupture of a 53-nm fiber. The step at 1000 nm is due to a friction loop; the tip contacts the fiber at 1900 nm; the fiber ruptures at 2700 nm.
It is typical that some debris accumulations can be seen at the end of the trace left by the tip in the surface. These accumulations most likely consist of unpolymerized fibrin/ogen molecules, protofibrils and small fibers that settle on the surface during the polymerization reaction, and which the tip scrapes off. Most likely the accumulations also contain some fiber fragments from the ruptured fiber.
Fig. 4, D–F, show before- and after-images and the corresponding force curve for the rupture of a thinner (∼53 nm) fiber. The same analysis as for the thick fiber yields a rupture force of ∼1250 nN for the thin fiber. The first step at 1000 nm is again due to a friction loop (reversal in direction). The tip contacts the fiber at 1900 nm at which point the force increases from 1000 nN to 2250 nN. The fiber ruptures at 2700 nm and the rupture force is 2250 nN−1000 nN = 1250 nN. After rupture, the force does not drop all the way down to the base level, because the tip pushes the ruptured piece of the fiber and perhaps some debris forward. During the very last part of this force trace, the force increases again, because the tip hits yet another fiber that is situated in the path of the tip (see Fig. 4 D).
During a manipulation, there are two main forces acting on the segment of the fiber that breaks (dark red segment in Fig. 2 C): the distributed frictional force between the fiber and the surface, Fback, which holds the fiber back; and the applied tip force, Fforward, which pushes forward on the fiber. Since the acceleration of the fiber is basically zero, according to Newton's second law,  , the forward and the backward force must balance each other at every time during the manipulation. Since these two forces pull the fiber in opposite directions, they cause the fiber to deform. Fig. 2 C is drawn approximately to scale for a 100 nm fiber that gets stretched to ∼700 nm, similar to the AFM images in Fig. 4. (Note that the fibers looks broader in the AFM images due to the tip dilation effect, and thus the amount of stretching may not be fully appreciated from the AFM images.) As the applied tip force, Fforward, (and simultaneously the backward force) increases, the fiber stretches more and more until it ruptures. It is not possible to determine the exact rupture mechanism and rupture geometry (overstretching, overbending, overshearing, or combinations thereof) from our data. Nevertheless, we identify the highest point in the force-distance curve as the rupture point and we will call this force the “rupture force.”
Perhaps it should be noted that the highest point is not the surface attachment force of a given fiber segment. In fact, since the fiber moves over the surface, as can be seen from the images (e.g., the fiber moves ∼600 nm and in Fig. 4 B and 800 nm in Fig. 4 F), the surface attachment force is initially smaller than the rupture force. (If it were larger, the fiber would not move.) However, when the applied tip force increases it pulls a larger and larger section of the fiber over the surface and thus, the distributed frictional force, which is proportional to the surface area, increases. Hence, as the manipulation goes on, more and more stress is applied by those two forces to the fiber until the rupture point is reached. Thus, we identify the highest point in the force curve as the rupture point. As is known from macroscopic experiments on rods, different geometrical setups may give different rupture forces. Thus, what we call “rupture force” must be seen in the context of our experimental setup and may vary from other setups by a geometrical factor.
Fig. 5 A shows a plot of the rupture force versus the diameter. The diameters ranged from 16 nm to 190 nm. As expected, the rupture force FR increases with increasing diameter, D. Somewhat unexpected, though, is the finding that it increases proportional to D1.30±0.06. This exponent was found by fitting the data to the function FR = c × Db, where c and b are fitting constants.
FIGURE 5.

(A) Log-log plot of the rupture force of fibers versus their diameter; dotted line is best exponential curve fit yielding F ∼ D1.30±0.06. (B) Plot of the rupture force versus log of force rate.
Depending on the material and the geometrical setup, stress-strain curves and rupture measurements can be complicated and the obtained rupture data can differ. Here we will employ the simplest possible model to explain our data. Like in the case of many macroscopic materials (e.g., stretching elastic wire) we will assume that the rupture force of a fiber increases proportionally to the number of bonds in a cross section, and thus proportionally to its cross-sectional area. Thus, one would predict that the force for a solid fiber (rod) increases proportional to D2 and for a hollow fiber proportional to D1, which would result in a slope of 2 and 1, respectively, in the log FR versus log D of Fig. 5.
An exponent of 1.3 indicates that fibrin fibers have neither a solid nor a hollow cross section. We suggest that the number of molecules (bonds) per cross section varies as D1.3, which implies that the density of these fibers varies as D−0.7, i.e., the fiber density decreases with increasing fiber diameter (see Discussion). This model will be tested by other experiments (light intensity versus diameter) below.
To test if the rupture force is dependent on the speed of the manipulation (force rate) we have taken multiple rupture force data on a long stretch of fiber with constant diameter and varied the speed between 0.02 μm/s and 20 μm/s (three orders of magnitude).
In Fig. 5 B, the rupture force, FR, is plotted versus the logarithm of the pulling rate (force rate), r, as is typically done in single molecule force spectroscopy experiments. According to a model that was developed by Bell (1978) and Evans and Ritchie (1997), for irreversible transitions which can be modeled by a single transition state, the rupture force should increase linearly with ln(v). In particular, for such systems, the rupture force is given by
 |
where r is the pulling rate, koff (0) is the dissociation (rupture) rate at zero force and
 |
where kB is the Boltzmann constant, T is the temperature and x−1 is a constant related to the width of the potential well.
For our fibrin rupture experiments, the rupture force increases linearly with ln(r) from 0.02 μm/s to ∼2 μm/s (37 μN/s to 3700 μN/s) and it is constant above ∼2 μm/s (3700 μN/s). The dissociation rate, koff, which is obtained from the intercept of the extrapolated linear part of the curve with the abscissa, is on the order of 10−7 s−1. As expected, it is very low, indicative of very stable fibers.
One has to be careful not to overextend the analogy between the rupture of a fibrin fiber and the rupture of (single) molecules with a single transition state for which this theory was developed. Nevertheless, it is interesting to note that the rupture force of a fiber does increase approximately linearly with the logarithm of the force rate. This finding does indicate that the rupture events are irreversible (in a thermodynamic sense) and that rupture may be approximated by a single transition state.
The rupture force versus diameter data above (Fig. 5 A) led us to propose that the number of molecules, N, per cross section increases approximately as N ∼ D1.3. However, since the exact geometry of the rupture is not known we devised the following additional experiments to test this hypothesis. Fibrinogen was labeled with Oregon Green fluorophores and fibrin clots were formed. The fluorescently labeled fibrin clotted normally as judged from independent light scattering experiments. The clot was imaged by fluorescence microscopy (Fig. 6 A) and the fluorescence intensity of individual fibers as a function of their diameter was measured. Since all fibrin molecules in a fiber are equally labeled, the fluorescence intensity of a fiber is proportional to the number of molecules per cross section.
FIGURE 6.

(A) Fluorescence microscopy image of Oregon Green-labeled fibrin clot; (B) AFM image; and (C) zoomed AFM image of the same section of the fibrin clot. (D) Log-log plot of the fluorescence intensity versus fiber diameter; dotted line is best exponential curve fit yielding I ∼ D1.25±0.11
To determine the radius of the fibers, an AFM that was sitting on top of the fluorescence microscope was used to image the same region of the clot (Fig. 6, B and C). An AFM, instead of fluorescence microscopy had to be used to determine the radius of the fibers, because the fiber radii are smaller than the resolution power of optical microscopy.
Fig. 6 D shows a log-log plot of the fluorescence intensity of a fiber, I, versus its diameter, D. The data were fitted to the function I = c × Db, where c and D are fitting constants, which yielded I ∼ D1.25±0.11 (dotted line, Fig. 6 D).
Taken together, the force data and the light intensity data, strongly suggest that the number of molecules per fiber cross section varies as D1.3. This implies that the density of the fibers varies as D−0.7, i.e., the density decreases with increasing diameters (see Discussion).
These data suggest a model where the inside of a fibrin fiber is porous and is a fractal with fractal dimension of 1.3. Fractals have the property that their cross-sectional area scales as Df, where f is the fractal dimension and D is the diameter. That is, if the diameter of a fractal area is increased by a factor n, the cross-sectional area only increases by a factor of nf.
This fractal model is consistent with data obtain from turbidity measurements, that indicate that fibrin fibers are very porous as they consist of 70–80% solvent and only ∼20–30% protein (Carr and Hermans, 1978; Voter et al., 1986b) (see Discussion).
DISCUSSION
Although the polymerization of fibrin fibers was one of the first biological processes observed by AFM, the imaging capabilities of scanning probe microscopes have been utilized surprisingly few times to analyze fibrin fibers since these first images were obtained. There are just a few, somewhat contradictory reports on how to form fibers on various surfaces for imaging by AFM (Drake et al., 1989; Blinc et al., 2000; Vikinge et al., 2000; Sit and Marchant, 2001). In this article, we have reported a protocol for forming fibers on hydrophilic (Mica, silicon, glass, NH2-functionalized silicon) and hydrophobic (CH3-functionalized silicon) surfaces and for subsequent imaging and manipulating by AFM. We have not yet found a surface or surface treatment to which fibrin fibers do not attach. Indeed, such surface treatments would be very useful for medical implants and especially stents, which are used to prop open clogged arteries. Stents are notorious for getting clogged up again because platelets and fibrin fibers attach to them. Using the lateral force approach outlined here, it may be possible to determine the attachment force of fibers and platelets to various surfaces and draw conclusions about which surface treatments might be best for medical implants and stents.
Before this study, the mechanical properties of fibrin fibers had not yet been probed at all. This was due to a lack of protocols and techniques to determine the mechanical properties of the fibers. Our protocols for lateral force measurements are well suited for these measurements for two main reasons.
The force regime (several nanoNewtons to several microNewtons) for these measurements is well covered by our technique. We are not aware of other techniques that could easily measure forces in that entire regime. The forces that can be generated by laser traps (up to ∼100 pN) are too small. Theoretically, AFM normal force measurements could span this force range, but the problem lies in the fact that the fiber molecule under investigation needs to be suspended between the AFM tip and the surface. Not only is it difficult to create the proper tip-fiber and surface-fiber attachment, but those attachments also need to be stronger than the intra-fiber forces. Since the intra-fiber forces are larger than most attachment chemistries it would be difficult to design proper attachment procedures.
With our technique it is possible to collect images before and after a manipulation; hence, it is possible to visualize the result of the manipulation, which is not possible with many other manipulation techniques, such as laser traps or AFM normal force measurements.
We have found that the rupture force of fibrin fibers increases as FR ∼ D1.3, where D is the diameter of the fiber. Moreover, we have found that the fluorescence intensity of fibrin fibers increases as I ∼ D1.3.
These findings lead us to propose that the number of molecules per fiber cross section, N, increases as N ∼ D1.3. Note, that for a fiber with a solid cross section, N would increase as D2, (cross section of cylinder is π/4D2), and for a fiber with a completely hollow cross section would increase as D (circumference of cylinder is πD). Thus, our data suggest that the fiber is neither solid nor hollow and we propose the following model to explain this observation.
The molecule (bond) density of the fiber decreases with increasing radius according to  , i.e., the fiber is (on average) denser in the center than on the outside. Given this molecule density, the total number of molecules, N, in a cross section would be
 |
Assuming that the rupture force is proportional to the number of bonds in a cross section, the rupture force for such a fiber would also increase as D1.3.
We propose that the cross section of the fiber is a fractal with fractal dimension 1.3. This model has several attractive features.
It explains the observation that the rupture force and the light intensity increase as D1.3, since the number of molecules in a cross section increases as D1.3 for fractals with dimension 1.3.
Since fractals with f = 1.3 are very porous structures, such a model is consistent with turbidity studies that indicate that the fiber is very porous and is only comprised of 20–30% protein (Carr and Hermans, 1978; Voter et al., 1986b). It should be noted that these percentages relate to volume and that our data relate to the cross-sectional area. Let us assume that a protofibril has a cross-sectional area A1 (D ∼ 9 nm, A1 ∼ 30 nm2, consisting of all protein. According to our fractal model, a fiber which has a 10 times larger diameter (D ∼ 90 nm) would only have an increased cross-sectional protein content by a factor of 101.3 = 20 but a total increased fiber cross-sectional area (protein and water) by a factor of 102 = 100 (assuming a circular fiber). Thus, for this 90-nm fiber only 20% of the cross section consists of protein. Average fibers in a clot are on the order of 100 nm. Note, that the thicker the fiber, the lower the protein content. For a fiber that has a 100 times larger radius than one protofibrils (D = 900 nm), only 6.3% of the area is protein. To visualize the model we have in mind for the cross section of fibrin fibers one might imagine the structure of a horizontal cut through the crown of a tree (without leaves). Trees have fractal dimensions from ∼1.2 to 1.9 (Morse et al., 1985).
Fractals in biological systems are typically disordered. Thus, the inside of the fiber being a fractal may explain the observation by x-ray scattering data, that there is seemingly no ordered, lateral packing in fibers (Voter et al., 1986a).
Elastic light scattering experiments indicate that the whole clot is a fractal with fractal dimension between 1.2 and 1.4 (Ferri et al., 2002). Our model is an extension of this observation. We propose that this fractal structure extends into the inside of the fiber.
The rupture force for fibrin fibers is surprisingly large. The curve fit in Fig. 5 gives a rupture force of  , which would yield a force of ∼50 nN per fibrin monomer (D = 4.5 nm). This number seems especially large when considering data showing that the force to break one covalent bond is on the order of a few nanoNewtons (Grandbois et al., 1999). Thus, our data indicate that the many bonds that a fibrin monomer forms with its neighbors have a yield strength that is similar to several covalent bonds. By rolling a fibrin-functionalized microsphere over a fibrin-functionalized glass surface the rupture force between two fibrin monomers was estimated to be on the order of 400 pN (Lorthois et al., 2001), which is considerably smaller than the rupture force we would predict for breaking two monomers apart. There may be several reasons for this discrepancy. First, because of the limiting range of shear forces that could be applied to the spheres by flow, the 400 pN value is only semi-quantitative. Moreover, the buffer used in these experiments was hypotonic (80 mM NaCl) and it did not seem to contain CaCl2, which is an essential ingredient in clotting reactions. It could also be that our force value is overestimated. Although we took great care to accurately calculate the rupture force, significant errors can arise from the following sources. The dimension of the cantilever (especially the thickness, which enters the equation for the spring constant cubed) are only known to within a few percent. Errors and nonlinearities in the photodiode output and the electronics of the microscope may also contribute to the error in our measurements.
A good, standard force calibration method for lateral force measurements does not yet exist. However, the coefficient of friction between the silicon tip and the mica surface may serve as an internal control, to see if reasonable force values have been obtained. The kinetic frictional force between to surfaces sliding over each other is given by fk = μk × Fn, where μk is the coefficient of friction. Thus, by pushing the tip down on the surface with a normal force Fn and moving it laterally back and forth (friction loop) over the surface (without pushing fibers), the kinetic frictional force fk between the tip and the surface and, thus the frictional coefficient μk = fk/Fn can be obtained. We obtained values of 0.04 to 0.2, which is a reasonable number for the friction coefficient between a silicon tip and a protein coated mica surface (Bilas et al., 2004) and which, thus, supports our force values.
CONCLUSION
We have developed protocols to image and study the mechanical properties of fibrin fibers by AFM. Fibrin fibers were formed and imaged on a range of hydrophilic and hydrophobic surfaces. Our lateral force manipulations have the main advantage over other manipulation techniques that the effect of the manipulation can be visualized, since images before and after a manipulation are acquired. Our observations that rupture force of fibrin fibers and the fluorescence light intensity of fibrin fibers increases as D1.3 led us to propose that the number of molecules per fiber cross section increases as D1.3and that the inside of a fibrin fiber is a fractal with fractal dimension 1.3. This implies that the molecule density of fibrin fibers ρ(D) decreases with increasing diameter as r(D) ∼ D−0.7, i.e., thicker fibers are, on average, less dense.
Acknowledgments
We are grateful to Jennifer Moen, who has helped us with preparing the initial fibrin clots. We are also grateful to Warren Robinett, who first introduced us to fractals. We are grateful to Mark Willingham and Ken Grant (Wake Forest MICROMED) for help with TEM.
We acknowledge the support of National Institutes of Health resource, Computer Integrated Systems for Microscopy and Manipulation (CISMM), P41-EB002025-21. S.T.L. acknowledges support from National Institutes of Health grant HL31048 M.G. acknowledges support from the Research Corporation (RI0826), the American Cancer Society (IRG-93-035-6), the National Cancer Institute (1 R41 CA10312-01), and Wake Forest University for start-up funds and a Science Research Fund and a Cross-Campus grant.
References
- Bell, G. 1978. Models for the specific adhesion of cells to cells. Science. 200:616–627. [DOI] [PubMed] [Google Scholar]
- Bilas, P., L. Romana, B. Kraus, Y. Bercion, and J. L. Mansot. 2004. Quantitative characterization of friction coefficient using lateral force microscope in the wearless regime. Rev. Sci. Instrum. 75:415–421. [Google Scholar]
- Blinc, A., J. Magdic, J. Fric, and I. Musevic. 2000. Atomic force microscopy of fibrin networks and plasma clots during fibrinolysis. Fibrinolysis and Proteolysis. 14:288–299. [Google Scholar]
- Blomback, B., M. Blomback, and I. M. Nillson. 1958. Coagulation studies on reptilase, an extract of the venom from Bothrups jararaca. Thromb. Diath. Haemorrh. 1:76–86. [PubMed] [Google Scholar]
- Brown, J. H., N. Volkmann, G. Jun, A. H. Henschen-Edman, and C. Cohen. 2000. The crystal structure of modified bovine fibrinogen. Proc. Natl. Acad. Sci. USA. 97:85–90. [DOI] [PMC free article] [PubMed] [Google Scholar]
- Carr, M. E., and J. Hermans. 1978. Size and density of fibrin fibers from turbidity. Macromolecules. 11:46–50. [DOI] [PubMed] [Google Scholar]
- Carr, M. E., E. J. Martin, J. G. Kuhn, and S. V. Seremetis. 2003. Effects of recombinant factor VIIa on platelet function and clot structure in blood with deficient prothrombin conversion. Thromb Haemost. 89:803–811. [PubMed] [Google Scholar]
- Cohen, I., J. M. Gerrard, and J. G. White. 1982. Ultrastructure of clots during isometric contraction. J. Cell Biol. 93:775–787. [DOI] [PMC free article] [PubMed] [Google Scholar]
- Di Stasio, E., C. Nagaswami, J. W. Weisel, and E. Di Cera. 1998. Cl− regulates the structure of the fibrin clot. Biophys. J. 75:1973–1979. [DOI] [PMC free article] [PubMed] [Google Scholar]
- Doolittle, R. F. 2003. Structural basis of the fibrinogen-fibrin transformation: contributions from x-ray crystallography. Blood Rev. 17:33–41. [DOI] [PubMed] [Google Scholar]
- Drake, B., C. B. Prater, A. L. Weisenhorn, S. A. C. Gould, T. R. Albrecht, C. F. Quate, D. S. Cannell, H. G. Hansma, and P. K. Hansma. 1989. Imaging crystals, polymers and processes in water with the atomic force microscope. Science. 243:1586–1589. [DOI] [PubMed] [Google Scholar]
- Evans, E., and K. Ritchie. 1997. Dynamic strength of molecular adhesion bonds. Biophys. J. 72:1541–1555. [DOI] [PMC free article] [PubMed] [Google Scholar]
- Falvo, M. R., S. Washburn, R. Superfine, M. Finch, F. P. Brooks, V. Chi, and R. M. Taylor. 1997. Manipulation of individual viruses: friction and mechanical properties. Biophys. J. 72:1396–1403. [DOI] [PMC free article] [PubMed] [Google Scholar]
- Ferri, F., M. Greco, G. Arcovito, M. De Spirito, and M. Rocco. 2002. Structure of fibrin gels studied by elastic light scattering techniques: dependence of fractal dimension, gel crossover length, fiber diameter, and fiber density on monomer concentration. Phys. Rev. E. 66:011913–1-13. [DOI] [PubMed]
- Ferry, J. D., M. Miller, and S. Shulman. 1951. The conversion of fibrinogen to fibrin. VII. Rigidity and stress relaxation of fibrin clots; effects of calcium. Arch. Biochem. Biophys. 34:424–436. [DOI] [PubMed] [Google Scholar]
- Gerth, C., W. W. Roberts, and J. D. Ferry. 1974. Rheology of fibrin clots.2. Linear viscoelastic behavior in sheer creep. Biophys. Chem. 2:208–217. [DOI] [PubMed] [Google Scholar]
- Glover, C. J., L. V. McIntire, C. H. Brown, and E. A. Natelson. 1975. Rheological properties of fibrin clots—effects of fibrinogen concentration, factor-8 deficiency, and factor-13 inhibition. J. Lab. Clin. Med. 86:644–656. [PubMed] [Google Scholar]
- Grandbois, M., M. Beyer, M. Rief, H. Clausen-Schaumann, and H. E. Gaub. 1999. How strong is a covalent bond? Science. 283:1727–1730. [DOI] [PubMed] [Google Scholar]
- Guthold, M., M. Falvo, W. G. Matthews, S. Paulson, J. Mullin, S. Lord, D. Erie, S. Washburn, R. Superfine, F. P. Brooks, Jr., and R. M. Taylor 2nd. 1999. Investigation and modification of molecular structures using the nanoManipulator. J. Mol. Graph. Model. 17:187–197. [DOI] [PubMed] [Google Scholar]
- Guthold, M., M. R. Falvo, W. G. Matthews, S. Paulson, S. Washburn, D. Erie, R. Superfine, F. P. Brooks, and R. M. Taylor. 2000. Controlled manipulation of molecular samples with the nanoManipulator. IEEE/ASME Transactions on Mechatronics. 5:189–197. [Google Scholar]
- Hall, C. E., and H. S. Slayter. 1959. The fibrinogen molecule: its size, shape and mode of polymerization. J. Biophys. Biochem. Cytol. 5:11–15. [DOI] [PMC free article] [PubMed] [Google Scholar]
- Hartert, H. 1948. Blutgerinnungsstudien mit der Thrombelastographie, einem neuen Untersuchungsverfahren. Klin. Wochenschr. 26:577–583. [DOI] [PubMed] [Google Scholar]
- Janmey, P. A., E. J. Amis, and J. D. Ferry. 1982. Viscoelastic properties of fibrin clots in large shearing deformations. J. Rheol. 26:599–600. [Google Scholar]
- Janmey, P. A., E. J. Amis, and J. D. Ferry. 1983. Rheology of fibrin clots. 6. Stress-relaxation, creep, and differential dynamic modulus of fine clots in large shearing deformations. J. Rheol. 27:135–153. [Google Scholar]
- Lorand, L. 1994. Acquired inhibitors of fibrin stabilization: a class of hemorrhagic disorders of diverse origins. In Anticoagulants, Physiologic, Pathologic and Pharmacologic. D. Green, editor. CRC Press, Boca Raton, FL. 169–191.
- Lorand, L., M. S. Losowsky, and K. J. M. Miloszewski. 1980. Human Factor XIII: fibrin stabilization factor. In Progress in Hemostasis and Thrombosis. T. H. Spaet, editor. Grune and Stratton, New York. 245–290. [PubMed]
- Lorthois, S., P. Schmitz, and E. Angles-Cano. 2001. Experimental study of fibrin/fibrin-specific molecular interactions using a sphere/plane adhesion model. J. Colloid Interface Sci. 241:52–62. [DOI] [PubMed] [Google Scholar]
- Marti, O. 1999. AFM instrumentation and tips. In Handbook of Micro/Nano Tribology, 2nd ed. B. Bushan, editor. CRC Press, Boca Raton. 81–144.
- Mockros, L. F., W. W. Roberts, and L. Lorand. 1974. Viscoelastic properties of ligation-inhibited fibrin clots. Biophys. Chem. 2:164–169. [DOI] [PubMed] [Google Scholar]
- Morgenstern, E., U. Korell, and J. Richter. 1984. Platelets and fibrin strands during clot retraction. Thromb. Res. 33:617–623. [DOI] [PubMed] [Google Scholar]
- Morse, D. R., J. H. Lawton, N. M. Dodson, and J. H. Williams. 1985. Fractal dimension of vegetation and distribution of arthropod body lengths. Nature. 314:731–733. [Google Scholar]
- Nelb, G. W., C. Gerth, J. D. Ferry, and L. Lorand. 1976. Rheology of fibrin clots. 3. Shear creep and creep recovery of fine ligated and coarse unligated clots. Biophys. Chem. 5:377–387. [DOI] [PubMed] [Google Scholar]
- Nelb, G. W., G. W. Kamykowski, and J. D. Ferry. 1981. Rheology of fibrin clots. 5. Shear modulus, creep, and creep recovery of fine unligated clots. Biophys. Chem. 13:15–23. [DOI] [PubMed] [Google Scholar]
- Roberts, W. W., L. L. Lorand, and L. F. Mockros. 1973. Viscoelastic properties of fibrin clots. Biorheology. 10:29–42. [DOI] [PubMed] [Google Scholar]
- Ryan, E. A., L. F. Mockros, A. M. Stern, and L. Lorand. 1999a. Influence of a natural and a synthetic inhibitor of factor XIIIa on fibrin clot rheology. Biophys. J. 77:2827–2836. [DOI] [PMC free article] [PubMed] [Google Scholar]
- Ryan, E. A., L. F. Mockros, J. W. Weisel, and L. Lorand. 1999b. Structural origins of fibrin clot rheology. Biophys. J. 77:2813–2826. [DOI] [PMC free article] [PubMed] [Google Scholar]
- Scrutton, M. C., S. B. Rossmurphy, G. M. Bennett, Y. Stirling, and T. W. Meade. 1994. changes in clot deformability—a possible explanation for the epidemiologic association between plasma-fibrinogen concentration and myocardial-infarction. Blood Coagul. Fibrinolysis. 5:719–723. [DOI] [PubMed] [Google Scholar]
- Shen, L., and L. Lorand. 1983. Contribution of fibrin stabilization to clot strength — supplementation of factor-xiii-deficient plasma with the purified zymogen. J. Clin. Invest. 71:1336–1341. [DOI] [PMC free article] [PubMed] [Google Scholar]
- Shen, L. L., J. Hermans, J. McDonagh, R. P. McDonagh, and M. Carr. 1975. Effects of calcium-ion and covalent crosslinking on formation and elasticity of fibrin gels. Thromb. Res. 6:255–265. [DOI] [PubMed] [Google Scholar]
- Shen, L. L., R. P. McDonagh, J. McDonagh, and J. Hermans. 1974. fibrin gel structure—influence of calcium and covalent crosslinking on elasticity. Biochem. Biophys. Res. Commun. 56:793–798. [DOI] [PubMed] [Google Scholar]
- Sit, P. S., and R. E. Marchant. 2001. Surface-dependent differences in fibrin assembly visualized by atomic force microscopy. Surf. Sci. 491:421–432. [Google Scholar]
- Vikinge, T. P., K. M. Hansson, J. Benesch, K. Johansen, M. Ranby, T. L. Lindahl, B. Liedberg, I. Lundstom, and P. Tengvall. 2000. Blood plasma coagulation studied by surface plasmon resonance. J. Biomed. Opt. 5:51–55. [DOI] [PubMed] [Google Scholar]
- Voter, W. A., C. Lucaveche, A. E. Blaurock, and H. P. Erickson. 1986a. Lateral packing of protofibrils in fibrin fibers and fibrinogen polymers. Biopolymers. 25:2359–2373. [DOI] [PubMed] [Google Scholar]
- Voter, W. A., C. Lucaveche, and H. P. Erickson. 1986b. Concentration of protein in fibrin fibers and fibrinogen polymers determined by refractive-index matching. Biopolymers. 25:2375–2384. [DOI] [PubMed] [Google Scholar]
- Williams, R. C. 1981. Morphology of bovine fibrinogen monomers and fibrin oligomers. J. Mol. Biol. 150:399–408. [DOI] [PubMed] [Google Scholar]
- Yang, Z., J. M. Kollman, L. Pandi, and R. F. Doolittle. 2001. Crystal structure of native chicken fibrinogen at 2.7 angstrom resolution. Biochemistry. 40:12515–12523. [DOI] [PubMed] [Google Scholar]