

Abstract
The rates of consumption of different amino acids in protein synthesis are in general stoichiometrically coupled with coefficients determined by codon usage frequencies on translating ribosomes. We show that when the rates of synthesis of two or more amino acids are limiting for protein synthesis and exactly matching their coupled rates of consumption on translating ribosomes, the pools of aminoacyl-tRNAs in ternary complex with elongation factor Tu and GTP are hypersensitive to a variation in the rate of amino acid supply. This high sensitivity makes a macroscopic analysis inconclusive, because it is accompanied by almost free and anticorrelated diffusion in copy numbers of ternary complexes. This near-critical behavior is relevant for balanced growth of Escherichia coli cells in media that lack amino acids and for adaptation of E. coli cells after downshifts from amino-acid-containing to amino-acid-lacking growth media. The theoretical results are used to discuss transcriptional control of amino acid synthesis during multiple amino acid limitation, the recovery of E. coli cells after nutritional downshifts and to propose a robust mechanism for the regulation of RelA-dependent synthesis of the global effector molecule ppGpp.
INTRODUCTION
When Escherichia coli bacteria grow in rich media, the average rate of protein synthesis per ribosome is greater than during growth in amino acid lacking media with poor carbon sources (Bremer and Dennis, 1987; Dalbow and Bremer, 1975; Forchhammer and Lindahl, 1971; Pedersen, 1984; Young and Bremer, 1976). This suggests that the rate of supply of amino acids limits the rate of protein elongation on ribosomes in slowly growing bacteria and is in line with the observation that when amino acids are added to bacteria growing in minimal media, a rapid 40% increase in protein synthesis rate occurs before de novo synthesis of tRNAs, ribosomes, and translation factors has taken place (Brunschede et al., 1977). A straightforward interpretation of these data is that the aminoacylated (charged) fractions of tRNA (transfer RNA) molecules are much smaller in slowly growing bacteria than in rapidly growing bacteria and that the charged fractions increase rapidly after addition of amino acids to the medium. Further support for this view comes from the observation that expression of amino acid biosynthetic operons often is controlled by transcriptional attenuation, meaning that synthesis of amino acid producing enzymes requires that ribosomes are slowed down by low levels of aminoacyl-tRNA (Elf et al., 2003a; Landick and Yanofsky, 1987).
We have modeled amino acid limited protein synthesis in bacteria to analyze coordinated regulation of synthesis of different amino acids during slow growth in poor media. The study shows that it is difficult for bacterial control systems to maintain balanced synthesis and consumption of two or more amino acids with supply rates that are simultaneously rate limiting for protein synthesis. The reason is found to be a remarkably high sensitivity in the charged levels of two or more tRNAs in response to a change in one of the amino acid synthetic flows. Due to “switch properties” of the aminoacylation reaction, the supply of only one amino acid will be rate limiting and the charged level of only one tRNA will be near zero at any one time in a single cell. The identity of the limiting amino acid will, however, change in a cyclical fashion. We also demonstrate that even if the rates of synthesis of several amino acids could be perfectly balanced, the levels of their charged tRNAs would display very large, stochastic (random) fluctuations so that the concentration of only one aminoacyl-tRNA at the time would be close to zero also in this case.
Our results further suggest that only one amino acid and only one aminoacyl-tRNA concentration will approach zero after a downshift from a rich to a poor medium. We use these results to discuss the accuracy of protein synthesis (Kurland and Ehrenberg, 1984) in slowly growing bacteria, regulation of the expression of amino acid biosynthetic operons (Neidhardt et al., 1996; Umbarger, 1978), and induction of the stringent response (Cashel et al., 1996).
ANALYSIS AND RESULTS
Intracellular supply and demand for amino acids
Our model for the control of amino acid synthesis and consumption by ribosomes is based on a scheme (Fig. 1) with 20 pathways for amino acid synthesis (Neidhardt et al., 1996) and 20 aminoacylation reactions (Ibba and Söll, 2000) that lead to the formation of 20 types of ternary complex (containing elongation factor Tu (EF-Tu), GTP, and one aminoacyl-tRNA), which are the substrates for the mRNA-programmed ribosomes (Ehrenberg and Kurland, 1984). To highlight system properties when several types of amino acids are simultaneously rate limiting for intracellular protein production, the model has been simplified to contain only one type of tRNA cognate to each type of amino acid. The effects on the charged levels of tRNAs, which arise when one type of amino acid is cognate to several tRNA isoacceptors that read different codons (Björk, 1996), have been discussed elsewhere (Elf et al., 2003a).
FIGURE 1.

System overview. For i = 1, 2,…20, amino acid (aai) is synthesized at rate JEi and used to aminoacylate tRNA to aminoacyl-tRNA (aa-RNAi) at rate JSi. The aa-tRNAi is consumed as a fraction (fi) of the total flow JR into protein synthesis. The amino acid producing enzymes are feedback inhibited by their own amino acids. In E. coli, expression of biosynthetic enzymes is under repressor or attenuation control. The former senses amino acid concentration and the latter senses the rate of translation of codons for the controlled amino acid.
Transcriptional regulation of the operons for the amino acid synthetic enzymes in E. coli is carried out by repressor systems for the amino acids Arg, Lys, Met, and Asp (references in Elf et al., 2001). Ribosome-dependent attenuation is used for the amino acids Leu, His, Val, Ile, Thr, and Phe (Landick and Yanofsky, 1987) and a combination of repressor and attenuation systems is used for the trp operon (Yanofsky and Horn, 1994). In addition to these specific (local) control systems for amino acid production, many of the operons for amino acid synthesis are controlled by the global effector ppGpp (Cashel et al., 1996).
The repressors are allosterically activated for DNA binding and repression of operon expression when they form complexes with their specific amino acids (Jacob and Monod, 1961; Savageau, 1976). In this way, an increase in the concentration of a free amino acid reduces the expression of the operon for the enzymes that produce it (Fig. 1).
A ribosome-mediated attenuation system, in contrast, responds to the rate of translation of “own” codons in the leader sequence of the transcript from the amino acid biosynthetic operon. These own codons encode the amino acid that is synthesized by the enzymes that are expressed from the operon, and are therefore translated slowly when the charged level of their cognate transfer RNA is low and rapidly when it is high. Fast translation of own codons leads to termination of transcription, whereas slow translation of own codons leads to continued transcription into the protein-encoding genes of the operon. In this way, amino acid limitation turns on expression of the operon and excess supply of amino acid turns it off (Landick and Yanofsky, 1987; Yanofsky, 1981).
The flows through the pathways for amino acid synthesis are also under feedback control, in that the activities of the enzymes in the beginning of the pathways are inhibited by high concentrations of metabolites that are synthesized late in the pathways (Alves and Savageau, 2000; Umbarger, 1978). This kind of feedback control balances the metabolite flows in the different pathways to each other on a short timescale, when there are only small variations in enzyme concentrations (Bliss et al., 1982; Chassagnole et al., 2001a,b; Elf et al., 2001; Marr, 1991; Rais et al., 2001; Santillán and Mackey, 2001; Savageau, 1976). The balancing of the pathway flows on a longer timescale depends on the control of expression of the amino acid biosynthetic operons.
For the quantitative description (Appendix A) of the flows in Fig. 1, each amino acid is synthesized by a “block” of enzymes (Fell, 1996). The maximal rate of synthesis, ki, of amino acid number “i” is given by the concentration of enzyme block “i” multiplied by its specific rate constant (Appendix E). Feedback inhibition of amino acid synthesis is taken into account by multiplying each ki with the hyperbolic factor 1/(1 + xi/Ki), where xi is the concentration of free amino acid and Ki is the inhibition constant (Cornish-Bowden, 1995). Each amino acid is activated by its cognate aminoacyl-tRNA synthetase to aminoacyl-tRNA in an ATP-driven reaction (Ibba and Söll, 2000). When an aminoacyl-tRNA molecule leaves its synthetase, it rapidly forms a ternary complex with elongation factor Tu (EF-Tu) and GTP. Throughout the text all quantities and parameters are defined for single cells and not as population averages unless stated otherwise.
The rates of consumption of different amino acids in protein synthesis are stoichiometrically coupled
The steady-state rate of consumption of an aminoacyl-tRNA of type “i” is determined by the total rate, JR, of protein synthesis, multiplied by the frequency, fi, by which its cognate codons occur on translating ribosomes (Fig. 1) (Elf et al., 2003a). The rate JR is defined as the concentration of ribosomes in elongation phase multiplied with the average rate of peptide elongation (Ehrenberg and Kurland, 1984). Therefore, the rates of consumption of all amino acids are stoichiometrically coupled through their codon frequencies. When the rates of supply of all amino acids are in excess over their rates of consumption in peptide synthesis, JR is equal to Jmax, and Jmax is determined by the concentration of ribosomes engaged in protein elongation, the kinetic constants of the ribosome and the intracellular concentrations of all ternary complexes and elongation factor G (EF-G) (Ehrenberg and Kurland, 1984; Marr, 1991).
However, when the rates of supply of amino acids are rate limiting for peptide elongation, this study shows that JR is determined by the rate of supply of the amino acid that has the smallest ratio between its rate of supply (ki) and codon frequency (fi). In other words, when at least one parameter si, where si = ki/(fiJmax), is smaller than one, then the rate of supply of the amino acid with the smallest si value, si = smin, will limit the total rate of protein synthesis to JR = sminJmax. For convenience, we will use the approximation  where r is the concentration of elongating ribosomes and kR is the kcat for peptide elongation (see definition in Appendix A). This approximation requires, firstly, that all tRNAs are completely charged with their respective amino acids, so that the ribosome is near saturated with ternary complex. Secondly, that
  where fi is the fraction of all peptide bonds with amino acid i as acceptor in the peptidyl-transfer reaction, KR is the ribosome's Km value for ternary complexes, and t0i is the total concentration of tRNA i.
Two rate-limiting amino acids
When several pathways synthesize amino acids at rates that fall short of the current demand in protein synthesis (i.e., they have si values smaller than one), they are all potentially limiting for protein synthesis. To illustrate, we will inspect the special case when s2 is constant and smaller than one and s1 varies from small to large values, whereas all other si values are larger than one (Fig. 2). This example clarifies what happens during balanced growth in poor media, when the rate of amino acid supply is limiting for protein synthesis (Bremer and Dennis, 1987; Dalbow and Bremer, 1975; Forchhammer and Lindahl, 1971; Pedersen, 1984; Young and Bremer, 1976). It can also be used to illustrate the situation after a downshift from a medium containing all amino acids to a medium where several amino acids are missing. The case, when the rate of supply of only one amino acid is rate limiting for protein production has been discussed earlier (Elf et al., 2001).
FIGURE 2.
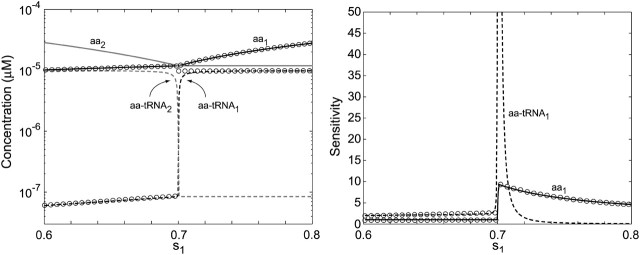
Amino acid and aminoacyl-tRNA concentrations and sensitivities for varying amino acid synthetic capacity (s1). (Left) The steady-state concentrations for aa1, aa2, aa-tRNA1, and aa-tRNA2 as functions of s1 with s2 = 0.7 and s3-20 = 1. (Right) Sensitivity amplification for the stationary concentrations of aa1 (solid line) and aa-tRNA1 (dashed line) as functions of s1. Analytical approximations for concentrations and sensitivity amplifications (Table 1) are shown as circles. At balanced synthesis (s1 = s2 = 0.7), the sensitivity amplification of the concentration of aa1-tRNA to a variation in s1 exceeds 10,000.
When s1 < s2, pathway number one is rate limiting for protein synthesis and when s1 > s2, pathway number two is instead rate limiting. When s1 = s2, the rates of synthesis of the two amino acids are exactly balanced to their rates of consumption in protein synthesis. The concentrations of amino acids and ternary complexes in these pathways and their sensitivities (Appendix B) (Goldbeter and Koshland, 1982; Savageau, 1971, 1976) to a variation in s1 are shown as functions of s1 in Fig. 2.
Analytical approximations of concentrations and sensitivities below (s1 < s2), above (s1 > s2), and at (s1 = s2) the balance point are given in Table 2 and shown in Fig. 2. When s1 increases from the left toward the balance point, the concentration of amino acid 1 increases in proportion to s1, but the concentration of ternary complex 1 rises more steeply. In this range, the concentration of ternary complex 2 is almost constant, whereas the concentration of amino acid 2 decreases. When s1 increases to the right of the balance point, the concentration of amino acid 1 increases. At the same time, the concentration of ternary complex 1 is constant and at a high level corresponding to near 100% charging of tRNA 1. The concentrations of amino acid and ternary complex of type 2 are constant at low levels in this range. The sensitivity in the concentration of amino acid 1 is one to the left of the balance point and decreases rapidly from a high value to the right of the balance point. The corresponding sensitivity of ternary complex 1 is higher than one to the left of the balance point and falls very rapidly from a high value to its right. These concentration variations with changing s1 to the left and right of the balance point are gradual rather than sharp, and follow simple rules (Table 1). Very close to the balance point itself, the situation is different.
TABLE 2.
Parameters for E. coli used in Figs. 2–4 and variables used in the model
| Parameter (i = 1,2) | Description | Value used | Reference |
|---|---|---|---|
| kSi | Maximum rate of synthetase i | 100 s−1 | (Pedersen et al., 1978) |
| kR | kcat of translation | 20 s−1 | (Bremer and Dennis, 1987) |
| kai | See Appendix A | 106 M−1s−1 | (Schomburg et al., 2002) |
| KSi | Dissociation constant of deacylated tRNA i and synthetase i | 10−6 M | (Schomburg et al., 2002) |
| Ki | Feedback inhibition constant for aai | 10−4 M | (Chassagnole et al., 2001b; Neidhardt et al., 1996) |
| KRi | Km for ternary complex i in protein synthesis | 10−6 M | (Pavlov and Ehrenberg, 1996) |
| t0i | Total concentration of tRNA for amino acid i | 10−5 M | (Dong et al., 1996) |
| [Si] | Total concentration of aminoacyl-tRNA synthetase i | 10−6 M | (Pedersen et al., 1978) |
| r | Ribosome concentration | 1.67 × 10⁻⁵ M | (Bremer and Dennis, 1987; Donachie and Robinson, 1987) |
| fi | Usage frequency of amino acid i in protein synthesis | 0.05 | (Dong et al., 1996) |
| Variables |
Description |
||
| xi | Concentration of free amino acid i | ||
| yi | Concentration of ternary complex i | ||
| ti | Concentration of deacylated tRNA i | ||
| ki | Uninhibited amino acid i synthesis rate | ||
| si | Normalized uninhibited synthesis rate of amino acid i | ||
 |
Normalized inhibited synthesis rate of amino acid i | ||
| JR | Total flow of amino acid into proteins | ||
| Jmax | Maximal flow of amino acid into proteins | ||
| v | Average translation rate per ribosome | ||
| vmax | Maximal translation rate per ribosome | ||
| γ | Fraction of RelA bound to the ribosome |
We estimate the experimental values to be correct with sufficient accuracy to allow for the analytical approximations in Table 1.
TABLE 1.
Analytical approximations of stationary concentrations and sensitivities
Amino acid, 
|
Charged tRNA, 
|
 |
 |
|
|---|---|---|---|---|
| s1 < s2 |  |
 |
1 |  |
| s1 = s2 = s |  |
 |
 |
 |
| s1 > s2 |  |
t01 |  |
0 |
 Feedback inhibition is included in the supply of the limiting pathway as
  The expressions for balanced synthesis are derived for f1 = f2 = f and [t01] = [t02] = [t0]. β is a value between 0.5 and 1, as explained in Appendix C.
When s1 approaches the balance point from the left, the concentration of ternary complex 1 changes from a value close to zero to a value corresponding to near 100% charging of tRNA 1 in an extremely small interval of the s1 variation. In this region, the concentration of ternary complex 1 limits protein synthesis. When s1 moves away from the balance point to the right, the concentration of ternary complex 2 rapidly decreases toward its rate-limiting value. In this region, ternary complex 2 limits protein synthesis. At the balance point itself, both ternary complex concentrations are rate limiting. Here, the sensitivity of the concentration of ternary complex 1 to a variation in s1 is >10,000 with realistic model parameters (Tables 1 and 2). This extremely high-sensitivity amplification in a single point means that the stationary ternary complex concentration responds as a Boolean step function to the rate of synthesis of its amino acid. The extreme sharpness of the response is caused by near-zero-order kinetics in two dimensions, as previously discussed for a simple anabolic reaction in (Elf et al., 2003b). This means that an increase in one of the ternary complex concentrations can be compensated for by a complementary decrease in the concentration of the other, such that the average rate of reading of their two codons remains unaltered. By itself, this scenario would lead to infinite sensitivity amplification, if it were not for the fact that ternary complex variations affect the rates of synthesis of the amino acids. When the concentration of a ternary complex goes up or down, the concentration of the corresponding deacylated tRNA will change in the opposite direction because the total concentration of tRNA is constant. Because a deacylated tRNA is one of the substrates for the aminoacyl-tRNA synthetase, the concentration of deacylated tRNA correlates positively with the rate of aminoacylation. Accordingly, one would expect that a decrease (or increase) in ternary complex concentration would speed up (or reduce) its synthesis via the aminoacylation pathway. However, when the activity of a synthetase decreases (or increases), its cognate amino acid pool increases (or decreases), respectively, which compensates for the original loss (or gain) of the rate of the synthetase. Despite this, the sensitivity parameters are finite and the reason can ultimately be traced to the feedback inhibition of amino acid synthesis. In the pathway, where the concentration of deacylated tRNA decreases and the amino acid pool increases, feedback inhibition will reduce the rate of synthesis of that amino acid and thereby limit the capacity of the synthetase to compensate for a decrease in deacylated tRNA. This effect limits the sensitivity of aminoacyl-tRNA pools at the balance point, but allows it to take very high values.
An analytical approximation for the relative variation in ternary complex 1 to a relative variation in the signal s1, i.e., the sensitivity amplification ay1s1, exactly at the balance point is derived in Appendix C (see also Table 2). The parameter ay1s1 can be described as a cascade of three sensitivity amplifications, derived for the simple case when the rate of synthesis of amino acid 2 is unaffected by changes in the rate of supply of amino acid 1, and a proportionality factor β:
 |
(1) |
The amplification  is the relative variation in the concentration y1 of ternary complex 1 to a relative variation in the concentration of deacylated tRNA, t1 = t01 − y1, of type 1. The amplification
  is the relative variation in t1 to a relative variation in the concentration x1 of amino acid 1. The amplification
  is the relative variation in x1 to a relative variation in the signal s1. Effects of changes in the rate of supply of amino acid 1 on the rate of supply of amino acid 2 are taken care of by the factor β, which under the chosen conditions takes values between 0.5 and 1.0 (Appendix C). The partial sensitivity amplifications in Eq. 1, expressed in terms of the parameters in Table 1, are
 |
(2) |
The bar indicates steady-state values of the concentrations of deacylated tRNA ( ), ternary complex (
 ) or amino acid (
 ) at the balance point. The factor
  is numerically large when
  is small in relation to
  The factor
  is numerically large when the dissociation constant (KS) for the binding of deacylated tRNA to the synthetase is much smaller than
  and the synthetase is unsaturated with amino acid (kS[S1] > k1). The factor
  is numerically large when
  is small compared to the feedback inhibition constant K1. Because
  (Table 1 legend), the sensitivity amplification
  is proportional to (1/s1)3.
Near-critical fluctuations in ternary complex concentrations: multidimensional zero-order kinetics
The stochastic nature of chemical reactions always leads to internal fluctuations in the numbers of chemically reacting molecules (McQuarrie, 1967; van Kampen, 1997). Fluctuations can be significant in intracellular chemical reactions, because they occur far from thermodynamic equilibrium (Elf and Ehrenberg, 2003; Keizer, 1987), and often involve small numbers of reactants. Near-zero-order kinetics, where the supply and consumption rate of a metabolite is insensitive to the amount of the metabolite, is known to cause anomalously large fluctuations in molecule numbers. There is a positive correlation between the macroscopic sensitivity of the concentrations of reactants to a variation in flow rate, on one hand, and the relative size of the fluctuations in molecule numbers, on the other (Berg et al., 2000; Elf and Ehrenberg, 2003; Elf et al., 2003b). In one-component systems, the variance of molecule number fluctuations normalized to the mean, i.e., the Fano-factor (Fano, 1947), can be approximated by the sensitivity of the molecule concentration to a variation in its rate of synthesis, provided that only one molecule is synthesized or consumed at the time (Elf et al., 2003b; Paulsson and Ehrenberg, 2001). This is a result from the linear noise approximation (LNA) (Elf and Ehrenberg, 2003; Elf et al., 2003b; van Kampen, 1997), which is a method to estimate sizes and correlations of internal fluctuations based on flow rates, stoichiometries, and locally linearized reaction rates.
The Fano-factors, approximated by sensitivities or calculated from Monte Carlo simulations (Gillespie, 1976) of the master equation (van Kampen, 1997), are shown in Fig. 3. It can be seen that the Fano-factors for the numbers of amino acids and ternary complexes of type 1 can be approximated by their respective sensitivities to a variation of s1 below the balance point (s1 < s2 = 0.7) (Fig. 2). Here, the concentrations of amino acid and ternary complex fluctuate independently of each other and of the other pathways in Fig. 1, so that each concentration can be treated as a single-component system. The number of amino acids has near-Poisson statistics with a Fano-factor just below one, whereas the number of ternary complexes has a Fano-factor larger than one, which increases with increasing values of s1. To keep the number of free parameters low, we have assumed that the enzyme/metabolite complexes equilibrate on a faster timescale than the characteristic correlation time of metabolite pools. When this is the case, the macroscopic rate equations in Appendix A approximate the transition rates of the elementary reactions (Keizer, 1987).
FIGURE 3.
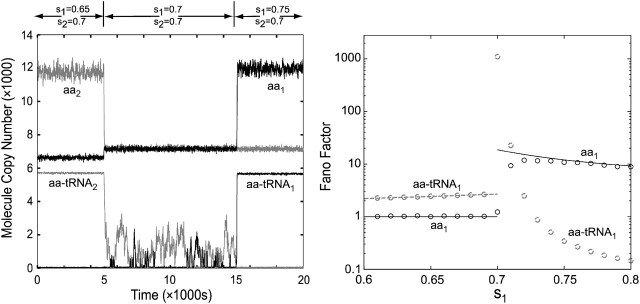
Near-critical fluctuations in amino acid and aminoacyl-tRNA concentrations. (Left) Stochastic trajectories obtained with the Direct Method (Gillespie, 1976). The values of s1 and s2 in different regions are shown at the top of the figure and s3-20 = 1. At the balance point (s1 = s2), the fluctuations in aminoacyl-tRNA levels are large and anticorrelated. (Right) Fano-factors (variance/mean) for amino acid i and aminoacyl-tRNA i concentrations estimated with the Gillespie simulation (circles) with the linear noise approximation (solid lines). The Fano-factors are equal to the macroscopic sensitivity amplifications (Fig. 2) except: i), at the critical point (s1 = s2 = 0.7), where the Fano-factor estimated from Monte Carlo Simulations data (≈1000) is much smaller than the sensitivity amplification (>10,000) (Fig. 2 legend); and ii), for the amino acid concentration in the s1 > s2 range, where the Fano-factor (black circles or solid line) is twice the sensitivity amplification.
Above the balance point (s1 > s2 = 0.7), the sensitivity and Fano-factor of ternary complex 1 are close to zero, whereas the sensitivity and Fano-factor of amino acid 1 remain high. In this region, the Fano-factor is not equal to, but almost exactly twice, the sensitivity of amino acid 1 to a variation in s1, independently of the efficiency of the aminoacylation reaction. The reason is that random variations in the outflow from the amino acid pool, due to fluctuations in the number of deacylated tRNA molecules, enhance the Fano-factor exactly twofold but have no effect on the macroscopic sensitivity parameter (Appendix D).
At the balance point itself, the sensitivities of ternary complexes of type 1 and 2 to a variation in s1 (Fig. 2) and the Fano-factors for these complexes (Fig. 3) are both extremely large (Fig. 3, left middle). The fluctuations in the two ternary complex pools are large, slow, and anticorrelated such that an almost constant rate of protein synthesis is always maintained. The large and slow fluctuations emerge because the system is near a critical point, where the macroscopic steady state is only weakly attracting and where the amino acid synthetic flows are very insensitive to ternary complex variations (zero-order ultrasensitivity) (Berg et al., 2000). Similar, but much less dramatic, near-critical fluctuations were earlier reported for a simple bisubstrate metabolic reaction lacking the specifics of aminoacylation and protein synthesis (Elf et al., 2003b). In this case, the Fano-factors estimated from the sensitivity parameters are larger than the more accurate estimates from Monte Carlo simulations based on the master equation. The reason is that Fano-factor estimates from the LNA can be in significant error, when the fluctuations that it predicts extend far beyond the validity of the local linearization of the rate laws. The ternary complex concentrations have distinct maximal values, determined by the total tRNA concentrations, which provide upper limits to the fluctuations that are not accounted for by the local linearization procedure of the LNA.
Transcriptional control of amino acid synthetic pathways during balanced growth in poor media and after downshifts from rich to poor media
As we have seen in the previous sections, the aminoacyl-tRNA levels display near-critical behavior under conditions where the growth rate is limited by the supply of two amino acids. Next we will consider an idealized case, where it is assumed that the rates of synthesis of all 20 amino acids are rate limiting for bacterial growth. Further, that all rates of synthesis are exactly balanced to their rates of consumption by ribosomes that elongate peptides at 85% (v = JR/r = 15.5 amino acids per second per ribosome) of their maximal rate (vmax = Jmax/r = 18.3 amino acids per second per ribosome), i.e.,  (Fig. 4 A). The concentrations of the different types of amino acids (Fig. 4 A, top) and the total rate of protein elongation (Fig. 4 A, top insert) display small and rapidly decaying fluctuations around their averages. The reason why the fluctuations in the amino acid pools are small and rapid is the presence of product inhibition in all pathways for amino acid synthesis (Fig. 1). In contrast, the 20 aminoacyl-tRNA concentrations display very large and slowly decaying fluctuations around their averages (Fig. 4 A, bottom). The reason for these fluctuations is multidimensional zero-order kinetics for anticorrelated pools of aminoacyl-tRNAs, which was analyzed in detail for the two-dimensional case (Figs. 2 and 3; Table 1).
FIGURE 4.
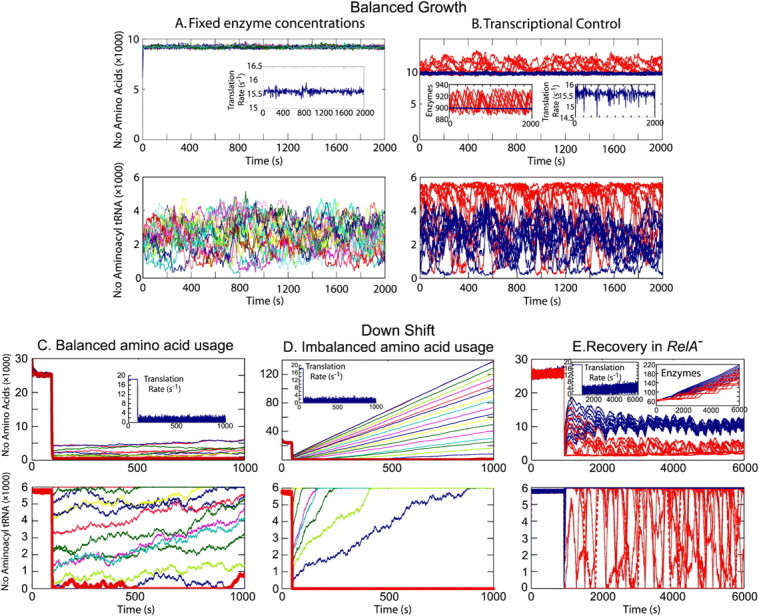
Simulations of amino acid (top figures) and aminoacyl-tRNA (bottom figures) dynamics for 20 coupled pathways. (A) Balanced growth and fixed enzyme concentrations in the near critical region. The capacities (ki) of the amino acid biosynthetic enzymes are constant and exactly balanced to each other at a supply rate corresponding to 85% saturation of the ribosome. The average rate of translation over all codons is given in the insert. The rate of translation when all tRNAs are fully charged is 18.2 s−1. The tRNA charging levels fluctuate almost freely under the constraint that the rate of translation is nearly constant. There is no external supply of amino acids. (B) Transcriptional control. The enzyme systems are under transcriptional control. Ten pathways are regulated by repressor systems, sensing amino acid concentrations (blue). Ten pathways are controlled by attenuation systems sensing the rate of translation of selected codons (red). The transcriptional control is modeled deterministically (Appendix E) such that only noise effects originating at the metabolite level are considered. The copy numbers of the biosynthetic enzymes are plotted in an insert. The repressor systems that sense the amino acids can generally keep the enzymes they control at a fixed level. In contrast only, one attenuation controlled operon is expressed at the time. (C) Downshift, with balanced amino acid usage to supply. Amino acids are first supplied externally, and then suddenly removed. The amino acids for the remaining protein synthesis (insert) are supplied by protein degradation. The proportion between amino acids in the degraded protein is proportional to the amino acid usage in protein synthesis. As a consequence, the system operates in the near-critical region after the downshift. Which ternary complex that is limiting for protein synthesis changes over time. No stress responses or transcriptional control systems are included in the model. (D) Downshift, with unbalanced amino acid usage to supply. Same as in panel C, the supply of each amino acid from degraded protein is equal (5% of each), but the amino acid usage of different amino acids after the downshift is not equal (fi = 4–6%). The amino acid with the lowest supply to usage ratio limits protein synthesis, and all other amino acid concentrations increase to very high levels. No stress responses or transcriptional control systems are included in the model. (E) Slow recovery after downshift in relA− strains. Amino acids are first supplied externally and from enzymes expressed at a basal level (insert), and then the external supply is suddenly removed. The amino acid and tRNA charging levels drop, and the transcriptional control systems from amino acid biosynthetic enzymes are activated. The stringent response is not considered (relA−). The concentrations of the enzyme systems slowly increase, until they eventually reach their balanced growth levels described in panel B. The very slow recovery is due to the slow rate of translation, which i), makes the enzyme synthesis slow, and ii), delays the responses after the transcriptional control signals are given. The delay is ∼150 s directly after the downshift, which gradually decreases to ∼15 s at full rate of translation.
In the more realistic simulation of growth in minimal media, including transcriptional regulation of amino acid synthesizing enzymes, with 10 pathways under repressor control (Jacob and Monod, 1961; Savageau, 1976) and 10 pathways controlled by ribosome-mediated transcriptional attenuation (Landick and Yanofsky, 1987), there is more variation in the total rate of protein synthesis (Fig. 4 B, top right insert), concentrations of amino acids (Fig. 4 B, top) and aminoacyl-tRNA pools (Fig. 4 B, bottom) than in the perfectly balanced case (Fig. 4 A). In this simulation, the copy number fluctuations in the amino acid synthesizing enzymes have been neglected, to highlight the effects of transcriptional control on the idealized system in Fig. 4 A. The concentrations of aminoacyl-tRNAs cognate to amino acids under attenuation control vary between their maximal values, set by the total concentrations of tRNA molecules, and low values corresponding to translation rates matching the currently limiting amino acid supply. Aminoacyl-tRNAs, with amino acids under repressor control, display considerably less variation (Fig. 4 B, bottom). The difference between the two groups of aminoacyl-tRNAs corresponds to much larger variations in their respective pools of amino acids (Fig. 4 B, top), which is a result of larger variations in the concentrations of attenuation controlled amino acid synthetic enzymes than of enzymes under repressor control (Fig. 4 B, top left insert). This observation is in line with a previous report, suggesting that repressor control is better than attenuation control, when it comes to keeping the supply of amino acid balanced to the demand in protein synthesis (Elf et al., 2001). This result means that transcriptional control systems cannot eliminate fluctuations in aminoacyl-tRNA or amino acid levels, and that transcriptional feedback, based on the attenuation mechanism, enhances, rather than diminishes, variations in amino acid and aminoacyl-tRNA concentrations.
The prediction that one aminoacyl-tRNA concentration at the time has a low value, while the levels of the other charged tRNAs have high values (Fig. 4 B, bottom), has implications for the propensity of ribosomes to make amino acid substitution errors. We estimate that the overall missense error frequency in the case shown in Fig. 4 B is about twofold higher than in a reference case with all aminoacyl-tRNA concentrations at similar levels at all times. This error enhancing effect may seem small, given the large fluctuations in aminoacyl-tRNA concentrations that we predict. The explanation is that when one aminoacyl-tRNA concentration is low, the concentrations of the others are ∼40-fold higher. This leads to a 40-fold increased error frequency at codons read by the aminoacyl-tRNA with the low concentration compared to the reference case when all concentrations of charged tRNAs are equal. Because, however, the increased error frequency only occurs for one codon family out of 20 at the time, the factor of 40 should be divided by 20 to obtain the time-averaged error frequency at all codons.
When E. coli and related bacteria are subjected to a sudden deterioration of the medium, amino acid starvation will often follow, which leads to the stringent response (Cashel et al., 1996), and eventually to adaptation and exponential growth in the new medium. Such a situation arises, e.g., when a medium that contains all 20 amino acids is swapped for a medium lacking amino acids. Immediately after such a downshift, amino acids are made available for protein production primarily from degradation of existing proteins, rather than from de novo synthesis of amino acids (Kuroda et al., 2001). In this situation there is no net growth of cell mass and the overall rate of protein synthesis (and degradation) is ∼5% of Jmax (Goldberg and St. John, 1976). If the proteins that are made after the downshift have the same average amino acid composition as the proteins that were made before the shift, then the supply flows of the different amino acids from the degradation of existing proteins will be exactly balanced to the demands for those amino acids ( ). This case is illustrated in Fig. 4 C. If, in contrast, the newly made proteins have a different amino acid composition than the preshift proteins, then the rates of supply of the different amino acids will not match the demand. This case is illustrated in Fig. 4 D. Because the supply rates for the different amino acids depend on proteolytic activities, there are no feedback systems that operate to balance those flows to their respective demands, in contrast to the case with transcriptional control illustrated in Fig. 4 B. The downshift scenarios in Fig. 4, C and D, do not include the stringent response, with rapid synthesis of ppGpp (Cashel et al., 1996), strong reduction of the total rate of transcription (Ryals and Bremer, 1982), and a shift from synthesis of ribosomal RNA and tRNA to messenger RNA (Ryals et al., 1982). Accordingly, these scenarios depict the early phase after a downshift during which time the stringent response is normally induced.
In the balanced case (Fig. 4 C), the aminoacyl-tRNA levels display near-critical behavior with one concentration at the time being close to zero, while the concentrations of the other 19 levels diffuse almost freely between low and high levels. The main difference between the idealized case in Fig. 4 A and the case in Fig. 4 C is that the amino acid limitation is much more severe in the latter (JR = 0.05Jmax) than in the former (JR = 0.85Jmax) case. In the unbalanced case (Fig. 4 D), all amino acid and ternary complex concentrations initially go to low values. Then, one amino acid and the corresponding ternary complex concentration remain low, while the other 19 amino acid and ternary complex concentrations slowly return to high values. In this scenario, the same amino acid and ternary complex concentration remain low over time. The rate-limiting amino acid is the one for which the frequency of occurrence in preshift proteins divided by the frequency of occurrence in postshift proteins is the smallest.
After the initial phase succeeding the downshift, amino acid synthetic enzymes contribute significantly to the rates of supply of amino acids. This type of recovery to the exponential growth situation depicted in Fig. 4 B is illustrated in Fig. 4 E for mutant bacteria that lack the stringent response (relA−). The concentrations of amino-acid-producing enzymes are slowly increasing with time (Fig. 4 E, top right insert), and this leads to an increased rate of peptide bond formation per ribosome (Fig. 4 E, top left insert). As in Fig. 4 B, one aminoacyl-tRNA concentration at the time is very low and the identity of the limiting aminoacyl-tRNA is shifting in the minute timescale.
Stringent control and the degree of amino acid limitation
It is known that the case depicted in Fig. 4 B, i.e., exponential growth in minimal media, is associated with low RelA-dependent synthesis of ppGpp (Lazzarini et al., 1971), whereas the cases in Fig. 4, C and D, are associated with the stringent response and very high rates of synthesis of ppGpp by RelA (Cashel and Gallant, 1968; Cashel et al., 1996; Haseltine and Block, 1973). This is surprising, because both cases are associated with high concentrations of pausing ribosomes with open A-site and large concentrations of deacylated tRNA cognate to the codon of the starved ribosomes. We suggest that this dramatic difference in ppGpp synthesis during balanced growth with mild amino acid limitation (Fig. 4 B), on one hand, and the downshift situation in Fig. 4, C or D, on the other, is accomplished by a mechanism for deactivation of ppGpp synthesis, in which aminoacyl-tRNA in complex with elongation factor Tu and GTP removes the ppGpp synthesizing enzyme RelA from the ribosome. To see the implications of such a model, we first introduce average rates of peptide bond formation per ribosome under amino acid limitation (v = JR/r) and amino acid excess (vmax = Jmax/r). The fraction, rA/r, of ribosomes with an open A-site at the amino acid starved codons is then approximated by
 |
(3) |
The rate of binding of RelA to ribosomes pausing at amino acid starved codons is proportional to the concentration (1 − γ)[RelA] of free RelA molecules in the cell, the association rate constant krel for RelA binding and the concentration rA of pausing ribosomes:
 |
(4) |
where γ is the fraction of RelA bound to ribosomes. The rate of RelA release from ribosomes by the postulated action of aminoacyl-tRNA in complex with EF-Tu·GTP is proportional to the rate, vS, by which a ternary complex associates with a starved codon, and the concentration γ [RelA] of ribosome bound RelA molecules. Because  the rate of RelA release from the ribosome is given by
 |
(5) |
The steady-state rate of association of RelA to ribosomes must equal the steady-state rate of dissociation, which gives the following approximation for the ribosome bound, fraction γ of RelA.
 |
(6) |
If, to simplify, we also assume that the concentration of free deacylated tRNA is roughly constant, then γ is proportional to the ppGpp synthesizing activity of RelA in the cell. How the RelA activity depends on v is illustrated in Fig. 5 for different values  It is seen how γ remains very low when v decreases from its largest value vmax, until there is a sharp takeoff in the activity with γ rapidly approaching one.
FIGURE 5.

PS1 activity. The fraction of RelA active in ppGpp synthesis (γ, y axis) as a function of the average rate of translation (x axis) for different association rate constants, krel, for free RelA to ribosomes with open A-site. Included in the figure is the curve for the passive model, where RelA binds to ribosomes in a rapid equilibrium with a dissociation constant of 2.6 × 10⁻⁷M.
The response in RelA binding to starvation suggested by this mechanism should be compared to the passive model where RelA simply binds to ribosomes with open A-site (Wendrich et al., 2002). The fraction of ribosome bound RelA that synthesizes ppGpp is in this model the simple equilibrium expression
 |
(7) |
where KRelA is the dissociation constant for binding of RelA to ribosomes with an open A-site. KRelA has been estimated to be ≈2.6 × 10⁻⁷ M (Wendrich et al., 2002), which would imply near-full induction of the stringent response also for moderate amino acid limitation (Fig. 5).
CONCLUSIONS
In protein synthesis, there is a stoichiometric coupling between the rates of consumption of all 20 amino acids, meaning that they always disappear into nascent peptides in proportion to how often their cognate codons appear on translating ribosomes (Fig. 1). One consequence of this flow coupling is that a rate-limiting supply of one amino acid will control the rates of consumption of all other amino acids (Elf et al., 2003a). Experiments (Brunschede et al., 1977; Forchhammer and Lindahl, 1971; Pedersen, 1984; Young and Bremer, 1976) suggesting that E. coli cells growing in poor and amino-acid-lacking media are limited by amino acid supply, rather than by ribosome capacity, have motivated this modeling approach. We show that when the rates of supply of several amino acids are simultaneously rate limiting for protein synthesis, the concentrations of the corresponding ternary complex (aminoacyl-tRNA·EF-Tu·GTP) levels become hypersensitive to a variation in the rate of supply for any one of these limiting amino acids. The sensitivity is quantified by the “sensitivity amplification” (logarithmic gain) (Goldbeter and Koshland, 1982; Savageau, 1971); here defined as the steady-state percentage change in a ternary complex concentration normalized to the percentage change in the rate of supply of the corresponding amino acid. At the point of balanced supply of two rate-limiting amino acids the logarithmic gain is found to be >10,000 with realistic parameter choices for E. coli growing in poor media (Table 2). Such high numbers for the logarithmic gain have to our knowledge not been previously reported for any enzymatic system. The hypersensitivity emerges from zero-order kinetics of combinations of ternary complex levels that are simultaneously rate limiting for protein synthesis: when one ternary complex level goes down, a compensating increase in the concentration of another ternary complex almost exactly preserves all flows from amino acid synthesis to protein (see Fig. 2). This is a novel variant of zero-order kinetics (Goldbeter and Koshland, 1981) in several dimensions (Elf et al., 2003b), which is caused by the coupling of amino acids to their respective tRNAs before they enter the ribosome. Detailed analysis of this kinetic motif (Fig. 1) reveals how hypersensitivity emerges by the joint effect of three factors, which all are proportional to the inverse of the signal s (see Eq. 2). We have defined the signal s as the rate of supply of any limiting amino acid normalized to its rate of consumption on ribosomes that operate at maximal speed. As s decreases toward zero, the logarithmic gain goes toward extremely high values with the third power of 1/s. The first factor measures the relative variation in a ternary complex concentration (aminoacyl-tRNA concentration) normalized to the relative variation in the concentration of the corresponding deacylated tRNA (lacking amino acid) and is proportional to the concentration of the deacylated transfer RNA divided by the concentration of the ternary complex. When s is small, the concentration of ternary complex is much smaller than the concentration of deacylated tRNA, which makes the factor large and increasing with 1/s as s decreases. The second factor measures the relative change in the concentration of deacylated tRNA normalized to the relative change in the concentration of free amino acid. It is for small s values proportional to the concentration of total tRNA multiplied with the maximal rate of aminoacylation divided by the dissociation constant for the binding of deacylated tRNA to the aminoacyl-tRNA synthetase and the rate of synthesis of amino acid. This factor is large when the concentration of total tRNA is larger than the dissociation constant for tRNA binding to the enzyme, and the aminoacylation capacity is much larger than the current rate of synthesis of the amino acid (proportional to 1/s). The third factor measures the relative change in amino acid concentration divided by the relative change in its rate of synthesis, and is for small s values approximated by the feedback inhibition constant for the synthesis of an amino acid divided by its concentration. Because the free amino acid concentration is proportional to its rate of synthesis (proportional to s) divided by the rate by which it disappears in the aminoacylation step, the third factor also increases with 1/s when s decreases. It follows from the definitions of these three factors that their product measures the relative change in ternary complex concentration divided by the relative change in amino acid synthesis and, hence, that the overall sensitivity amplification is proportional to the third power of 1/s. The sensitivity of an amino acid concentration to a variation in its rate of synthesis depends on the third factor, is proportional to 1/s, and has a much smaller sensitivity to the rate of amino acid production than the ternary complex concentration.
Another prediction that follows from our analysis is that, when amino acid synthesis is controlled by attenuation of transcription (Fig. 1; see also Landick and Yanofsky, 1987), the hyper-sensitivity in an aminoacyl-tRNA level in response to a variation in the rate of synthesis of the corresponding amino acid will lead to significant variations in the concentrations of amino acid synthesizing enzymes, large variations in the concentrations of amino acids, and very large variations in the concentrations of ternary complexes in exponentially growing single cells (Fig. 4 B). The situation is different when amino acid synthesis is controlled by repressors, which are activated for DNA binding and repression by the concentration of amino acids (Fig. 1; see also Jacob and Monod, 1961). In this case, we predict that variations in the concentrations of amino acid synthetic enzymes, amino acids, and ternary complexes will be much smaller than in the attenuation case (Fig. 4 B).
We also find that even if the rates of synthesis of all limiting amino acids could be perfectly balanced to their respective rates of consumption in protein synthesis, the ternary complex levels would still display very large stochastic fluctuations between very low and maximal values (Fig. 4 A).
The degeneracy of the pathways for protein synthesis in E. coli during amino acid limited growth, leading to large anticorrelated variations (Fig. 4 B) or stochastic fluctuations (Fig. 4 A) in ternary complex concentrations are expected to have several physiological consequences. One concerns amino acid substitution errors in protein synthesis: we estimate those variations in ternary complex concentrations (Fig. 4 A) to enhance amino acid substitution errors during protein synthesis about twofold, compared to a case where the different ternary complex concentrations are perfectly balanced. Another consequence concerns “downshifts” from a medium containing amino acid to a medium lacking amino acids. In this case, the supply of amino acids originates mainly from degradation of proteins that were present already at the time of the medium swap (Goldberg and St. John, 1976), and feedback loops that control amino acid supply are lacking. Here, two different scenarios are considered.
In the first, the supply of amino acids by protein degradation is perfectly balanced to their rates of consumption during synthesis of new proteins after the downshift, albeit at a much lower synthesis rate (5% of ribosome capacity, s = 0.05) than during balanced growth in a minimal medium (85% of ribosome capacity, s = 0.85). This scenario requires that the average amino acid composition of the proteins that were present before the shift (supply of postshift amino acids) is equal to the average amino acid composition of nascent proteins after the shift (consumption of postshift amino acids). Because the sensitivity amplification of the ternary complex concentrations is proportional to (1/s)3 (Eq. 2), the stochastic fluctuations are much larger in this downshift scenario (Fig. 4 C, bottom) than during balanced growth (Fig. 4 A). When the s value is 0.05, the expected average error increase due to random variation of ternary complex concentrations is expected to be ∼20 times higher than when s = 0.85 (0.85/0.05 = 17), corresponding to a 40-fold increase in the amino acid substitution frequency.
In the second scenario, the amino acid distribution in preshift bulk protein is different from that in postshift bulk protein, which leads to imbalanced supply and demand for the amino acids (Fig. 4 D). The amino acid that has the smallest frequency of occurrence in preshift proteins compared to its occurrence in postshift proteins is rate limiting and its concentration as well as the concentration of its cognate ternary complex remain low as time goes by after the downshift. The other amino acid and ternary complex concentrations, in contrast, slowly return to high values after the initial drop at the downshift (Fig. 4 D).
When a situation, like the one in Fig. 4, C or D, arises, a stress response (the “stringent response”) is induced in E. coli and many other bacteria (Cashel et al., 1996). The name “stringent response” was coined by Stent and Brenner (1961) in a study of a bacterial mutant that responds abnormally to amino acid starvation. In the wild-type bacteria, the accumulation of ribosomal RNA is instantaneously shut down if any one amino acid is in short supply. Stent and Brenner concluded that synthesis of ribosomal RNA and transfer RNA has a stringent requirement for the presence of all 20 amino acids. Accordingly, the cessation of ribosomal RNA synthesis under these conditions became known as the “stringent response”. In contrast, in the mutant strain, stable RNA accumulation continues for some time during the starvation until it also ceases; i.e., the stringent amino acid requirement was apparently relaxed. This became known as the “relaxed response”. When the mutation was mapped (Alfoldi et al., 1962), the gene was named relA and its expressed protein was called the stringent factor or RelA. An important further step in the elucidation of the amino acid requirement for ribosomal RNA synthesis was the finding that not the amino acids themselves are required, but rather the charging of all transfer RNAs with amino acids (Neidhardt, 1963).
It is now known that the stringent response is mediated by the effector molecule guanosine tetraphosphate (ppGpp), which is synthesized by RelA from ATP and GTP via formation of guanosine pentaphosphate (pppGpp). RelA synthesizes pppGpp in the A-site of ribosomes in a reaction that also requires deacylated tRNA and rapidly converts the major part of intracellular GTP to ppGpp or pppGpp (Cashel et al., 1996). Guanosine tetraphosphate binds to RNA polymerase (Chatterji et al., 1998), reroutes transcription from synthesis of stable RNA to messenger RNA (Ryals et al., 1982) and, in addition, drastically reduces the overall rate of transcription, including messenger RNA (Ryals and Bremer, 1982). ppGpp also reduces the ribosome's capacity to consume amino acids (O'Farrell, 1978), presumably as a consequence of reduced mRNA levels. After the finding that there is yet another enzyme that synthesizes ppGpp (Hernandez and Bremer, 1991) in a medium-dependent way (Dennis et al., 2004), this is often referred to as PSII, whereas RelA is often referred to as PSI (Cashel et al., 1996).
When the capacity of ribosomes to consume amino acids is reduced by the stringent response at a fixed rate of amino acid synthesis via protein degradation, the signal s will increase from 0.05 to a higher value and this will reduce the error level (O'Farrell, 1978). Experimental data (Lazzarini et al., 1971) suggest that the RelA activity is low for moderate amino acid limitation during growth in poor media (high s values as in Fig. 4, A and B) and high only for severe amino acid limitation after downshifts (very low s values as in Fig. 4, C and D). However, the concentrations of deacylated tRNA molecules are predicted to be high already for moderate amino acid limitation (Fig. 4, A and B). A passive model (Wendrich et al., 2002) for RelA activation, where the factor rapidly binds and dissociates from open ribosomal A-sites, therefore, predicts induction of the stringent response already under the conditions depicted in Fig. 4, A and B (Fig. 5, top curve). To remove this inconsistency, we suggest a novel mechanism for RelA activation where, firstly, spontaneous dissociation of RelA from ribosomes with an open A-site is very slow. Secondly, where rapid release of RelA from the ribosome requires the entry of an aminoacyl-tRNA into the A-site, in accordance with experiments showing that aminoacyl-tRNA in ternary complex can, indeed, bind to RelA containing ribosomes (Richter, 1976) (Wendrich et al., 2002). Thirdly, where RelA is rapidly removed from the ribosome either in the subsequent transfer of a nascent peptide chain from the transfer RNA in the P-site to the aminoacyl-tRNA in the A-site (Nissen et al., 2000) or during the translocation event, when the messenger RNA is moved one codon in relation to the ribosomal frame and the newly created peptidyl-tRNA is shifted from the A-site to the P-site of the ribosome (Valle et al., 2003; Zavialov and Ehrenberg, 2003). This type of mechanism leads to the RelA activation curves displayed in Fig. 5 (three lower curves), showing little activation for high and intermediate s values and large activation at s values approaching zero. Biochemical experiments to discriminate between the classical, passive, model for RelA activation (Wendrich et al., 2002) and this suggestion of aminoacyl-tRNA dependent dissociation of RelA from the ribosome have been initiated (L. Holmberg-Schiavone, in preparation) with an in vitro system for protein synthesis with pure components (Pavlov and Ehrenberg, 1996).
Acknowledgments
We thank Hans Bremer and Martin Lovmar for helpful comments on the manuscript.
The work was supported by the National Graduate School of Scientific Computing and the Swedish Research Council.
APPENDIX A: THE TURNOVER OF AMINO ACIDS AND AMINOACYL-tRNAS
The following differential equations are used for the macroscopic analysis of the system described in Fig 1.
 |
(8) |
xi is the concentration of amino acid i, yi is the concentration of aminoacylated tRNA i, JEi is the rate of synthesis of amino acid i, JSi is the rate of aminoacylation of tRNA cognate to amino acid i, and JR is the total rate of consumption of amino acids in protein synthesis. fi is usage frequency of codons for amino acid i in the ribosomal A-site. The corresponding mesoscopic model assumes that, due to rapid equilibration, the binding of amino acids and tRNAs to the synthetases and of aminoacyl-tRNAs to the ribosome can be modeled as single-step events (Elf and Ehrenberg, 2003; Keizer, 1987). The rate laws for the different reactions are described below.
Amino acid synthesis
The rate law used for amino acid biosynthesis is:
 |
(9) |
This model reflects two basic properties. Firstly, the rate is proportional to ki, which is the capacity of the amino acid biosynthetic enzymes. Capacity is defined as the rate by which uninhibited enzymes produce amino acids. As the availability of substrates for amino acid synthesis is assumed to be constant, the capacity is also proportional to the concentration of the enzymes (see also Appendix E). Secondly, the enzymes are feedback inhibited by free amino acids, with inhibition constant Ki.
Aminoacylation
For 16 out of the 20 aminoacyl-tRNA synthetases in E. coli, the amino acid is activated to aminoacyl-adenylate (aa-AMP) independently of the presence of a transfer RNA molecule on the synthetase (Ibba and Söll, 2000). When the level of pyrophosphate in the cell is low, the energy rich aa-AMP molecule is bound to the synthetase in a stable complex until a transfer RNA molecule binds and aminoacyl-tRNA is formed and released (Fersht and Kaethner, 1976). When the binding of aa-AMP is near irreversible and deacylated tRNA equilibrates rapidly with the aminoacyl-tRNA synthetase, the aminoacylation reaction scheme takes the form:
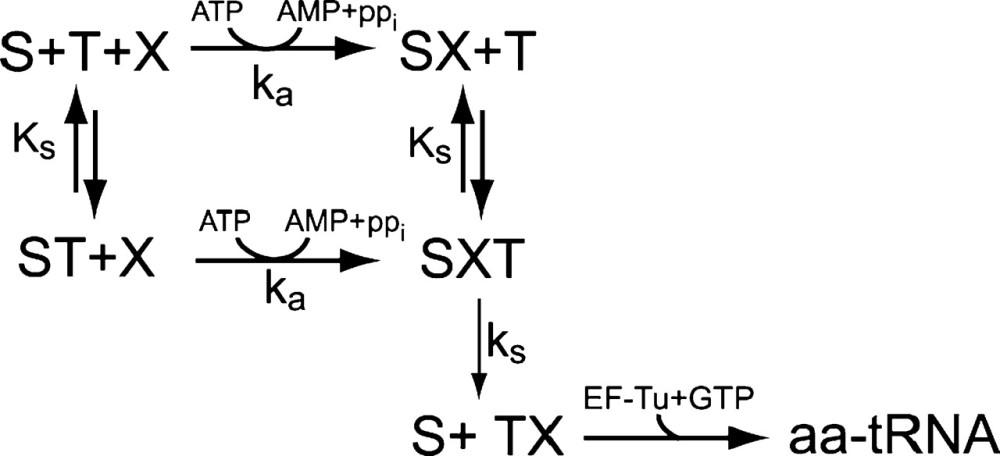 |
Here, S is the aminoacyl-tRNA synthetase, X is the amino acid, T is the tRNA and aa-tRNA is the ternary complex. ks is the maximal turnover rate of the enzyme when it is saturated with both tRNA and amino acid, KS is the dissociation constant for the binding of tRNA to the enzyme, and ka is the association rate constant for the binding of amino acid to the enzyme multiplied with the probability that an aa-AMP complex is formed (kcat/Km). The rate equations for aminoacylation, as derived from the scheme, is (Elf et al., 2001)
 |
(10) |
Here, xi is the concentration of amino acid i, yi is the concentration of aminoacyl-tRNA number i, and t0i is the total concentration of tRNA i.
Protein synthesis
Protein synthesis is a multistep mechanism, where incorporation of each amino acid from its aminoacyl-tRNA into a nascent polypeptide (ppn) on a ribosome (R) is an irreversible step. The average rate of protein elongation on ribosomes depends on the concentrations of all ternary complexes in the cell.
 |
The average rate of protein synthesis is the inverse of the mean time of incorporation of an amino acid. The mean time is an average of the time (τi) for incorporation of amino acid i, weighted by the codon usage frequency fi. By assuming Michaelis-Menten kinetics for each step, the rate law takes the form (Ehrenberg and Kurland, 1984; Elf et al., 2003a):
 |
(11) |
r is the concentration of ribosomes in elongation phase. KRi and kR are the Km− and kcat− values, respectively, for incorporation of amino acid residues of type “i”. The association rate constant for the binding of a ternary complex to the ribosome multiplied with the probability that binding is followed by peptidyl transfer is the ratio kR/KRi. The inverse of kR is the time it takes to hydrolyze GTP on EF-Tu, execute peptidyl transfer, translocate peptidyl-tRNA from A- to P-site, and dissociate elongation factor EF-G from the ribosome (Kaziro, 1978).
APPENDIX B: SENSITIVITY AMPLIFICATION
We analyze how the steady-state concentrations of amino acids, xi, and ternary complexes, yi, respond to variations in the rates of supply of amino acids, i.e., in the ki parameters. We will do this by introducing a steady-state sensitivity index. The xi values will affect repressor-mediated and the yi values will affect attenuation-mediated control of expression from the amino acid synthetic operons (Fig. 1). The steady-state sensitivity amplification (Goldbeter and Koshland, 1982), or parameter sensitivity (Savageau, 1971) (axk or ayk) by which x or y, respectively, responds to a variation in k is the derivative of x or y with respect to k, normalized to the current ratio between x and k, i.e., axk = (k/x)(dx/dk) or between y and k, i.e., ayk = (k/y)(dy/dk). The size of either of these sensitivity parameters for different values of x or y and k determines whether the response in x or y to a change in k is gradual or very sharp.
APPENDIX C: SENSITIVITIES AT THE BALANCE POINT
We calculate the sensitivity in the amino acid and ternary complex pools at the balance point for the case where the parameters in both the limiting pathways are identical. Steady-state condition is
 |
(12) |
Tilde, ~, is used to designate steady-state value at the balance point. The supply rate of amino acid x1 is perturbed:
 |
(13) |
or in simplified notation:
 |
(14) |
The derivatives a, b, c, d, and e are evaluated at the balanced steady state, where
 |
(15) |
We solve Eq. 14 for dx1 and dk1 and take ratios:
|
(16) |
where the sensitivities  are defined for
 |
(17) |
The β-factor is related to how the rate of supply of amino acid 2 changes in response to a change k1.The β-factor is restricted to a value between 0.5 and 1, when both limiting pathways are identical. If  then Eq. 17 is equivalent to Eq. 13 and β = 1. The sensitivities in Eq. 16 are given in Eq. 2 of the main text.
APPENDIX D: THE FANO-FACTOR FOR THE NONLIMITING AMINO ACID
The fluctuations in the nonlimiting amino acid pool, x1, cannot be analyzed independently, because the aminoacylation is limited by the small and fluctuating pool of deacylated tRNA. The fluctuations in this pool of deacylated tRNA do, however, directly depend on how its aminoacyl-tRNA, y1, are deacylated in protein synthesis, which mainly is dependent on the supply of limiting amino acid, x2.
We derive an expression for the fluctuations in this region (s1 > s2) by the linear noise approximation (Elf and Ehrenberg, 2003; van Kampen, 1997). The starting point is the macroscopic equations, which in this region is reduced to
 |
(18) |
The stoichiometric matrix S and the vector of flows J are
 |
 |
(19) |
Here we consider a case when two different ternary complexes are deacylated in two different reactions, although at the same average rate, JR. The supply of the limiting amino acid, J, determines the stationary flow of all components, such that all stationary flows are equal to J, i.e.,  In LNA the stationary covariance matrix
  for the fluctuations in the number for amino acids and amino-acylated tRNA n = [nx1
ny1
ny2]T is given by
for the fluctuations in the number for amino acids and amino-acylated tRNA n = [nx1
ny1
ny2]T is given by
 |
(20) |
Ω is the volume of the cell, A is the Jacobian matrix, and D is the diffusion matrix evaluated at steady state
 |
 |
(21) |
Here 
The matrix equation (Eq. 20) can easily be solved. The element we are looking for is C11, which is the LNA for  It evaluates to
 |
(22) |
The expression is quite cumbersome but is radically simplified if we recognize that  in the regime of interest, because
 |
(23) |
Thus, the terms  and
and  dominate the parenthesis and Eq. 22 reduces to
 |
(24) |
and the Fano-factor is approximated by
 |
(25) |
This is the approximation of the Fano-factor that is compared with estimations from Monte Carlo simulation of the full system in Fig. 3, right.
APPENDIX E: TRANSCRIPTIONAL CONTROL
The transcriptional feedback system is modeled deterministically to study only the noise originating at the metabolite level. The concentrations of mRNA that would be important for a full stochastic model of gene expression are thus omitted (Paulsson, 2004).
For the 10 repressor-controlled pathways (i = 1–10) the transcriptional feedback control function is
 |
(26) |
This phenomenological control function contains some important features of repressor-controlled amino acid biosynthetic systems (Elf et al., 2001): the mechanism senses the concentration of amino acid aai synthesized by the controlled enzyme system, the response to pool changes is significantly time delayed due to transcription and translation, the response is cooperative, and the enzyme systems are diluted by growth of the bacteria.
The rate of enzyme synthesis by a fully derepressed control system ktr is chosen to 0.7 nMs−1 to keep the average rate of protein synthesis at JR = 0.85Jmax; Krep = 16 μM is a parameter that determines at what amino acid concentration enzyme synthesis is more than half-repressed, τ = 30 s is the time delay between sensing the amino acid concentration and the advent of a functional enzyme and each uninhibited enzyme system is assumed to synthesize 10 amino acids s−1, i.e., ki = 10ei.
For the 10 attenuation-controlled pathways (i = 11–20), the transcriptional feedback control function is 
Here the control function senses the time the ribosome stalls at codons for the controlled amino acid. H(z) = 1 if z ≥ 0 and H(z) = 0 if z < 0, and α = 1.05 is the increase in stalling time that activates transcription. Modeling transcriptional attenuation by a Heaviside function of the codon translation times corresponds to a maximally sensitive attenuation mechanism.
References
- Alfoldi, L., G. S. Stent, and R. C. Clowes. 1962. The chromosomal site for the RNA control (R.C.) locus in Escherichia coli. J. Mol. Biol. 5:348–355. [DOI] [PubMed] [Google Scholar]
- Alves, R., and M. A. Savageau. 2000. Effect of overall feedback inhibition in unbranched biosynthetic pathways. Biophys. J. 79:2290–2304. [DOI] [PMC free article] [PubMed] [Google Scholar]
- Berg, O. G., J. Paulsson, and M. Ehrenberg. 2000. Fluctuations and quality of control in biological cells: zero-order ultrasensitivity reinvestigated. Biophys. J. 79:1228–1236. [DOI] [PMC free article] [PubMed] [Google Scholar]
- Björk, G. 1996. Stable RNA Modification. In Escherichia coli and Salmonella Cellular and Molecular Biology. F. C. Neidhardt, editor. ASM Press, Washington, DC. 861–886.
- Bliss, R. D., P. R. Painter, and A. G. Marr. 1982. Role of feedback inhibition in stabilizing the classical operon. J. Theor. Biol. 97:177–193. [DOI] [PubMed] [Google Scholar]
- Bremer, H., and P. Dennis. 1987. Modulation of chemical composition and other parameters of the cell by growth rate. In Escherichia coli and Salmonella typhimurium: Cellular and Molecular Biology. F. C. Neidhardt, editor. ASM Press, Washington, DC. 1527–1541.
- Brunschede, H., T. L. Dove, and H. Bremer. 1977. Establishment of exponential growth after a nutritional shift-up in Escherichia coli B/r: accumulation of deoxyribonucleic acid, ribonucleic acid, and protein. J. Bacteriol. 129:1020–1033. [DOI] [PMC free article] [PubMed] [Google Scholar]
- Cashel, M., and J. Gallant. 1968. Control of RNA synthesis in Escherichia coli. I. Amino acid dependence of the synthesis of the substrates of RNA polymerase. J. Mol. Biol. 34:317–330. [DOI] [PubMed] [Google Scholar]
- Cashel, M., D. R. Gentry, V. J. Hernandez, and D. Vinella. 1996. The stringent response. In Escherichia coli and Salmonella Cellular and molecular biology. F. C. Neidhardt, editor. ASM Press, Washington DC. 1458–1496.
- Chassagnole, C., D. A. Fell, B. Rais, B. Kudla, and J. P. Mazat. 2001a. Control of the threonine-synthesis pathway in Escherichia coli: a theoretical and experimental approach. Biochem. J. 356:433–444. [DOI] [PMC free article] [PubMed] [Google Scholar]
- Chassagnole, C., B. Rais, E. Quentin, D. A. Fell, and J. P. Mazat. 2001b. An integrated study of threonine-pathway enzyme kinetics in Escherichia coli. Biochem. J. 356:415–423. [DOI] [PMC free article] [PubMed] [Google Scholar]
- Chatterji, D., N. Fujita, and A. Ishihama. 1998. The mediator for stringent control, ppGpp, binds to the beta-subunit of Escherichia coli RNA polymerase. Genes Cells. 3:279–287. [DOI] [PubMed] [Google Scholar]
- Cornish-Bowden, A. 1995. Fundamentals of Enzyme Kinetics. Portland Press, London, UK.
- Dalbow, D. G., and H. Bremer. 1975. Metabolic regulation of beta-galactosidase synthesis in Escherichia coli. A test for constitutive ribosome synthesis. Biochem. J. 150:1–8. [DOI] [PMC free article] [PubMed] [Google Scholar]
- Dennis, P., M. Ehrenberg, and H. Bremer. 2004. Control of ribosomal RNA synthesis in Escherichia coli: a systems biology approach. Microbiol. Mol. Biol. Rev. In press. [DOI] [PMC free article] [PubMed]
- Donachie, W. D., and A. Robinson. 1987. Cell division: parameter values and the process. In Escherichia coli and Salmonella typhimurium: Cellular and Molecular Biology. F. C. Neidhardt, editor. ASM Press, Washington, DC. 1578–1593.
- Dong, H., L. Nilsson, and C. G. Kurland. 1996. Co-variation of tRNA abundance and codon usage in Escherichia coli at different growth rates. J. Mol. Biol. 260:649–663. [DOI] [PubMed] [Google Scholar]
- Ehrenberg, M., and C. G. Kurland. 1984. Costs of accuracy determined by a maximal growth rate constraint. Q. Rev. Biophys. 17:45–82. [DOI] [PubMed] [Google Scholar]
- Elf, J., O. G. Berg, and M. Ehrenberg. 2001. Comparison of repressor and transcriptional attenuator systems for control of amino acid biosynthetic operons. J. Mol. Biol. 313:941–954. [DOI] [PubMed] [Google Scholar]
- Elf, J., and M. Ehrenberg. 2003. Fast evaluation of fluctuations in biochemical networks with the linear noise approximation. Genome Res. 13:2475–2484. [DOI] [PMC free article] [PubMed] [Google Scholar]
- Elf, J., D. Nilsson, T. Tenson, and M. Ehrenberg. 2003a. Selective charging of tRNA isoacceptors explains patterns of codon usage. Science. 300:1718–1722. [DOI] [PubMed] [Google Scholar]
- Elf, J., J. Paulsson, O. G. Berg, and M. Ehrenberg. 2003b. Near-critical phenomena in intracellular metabolite pools. Biophys. J. 84:154–170. [DOI] [PMC free article] [PubMed] [Google Scholar]
- Fano, U. 1947. Ionization yield of rations. II. The fluctuations of the number of ions. Phys Rev. 72:26–29. [Google Scholar]
- Fell, D. A. 1996. Understanding the Control of Metabolism. Portland Press, London, UK.
- Fersht, A. R., and M. M. Kaethner. 1976. Mechanism of aminoacylation of tRNA. Proof of the aminoacyl adenylate pathway for the isoleucyl- and tyrosyl-tRNA synthetases from Escherichia coli K12. Biochemistry. 15:818–823. [DOI] [PubMed] [Google Scholar]
- Forchhammer, J., and L. Lindahl. 1971. Growth rate of polypeptide chains as a function of the cell growth rate in a mutant of Escherichia coli 15. J. Mol. Biol. 55:563–568. [DOI] [PubMed] [Google Scholar]
- Gillespie, D. 1976. A general method for numerically simulating the stochastic time evolution of coupled chemical reactions. J. Comput. Phys. 22:403–434. [Google Scholar]
- Goldberg, A., and A. St. John. 1976. Intracellular protein degradation in mammalian and bacterial cells: Part 2. Annu. Rev. Biochem. 45:747–803. [DOI] [PubMed] [Google Scholar]
- Goldbeter, A., and D. E. Koshland, Jr. 1981. An amplified sensitivity arising from covalent modification in biological systems. Proc. Natl. Acad. Sci. USA. 78:6840–6844. [DOI] [PMC free article] [PubMed] [Google Scholar]
- Goldbeter, A., and D. E. Koshland, Jr. 1982. Sensitivity amplification in biochemical systems. Q. Rev. Biophys. 15:555–591. [DOI] [PubMed] [Google Scholar]
- Haseltine, W. A., and R. Block. 1973. Synthesis of guanosine tetra- and pentaphosphate requires the presence of a codon-specific, uncharged transfer ribonucleic acid in the acceptor site of ribosomes. Proc. Natl. Acad. Sci. USA. 70:1564–1568. [DOI] [PMC free article] [PubMed] [Google Scholar]
- Hernandez, V. J., and H. Bremer. 1991. Escherichia coli ppGpp synthetase II activity requires spoT. J. Biol. Chem. 266:5991–5999. [PubMed] [Google Scholar]
- Ibba, M., and D. Söll. 2000. Aminoacyl-tRNA synthesis. Annu. Rev. Biochem. 69:617–650. [DOI] [PubMed] [Google Scholar]
- Jacob, F., and J. J. Monod. 1961. Genetic regulatory mechanisms in the synthesis of proteins. J. Mol. Biol. 3:318–356. [DOI] [PubMed] [Google Scholar]
- Kaziro, Y. 1978. The role of guanosine 5′-triphosphate in polypeptide chain elongation. Biochim. Biophys. Acta. 505:95–127. [DOI] [PubMed] [Google Scholar]
- Keizer, J. 1987. Statistical Thermodynamics of Nonequlibrium Processes. Springer-Verlag, Berlin, Germany.
- Kurland, C. G., and M. Ehrenberg. 1984. Optimization of translation accuracy. Prog. Nucleic Acid Res. Mol. Biol. 31:191–219. [DOI] [PubMed] [Google Scholar]
- Kuroda, A., K. Nomura, R. Ohtomo, J. Kato, T. Ikeda, N. Takiguchi, H. Ohtake, and A. Kornberg. 2001. Role of inorganic polyphosphate in promoting ribosomal protein degradation by the Lon protease in E. coli. Science. 293:705–708. [DOI] [PubMed] [Google Scholar]
- Landick, R., and C. Yanofsky. 1987. Transcription attenuation. In Escherichia coli and Salmonella typhimurium: Cellular and Molecular Biology. F. C. Neidhardt, editor. ASM Press, Washington, DC. 1276–1301.
- Lazzarini, R. A., M. Cashel, and J. Gallant. 1971. On the regulation of guanosine tetraphosphate levels in stringent and relaxed strains of Escherichia coli. J. Biol. Chem. 246:4381–4385. [PubMed] [Google Scholar]
- Marr, A. G. 1991. Growth rate of Escherichia coli. Microbiol. Rev. 55:316–333. [DOI] [PMC free article] [PubMed] [Google Scholar]
- McQuarrie, D. A. 1967. Stochastic approach to chemical kinetics. J. Appl. Probab. 4:413–478. [Google Scholar]
- Neidhardt, F. C. 1963. Properties of a bacterial mutant lacking amino acid control of RNA synthesis. Biochim. Biophys. Acta. 68:365–379. [DOI] [PubMed] [Google Scholar]
- Neidhardt, F. C., R. Curtiss, J. Ingraham, E. Lin, K. Low, B. Magasanik, W. Reznikoff, M. Riley, M. Schaechter, and H. Umbarger. 1996. Escherichia coli and Salmonella: Cellular and Molecular Biology. ASM Press, Washington, DC.
- Nissen, P., J. Hansen, N. Ban, P. B. Moore, and T. A. Steitz. 2000. The structural basis of ribosome activity in peptide bond synthesis. Science. 289:920–930. [DOI] [PubMed] [Google Scholar]
- O'Farrell, P. H. 1978. The suppression of defective translation by ppGpp and its role in the stringent response. Cell. 14:545–557. [DOI] [PubMed] [Google Scholar]
- Paulsson, J. 2004. Summing up the noise in gene networks. Nature. 427:415–418. [DOI] [PubMed] [Google Scholar]
- Paulsson, J., and M. Ehrenberg. 2001. Noise in a minimal regulatory network: plasmid copy number control. Q. Rev. Biophys. 34:1–59. [DOI] [PubMed] [Google Scholar]
- Pavlov, M. Y., and M. Ehrenberg. 1996. Rate of translation of natural mRNAs in an optimized in vitro system. Arch. Biochem. Biophys. 328:9–16. [DOI] [PubMed] [Google Scholar]
- Pedersen, S. 1984. Escherichia coli ribosomes translate in vivo with variable rate. EMBO J. 3:2895–2898. [DOI] [PMC free article] [PubMed] [Google Scholar]
- Pedersen, S., P. L. Bloch, S. Reeh, and F. C. Neidhardt. 1978. Patterns of protein synthesis in E. coli: a catalog of the amount of 140 individual proteins at different growth rates. Cell. 14:179–190. [DOI] [PubMed] [Google Scholar]
- Rais, B., C. Chassagnole, T. Letellier, D. A. Fell, and J. P. Mazat. 2001. Threonine synthesis from aspartate in Escherichia coli cell-free extracts: pathway dynamics. Biochem. J. 356:425–432. [DOI] [PMC free article] [PubMed] [Google Scholar]
- Richter, D. 1976. Stringent factor from Escherichia coli directs ribosomal binding and release of uncharged tRNA. Proc. Natl. Acad. Sci. USA. 73:707–711. [DOI] [PMC free article] [PubMed] [Google Scholar]
- Ryals, J., and H. Bremer. 1982. relA-dependent RNA polymerase activity in Escherichia coli. J. Bacteriol. 150:168–179. [DOI] [PMC free article] [PubMed] [Google Scholar]
- Ryals, J., R. Little, and H. Bremer. 1982. Control of rRNA and tRNA syntheses in Escherichia coli by guanosine tetraphosphate. J. Bacteriol. 151:1261–1268. [DOI] [PMC free article] [PubMed] [Google Scholar]
- Santillán, M., and M. Mackey. 2001. Dynamic regulation of the tryptophan operon: a modelling study and comparision with experimental data. Proc. Natl. Acad. Sci. USA. 98:1364–1369. [DOI] [PMC free article] [PubMed] [Google Scholar]
- Savageau, M. A. 1971. Parameter sensitivity as a criterion for evaluating and comparing the performance of biochemical systems. Nature. 229:542–544. [DOI] [PubMed] [Google Scholar]
- Savageau, M. A. 1976. Biochemical Systems Analysis: A Study of Function and Design in Molecular Biology. Addison-Wesley, Reading, MA.
- Schomburg, I., A. Chang, O. Hofmann, C. Ebeling, F. Ehrentreich, and D. Schomburg. 2002. BRENDA: a resource for enzyme data and metabolic information. Trends Biochem. Sci. 27:54–56. [DOI] [PubMed] [Google Scholar]
- Stent, G. S., and S. Brenner. 1961. A genetic locus for the regulation of RNA synthesis. Proc. Natl. Acad. Sci. USA. 47:2005–2014. [DOI] [PMC free article] [PubMed] [Google Scholar]
- Umbarger, H. E. 1978. Amino acid biosynthesis and its regulation. Annu. Rev. Biochem. 47:532–606. [DOI] [PubMed] [Google Scholar]
- Valle, M., A. Zavialov, J. Sengupta, U. Rawat, M. Ehrenberg, and J. Frank. 2003. Locking and unlocking of ribosomal motions. Cell. 114:123–134. [DOI] [PubMed] [Google Scholar]
- van Kampen, N. G. 1997. Stochastic processes in physics and chemistry, 2nd Ed. Elsevier, Amsterdam, The Netherlands.
- Wendrich, T. M., G. Blaha, D. N. Wilson, M. A. Marahiel, and K. H. Nierhaus. 2002. Dissection of the mechanism for the stringent factor RelA. Mol. Cell. 10:779–788. [DOI] [PubMed] [Google Scholar]
- Yanofsky, C. 1981. Attenuation in the control of expression of bacterial operons. Nature. 289:751–758. [DOI] [PubMed] [Google Scholar]
- Yanofsky, C., and V. Horn. 1994. Role of regulatory features of the trp operon of Escherichia coli in mediating a response to a nutritional shift. J. Bacteriol. 176:6245–6254. [DOI] [PMC free article] [PubMed] [Google Scholar]
- Young, R., and H. Bremer. 1976. Polypeptide-chain-elongation rate in Escherichia coli B/r as a function of growth rate. Biochem. J. 160:185–194. [DOI] [PMC free article] [PubMed] [Google Scholar]
- Zavialov, A. V., and M. Ehrenberg. 2003. Peptidyl-tRNA regulates the GTPase activity of translation factors. Cell. 114:113–122. [DOI] [PubMed] [Google Scholar]