

Abstract
FPL 64176 (FPL) is a nondihydropyridine compound that dramatically increases macroscopic inward current through L-type calcium channels and slows activation and deactivation. To understand the mechanism by which channel behavior is altered, we compared the effects of the drug on the kinetics and voltage dependence of ionic currents and gating currents. Currents from a homogeneous population of channels were obtained using cloned rabbit CaV1.2 (α1C, cardiac L-type) channels stably expressed in baby hamster kidney cells together with β1a and α2δ1 subunits. We found a striking dissociation between effects of FPL on ionic currents, which were modified strongly, and on gating currents, which were not detectably altered. Inward ionic currents were enhanced ∼5-fold for a voltage step from −90 mV to +10 mV. Kinetics of activation and deactivation were slowed dramatically at most voltages. Curiously, however, at very hyperpolarized voltages (<−250 mV), deactivation was actually faster in FPL than in control. Gating currents were measured using a variety of inorganic ions to block ionic current and also without blockers, by recording gating current at the reversal potential for ionic current (+50 mV). Despite the slowed kinetics of ionic currents, FPL had no discernible effect on the fundamental movements of gating charge that drive channel gating. Instead, FPL somehow affects the coupling of charge movement to opening and closing of the pore. An intriguing possibility is that the drug causes an inactivated state to become conducting without otherwise affecting gating transitions.
INTRODUCTION
FPL 64176 (methyl 2,5-dimethyl-4-[2-(phenylmethyl)benzoyl]-1H-pyrrole-3-carboxylate; FPL) is a calcium channel modulator specific for the L-type (CaV1) family of voltage-gated calcium channels (Baxter et al., 1993; Triggle, 2004). Like the more commonly used agonist Bay K 8644, FPL prolongs the opening of single calcium channels during depolarization and slows channel closing upon repolarization (Rampe and Lacerda, 1991; Zheng et al., 1991; Kunze and Rampe, 1992; Lauven et al., 1999; Fan et al., 2000). The ability of FPL to enhance current through voltage-gated L-type channels, while not affecting current through other calcium channel types, has made it a useful tool for studying physiological roles or disorders of L-type channels (Hardingham et al., 1997; Jinnah et al., 1999, 2000) and for identifying L-type current within the mix of channel subtypes that exists in most central neurons. FPL has also been used to increase the contractility of smooth and cardiac muscle (Zheng et al., 1991; Rampe and Dage, 1992; Rampe et al., 1993). Swapping domains III and IV of the cloned CaV2.3 calcium channel for CaV1.2 makes the resultant channel insensitive to FPL (Altier et al., 2001), as does a single point mutation in the S5–S6 pore domain of CaV1.2 domain III (Yamaguchi et al., 2000).
The strong effects of FPL binding on channel gating kinetics suggest a major modification of the gating mechanism. Understanding such modification could shed light on the normal mechanism of gating, especially the question of how movement of gating charge in the S4 regions of the channel is linked to opening and closing of the channel pore. Gating steps affected by FPL might also be a target for modulation by physiological mechanisms that enhance L-type calcium current. Fan and colleagues (2000) analyzed effects of FPL on gating of native L-type calcium channels in rat cardiac myocytes and found that despite the dramatic enhancement and slowing of ionic currents, gating charge movements were affected much less, with no effect of FPL on gating current associated with activation and a modest slowing effect on gating current associated with deactivation. Here, we have extended these observations using heterologous expression of cloned channels to obtain L-type gating current without interference from other voltage-dependent channels, and with a technique to measure gating current in the absence of inorganic calcium channel blockers, which can modify gating. We find no detectable effect of FPL on kinetics or magnitude of either forward or reverse gating current, even under the same conditions in which ionic currents are drastically enhanced and slowed. We also find that the drug increases the voltage dependence of ionic current deactivation so that at strongly hyperpolarized voltages, tail currents actually decay faster in FPL than in control. The results can be rationalized by a model in which FPL has no effect on gating transitions but causes a previously nonconducting inactivated state to become conducting.
METHODS
Construction of expression plasmids and a cell line containing recombinant α1C Ca2+ channels
The pK4K plasmid (Niidome et al., 1994), which was used to express the recombinant α1C subunit, is driven by the simian virus 40 (SV40) early promoter and contains two polyadenylation sites (derived from the plasmid pKCR; O'Hare et al., 1981) and a second transcription unit to direct expression of the dihydrofolate reductase marker gene (derived from the plasmid pAdD26SV(A) (no.3); Kaufman and Sharp, 1982). To express CaV1.2 (α1C) Ca2+ channels, baby hamster kidney (BHK) cells were transfected with pCAA2 (Niidome et al., 1994) using the calcium phosphate protocol (Chen and Okayama, 1987). Cells were cultured in Dulbecco's modified Eagle's medium (DMEM) containing G-418 (600 mg/mL, Gibco BRL, Gaithersburg, MD) to first establish a BHK line with stable expression of the α2δ1 and β1a subunits. BHK cells were subsequently transfected with pK4KC1, which contains the entire coding region of CaV1.2 cDNA (Mikami et al., 1989), using Tfx-50 reagents (Promega, Madison, WI). Cells were grown in DMEM containing methotrexate (250 nM, Sigma, St. Louis, MO) to obtain a BHK line stably expressing the CaV1.2, α2δ1, and β1a subunits. Electrophysiological measurements and northern blot analysis were employed to identify functional channels. Culturing conditions were as described in Niidome et al. (1994), and cell aliquots (∼500 μl) were stored in liquid nitrogen until use.
As needed, cells were thawed, pelleted by centrifugation, and resuspended and pelleted three times in 5 mL of DMEM cell culture medium. Cells were finally resuspended in ∼20 mL of medium, and 3–4 mL were plated onto 35-mm Primaria-coated cell culture dishes (Falcon). Dishes were incubated at 37°C for up to 10 days. On the day of recording, cells were stripped from the culture dish by a 5-min incubation in DMEM + 0.5 mM added Na-EDTA, followed by trituration. The resulting cell suspension was centrifuged for 3–4 min at 2000 rpm and resuspended in a Tyrode's solution containing (in mM) 150 NaCl, 4 KCl, 2 CaCl2, 2 MgCl2, 10 glucose, 10 HEPES, pH adjusted to 7.4 with NaOH. As needed, several drops of the cell suspension in Tyrode's were added to the recording chamber and allowed to settle to the bottom.
Electrophysiological methods
Currents were recorded using the whole-cell configuration of the patch-clamp technique. Patch pipettes were made from borosilicate glass tubing (Boralex; Dynalab, Rochester, NY) and coated with Sylgard (Dow Corning, Midland, MI). Pipettes had resistances of 0.5–2.0 MΩ when filled with internal solution. After establishment of the whole-cell recording configuration, the cell was lifted off the bottom of the dish and positioned in front of an array of 12 perfusion tubes made of 250-μm internal diameter quartz tubing connected by Teflon tubing to glass reservoirs. Complete solution changes were made in <1 s by moving the cell from one solution to another.
Currents were recorded with an Axopatch 200A amplifier (Axon Instruments, Foster City, CA), filtered with a corner frequency of 5 kHz (four-pole Bessel filter), digitized (10 kHz) using a Digidata 1200 (Axon Instruments), and stored on a computer. Compensation (80–95%) for series resistance (typically ∼2.5 times higher than the pipette resistance) was used. Only data from cells with a product of uncompensated series resistance and peak current sufficiently small to give a voltage error of <5 mV were analyzed. Calcium channel currents and gating currents were corrected for leak and capacitative currents offline by subtracting current elicited by a hyperpolarization of 10 or 20 mV from the holding or prepulse potential of −120 or −140 mV (generally signal-averaged over 10–20 repetitions). The first sample point after a voltage jump was often removed from the record. Data were all taken at room temperature, except for the effects of FPL on deactivation (see Fig. 3), which were studied at ∼12°C for better resolution of fast ionic tail currents.
FIGURE 3.
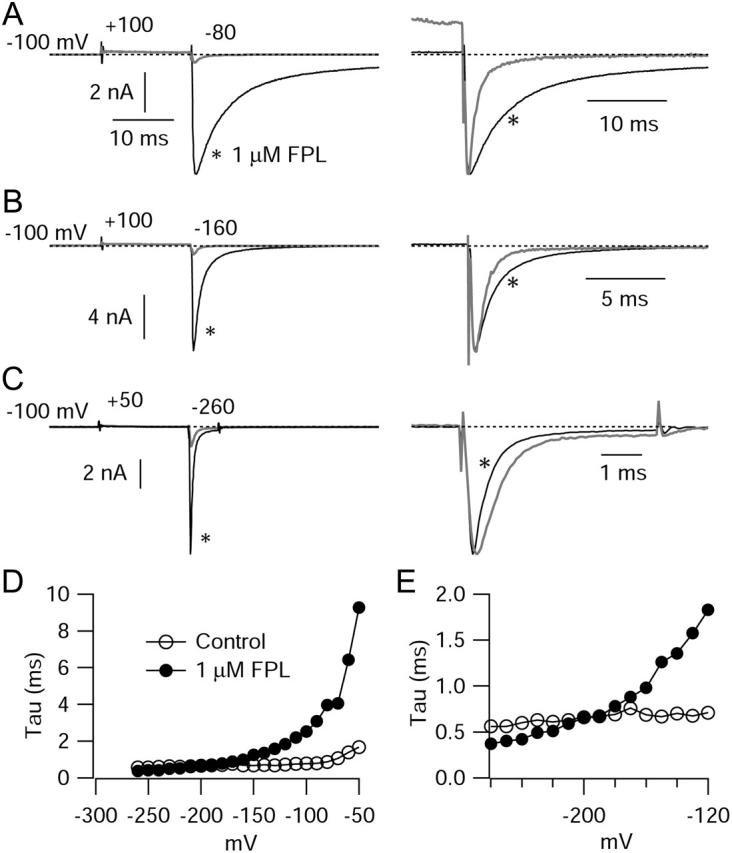
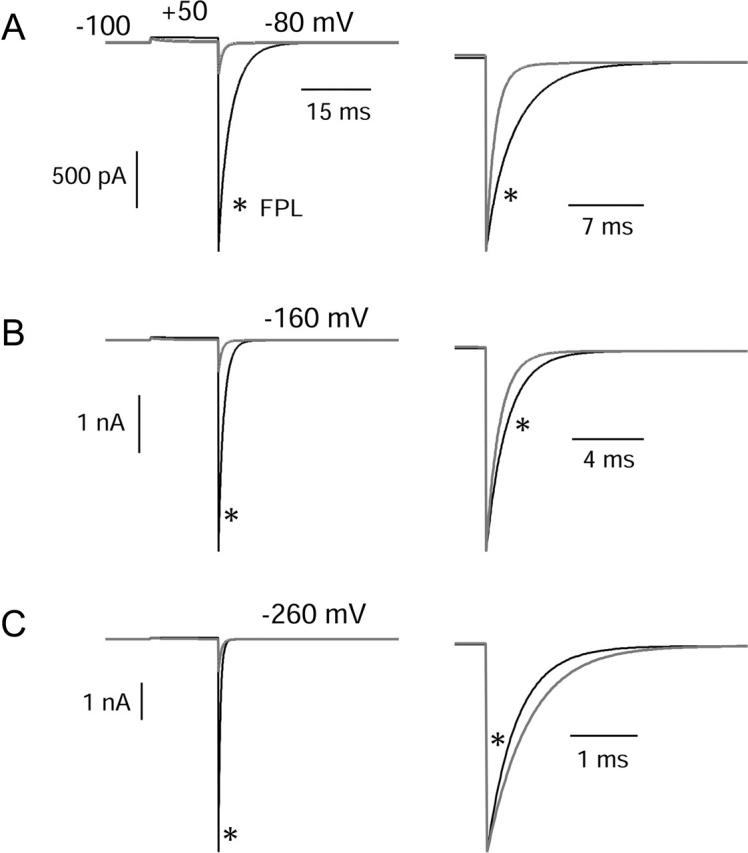
Effects of FPL on tail current deactivation kinetics as a function of voltage. Channels were activated by a 15 ms pulse to +100 or +50 mV, and deactivation was measured with a repolarization to voltages from −40 mV to −260 mV. (A–C) Repolarization to −80 mV, −160 mV, and −260 mV, respectively, in the same cell. In A–C, at right, the control tail current (shaded) is scaled to the same amplitude as the tail in FPL (black). In C, the activating pulse was decreased to +50 mV reduce amplitude of tails. (D) Predominant tail current time constant versus voltage. In control, decay was well-fit by a single exponential from −260 to −150 mV; positive to −150 mV, a double exponential function was required; the faster time constant, accounting for 80–95% of the total, is plotted. In FPL, fits required two exponentials at all voltages; the faster time constant, accounting for 75–90% of the total amplitude, is plotted. (E) Expanded scale for time constants at hyperpolarized voltages. All measurements made at 12°C.
The internal (pipette) solution consisted of, in mM, 56 CsCl, 68 CsF, 2.2 MgCl2, 4.5 EGTA, 9 HEPES, 4 MgATP, and 14 creatine phosphate (Tris salt), adjusted to pH 7.4 with CsOH. External solution was, in mM, 160 TEA-Cl, 2 BaCl2, and 10 HEPES, pH adjusted to 7.4 with TEA-OH. External solution included 0.6 μM tetrodotoxin to block any small endogenous sodium current. Voltages reported are uncorrected for a junction potential of −2 mV between the external solution and the Tyrode's solution in which the seal was formed. FPL 64176 was stored as a 1-mM solution in water and diluted in the recording solution to the appropriate concentration on the day of the experiment. We confined our analysis to results obtained with 1 μM FPL. We did a few experiments comparing the effects of 1 μM FPL with 10 μM FPL. Unlike 1 μM drug, 10 μM drug had a slight slowing effect on OFF charge movement (though no effect on voltage dependence or kinetics of ON charge movement). This could represent partial immobilization of charge due to inactivation, since with 10 μM FPL there was enhanced decay of ionic current during test pulses. Since this was quite different than the slowing of inactivation seen with 1 μM drug, a concentration sufficient to produce dramatic effects on the size of ionic currents, it may represent an additional blocking effect of high concentrations. We therefore confined our analysis to the effects of the lower concentration.
Modeling
Modeling was implemented in Igor (Wavemetrics, Lake Oswego, OR) using fourth-order Runge-Kutta integration with a 4-μs step size. Results were indistinguishable if step size was changed to 1 μs. Rate constants were of the form k1 × exp(V/k2), where k1 and k2 are constants and were as follows, with kXY denoting the rate constant for channel conversion for state x to state y: kCO = 1 × exp(V/3.2), kOC = 1 × exp(−V/500), kOI = 0.01, kIO = 0.0039 × exp(−V/110), kCI = 0.33 × exp(V/3.2), kIC = 0.13 × exp(−V/90). These forms provide a reasonable simulation of kinetics and satisfy microscopic reversibility. To avoid the problems associated with the strongly voltage-dependent rate constants (kCO and kCI) becoming extremely large for large depolarizations, these were “clipped” at 30 ms−1 and 10 ms−1, respectively (chosen to preserve the 3:1 ratio of these rate constants). To generate simulated currents, it was assumed that there were 5,000 channels; single-channel current was calculated from the constant-field current equations with permeability to Ba (2 mM external) and Cs (139 internal). The single-channel permeability to Ba in control was 1.2 × 10⁻⁷ cm/s, and the permeability to Cs was 250 times lower, 4.8 × 10⁻¹⁰ cm/s. For FPL-modified channels, it was assumed that the open state had the same permeability as in control and that the FPL-bound inactivated state became conducting, with a Ba permeability of 1.7 × 10⁻⁷ cm/s (42% higher than the normal open state) and Cs permeability of 4.8 × 10⁻¹⁰ cm/s (the same as the normal open state). The increased single-channel permeability to Ba was based on the increase seen with FPL in single-channel experiments using Ba as charge carrier (Handrock et al., 1998).
RESULTS
Effects of FPL on ionic currents
Calcium channel currents were recorded with the whole-cell patch clamp from a cell line constructed using BHK cells stably expressing the CaV1.2, β1a, and α2δ1 calcium channel subunits. Current was carried by 2 mM Ba2+. Fig. 1 shows calcium channel currents before and after addition of 1 μM FPL. In the presence of FPL, peak inward currents were much larger, and both activation and deactivation were dramatically slower, just as originally seen with native calcium channels in cardiac myocytes (Rampe and Lacerda, 1991; Zheng et al., 1991). The effects of FPL were complete within several seconds. On removal of drug, currents returned to control amplitude and kinetics more slowly, with complete reversal in ∼60–90 s. In the records shown in Fig. 1, the currents were corrected for leakage current and linear capacitative current, and the inward ionic current elicited by depolarization was preceded by a brief outward current with characteristics typical of gating current. It was notable that this component of current was unaffected by FPL.
FIGURE 1.
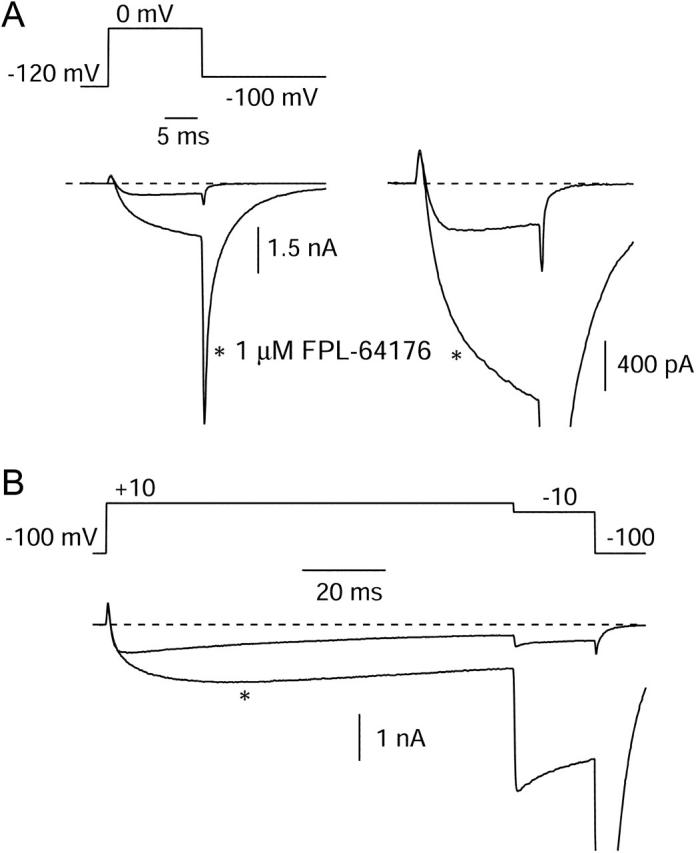
Enhancement of Cav1.2 currents and slowing of deactivation by FPL. (A) Currents evoked by a 15-ms depolarization to 0 mV before and 2 s after moving the cell to an external solution containing 1 μM FPL. Right panel shows test pulse current at higher gain. Linear leak and capacitative currents have been subtracted; note lack of effect of FPL on initial outward transient due to gating current. (B) Currents from a different cell evoked by a 100-ms depolarization to +10 mV, in control and with 1 μM FPL, showing slowing of activation and inactivation. Traces in FPL are marked with an asterisk.
In addition to both activation and deactivation being slower in FPL, the drug apparently slowed inactivation. In control records, there was some decay of current evident even during short (15-ms) depolarizations (Fig. 1 A, right), while in the presence of FPL, current continued to rise throughout this period. With a 100-ms depolarizing step to +10 mV, barium current decayed by ∼65% in control and much less (∼25%) in the presence of FPL (Fig. 1 B). Slowing of inactivation by FPL agrees with previous reports with native channels in cardiac myocytes (Fan et al., 2000).
With the permeant ions used (2 mM Ba2+ external and 139 mM Cs+ internal), the reversal potential for ionic current was close to +50 mV, and substantial outward ionic currents were evident for depolarizations positive to ∼+80 mV. Interestingly, these currents were affected much less dramatically by FPL than were inward currents. Fig. 2 shows the effect of FPL on currents elicited by a step to +180 mV; peak current was increased by only ∼20%, even though in the same application of drug, peak inward current elicited by a step to −20 mV was increased 10-fold. The slowing of inactivation by FPL was evident for outward currents as well as inward currents. In some other cells, there was no detectable effect of FPL on peak current elicited by depolarizations to +160–180 mV, but the slowing of inactivation was always present.
FIGURE 2.

Effects on outward currents carried by internal Cs+ and on tail currents that follow large depolarizations. Currents evoked by a 10-ms pulse to +180 mV followed by repolarization to −100 mV before and after application of 1 μM FPL. (Right) Tail currents at −100 mV on faster time base.
Since one of the most striking effects of FPL was slowing of tail currents, we examined this effect over a wide voltage range. We found that although FPL slowed tail currents dramatically at voltages depolarized to −100 mV, as previously described for native channels (Rampe and Lacerda, 1991; Lauven et al., 1999; Fan et al., 2000), the effect was less prominent at more hyperpolarized voltages. To better resolve the kinetics of tail currents at strongly hyperpolarized voltages, we performed a series of experiments in which the cells were cooled to 12°C. Fig. 3 shows an example in which the effects of FPL on kinetics of channel deactivation were examined over a wide voltage range (−50 to −260 mV) at 12°C. The effect of FPL in slowing tail current decay, which can be seen most clearly after scaling the currents to the same peak size, was smaller at −160 mV than at −80 mV. Remarkably, tail currents actually decayed faster in the presence of FPL at very strongly hyperpolarized voltages (<−200 mV). Fig. 3 D illustrates the dependence on voltage of the predominant tail-current time constant. Under control conditions, the decay of the tail current could be described very well by a single exponential function for voltages negative to −150; for voltages positive to −150 mV, decay required a double exponential function for a good fit, with the faster time constant accounting for 80–95% of the total. In the presence of FPL, fits required two exponentials at all voltages, with the faster time constant accounting for 75–90% of the total amplitude. In control, decay kinetics were moderately voltage-dependent between −50 and −100 mV, but had only very shallow voltage dependence negative to −120 mV, the predominant time constant changing from ∼0.7 ms at −120 mV to ∼0.6 ms at −250 mV. In contrast, decay kinetics with FPL were much more steeply voltage-dependent over the entire voltage range (Fig. 3, D and E) and became faster than in control in the range of −200 mV to −260 mV.
Effects of FPL on gating currents
To test whether the slowed kinetics of activation and deactivation seen in the physiological voltage range resulted from slower movement of the channel voltage sensors, we recorded gating currents from these expressed cloned channels. To determine optimal experimental conditions for measuring gating currents, we measured nonlinear charge movements using a number of different ionic conditions. First, we took the approach of blocking ionic current by substitution of 2 mM Co2+ for 2 mM Ba2+. The currents shown in Fig. 4 illustrate typical nonlinear charge movement measured under these conditions. Linear capacitative currents were corrected using scaled currents evoked by steps from −140 mV to −160 mV. Overlaid traces in Fig. 4 A are in response to depolarizations to −90 mV, −50 mV, −10 mV, +30 mV, and +90 mV, followed by repolarization to −100 mV. Detectable charge moved during depolarizing steps positive to ∼−80 mV. ON charge increased with larger depolarizations and reached a saturating value positive to ∼+50 mV (Fig. 4 B). OFF charge at −100 mV closely matched the ON charge for a given voltage step. Interestingly, though, the OFF charge had complex kinetics. Although there was an initial rapid phase of charge movement in the first millisecond after repolarization (similar to the duration of the ionic tail current), this accounted for only a fraction of the total OFF charge movement. There was also a prolonged component of charge movement that lasted for at least 20 ms after repolarization. For steps positive to +20 mV, this component accounted for at least half the return charge movement. It appears to be due to slow return movement of channel voltage sensors, since unless it was included in the integration of total charge movement, OFF charge movement appeared smaller than ON charge movement. With its inclusion, there was close matching of ON and OFF charge movement at all voltages (Fig. 4 B). ON and OFF charge movement were both saturating functions of voltage fit well by the same single Boltzmann function. Cells that expressed no ionic currents expressed no nonlinear charge movements (including the slow OFF gating charge).
FIGURE 4.

Voltage dependence of nonlinear charge movement using Co2+ to block ionic current. (A) Nonlinear charge movements recorded in external solution in which 2 mM Co2+ replaced Ba2+. Overlaid currents are in response to 15-ms voltage pulses to −90, −50, −10, +30, and +90 mV, followed by repolarization to −100 mV, from a steady holding voltage of −120 mV. (Inset) OFF charge movement shown at higher resolution to illustrate slow component of charge movement that follows steps to+30 mV and +90 mV. (B) Integrated charge movement evoked by the entire family of voltage pulses from −130 mV to +90 mV. (•) ON charge movement. (○) OFF charge movement. Fit is a single Boltzmann function fit to the ON charge movement, Qmax/[1 + exp(−(V − Vh)/k)], where Qmax is the maximal charge movement, V is the test potential, Vh is the midpoint, and k is the slope factor, with the indicated values.
Substitution of Co2+ for Ba2+ could conceivably introduce errors in comparing the voltage dependence of gating current to that of ionic current, because of differences in screening of surface charge or in the gating behavior of the channel. We therefore attempted to compare the voltage dependence of ionic and gating currents under constant ionic conditions. With Ba2+ carrying ionic current, gating currents can still be measured at the ionic reversal potential of +50 mV, where the only net current is due to ON movement of gating charge (Fig. 5 A). To assay movement of gating charge at lower voltages, we measured how steps to lower voltages reduced the charge moved at +50 mV. Test pulses to +50 mV were preceded by a 15-ms conditioning step to voltages ranging from −130 mV to +160 mV. After conditioning steps to voltages insufficiently strong to move gating charge, the subsequent test step to +50 mV evoked maximal charge movement. After conditioning voltages strong enough to move gating charge fully, the test pulse to +50 mV evoked no current, as no further charge was available to move. Current at +50 mV was integrated (dotted lines show integration limits), and the charge movement plotted as a function of the full range of conditioning voltages (Fig. 5 B). The resulting curve gives a measure of the voltage dependence of charge movement measured during 15-ms steps under exactly the same ionic conditions as ionic current and not subject to complications of different surface charge screening or different gating of the channel due to the substitution of impermeant ions for barium. Charge movement began at ∼−60 mV, saturated at voltages >+20 mV, and was fit reasonably well by a single Boltzmann function with half-maximal voltage −33 mV. ON current at +50 mV in Ba2+ activated with the same kinetics as in Co2+, and the saturating charge movement measured with the two protocols was very close when compared in the same cell.
FIGURE 5.
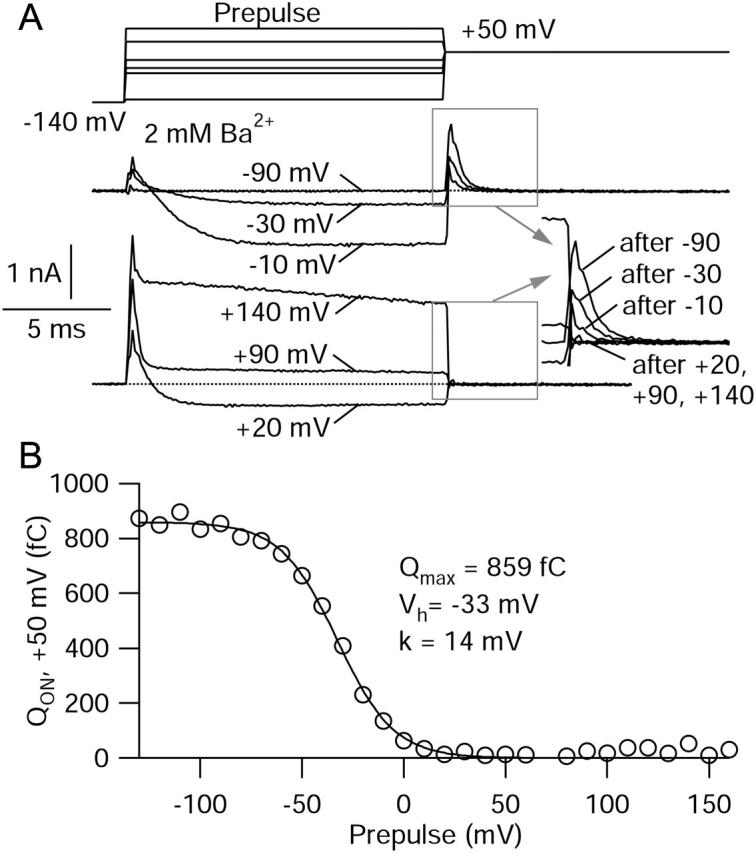
Measurement of charge movement in the absence of blockers at the reversal potential for ionic current. (A) ON charge movements were recorded in 2 mM Ba2+ with steps to the reversal potential of +50 mV. The step to +50 mV was preceded by 15-ms voltage steps to voltages ranging from −130 mV to +160 mV (delivered from −140 mV). The top panel shows conditioning steps to −90 mV, −30 mV, and −10 mV. As the test voltage increases, less current is available to move during the pulse to +50 mV. ON charge movement can be seen at the beginning of the steps to −30 mV and −10 mV. The bottom panel shows conditioning steps to +20 mV, +90 mV, and +140 mV. Note the lack of further charge movement at +50 mV after these steps. The inset shows the magnification of gating current elicited by the step to +50 mV after the different conditioning voltages. (B) ON charge at +50 mV versus conditioning voltage. Fitted curve is a single Boltzmann function, Qmax/[1 + exp((V − Vh)/k)], where Qmax is maximal charge movement, V is the test potential, Vh is the midpoint, and k is the slope factor, with the indicated values.
Fig. 6 compares the voltage dependence of activation of ionic current in Ba2+ (open circles) and gating current in the same conditions (solid line) and gating current in Co2+ measured after replacing Ba2+ with Co2+ (dashed line), all from the same cell and expressed as a fraction of maximal activation. Ionic current was measured by the same protocol as in Fig. 5 A, but with the step to +50 mV replaced by a step to −60 mV, where peak tail current was measured. Peak tail current amplitudes were measured as a function of prepulse voltage. Activation of ionic current with this protocol was biphasic, as seen for native L-type cardiac calcium channels (Bean and Rios, 1989). Gating current measured under the same ionic conditions (solid line) activated with smaller depolarizations and with a shallower voltage dependence than ionic current, consistent with a requirement for cooperative movement of multiple voltage sensors to open the channel. When measured in the same ionic conditions, the midpoint of charge movement (−33 mV) was considerably hyperpolarized relative to the midpoint of the main component of the activation curve for ionic current (−12 mV). Charge movement measured after Co2+ replacement of Ba2+ was shifted ∼30 mV in the depolarizing direction but had a very similar shape, consistent with differences in screening of surface charge between barium and cobalt ions.
FIGURE 6.

Comparison of the voltage dependence of activation of ionic current with charge movement measured in Ba2+ and charge movement measured in Co2+. Fits from Fig. 4 (dashed line) and Fig. 5 (solid line), and the peak ionic tail current (open circles), are normalized to maximum and plotted as a function of voltage (all measurements from the same cell). Peak tail current in 2 mM Ba2+ was measured at −60 mV after a 15-ms pulse to the indicated test voltage (holding potential −120 mV).
Does FPL slow movement of the voltage sensors? We examined gating currents in control and in FPL for differences in voltage dependence, kinetics, and total magnitude. Fig. 7 shows ionic (top) and gating (bottom) currents from the same cell, in control and in FPL, in response to a voltage step to +20 mV from a holding voltage of −120 mV, with repolarization to −120 mV. Ionic currents were measured in 2 mM Ba2+. Gating currents were measured after switching to 2 mM Co2+ with an additional 50 μM Gd3+. In initial experiments, we replaced barium ions with cadmium ions, but found that in cells expressing large amounts of current, cadmium supported sizable inward ionic tail currents after large depolarizations. This was most evident in the presence of FPL, as previously reported by Fan and colleagues (2001), but such currents were also evident even in the absence of FPL, showing that there is some cadmium permeability of even unmodified channels. When Ba2+ was replaced by Co2+, there were no ionic tail currents obvious in control, but FPL induced a slow component of tail current upon repolarization that behaved as expected for ionic tail current (not saturating with progressively larger hyperpolarization). This apparently reflects flux of Co2+ through FPL-modified channels and interfered with measurements of OFF gating charge. We found that adding 50 μM Gd3+ blocked this current and gave nonlinear ON charge movements similar to those in Co2+ alone without additional tail currents in FPL; presumably, Gd3+ blocks Co2+ permeation. This combination of ions allowed us to examine the effect of FPL on gating currents over a wide voltage range using simple voltage protocols.
FIGURE 7.
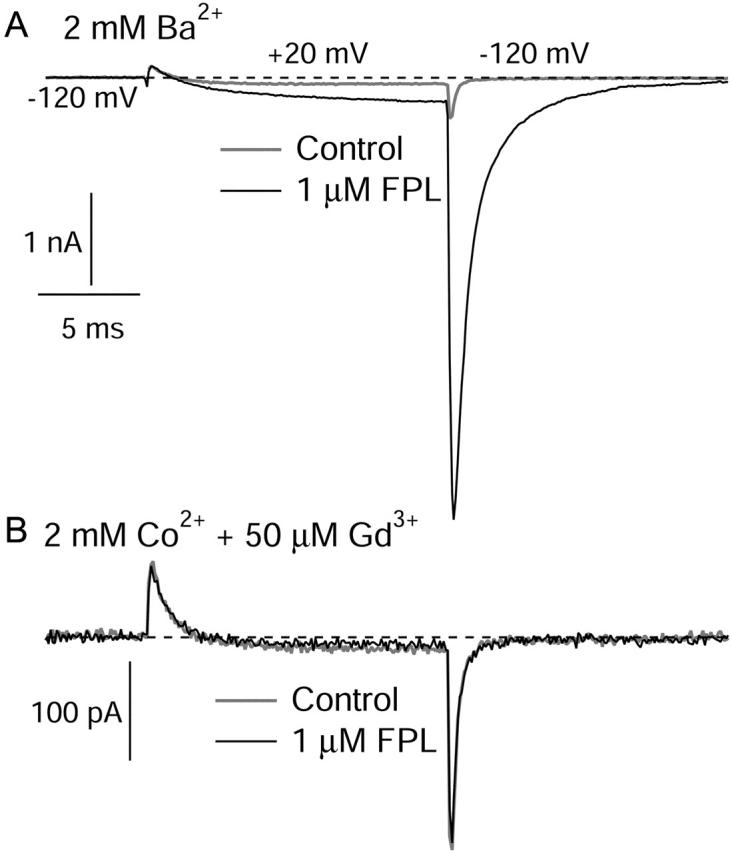
Effects of FPL on ionic and gating currents. All currents shown are from the same cell. Currents were evoked by a 15-ms pulse from −120 mV to +20 mV, followed by repolarization to −120 mV. (A) Currents were measured in 2 mM Ba2+ (shaded) and in Ba2+ + 1 μM FPL (black), after which FPL was washed off in Ba2+-based solution. (B) Gating currents in response to the same protocol were then measured in 2 mM Co2+ + 50 μM Gd3+ (shaded) and this solution with 1 μM FPL (black). Upon subsequent return to FPL-free Ba2+ solution, inward ionic currents with prolonged tail currents were present (not shown). The tail currents quickened as FPL was washed out, confirming that FPL did bind in the Co2+ + Gd3+ solution.
The cell whose ionic and gating currents are shown in Fig. 7 for the same voltage steps was characteristic in that FPL slowed and greatly enhanced the ionic current carried by Ba2+ (Fig. 7 A) but had no measurable effect on either the size or kinetics of either ON or OFF gating currents (Fig. 7 B). A trivial explanation of this result would be if the drug simply does not interact with the channel in the presence of Co2+ and Gd3+. To test this possibility, we made a fast solution change (<1 s) from a Co2+ + Gd3+ solution containing FPL to control (FPL-free) Ba2+ solution; this resulted in the immediate appearance of inward tail currents with the prolonged deactivation kinetics typical of FPL-modified channels (followed by gradual speeding of kinetics typical of the washout of FPL) (not shown). Since the solution exchange time is fast compared to the time required for washout of FPL, these currents were evidently carried by Ba2+ ions through channels still bound to FPL. As the cell was only exposed to FPL in Co2+ + Gd3+, this shows that the Co2+ + Gd3+ solution did not prevent FPL binding to the channel, and that the lack of detectable effect of FPL on gating currents is not simply due to a lack of FPL binding under these ionic conditions.
Fig. 8 shows ON and OFF gating currents over a range of voltages, measured in control and in FPL. At all voltages, the gating currents with and without FPL superimposed. Total ON and OFF charge movement is plotted as a function of voltage in Fig. 8 B. FPL had no detectable effects on the amplitude, kinetics, or voltage dependence of either ON or OFF charge movement.
FIGURE 8.
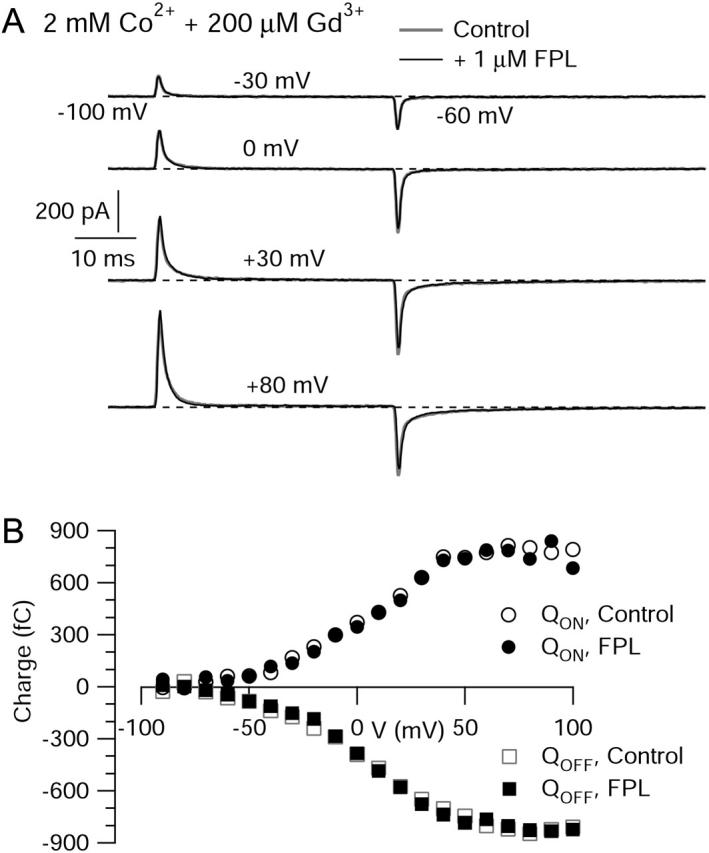
Effects of FPL on gating currents at many voltages. (A) Currents from a single cell in response to a family of test depolarizations from a holding voltage of −100 mV. Currents shown were evoked by pulses to −30 mV, 0 mV, +30 mV, and +80 mV, followed by repolarization to −60 mV, in 2 mM Co2+ + 200 mM Gd3+ without (shaded) and with (black) 1 μM FPL. Traces shown are single sweeps, leak-subtracted with appropriately scaled currents evoked by an average of 10 or 20 steps from −100 mV to −120 mV. (B) ON (circles) and OFF (squares) charge movement integrated from the currents above, in control (open symbols) and in 1 μM FPL (solid symbols).
We also examined the effects of FPL on ionic and gating currents under the same ionic conditions, using the protocol of measuring gating current with pulses to the ionic reversal potential (Fig. 9). This experiment was designed to explore possible effects of FPL on the kinetics of movements of OFF charge, which, as shown in Fig. 4, appears to have both fast and slow phases in control. Two pulses to +50 mV were given, with the two pulses separated by a variable time at −120 mV. The first depolarization to +50 mV fully activates all available charge movement, as shown in Fig. 5. Charge then moves back during the repolarization to −120 mV. The movement of OFF charge cannot be measured directly, since it is obscured by the much larger ionic tail current, but the extent to which charge has returned can be assayed by a second step to +50 mV: only charge that has moved back can move forward again during the second step to +50 mV. Thus, by incrementing the time at −120 mV, the time course of OFF charge movement can be followed indirectly. Consistent with the measurements using inorganic blockers, this protocol showed that OFF charge moves in a biphasic manner (Fig. 9 B). About half the charge returned in 2–3 ms (comparable to the time course of the decay ionic tail currents), but it took more than 40 ms for the rest of the charge to completely return. The biphasic recovery of ON charge was paralleled by changes in the ionic tail current after the steps to +50 mV. After a 2-ms recovery at −120 mV, the tail current was reduced to about half, and with longer periods at −120 mV, the tail after the second step gradually increased back toward the level of that after the first step. An interpretation of the kinetics of gating current and ionic tail current with this protocol is that some channels (about half) enter some sort of inactivated state during the first 10 ms pulse to +50 mV, and that charge returns much more slowly from this state. The growth of both the ON charge movement and the tail current associated with the second step to +50 mV then represent the slow recovery back to rest of these inactivated channels.
FIGURE 9.
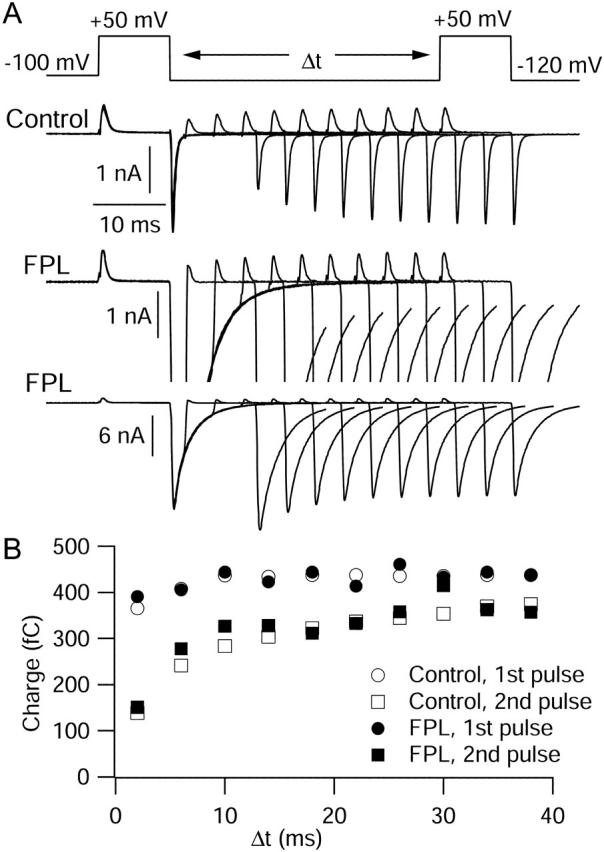
Simultaneous measurement of the effects of FPL on ionic and gating currents. (A) Currents elicited by a family of 10 voltage jump protocols. Each protocol (top) consisted of two 10-ms steps to the reversal potential of +50 mV, separated by a step to −120 mV of variable duration. The initial step to −120 mV lasted 2 ms, and each subsequent step was incremented by 4 ms. All measurements were taken in 2 mM Ba2+ with no ionic blockers. Control currents (top row of currents) showed progressive growth (as the step to −120 mV was lengthened) of both gating current at the start of the second step to +50 mV and tail current after this step. The currents in FPL are shown at two different scales: at the same scale as control (middle row of currents) to allow comparison of gating currents, and at a compressed scale to show the enhancement of tail currents (bottom row). (B) Total charge movement during the first (circles) and second (squares) steps to +50 mV, in control (open symbols) and in FPL (solid symbols), as a function of the interpulse time at −120 mV. ON currents at +50 mV were integrated for 6 ms, starting 0.8 ms after the onset of the voltage step.
After moving the cell into a solution containing 1 μM FPL, the ionic tail currents were dramatically increased and slowed, but gating currents were unchanged. The traces in FPL are shown on two scales, one the same as for control, showing the gating current for the +50-mV pulses, and one with reduced scale to show the greatly enhanced and slowed tail currents (Fig. 9 A, lower row). The presence of FPL had no effect on the gating current during the first pulse to +50 mV, and it also had no effect on the kinetics of OFF charge movement at −120 mV as assayed by the second pulse to +50 mV; the ON charge elicited by the second pulse returned in a biphasic manner indistinguishable from control (Fig. 9 B). The lack of change of charge movement at −120 mV is striking because of the large effects on ionic current. In addition to slowing the decay of the tail currents at −120 mV, there was a change in the relation of the second tail current to the first. In the presence of FPL, the tail current associated with the second step to +50 mV was larger than for the first pulse, with an interpulse interval of 2–4 ms, in contrast to the substantial reduction of the second tail under control conditions. In FPL, the second tail then declined in amplitude as the duration of time at −120 mV increased, rather than increasing as in control. The Discussion presents a model that can rationalize these changes.
DISCUSSION
The most fundamental result of our experiments for understanding the mechanism of the modification of calcium channels by FPL is FPL's complete lack of effect on gating currents. Most strikingly, the gating current experiments show that the speed at which the channel voltage sensors return to rest is not detectably affected by the drug, although the signature effect of FPL is a dramatic slowing of the ionic tail currents. Other data show that outward current is much less affected by FPL than inward current and that FPL does not always slow channel deactivation, but instead alters the voltage dependence of deactivation such that deactivation is actually faster at extreme hyperpolarizations. The modification of kinetics of ionic current under exactly the same ionic conditions in which there is no change in gating current shows that FPL somehow alters the coupling of charge movement to opening and closing of the pore.
Channel transitions affected by FPL
Fig. 10 A shows a simple kinetic model for calcium channel gating in which there are multiple voltage dependent transitions between closed states involving charge movement followed by a final voltage-independent opening step, similar to the gating scheme for Shaker K+ channels described by Zagotta and Aldrich (1990). In the context of this gating scheme, the major effects of FPL on ionic currents can be explained by a change in a single voltage-independent rate constant, namely a slowing of the closing rate constant for the final step in channel activation. Increasing the ratio of the forward to the reverse rate constant of the final voltage-independent transition would produce the steady-state enhancement of inward currents and reduction of the closing rate constant would produce slowing of tail currents. With this model FPL has no effect on steps involving charge movement. However, the model still predicts a change in gating current; in particular, OFF charge movement cannot occur until after channel closing, so that slowing of ionic tail currents predicts similar slowing of OFF charge movement. This is contrary to the experimental results.
FIGURE 10.

Kinetic models for calcium channel gating in which FPL affects only nonvoltage-dependent gating steps. (A) Model based on Zagotta and Aldrich (1990) in which four sequential activation steps involving charge movement are followed by a nonvoltage-dependent pore-opening step. (B) Allosteric model based on Marks and Jones (1992) in which movement of gating charge can occur between both closed (upper row) and open (bottom row) states and in which pore opening does not involve charge movement but is favored by progressive movement of charge.
Fig. 10 B shows a model in which there is looser coupling of channel opening to charge movement. In this model, introduced by Marks and Jones (1992) to account for effects of the dihydropyridine agonist (+)202–791 on single-channel gating kinetics, there are multiple open states in parallel with closed states, with charge movement able to occur among the open-open transitions as well as the closed-closed transitions. Coupling of charge movement to channel opening is allosteric, so that it is not strictly necessary for charge movement to be complete for channel opening to occur. Rather, channel opening is increasingly favored as more charge moves from the OFF to the ON position, and conversely, channel opening stabilizes states in which charge has moved. This scheme can account well for the rather complex effects of dihydropyridine agonists on single channel gating, on the assumption that the drugs stabilize the open states of the channel (Marks and Jones, 1992). The model is also appealing for explaining the minimal effects of agonists on gating current, since the loose coupling of channel opening to gating charge movement means that in the presence of drug, OFF charge movement can move back while channels remain open, consistent with greater slowing of ionic tail currents than movement of OFF charge movement. However, in simulations using this model we found that it predicted significant slowing of OFF charge movement when implemented with rate constants that could reasonably simulate slowing of ionic tail currents. This is because the stabilization of open states by the drug stabilizes charge in the ON position indirectly, due to the coupling of channel opening to charge movement. We were unable to find rate constants that could duplicate the slowing of ionic currents without producing slowing of gating charge movement that would have been easily detectable experimentally.
Any model in which FPL affects gating steps predicts some change in charge movement, since even if the gating steps affected by drug are not voltage-dependent, they must be coupled to voltage-dependent steps for the voltage dependence and kinetics of ionic current to be affected by the drug. We therefore considered a very different kind of model in which drug is hypothesized to have literally no effect on gating steps but instead changes the permeability associated with a particular state. This class of models was stimulated by several observations in the literature. First, both Handrock and colleagues (1998) and Fan and colleagues (2001) have presented evidence from single-channel recordings in native cardiac muscle cells that FPL-modified calcium channels have a larger single-channel conductance than in control, implying change in pore structure by the drug. Fan and colleagues further showed that FPL-modified channels become permeable to Cd2+, implying that the change in pore structure may be substantial. Studies by Leuranguer and colleagues (2003) on Bay K 8644 modification of cardiac L-type channels have also provided evidence that permeation properties are affected by this drug, whose actions may share at least some similarities with FPL; they showed that Bay K 8644-modified channels have altered rectification properties, apparently passing inward current but little or no outward current. These results show that both FPL and Bay K 8644 do more than just affect gating steps. Given that the simplest interpretation of the gating current measurements would be that FPL actually has no effect on gating steps, we asked whether it might be possible to rationalize the effects of FPL by a model in which the drug affects only ion permeation of the channel.
Fig. 11 shows a model of this sort that can account for many of the effects of FPL. The hypothesis is that the drug has no effect at all on channel gating, but modifies the permeability of a gating state that is nonconducting in control and becomes conducting in the presence of drug. For simplicity, we performed simulations using just three states: a single closed resting state, an open state, and a state that is nonconducting in control and becomes conducting in drug. We have called this state “I” since in control, it behaves more or less like an inactivated state, being maximally populated with a delay compared to the open state. We hypothesize that in the presence of drug, this state passes ionic current. In line with the results of Handrock et al. (1998) and Fan et al. (2001) that single-channel conductance is larger in the presence of FPL, the conductance for passing inward current of the FPL-modified inactivated state is assumed to be larger than for the normal open state; a 42% increase was assumed based on the results of Handrock et al. using Ba2+ as a charge carrier. If outward currents through the FPL-modified channels also increased by this much, the effect of FPL on peak outward currents would be much more than observed experimentally. Thus we assumed that the permeability for outward movement of Cs+ ions was the same as for normal open channels (Fig. 11 B). This implies that the FPL-modified channels rectify differently than normal channels, a feature that might seem excessively ad hoc if it weren't for recent evidence that Bay K 8644-modified channels do have this property (Leuranguer et al., 2003).
FIGURE 11.

Model for action of FPL based on modification of permeability of a normally nonconducting (inactivated) state. (A) Gating scheme. In the absence of drug, channels interconvert between three states, a closed state (C), occupied at rest, and two states occupied during depolarizations, a conducting open state (O), and a nonconducting inactivated state (I). During step depolarizations, entry into the open state is faster than into the inactivated state but at equilibrium more channels are in the inactivated state. In the presence of drug, gating transitions are hypothesized to be exactly the same as in the absence of drug; the only difference is that the inactivated state is conducting. (B) Current-voltage relationships hypothesized for the open state (thick solid line) and the “inactivated” state with FPL present (thin solid line) and without FPL (nonconducting, dashed line). (C) Predicted currents for step to 0 mV followed by repolarization to −100 mV (left) and (right) time course of relative occupancy of open (thick lines) and inactivated states (thin lines). (D) Predicted currents for step to +180 mV followed by repolarization to −100 mV (left) and time course of relative occupancy of open and inactivated states (right). Rate constants (ms-1): kCO = 1 × exp(V/3.2), kOC = 1 × exp(−V/500), kOI = 0.01, kIO = 0.0039 × exp(−V/110), kCI = 0.33 × exp(V/3.2), kIC = 0.13 × exp(−V/90).
The model fits with our main experimental results in predicting no change at all in gating currents, since the movement between states is not affected by drug. The increase in ionic current occurs as a consequence of the permeability of the inactivated state, and the relatively slow time course of occupancy of this state gives rise to the apparent slowing of activation that is characteristic of FPL (Figs. 1 and 11 C). The permeability of the inactivated state means that there is no longer macroscopic inactivation of ionic currents; this is particularly striking at large depolarizations, where control inactivation is quite rapid. This matches the experimental observations (Fig. 2).
According to the model, the time course of the slow tail currents in FPL reflects movement of channels from the inactivated state back to the closed state, a transition that at physiological voltages is much slower (5- to 10-fold) than deactivation of open channels. About half the channels follow the slow return path after moderate depolarizations, which would produce a slow phase of OFF gating charge. In control, this gating step is electrically silent (at least in terms of ionic current), whereas with FPL, it is associated with tail currents corresponding to ionic current flowing through the modified inactivated state. This predicts that there should be one phase of return movement of gating charge (identical in both control and with FPL) with a similar slow time course as tail current in FPL. The experimental results in Fig. 9 C are consistent with this prediction.
In the model, the voltage dependence of the rate constant for conversion of channels from the inactivated state back to the closed state is relatively weak (e-fold for 90 mV). However, deactivation of open channels has even weaker voltage dependence (e-fold for 500 mV), consistent with very little change in the time constant for control tail currents at voltages between −100 and −250 mV. This has the consequence that for very strong hyperpolarizations, negative to −200 mV, the movement of channels from the inactivated state to the closed state becomes faster than deactivation of open channels, explaining how tail currents can be faster in FPL than control over this voltage range (Fig. 12). Since the forward rate constants (C to O and C to I) have the same strong voltage dependence (e-fold for 3.2 mV), the stronger voltage dependence of the back rate constants from the inactivated state means that more total charge movement is associated with the conversion of channels between the closed and inactivated states than between the closed and open states. For charge to be conserved, this means that there is some charge movement between the open and inactivated states. The model matched the voltage dependence of the kinetics of experimental currents best when the voltage dependence of this conversion was in the reverse direction, with the open to inactivated rate constant being independent of voltage. The rate constants of the model shown in Fig. 11 A satisfied both conservation of charge and the principle of microscopic reversibility.
FIGURE 12.
Predicted tail currents with and without FPL. Same model and parameters as in Fig. 11. Control currents are shaded traces and currents in FPL are black. Channels were activated by a 15-ms step from −100 mV to +50 mV, and tail currents were then elicited by repolarization to voltages of −80 mV (A), −160 mV (B), or −260 mV (C). Right panels show predicted control and FPL-modified currents scaled to match peak tail currents, as in Fig. 3.
Limitations of the model
Our main goal in the experiments reported here was to investigate how particular gating steps were affected by FPL using gating current measurements. Being led to a model in which effects on permeation rather than gating are central was unexpected, and different kinds of experiments will be required to fully test predictions of the model. For example, the model predicts two conducting states in the presence of drug, with different single-channel amplitudes. The prediction of no effects of FPL on gating charge movement is obviously consistent with our results, and the model can also account, in a fairly straightforward way, for the speeding of tail currents at strongly hyperpolarized potentials, another experimental result that we found surprising.
One limitation of the model with respect to the experimental behavior of channels concerns the rectifying behavior of the channels. We modeled the interaction of Cs+ permeability and Ba2+ permeability using constant field equations, but the actual shape of the instantaneous current-voltage curves of cardiac calcium channels has a pronounced flattening near the reversal potential followed by a strong upward curvature for outward currents, starting at voltages ∼20 mV positive to the reversal potential (Bean et al., 1984; Hess et al., 1986; Bean, 1993). This is not captured by the model, which therefore predicted much smaller outward currents relative to inward currents than are actually present. In the experimental results of Fig. 2, it is striking that FPL enhanced the Cs-carried outward current at the end of the pulse to +180 mV by <2-fold but enhanced the Ba-carried inward current immediately following by ∼10-fold. This suggests a more profound change in rectification or ionic selectivity than is captured by the model.
With only three gating states, the model is too simple to exactly match the gating of real channels. In particular, the full details of inactivation of cardiac L-type calcium channels under control conditions are much more complex than can be captured with a single inactivated state (cf. Mitarai, 2000; Findlay, 2002; Josephson et al., 2002b). There are undoubtedly multiple inactivated states for real channels, and it would probably be more realistic to hypothesize that only one or some subset of these inactivated states become permeable with FPL bound. Possibly the state that becomes permeable with FPL present might be better regarded as a nonconducting closed state that interconverts fairly rapidly with the normal open state (and thus limits the maximal po in control conditions) rather than as a classical inactivated state. Entry into the inactivated state of the model is very rapid relative to most previous characterizations of inactivation of cardiac L-type calcium channels. Nevertheless, the experimental data do seem supportive of a rapidly entered inactivated state, since there is clearly a fast phase of current decay (especially apparent for large depolarizations, e.g., Fig. 2), and test pulses of only 10–15 ms to voltages positive to +20 mV (Figs. 4 and 9) were sufficient to induce a slow component of OFF gating charge movement, typical of channels that have undergone voltage-dependent inactivation (Ferreira et al., 2003).
The model assumes that rate constants for gating to and from the inactivated state are completely unchanged when this state becomes conducting in the presence of FPL. This ignores that the free energy of a state may be different simply depending on whether it is open or closed (all else being unchanged), since it might be stabilized or destabilized by occupancy of permeant ions or water molecules. It seems plausible that such effects may be negligible from the example of the W434F mutation of the Shaker potassium channel, which renders the normal open state nonconducting but has no detectable effect on the voltage-dependence of charge movement (Perozo et al., 1993).
Comparison to Bay K 8644
The effects of FPL on L-type calcium channels are broadly similar to those of S-(−)-Bay K 8644, the enantiomer of Bay K 8644 that enhances ionic current and slows tail currents (Kass, 1987). The amino acids that bind FPL are different from those that bind Bay K 8644 (Zheng et al., 1991; Rampe and Lacerda, 1991; see Hockerman et al., 1997), but in the same region, since currents through chimeric channels with minimal L-type sequence were increased by FPL as well as by Bay K 8644 (Grabner et al., 1996). Interestingly, however, there are clear differences between the two drugs on both gating current and on inactivation. In contrast to our results with FPL, studies with Bay K 8644 have shown a hyperpolarizing shift in the voltage dependence of ON charge movement (Josephson and Sperelakis, 1990; Hadley and Lederer, 1992; Artigas et al., 2003) and also a slowing of the kinetics of OFF charge movement (Hadley and Lederer, 1992; Fan et al., 2000; Artigas et al., 2003). Also, Bay K 8644 enhances rather than slows inactivation (Kass, 1987), and the contrasting effects of Bay K 8644 and FPL on inactivation have been clear in studies directly comparing the two drugs on the same preparation (Rampe et al., 1993; Fan et al., 2000; cf. Usowicz et al., 1995). Thus our model for FPL's actions seems unlikely to apply to Bay K 8644. On the other hand, Bay K 8644 has been found to produce increases in single channel current (Caffrey et al., 1986) and to change the rectification of channels (Leuranguer et al., 2003). Thus it is plausible that Bay K 8644's actions could include inducing new permeability of gating states that are nonconducting in control, as we propose for FPL. If so, perhaps the states affected by Bay K 8644 are a subset of those affected by FPL and do not include the absorbing inactivated states responsible for macroscopic inactivation.
Possible relevance to physiological modulation
Macroscopic currents carried by cardiac L-type calcium channels can be enhanced by physiological stimuli, notably β-adrenergic stimulation, as well as by drugs like Bay K 8644 and FPL. At the level of single channel gating, there are intriguing parallels between modulation of channels by FPL or dihydropyridine agonists and modulation by physiological pathways, in particular the potentiation of long-lasting “mode 2” single channel openings (Yue et al., 1990; Ono et al., 1993). Also, β-adrenergic enhancement of calcium current is accompanied by a dramatic slowing of inactivation for large depolarizations (Bean et al., 1984; Bean, 1993), much like the effect of FPL at these voltages.
Current through cardiac L-type calcium channels can also be potentiated after large depolarizations (Pietrobon and Hess, 1990). It is clear that the changes produced by depolarization-induced potentiation are not identical to those produced by Bay K 8644 (Wilkens et al., 2001). Nevertheless, there are some points of similarity with the potentiation produced by Bay K 8644 and FPL and β-adrenergic stimulation, including induction of “mode 2” single-channel gating behavior (Pietrobon and Hess, 1990; Josephson et al., 2002b). Another similarity is that both depolarization-induced potentiation and Bay K 8644-induced potentiation alter rectification properties of the channels (Leuranguer et al., 2003), reminiscent of the changes in ionic permeability seen with FPL (Fan et al., 2001). Also, depolarization-induced potentiation (Josephson et al., 2002a) and FPL modification (Handrock et al., 1998; Fan et al., 2001) produce similar increases in single-channel conductance. The still-emerging elements of similarity between the actions of FPL and those of β-adrenergic stimulation and depolarization-induced potentiation raise the intriguing possibility that the model we propose for FPL could also have application in channel modulation by more physiological mechanisms.
Acknowledgments
This work was supported by the National Institutes of Health (grants HL35034 and NS38312).
References
- Altier, C., R. L. Spaetgens, J. Nargeot, E. Bourinet, and G. W. Zamponi. 2001. Multiple structural elements contribute to voltage-dependent facilitation of neuronal α1C (CaV1.2) L-type calcium channels. Neuropharmacology. 40:1050–1057. [DOI] [PubMed] [Google Scholar]
- Artigas, P., G. Ferreira, N. Reyes, G. Brum, and G. Pizarro. 2003. Effects of the enantiomers of BayK 8644 on the charge movement of L-type Ca channels in guinea-pig ventricular myocytes. J. Membr. Biol. 193:215–227. [DOI] [PubMed] [Google Scholar]
- Baxter, A. J. G., J. Dixon, F. Ince, C. N. Manners, and S. J. Teague. 1993. Discovery and synthesis of methyl 2,5-dimethyl-4-[2-(phenylmethyl)benzoyl]-1H-pyrrole-3-carboxylate (FPL 64176) and analogues: the first examples of a new class of calcium channel activator. J. Med. Chem. 36:2739–2744. [DOI] [PubMed] [Google Scholar]
- Bean, B. P. 1993. Beta-adrenergic modulation of cardiac Ca channel gating. In Ion Channels in the Cardiovascular System: Function and Dysfunction. A. M. Brown, W. A. Catterall, P. M. Spooner, and H. C. Strauss, editors. Futura Press, Armonk, NY. 237–252.
- Bean, B. P., M. C. Nowycky, and R. W. Tsien. 1984. Beta-adrenergic modulation of calcium channels in frog ventricular heart cells. Nature. 307:371–375. [DOI] [PubMed] [Google Scholar]
- Bean, B. P., and E. Rios. 1989. Nonlinear charge movement in mammalian cardiac ventricular cells. Components from Na and Ca channel gating. J. Gen. Physiol. 94:65–93. [DOI] [PMC free article] [PubMed] [Google Scholar]
- Caffrey, J. M., I. R. Josephson, and A. M. Brown. 1986. Calcium channels of amphibian stomach and mammalian aorta smooth muscle cells. Biophys. J. 49:1237–1242. [DOI] [PMC free article] [PubMed] [Google Scholar]
- Chen, C., and H. Okayama. 1987. High-efficiency transformation of mammalian cells by plasmid DNA. Mol. Cell. Biol. 7:2745–2752. [DOI] [PMC free article] [PubMed] [Google Scholar]
- Fan, J.-S., Y. Yuan, and P. Palade. 2000. Kinetic effects of FPL 64176 on L-type Ca2+ channels in cardiac myocytes. Naunyn Schmiedeberg's Arch. Pharmacol. 361:465–476. [DOI] [PubMed] [Google Scholar]
- Fan, J.-S., Y. Yuan, and P. Palade. 2001. FPL-64176 modifies pore properties of L-type Ca2+ channels. Am. J. Physiol. 280:C565–C572. [DOI] [PubMed] [Google Scholar]
- Ferreira, G., E. Rios, and N. Reyes. 2003. Two components of voltage-dependent inactivation in Cav1.2 channels revealed by its gating currents. Biophys. J. 84:3662–3678. [DOI] [PMC free article] [PubMed] [Google Scholar]
- Findlay, I. 2002. Voltage-dependent inactivation of L-type Ca2+ currents in guinea-pig ventricular myocytes. J. Physiol. (Lond.). 545:389–397. [DOI] [PMC free article] [PubMed] [Google Scholar]
- Grabner, M., Z. Wang, S. Hering, J. Striessnig, and H. Glossman. 1996. Transfer of 1,4-dihydropyridine sensitivity from L-type to class A (BI) calcium channels. Neuron. 16:207–218. [DOI] [PubMed] [Google Scholar]
- Hadley, R. W., and W. J. Lederer. 1992. Comparison of the effects of BAY K 8644 on cardiac Ca2+ current and Ca2+ channel gating current. Am. J. Physiol. 262:H472–H477. [DOI] [PubMed] [Google Scholar]
- Handrock, R., F. Schroder, S. Hir, A. Haverich, C. Mittmann, and S. Herzig. 1998. Single-channel properties of L-type calcium channels from failing human ventricle. Cardiovasc. Res. 37:445–455. [DOI] [PubMed] [Google Scholar]
- Hardingham, G. E., S. Chawla, C. M. Johnson, and H. Bading. 1997. Distinct functions of nuclear and cytoplasmic calcium in the control of gene expression. Nature. 385:260–265. [DOI] [PubMed] [Google Scholar]
- Hess, P., J. B. Lansman, and R. W. Tsien. 1986. Calcium channel selectivity for divalent and monovalent cations. Voltage and concentration dependence of single channel current in ventricular heart cells. J. Gen. Physiol. 88:293–319. [DOI] [PMC free article] [PubMed] [Google Scholar]
- Hockerman, G. H., B. Z. Peterson, B. D. Johnson, and W. A. Catterall. 1997. Molecular determinants of drug binding and action on L-type calcium channels. Annu. Rev. Pharmacol. Toxicol. 37:361–396. [DOI] [PubMed] [Google Scholar]
- Jinnah, H. A., J. P. Sepkuty, T. Ho, S. Yitta, T. Drew, J. D. Rothstein, and E. J. Hess. 2000. Calcium channel agonists and dystonia in the mouse. Mov. Disord. 15:542–551. [DOI] [PubMed] [Google Scholar]
- Jinnah, H. A., S. Yitta, T. Drew, B. S. Kim, J. E. Visser, and J. D. Rothstein. 1999. Calcium channel activation and self-biting in mice. Proc. Natl. Acad. Sci. USA. 96:15228–15232. [DOI] [PMC free article] [PubMed] [Google Scholar]
- Josephson, I. R., A. Guia, E. G. Lakatta, and M. D. Stern. 2002a. Modulation of the conductance of unitary cardiac L-type Ca(2+) channels by conditioning voltage and divalent ions. Biophys. J. 83:2587–2594. [DOI] [PMC free article] [PubMed] [Google Scholar]
- Josephson, I. R., A. Guia, E. G. Lakatta, and M. D. Stern. 2002b. Modulation of the gating of unitary cardiac L-type Ca(2+) channels by conditioning voltage and divalent ions. Biophys. J. 83:2575–2586. [DOI] [PMC free article] [PubMed] [Google Scholar]
- Josephson, I. R., and N. Sperelakis. 1990. Fast activation of cardiac Ca++ channel gating charge by the dihydropyridine agonist, Bay K 8644. Biophys. J. 58:1307–1311. [DOI] [PMC free article] [PubMed] [Google Scholar]
- Kass, R. S. 1987. Voltage-dependent modulation of cardiac calcium channel current by optical isomers of Bay K 8644: implications for channel gating. Circ. Res. 61:11–15. [PubMed] [Google Scholar]
- Kaufman, R. J., and P. A. Sharp. 1982. Construction of a modular dihydrofolate reductase cDNA gene: analysis of signals utilized for efficient expression. Mol. Cell. Biol. 2:1304–1319. [DOI] [PMC free article] [PubMed] [Google Scholar]
- Kunze, D. L., and D. Rampe. 1992. Characterization of the effects of a new Ca2+ channel activator, FPL 64176, in GH3 cells. Mol. Pharmacol. 42:666–670. [PubMed] [Google Scholar]
- Lauven, M., R. Handrock, A. Muller, F. Hofmann, and S. Herzig. 1999. Interaction of three structurally distinct Ca2+ channel activators with single L-type Ca2+ channels. Naunyn Schmiedeberg's Arch. Pharmacol. 360:122–128. [DOI] [PubMed] [Google Scholar]
- Leuranguer, V., R. T. Dirksen, and K. G. Beam. 2003. Potentiated L-type Ca2+ channels rectify. J. Gen. Physiol. 121:541–550. [DOI] [PMC free article] [PubMed] [Google Scholar]
- Marks, T. N., and S. W. Jones. 1992. Calcium currents in the A7r5 smooth muscle-derived cell line: an allosteric model for calcium channel activation and dihydropyridine agonist action. J. Gen. Physiol. 99:367–390. [DOI] [PMC free article] [PubMed] [Google Scholar]
- Mikami, A., K. Imoto, T. Tanabe, T. Niidome, Y. Mori, H. Takeshima, S. Narumiya, and S. Numa. 1989. Primary structure and functional expression of the cardiac dihydropyridine-sensitive calcium channel. Nature. 340:230–233. [DOI] [PubMed] [Google Scholar]
- Mitarai, S, M. Kaibara, K. Yano, and K. Taniyama. 2000. Two distinct inactivation processes related to phosphorylation in cardiac L-type Ca(2+) channel currents. Am. J. Physiol. Cell Physiol. 279:C603–C610. [DOI] [PubMed] [Google Scholar]
- Niidome, T., T. Teramoto, Y. Murata, I. Tanaka, T. Seto, K. Sawada, Y. Mori, and K. Katayama. 1994. Stable expression of the neuronal BI (class A) calcium channel in baby hamster kidney cells. Biochem. Biophys. Res. Commun. 203:1821–1827. [DOI] [PubMed] [Google Scholar]
- O'Hare, K., C. Benoist, and R. Breathnach. 1981. Transformation of mouse fibroblasts to methotrexate resistance by a recombinant plasmid expressing a prokaryotic dihydrofolate reductase. Proc. Natl. Acad. Sci. USA. 78:1527–1531. [DOI] [PMC free article] [PubMed] [Google Scholar]
- Ono, K., H. A. Fozzard, and D. A. Hanck. 1993. Mechanism of cAMP-dependent modulation of cardiac sodium channel current kinetics. Circ. Res. 72:807–815. [DOI] [PubMed] [Google Scholar]
- Perozo, E., R. MacKinnon, F. Bezanilla,and E. Stefani. 1993. Gating currents from a nonconducting mutant reveal open-closed conformations in Shaker K+ channels. Neuron. 11:353–358. [DOI] [PubMed] [Google Scholar]
- Pietrobon, D., and P. Hess. 1990. Novel mechanism of voltage-dependent gating in L-type calcium channels. Nature. 346:651–655. [DOI] [PubMed] [Google Scholar]
- Rampe, D., B. Anderson, V. Rapien-Pryor, T. Li, and R. C. Dage. 1993. Comparison of the in vitro and in vivo cardiovascular effects of two structurally distinct Ca++ channel activators, Bay K 8644 and FPL 64176. J. Pharmacol. Exp. Ther. 265:1125–1130. [PubMed] [Google Scholar]
- Rampe, D., and R. C. Dage. 1992. Functional interactions between two Ca2+ channel activators, (S)-Bay K 8644 and FPL 64176, in smooth muscle. Mol. Pharmacol. 41:599–602. [PubMed] [Google Scholar]
- Rampe, D., and A. E. Lacerda. 1991. A new site for the activation of cardiac calcium channels defined by the nondihydropyridine FPL 64176. J. Pharmacol. Exp. Ther. 259:982–987. [PubMed] [Google Scholar]
- Triggle, D. 2004. Pharmacology of CaV1 (L-type) calcium channels. In Calcium Channel Pharmacology. S. I. McDonough, editor. Kluwer Academic/Plenum Publishing, New York. 21–72.
- Usowicz, M. M., M. Gigg, L. M. E. Jones, C. W. Cheung, and S. A. Hartley. 1995. Allosteric interactions at L-type calcium channels between FPL 64176 and the enantiomers of the dihydropyridine Bay K 8644. J. Pharmacol. Exp. Ther. 275:638–645. [PubMed] [Google Scholar]
- Wilkens, C. M., M. Grabner, and K. G. Beam. 2001. Potentiation of the cardiac L-type Ca(2+) channel (alpha(1C)) by dihydropyridine agonist and strong depolarization occur via distinct mechanisms. J. Gen. Physiol. 118:495–508. [DOI] [PMC free article] [PubMed] [Google Scholar]
- Yamaguchi, S., Y. Okamura, T. Nagao, and S. Adachi-Akahane. 2000. Serine residue in the IIIS5–S6 linker of the L-type Ca2+ channel α1C subunit is the critical determinant of the action of dihydropyridine Ca2+ channel agonists. J. Biol. Chem. 275:41504–41511. [DOI] [PubMed] [Google Scholar]
- Yue, D. T., S. Herzig, and E. Marban. 1990. Beta-adrenergic stimulation of calcium channels occurs by potentiation of high-activity gating modes. Proc. Natl. Acad. Sci. USA. 87:753–757. [DOI] [PMC free article] [PubMed] [Google Scholar]
- Zagotta, W. N., and R. W. Aldrich. 1990. Voltage-dependent gating of Shaker A-type potassium channels in Drosophila muscle. J. Gen. Physiol. 95:29–60. [DOI] [PMC free article] [PubMed] [Google Scholar]
- Zheng, W., D. Rampe, and D. J. Triggle. 1991. Pharmacological, radioligand binding, and electrophysiological characteristics of FPL 64176, a novel nondihydropyridine Ca2+ channel activator, in cardiac and vascular preparations. Mol. Pharmacol. 40:734–741. [PubMed] [Google Scholar]