Abstract
Hindered convection of macromolecules in gels was studied by measuring the sieving coefficient (Θ) of narrow fractions of Ficoll (Stokes-Einstein radius, rs = 2.7–5.9 nm) in agarose and agarose-dextran membranes, along with the Darcy permeability (κ). To provide a wide range of κ, varying amounts of dextran (volume fractions ≤ 0.011) were covalently attached to agarose gels with volume fractions of 0.040 or 0.080. As expected, Θ decreased with increasing rs or with increasing concentrations of either agarose or dextran. For each molecular size, Θ plotted as a function of κ fell on a single curve for all gel compositions studied. The dependence of Θ on κ and rs was predicted well by a hydrodynamic theory based on flow normal to the axes of equally spaced, parallel fibers. Values of the convective hindrance factor (Kc, the ratio of solute to fluid velocity), calculated from Θ and previous equilibrium partitioning data, were unexpectedly large; although Kc ≤ 1.1 in the fiber theory, its apparent value ranged generally from 1.5 to 3. This seemingly anomalous result was explained on the basis of membrane heterogeneity. Convective hindrances in the synthetic gels were quite similar to those in glomerular basement membrane, when compared on the basis of similar solid volume fractions and values of κ. Overall, the results suggest that convective hindrances can be predicted fairly well from a knowledge of κ, even in synthetic or biological gels of complex composition.
INTRODUCTION
The transport of macromolecules through hydrogels is important in separation processes, therapeutic devices, and body tissues. Such gels consist mainly of water, with a cross-linked network of polymers providing structural integrity. The gel polymers can be viewed as a network of fibers. As the size of a macromolecular solute approaches the spacing between fibers, steric and hydrodynamic interactions between the solute and fibers become increasingly important, and both diffusive and convective transport are hindered more and more. The local solute flux (N) within an isotropic gel can be expressed as
 |
(1) |
where C is the solute concentration averaged over a length scale that is large compared to the interfiber spacing but small compared to the gel sample, and v is the fluid velocity averaged in a similar manner. The concentration is averaged over the total volume (liquid plus fibers). The diffusive hindrance factor (Kd) is the diffusivity within the gel divided by the free solution diffusivity (D∞). The convective hindrance factor (Kc) is the solute-to-fluid velocity ratio under conditions where diffusion is negligible and the solute behaves as a freely suspended particle. These hindrance factors depend on molecular size and gel structure. Another size-dependent quantity is the partition coefficient (Φ), which is the concentration of the macromolecular solute in the gel divided by that in free solution, at equilibrium. Whereas only Kd and Kc appear in Eq. 1, it is the products ΦKd and ΦKc that are needed to relate transmembrane fluxes to external concentrations.
One way to describe the effects of molecular size on Kd, Kc, and Φ is to use hindered transport theories developed for membranes with long, regularly shaped (e.g., cylindrical) pores (Deen, 1987). Thus, a given gel might be viewed as having a certain effective pore size and pore number density. The attractiveness of that approach is diminished by the absence of a clear connection between those pore parameters and the sizes and/or volume fractions of the cross-linked gel polymers. Closer to reality are models that envision a gel as a network of fibers with fluid-filled interstices. Because the arrangement of gel polymers is typically disordered, a common assumption is that the fibers are randomly positioned and oriented. Most such modeling has focused on diffusion (Clague and Phillips, 1996; Johnson et al., 1996; Phillips, 2000) or partitioning (Ogston, 1958; Fanti and Glandt, 1990a,b; Lazzara et al., 2000; White and Deen, 2000). Similarly, experimental information on macromolecular diffusion (Johnson et al., 1995, 1996; Gibbs et al., 1992; Kosar and Phillips, 1995; De Smedt et al., 1997; Kosto and Deen, 2004) or partitioning (Laurent, 1963; Lazzara and Deen, 2004; Kosto et al., 2004) in hydrogels is more readily available than data on convection. Kapur et al. (1997) studied hindered convection in membranes with pores filled with polyacrylamide, via sieving experiments where diffusion was negligible. Johnston and Deen (1999, 2002) performed sieving experiments with agarose gels supported by polyester meshes, and used diffusion and partitioning data from other sources to correct the sieving coefficients for diffusion and estimate Kc. The only model for Kc that has been developed specifically for fibrous media is based on arrays of identical, parallel fibers, with flow perpendicular to the fiber axes (Phillips et al., 1989, 1990).
Gels that contain two or more types of cross-linked polymers have received even less attention in sieving studies than single-component gels. One of many biological examples is the glomerular basement membrane (GBM), which is part of the blood ultrafiltration barrier in renal glomerular capillaries. The GBM is ∼90% water by volume (Robinson and Walton, 1987; Comper et al., 1993) and has a polymeric network consisting of collagen IV, laminin, fibronectin, entactin, and heparan sulfate proteoglycan (Laurie et al., 1984; Yurchenco and Schittny, 1990). We have been exploring the hypothesis that the permeability properties of GBM are dictated largely by its having a certain mixture of fine and coarse fibers, and have sought to mimic those properties in synthetic gels by covalently incorporating varying amounts of dextran (“fine fibers”) into agarose gels (“coarse fibers”). The agarose-dextran composites provide an opportunity to test the ability of theories to predict the transport properties of gels that are more complex than those often studied. Previous studies with these gels focused on water permeability (White and Deen, 2002), diffusion (Kosto and Deen, 2004), and partitioning (Kosto et al., 2004). In this work, convective transport of macromolecules was characterized by measuring sieving coefficients for several sizes of Ficoll in gels of varying composition. Ficoll was chosen as the test molecule because it appears to behave much like a neutral, solid sphere (Davidson and Deen, 1988). The experiments were designed so that diffusion would be negligible. The Darcy permeability of each gel was measured, and the relationship between water flow resistance and convective hindrances was examined both experimentally and theoretically.
MATERIALS AND METHODS
Test macromolecules
Four narrow fractions of Ficoll, with weight-average molecular weights (MW) of 21, 37, 61, and 105 kDa, were special-ordered from Pharmacia LKB (Piscataway, NJ). Based on information from the manufacturer, the polydispersity index (MW/MN, where MN is number-average molecular weight) was 1.22, 1.18, 1.15, and 1.13, respectively. The Ficoll fractions were labeled with dichlorotryazinyl amino fluorescein (Sigma, St. Louis, MO) as described in De Belder and Granath (1973). The unreacted dichlorotryazinyl amino fluorescein was removed using desalting chromatography columns (Bio-Rad, Hercules, CA) before the desired product was freeze-dried. Size exclusion chromatography using Superdex 200 (Pharmacia Biotech, Piscataway, NJ) showed no evidence of free fluorescein (Kosto and Deen, 2004). The Stokes-Einstein radii (rs) of the Ficolls, determined previously from free-solution diffusivities measured using fluorescence recovery after photobleaching (Kosto and Deen, 2004; Kosto et al., 2004), were 2.7, 3.5, 4.5, and 5.9 nm. For the sieving experiments, dilute aqueous solutions were made by dissolving 0.02 mg/mL of a given Ficoll in 0.1 M KCl with 0.01 M sodium phosphate, at pH 7.0.
Gel preparation
The gel synthesis procedure was the same as that used previously (Kosto and Deen, 2004; White and Deen, 2002). Agarose (Type IV; Sigma) was added to the KCl-phosphate buffer and heated in a 90°C oven for 4–6 h, until it was completely dissolved. The hot agarose solution was poured carefully onto a 2.5-cm diameter woven polyester support (catalog no. 148 248; Spectrum Laboratories, Rancho Dominguez, CA) that was placed on a heated glass plate. The mesh fibers in the support formed square openings of 43 μm and had a thickness of 70 μm, with 29% open area. After placing a second hot glass plate on top, the sample was cooled to room temperature and immersed in buffer overnight at 7°C. The gels to which dextran was to be added were immersed in 500 kDa dextran (Sigma) solutions of either 50 or 150 mg/mL for at least 24 h, which greatly exceeds the diffusional equilibration time calculated from reported diffusivities for dextran in agarose (Key and Sellen, 1982). A 2-Mrad exposure to an electron beam (High Voltage Research Laboratory, Massachusetts Institute of Technology) was used to covalently link the dextran to the agarose. After irradiation, each gel was equilibrated with a large volume of buffer (2 mL, as compared to a typical gel volume of 0.025 mL) to remove any free dextran. The agarose concentrations of 4.1 and 8.2% (w/v) were converted to volume fractions (φa) by dividing by 1.025 (Johnson et al, 1995); that is, φa = 0.040 or 0.080. The volume fractions of immobilized dextran (φd), determined previously, ranged from 0.0008 to 0.011 (Kosto and Deen, 2004).
Design of filtration experiments
Hindered convection in the gel membranes was quantified by measuring Ficoll sieving coefficients at high membrane Peclet numbers and correcting for the effects of concentration polarization. The true membrane sieving coefficient (Θ) is the filtrate concentration divided by that in the fluid contacting the upstream membrane surface. It differs from the measured sieving coefficient (Θ′), which uses the bulk retentate concentration as the upstream value; the effect of concentration polarization is to make Θ′ > Θ. The sieving coefficient was related to the hindrance factors in the usual manner by integrating Eq. 1 across a membrane of thickness L, assuming pseudosteady conditions. At each interface, the intramembrane concentration divided by that in the adjacent external solution was equated with Φ. (Provided that the solutions are dilute, as in our experiments, the values of Φ at the upstream and downstream sides will be equal.) The filtrate itself was the only source of “downstream” fluid, and the rate at which solute was carried away on the collection side equaled the rate at which it crossed the membrane. Accordingly, the filtrate concentration was calculated as the solute flux divided by the transmembrane fluid velocity. The result was
 |
(2) |
 |
(3) |
where Pe is the membrane Peclet number and v the filtrate velocity (volume flux). For velocities such that Pe ≫ 1, Eq. 2 simplifies to
 |
(4) |
As will be discussed, the Ficoll sieving experiments were designed so that Eq. 4 would be valid.
A comment on notation is needed. In Eqs. 2–4, the hindrance factors appear only as products with the partition coefficient (i.e., as ΦKc and ΦKd). Thus, it is only those products, and not Kc or Kd alone, that can be inferred from sieving (or other transmembrane flux) measurements. Parentheses around such a product (as in Eq. 3) will be used to indicate that it should be viewed as a single (measurable) entity, and that the expression should not be simplified by canceling Φ. Where there is no danger of such cancellation (as in Eqs. 2 and 4), the parentheses will be omitted for simplicity.
Darcy permeability
The Darcy permeability (κ) of each mesh-reinforced gel was measured before and during the Ficoll filtration experiments, using methods developed previously (Johnson and Deen, 1996). The supported gel membrane was placed in a 10-mL ultrafiltration cell (Millipore, Bedford, MA) that was filled with the KCl-phosphate buffer. The cell was pressurized using nitrogen to between 0.69 and 30.6 kPa, depending on the gel composition and the Ficoll size to be used (see below). Samples of filtrate collected over timed intervals were weighed to determine the volume flow rate (Q). The gel thickness (L), measured by confining the membrane between two microscope slides of known thickness and using a micrometer, ranged from 70 to 150 μm. From these measurements, κ was calculated as
 |
(5) |
where μ is the viscosity of water, A is the exposed membrane area, ΔP is the pressure drop, and β is a correction factor that accounts for the increased flow resistance due to the polyester mesh support. That factor, which increases with L (Johnson and Deen, 1996), ranged from 0.41 to 0.59 in these experiments. To examine the possible dependence of κ on ΔP, separate experiments were performed in which two or more applied pressures were employed consecutively with a given membrane.
Ficoll sieving
After the first Darcy permeability measurement, the apparent sieving coefficient (Θ′) was determined for a given Ficoll fraction. After refilling the ultrafiltration cell with the fluoresceinated Ficoll solution, the stirring speed was set at 220 rpm (as indicated by an optical tachometer) and the cell repressurized. After a purge period of 40–90 min (corresponding to 1.5–3 times the mean residence time for the filtrate), the filtrate was collected for 40–90 min. The initial and final retentate during this experimental period were also sampled. The Ficoll concentrations of the filtrate (Cf) and of the initial and final bulk retentate (Cbi and Cbf, respectively) were measured using a spectrofluorometric detector (Shimadzu, Columbia, MD) with excitation at 488 nm and emission detection at 515 nm. It was confirmed that fluorescence intensity was linearly proportional to concentration. The apparent sieving coefficient was calculated from the measured bulk retentate and filtrate concentrations as
 |
(6) |
An arithmetic average of the initial and final retentate concentrations was an adequate approximation of the time-averaged value, because those concentrations differed by a maximum of 14%. The filtrate volume collected during Ficoll sieving yielded a second measurement of κ. Because the osmotic pressure of Ficoll at the membrane surface never exceeded 0.45% of ΔP, Eq. 5 remained applicable. (Further minimizing osmotic effects is that the reflection coefficients were often small.)
Equation 2 implies that, as Pe increases, Θ will decrease from 1 to the limiting value given by Eq. 4. To ensure operation at the high Pe limit, preliminary experiments were performed in which the pressure was increased (typically doubled) in consecutive runs using the same membranes, until Θ was found to be independent of ΔP. This was done for the smallest and largest Ficolls in both 4% and 8% agarose gels, each with zero or high dextran concentration.
Correction for concentration polarization
Concentration polarization in the same ultrafiltration cell was characterized by Johnston et al. (2001). Of the approaches tested there, we chose to employ the “hybrid model”, in which a stagnant film approximation was applied locally, but the film thickness allowed to vary over the membrane surface in a manner consistent with laminar boundary layer theory. For our particular cell, it was inferred from sieving data for bovine serum albumin that the angular velocity of the bulk fluid (ω) was 0.36 times that of the stirrer (Johnston et al., 2001). For the case of negligible osmotic pressure, the key parameter in the theory is the dimensionless filtrate velocity, defined as
 |
(7) |
where ρ is the fluid density and Sc = μ/(ρD∞) is the Schmidt number. For α = 0–0.4, as in these experiments, the hybrid model predicted sieving coefficients that were almost identical to those of a more rigorous boundary layer model, but with less computational effort. In the hybrid model the apparent and true sieving coefficients are related as
 |
(8) |
 |
(9) |
 |
(10) |
where r is the radial coordinate and R is the radius of the exposed membrane. Given experimental values of Θ′ and α, an iterative procedure was used to compute Θ, with the integral in Eq. 8 evaluated numerically.
FIBER MATRIX THEORY
Overview
As mentioned earlier, the only theory that has been developed specifically for hindered convection in fibrous media is one in which a single population of long fibers is arranged in parallel, and the direction of transport is normal to the fiber axes. Although such structural regularity is unrealistic even for pure agarose gels, the theory is surprisingly good at capturing key trends, as will be shown. In this section, the governing equations are presented first for uniformly spaced fibers arranged in square arrays, and then a hypothetical situation is considered in which a membrane has distinct regions with different fiber spacings. The fiber radius (rf) is assumed constant throughout, and the volume fraction of fibers (φ) is the measure of fiber spacing. The dimensionless solute size is λ = rs/rf.
Regularly spaced fibers
Of primary interest here are the Darcy permeability, equilibrium partition coefficient, and convective hindrance factor. For flow normal to a square array of parallel cylinders, Sangani and Acrivos (1982) showed that
 |
(11) |
Based on the fraction of the total volume available to a sphere center, the partition coefficient is found to be
 |
(12) |
The available results for Kc from Phillips et al. (1990) are based on fibers represented as strings of closely spaced beads, raising the question of which radius and volume fraction should be used in adapting those results to smooth cylinders. Replotting the Darcy permeability results of the bead model, we found an excellent correspondence with Eq. 11 when the center-to-center distance between fiber axes was the same for the two representations, and the bead radius was equated with rf. Accordingly, we regarded the equivalent cylindrical fiber as one that would just enclose a string of beads. The volume of fraction of beads (φ*) is, of course, less than the volume fraction of the enclosing cylinder (φ). The surface-to-surface spacing between adjacent beads in a string was held at 0.05 times the bead radius (Phillips et al., 1990), from which it follows that φ* = 0.65φ. The results for the numerical simulations of Phillips et al. (1990) were correlated in terms of the bead volume fraction and relative solute size as
 |
(13) |
 |
(14) |
 |
(15) |
These results are restricted to 0.5 ≤ λ ≤ 5, and to a certain range of φ* for each λ. Using rf = 1.6 nm, a value inferred for agarose (Lazzara and Deen, 2004), 1.7 ≤ λ ≤ 3.7 for our solutes. For λ values that large, the excluded volume due to a string of beads will closely approach that of a smooth cylinder of the same overall radius. In other words, Eq. 12 will be nearly as accurate then for a string of beads as it is for a smooth cylinder. Although not used in our calculations, it is worth noting that a correlation similar to Eq. 13 is available also for Kd (Phillips et al., 1990).
Regions with different fiber spacings
As will be discussed, the Ficoll sieving data suggest that there may have been some heterogeneity in the flow paths through our gel membranes. To explore the consequences of such heterogeneity, we considered an idealized membrane that is a patchwork of two kinds of regions, one with more closely spaced fibers (region 1) and the other with more widely spaced fibers (region 2). The objective was to illustrate how the presence of parallel pathways with different characteristics can lead to overall transport properties that otherwise seem anomalous.
If there are m mol of solute in a volume V of membrane gel, then the average solute concentration in the gel is m/V . If the membrane is in equilibrium with an external solution of concentration C∞, the overall partition coefficient is given by
 |
(16) |
If region i occupies an area Ai and the membrane has a uniform thickness L, then
 |
(17) |
 |
(18) |
and the partition coefficient is
 |
(19) |
where ωi = Ai/A and Φi is the partition coefficient for region i. Thus, the individual partition coefficients are weighted by the fractional membrane areas (or volumes) of the regions.
The average solute concentration in the filtrate is the total molar flow rate of solute divided by the total volume flow rate, or
 |
(20) |
where Ni and vi are the molar flux and fluid velocity, respectively, in region i. At high Pe, the local flux implied by Eq. 4 is
 |
(21) |
where Kci is the convective hindrance factor for region i and Cm is the concentration next to the upstream membrane surface. For the same ΔP across both regions, vi will be proportional to κi, the Darcy permeability for region i. With the overall sieving coefficient defined as Θ = Cf/Cm, it follows that
 |
(22) |
The weighting factor in this case is the fraction of volume flow across region i (i.e., Aiκi/ΣAiκ, where Σ denotes the summation over i). The consequences of the different weighting factors in Eqs. 19 and 22 will be discussed in connection with the calculation of apparent Kc values from sieving and partitioning data.
RESULTS
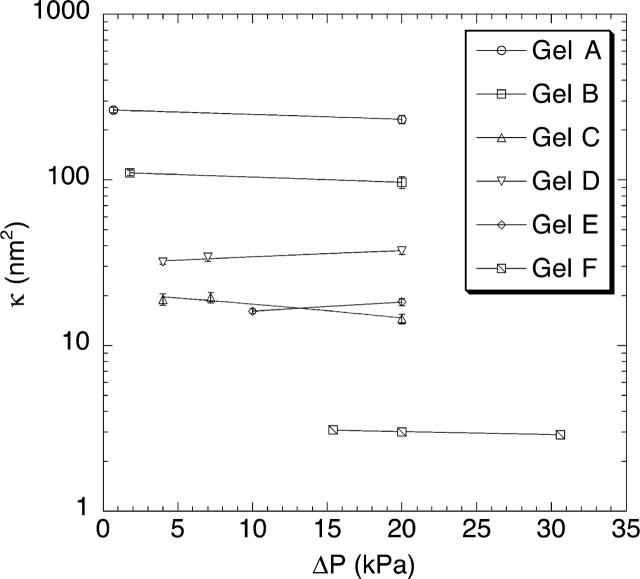
The average Darcy permeabilities for each of the six gel compositions are given in Table 1, along with the pressures and filtrate velocities used in the main set of sieving experiments. For both agarose concentrations, κ decreased by an order of magnitude as the dextran concentration was increased from zero to its maximum value. The values of κ are very similar to those measured previously in gels prepared by the same method (Kosto and Deen, 2004; White and Deen, 2002). As shown in Fig. 1, where κ is plotted as a function of ΔP for each gel composition, the Darcy permeability was found to be independent of the applied pressure. This supports an assumption made in interpreting the sieving data, namely, that varying v by changing ΔP did not alter the membrane properties.
TABLE 1.
Applied pressures, filtrate velocities, and Darcy permeabilities for the six gel compositions studied
| Gel | φa | φd | ΔP (kPa) | v (10−5 cm/s) | κ (nm2) |
|---|---|---|---|---|---|
| A | 0.040 | 0 | 0.69 ± 0.02 | 11.0 ± 0.5 | 264.1 ± 9.8 |
| B | 0.040 | 0.0008 | 1.81 ± 0.02 | 12.7 ± 0.6 | 110.2 ± 4.2 |
| C | 0.040 | 0.0076 | 7.20 ± 0.06 | 9.2 ± 0.7 | 19.5 ± 1.4 |
| D | 0.080 | 0 | 7.00 ± 0.08 | 12.1 ± 0.7 | 34.1 ± 1.9 |
| E | 0.080 | 0.0008 | 9.97 ± 0.05 | 8.1 ± 0.3 | 16.1 ± 0.5 |
| F | 0.080 | 0.011 | 30.60 ± 0.06 | 4.8 ± 0.2 | 2.9 ± 0.1 |
Values are shown as mean ± SE for 12–15 samples.
FIGURE 1.
Darcy permeability (κ) of agarose and agarose-dextran gels, as a function of the applied transmembrane pressure (ΔP). The compositions of gels A–F are given in Table 1.
Although not varying significantly with pressure at any gel composition, κ in the dextran-containing gels often increased slightly over time; these changes usually did not exceed 10%. The upward drift in κ may have been due to the loss of a small amount of dextran that was physically entangled within the agarose, but not chemically cross-linked. As discussed later, for all but the most concentrated gels (those with the smallest κ), a 10% change in κ is expected to result in a much smaller change in the measured Θ. In other words, the slight dextran loss that seems to have occurred should have had little effect on the sieving properties of the gels.
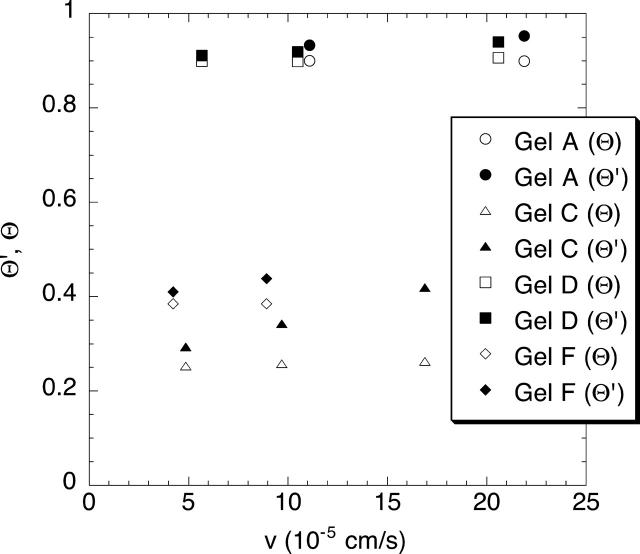
A key aspect of the experimental design was to use filtrate velocities large enough to make Ficoll transport purely convective, so that Eq. 4 would be valid. Because the membrane properties needed to estimate the Peclet number were not known in advance, preliminary sieving experiments were performed in which v was increased by increasing ΔP. Results for the smallest and largest Ficoll molecules in representative membranes are shown in Fig. 2. The constancy of Θ with increasing v (open symbols) is confirmation that Pe was large enough under these conditions for convection to be dominant. Also shown are the apparent sieving coefficients (Θ′), which are seen to increase with v (solid symbols). Such increases in Θ′ are a hallmark of concentration polarization, and the constancy of the corresponding values of Θ suggests that the corrections calculated using Eq. 8 were accurate. The effects of concentration polarization were usually moderate, Θ′ exceeding Θ by an average of 9%. The maximum correction factor was needed for sieving of the largest Ficoll through the 4% agarose gel with high dextran, where Θ′ exceeded Θ by 29%.
FIGURE 2.
Apparent and actual Ficoll sieving coefficients (Θ′ and Θ, respectively) at varying filtration velocities (v) within the same gel samples. The Ficoll radius was 2.7 nm in one experiment each with gels F and D, and 5.9 nm in one experiment each with gels A and C. The gel compositions are given in Table 1.
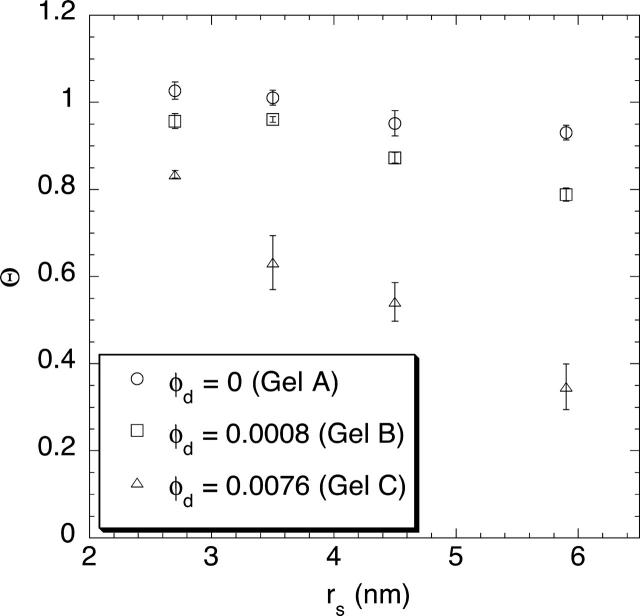
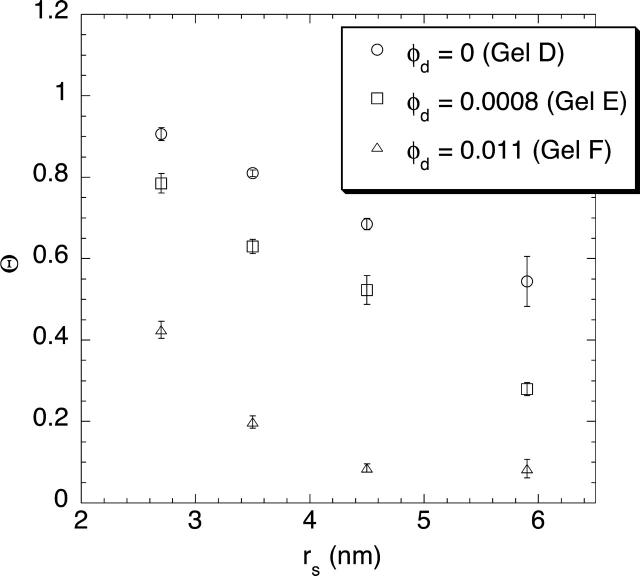
The corrected sieving coefficients of the four Ficoll fractions in 4% and 8% agarose gels are shown in Figs. 3 and 4, respectively. In each case, Θ is plotted as a function of the Stokes-Einstein radius of the Ficoll, with results given for pure agarose (irradiated as done in preparing the composite gels) and for composite gels with low and high levels of dextran. As seen in either plot, Θ tended to decrease as Ficoll size increased or as more dextran was linked to a given amount of agarose. A comparison of the data for 4% and 8% agarose, either with no dextran or the low level of dextran, shows that Θ also decreased as the agarose concentration increased. The results for the high dextran levels in the two plots are not directly comparable, because the dextran concentrations in the 4% and 8% agarose gels differed in that case (Table 1).
FIGURE 3.
Corrected sieving coefficient (Θ) of Ficoll as a function of Stokes-Einstein radius (rs), in 4% agarose gels containing varying amounts of dextran. Data are shown for four Ficoll fractions as the mean ± SE for three samples.
FIGURE 4.
Corrected sieving coefficient (Θ) of Ficoll as a function of Stokes-Einstein radius (rs), in 8% agarose gels containing varying amounts of dextran. Data are shown for four Ficoll fractions as the mean ± SE for three to six samples.
DISCUSSION
Our objective was to characterize convective transport of macromolecules in structurally complex hydrogels whose physical properties resemble those of certain biological gels. As an approximation of ideal, neutral spheres, narrow fractions of Ficoll were chosen as the test solutes. The agarose-dextran composite gels employed here had been studied previously using water flow (Kosto and Deen, 2004; White and Deen, 2002), diffusion (Kosto and Deen, 2004), and equilibrium partitioning measurements (Kosto et al., 2004), and the sieving data in Figs. 3 and 4 complete the basic information needed to describe hindered transport. Although sieving data for Ficolls and globular proteins were reported previously for pure agarose (unirradiated and dextran-free) (Johnston and Deen, 1999, 2002), diffusion was not negligible in those experiments, making the calculation of convective hindrance factors less direct than was possible here. Taken together, the studies of agarose-dextran gels provide an unusually complete characterization of water and macromolecule transport in hydrogels of known composition.
The Ficoll sieving experiments were designed so that membrane Peclet numbers would be high enough to make Eq. 4 valid. A comparison of Eqs. 2 and 4 indicates that Θ = ΦKc will be an excellent approximation when Pe > 3. Peclet numbers calculated a posteriori from Eq. 3, using the present values of ΦKc, v, and L, together with previous data for Φ (Kosto et al., 2004), Kd (Kosto and Deen, 2004), and D∞ (Kosto and Deen, 2004; Kosto et al., 2004), exceeded 3.2 for 23 of the 24 combinations of Ficoll size and gel composition. The one marginal instance (Pe = 2.1 for the smallest Ficoll in 4% pure agarose) was inconsequential because Θ ≅ 1 in that case anyway. Thus, the estimates of Pe were consistent with the conclusions reached from Fig. 2.
Given that details on the size (or size distribution) and spatial arrangement of the polymeric fibers in hydrogels are often not known, developing a rigorous hydrodynamic description for hindered transport in such materials is a formidable task. Pure agarose, for example, has a fibrillar structure that is neither highly ordered nor completely random (Arnott et al., 1974). Gels that contain two or more polymer types, including our agarose-dextran composites and biological basement membranes and connective tissues, are even more complex. However, it appears that the Darcy permeability provides a rough measure of the multibody hydrodynamic interactions between a diffusing macromolecule and a fixed fiber matrix that act to lower the diffusivity (Johnson et al., 1996; Phillips, 2000; Kosto and Deen, 2004). In particular, the reduction in the diffusivities of globular proteins and Ficolls caused by incorporating dextran into agarose gels was explained well by an effective medium model that had only κ and rs as parameters (Kosto and Deen, 2004). The ability of such a model to capture the effects of dextran on Kd suggests that κ might also be used to predict Kc or ΦKc.
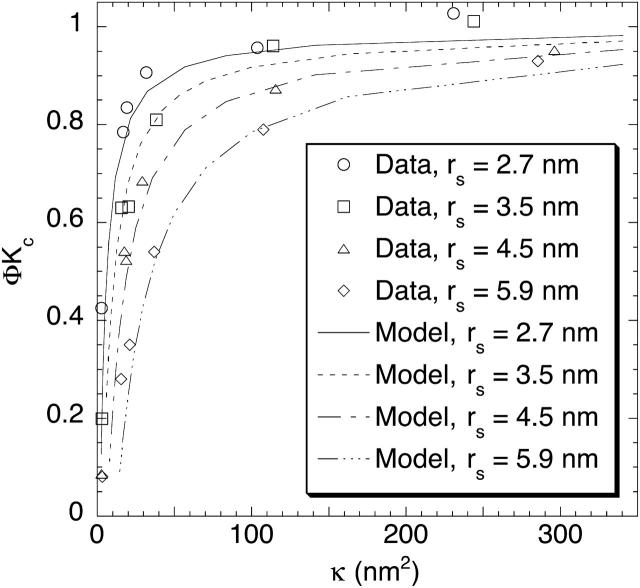
The relationship between ΦKc and κ for the four Ficolls in all of the present gels is shown in Fig. 5. As expected, ΦKc was smallest for the hydraulically “tightest” gels (those with lowest κ), and increased toward unity as κ increased. The larger the Ficoll radius, the slower was the approach to ΦKc = 1 with increasing κ. An intriguing aspect of these results is that, for a given Ficoll size, sieving through gels with similar κ resulted in very similar values of ΦKc, whatever the agarose and dextran content. The correlative ability of κ was particularly evident in comparing gels with 4% agarose and 0.76% dextran with those having 8% agarose and 0.08% dextran, where the very similar Darcy permeabilities were found to yield nearly identical values of ΦKc for any given rs. Also included in Fig. 5 are theoretical predictions for flow normal to a square array of parallel fibers. The four theoretical curves were calculated using Eqs. 11–15 and a fiber radius of rf = 1.6. Despite the highly idealized geometry in the theory, the predictions were remarkably accurate when expressed in terms of κ. Both the data and theory indicate that, at very small Darcy permeabilities, ΦKc will be quite sensitive to changes in κ.
FIGURE 5.
Convective hindrances of Ficoll in agarose and agarose-dextran gels. The ordinate (ΦKc) equals the sieving coefficient (Θ) at high membrane Peclet number, and the abscissa is the Darcy permeability (κ). The theoretical curves are based on Eqs. 11–15.
In one of the few other studies of hindered convection in fibrous gels, Kapur et al. (1997) measured sieving coefficients of RNAase and bovine serum albumin at high Pe in cylindrical pores filled with polyacrylamide. They also measured Darcy permeabilities in similarly prepared gels. When we plotted their results as in Fig. 5 (not shown), the agreement with the parallel-fiber theory (using rf = 0.06 nm) was less satisfactory than for agarose; the measured values of ΦKc fell above the theoretical curves in all cases (Kosto, 2004). The explanation for that discrepancy may be related to the greater flexibility of polyacrylamide molecules than agarose fibrils. Agarose fibrils do not exhibit detectable Brownian motion (Mackie et al., 1978), and in that sense more closely resemble the rigid fibers envisioned in the theory.
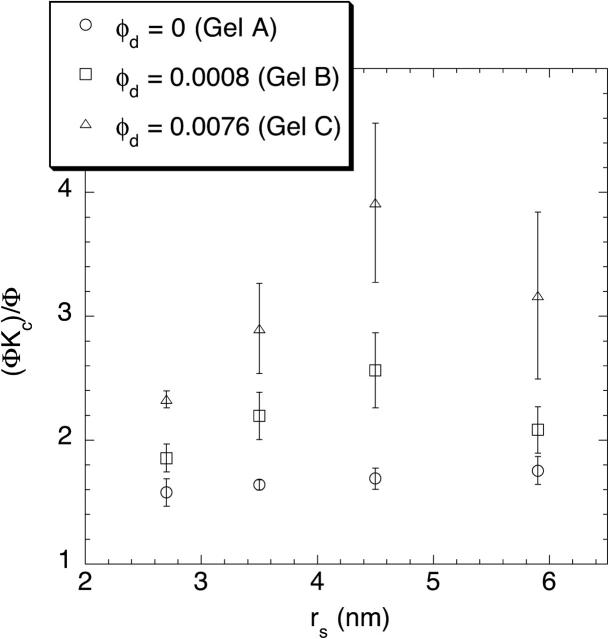
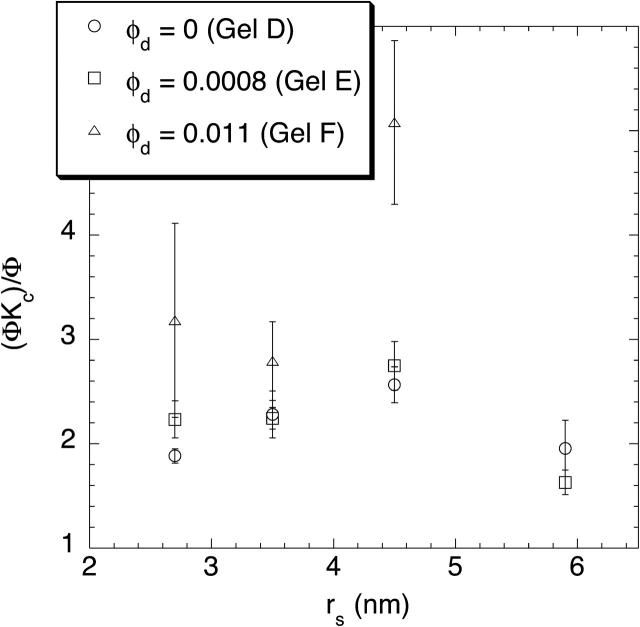
Although each sieving experiment yielded only the product ΦKc, an apparent value of Kc could be calculated by dividing that product by the value of Φ measured previously for the same Ficoll in gels of identical composition (Kosto et al., 2004). The results of those calculations for 4% and 8% agarose are shown in Figs. 6 and 7, respectively. The apparent values of Kc were found to exceed unity in each case, usually falling in the range 1.5–3. No clear dependence on molecular radius was evident, but the addition of dextran tended to elevate the apparent Kc. Recall from Eq. 1 that Kc is the convective solute velocity relative to the superficial velocity of the fluid. It may exceed unity slightly, because the center of a particle of finite size is excluded from the regions of slowest flow next to the fiber surfaces. However, given that Kc predicted by the parallel-fiber theory does not exceed ∼1.1 (Phillips et al., 1990), values of (ΦKc)/Φ on the order of 2–3 are unexpected. This seeming anomaly is evident also in previous results with pure agarose, where apparent Kc values up to 1.5 were calculated (Johnston and Deen, 2002).
FIGURE 6.
The apparent value of the convective hindrance factor, (ΦKc)/Φ, as a function of Ficoll radius (rs) for 4% agarose gels with varying amounts of dextran.
FIGURE 7.
The apparent value of the convective hindrance factor, (ΦKc)/Φ, as a function of Ficoll radius (rs) for 8% agarose gels with varying amounts of dextran. The result for the largest Ficoll size and highest dextran concentration was an outlier (well beyond the scale of the plot), and therefore is not shown.
Heterogeneity within the membranes is a likely explanation for the unexpectedly large values of the apparent Kc. Heterogeneity in flow paths through agarose is suggested by the observation that its Darcy permeability tends to exceed that predicted for a matrix of randomly positioned and oriented fibers, using independent estimates of fiber radius and fiber volume fraction (White and Deen, 2002; Johnson and Deen, 1996; Clague and Phillips, 1997). That is, redistributing the fibers in a homogeneous material to create regions with low and high φ will increase κ, because the low-resistance pathways due to the former will have the more pronounced effect. Evidence for heterogeneity in the effective pore size or fiber spacings of agarose gels has been provided also by NMR (Chui et al., 1995) and atomic force microscopy (Pernodet et al., 1997).
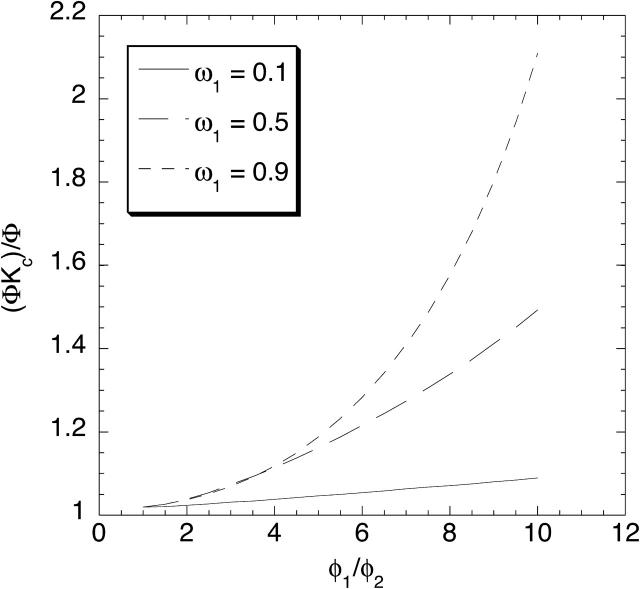
To see how membrane heterogeneity might increase the apparent value of Kc, consider a situation in which a membrane is a patchwork of two kinds of regions, one with more closely spaced fibers (fiber volume fraction φ1) and the other with less closely spaced ones (fiber volume fraction φ2 < φ1). The actual membranes were undoubtedly more complex, but this simple model (based on Eqs. 19 and 22) illustrates the phenomenon. Fig. 8 shows (ΦKc)/Φ as a function of φ1/φ2, for various fractional areas of region 1 (ω1 = 0.1, 0.5, or 0.9). In these calculations the fiber volume fraction in the more open region was held constant (φ2 = 0.0077) and a single solute size was considered (λ = 2). When φ1/φ2 = 1, both regions of the membrane had equal interfiber spacings, so that the results were independent of ω1 and the apparent Kc equaled the local value of 1.02. However, as φ1/φ2 was increased at any fixed value of ω1, the apparent Kc grew larger. The effects were greatest when the more closely spaced fibers occupied most of the membrane (ω1 = 0.9), the apparent Kc reaching 2.1 in that case for φ1/φ2 = 10. Higher values of the apparent Kc undoubtedly could be achieved, but the calculations had to be restricted to volume fractions where the correlation in Eq. 13 is valid. For λ = 2 this required that φ* < 0.05 or φ < 0.08 (Phillips et al., 1990).
FIGURE 8.
The apparent value of the convective hindrance factor, (ΦKc)/Φ, predicted for a gel having two types of regions with different interfiber spacings. The abscissa, φ1/φ2, is the fiber volume fraction in the more concentrated region divided by that in the less concentrated one. Results are shown for three fractional areas of the more concentrated region (ω1). The fiber radius (rf = 1.6 nm), smaller volume fraction (φ2 = 0.0077), and dimensionless solute size (λ = 2) were each held constant in these calculations, which were based on Eqs. 19 and 22.
The large values of the apparent Kc can be explained qualitatively, as follows. The sieving coefficient obtained at high Pe is, of course, equivalent to ΦKc. As shown by Eq. 22, the contributions of the two regions to the sieving coefficient are weighted by their volume flow rates. Because the more open region, which has the higher local sieving coefficient, also has a larger Darcy permeability, it raises the overall sieving coefficient in a manner that is disproportionate to the fraction of the membrane area that it occupies. However, because the contributions of the two regions to the overall partition coefficient are proportional only to their areas (Eq. 19), the more open region does not elevate Φ as much as it does ΦKc. Consequently, membrane heterogeneity tends to elevate (ΦKc)/Φ (i.e., the apparent Kc). What is most interesting is that the overall (apparent) Kc tends to exceed the local Kci in either region. How that can occur may be seen more clearly by noting that Kci is often near unity. Setting Kci = 1 in Eq. 22, and combining that result with Eq. 19, gives
 |
(23) |
where κ = ΣAiκi/ΣAi is the overall Darcy permeability. A relatively open region 2 will make κ2/κ ≫ 1. Thus, although κ1/κ < 1, if the order of magnitude of A2Φ2 is at least that of A1Φ1, then the numerator in Eq. 23 can greatly exceed the denominator.
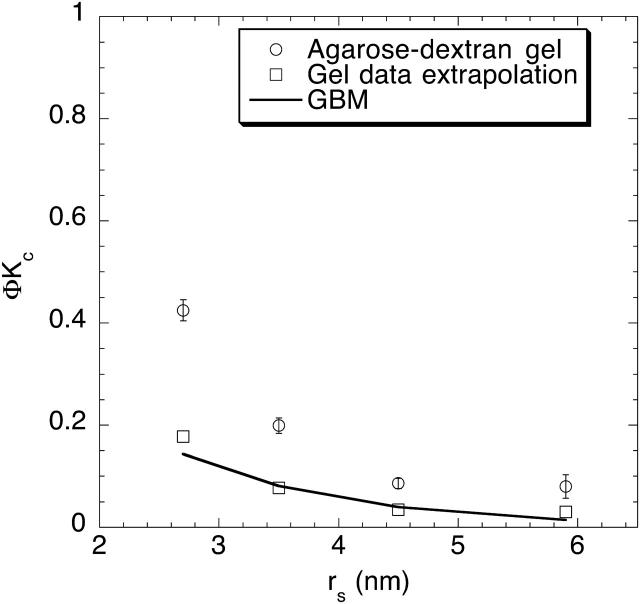
As mentioned at the outset, the agarose-dextran composite gels were developed as a possible experimental model for GBM. Measurements using isolated rat GBM have yielded estimates of ΦKc for Ficolls of varying size (Deen et al., 2001). In choosing a suitable agarose-dextran gel for comparison, we note that a composite with φa = 0.08 and φd = 0.01 (i.e., 8% agarose with “high” dextran) has a total fiber volume fraction of 9%, similar to the 7–10% solid volume reported for GBM (Robinson and Walton, 1987; Comper et al., 1993) . This agarose-dextran composite has a Darcy permeability of 2.9 nm2 (Table 1), comparable to (although somewhat higher than) the 1–2 nm2 typically found in vitro for isolated GBM (Daniels et al., 1992; Edwards et al., 1997; Bolton et al., 1998). Additionally, values of ΦKd in synthetic gels of this composition were very consistent with those measured in isolated GBM (Kosto et al., 2004). Accordingly, it is the one used for the comparison in Fig. 9, in which ΦKc is shown as a function of the Stokes radius. As may be seen, at any given rs the values of ΦKc in the agarose-dextran composite (circles) were roughly twice those of isolated GBM (solid curve). The sensitivity of ΦKc to changes in κ when κ is small (Fig. 5) suggests that better agreement would have resulted if slightly more dextran had been incorporated into the composite, reducing κ to the value of 1.2 nm2 that was measured for the particular GBM study in Fig. 9 (Bolton et al., 1998). Indeed, extrapolating the present sieving data to κ = 1.2 nm2, by assuming that ΦKc is proportional to κ at small κ, yielded excellent agreement with the GBM results (Fig. 9, squares). The values of ΦKd in composite gels with the lower κ would be expected to be very similar to the ones we obtained previously, because the effects of κ on diffusion in such gels were found to be much weaker than those shown in Fig. 5 for convection (Kosto and Deen, 2004).
FIGURE 9.
Comparison of convective hindrances for Ficoll in the most concentrated agarose-dextran gels (8% agarose with 1% dextran) with those in glomerular basement membrane (GBM). The ordinate is equivalent to the sieving coefficient at high membrane Peclet number. The GBM results are based on Ficoll sieving data obtained using filters prepared from isolated rat GBM (Bolton et al., 1998). Also shown are values for agarose-dextran gels extrapolated to κ = 1.2 nm2, which is the Darcy permeability measured in the GBM experiments.
In summary, convective transport through agarose and agarose-dextran composite gels was characterized by measuring the Darcy permeability and the sieving coefficients for Ficolls of varying molecular size. As the gel composition was varied, the sieving coefficient of any given Ficoll (measured at high membrane Peclet number) was closely correlated with the Darcy permeability. The empirical relationships among sieving coefficient, molecular size, and Darcy permeability were remarkably similar to those predicted by a theory for hindered convection through regular arrays of fibers. As shown previously for diffusional hindrances and equilibrium partition coefficients, convective hindrances in the agarose-dextran gels were quite similar to those in GBM, when compared on the basis of similar solid volume fractions and Darcy permeabilities. That agreement supports the hypothesis that the permeability properties of GBM are determined primarily by its mixture of coarse and fine fibers, its precise chemical composition apparently being of secondary importance. More generally, the results suggest that convective hindrances can be predicted fairly well from a knowledge of κ, even in synthetic or biological gels of complex composition.
Acknowledgments
Mr. Kenneth Wright provided expert assistance in the electron beam irradiation of the gels.
This work was supported by grant DK 20368 from the National Institutes of Health.
References
- Arnott, S., A. Fulmer, W. E. Scott, I. C. M. Dea, R. Moorhouse, and D. A. Rees. 1974. The agarose double helix and its function in agarose gel structure. J. Mol. Biol. 90:269–284. [DOI] [PubMed] [Google Scholar]
- Bolton, G. R., W. M. Deen, and B. S. Daniels. 1998. Assessment of the charge-selectivity of glomerular basement membrane using Ficoll sulfate. Am. J. Physiol. 274:F889–F896. [DOI] [PubMed] [Google Scholar]
- Chui, M. M., R. J. Phillips, and M. J. McCarthy. 1995. Measurement of the porous microstructure of hydrogels by nuclear magnetic resonance. J. Colloid Interface Sci. 174:336–344. [Google Scholar]
- Clague, D. S., and R. J. Phillips. 1996. Hindered diffusion of spherical macromolecules through dilute fibrous media. Phys. Fluids. 8:1720–1731. [Google Scholar]
- Clague, D. S., and R. J. Phillips. 1997. A numerical calculation of the hydraulic permeability of three-dimensional disordered fibrous media. Phys. Fluids. 9:1562–1572. [Google Scholar]
- Comper, W. D., A. S. N. Lee, M. Tay, and Y. Adal. 1993. Anionic charge concentration of rat kidney glomeruli and glomerular basement membrane. Biochem. J. 289:647–652. [DOI] [PMC free article] [PubMed] [Google Scholar]
- Daniels, B. S., E. B. Hauser, W. M. Deen, and T. H. Hostetter. 1992. Glomerular basement membrane: in vitro studies of water and protein permeability. Am. J. Physiol. 262:F919–F926. [DOI] [PubMed] [Google Scholar]
- Davidson, M. G., and W. M. Deen. 1988. Hindered diffusion of water-soluble macromolecules in membranes. Macromolecules. 21:3474–3481. [Google Scholar]
- De Belder, A. N., and K. Granath. 1973. Preparation and properties of fluorescein-labeled dextrans. Carbohydr. Res. 30:375–378. [DOI] [PubMed] [Google Scholar]
- Deen, W. M. 1987. Hindered transport of large molecules in liquid-filled pores. AIChE J. 33:1409–1425. [Google Scholar]
- Deen, W. M., M. J. Lazzara, and B. D. Myers. 2001. Structural determinants of glomerular permeability. Am. J. Physiol. 281:F579–F596. [DOI] [PubMed] [Google Scholar]
- De Smedt, S. C., T. K. L. Meyvis, J. Demeester, P. Van Oostveldt, J. C. G. Blonk, and W. E. Hennink. 1997. Diffusion of macromolecules in dextran methacrylate solutions and gels as studied by confocal scanning laser microscopy. Macromolecules. 30:4863–4870. [Google Scholar]
- Edwards, A., B. S. Daniels, and W. M. Deen. 1997. Hindered transport of macromolecules in isolated glomeruli. II. Convection and pressure effects in basement membrane. Biophys. J. 72:214–222. [DOI] [PMC free article] [PubMed] [Google Scholar]
- Fanti, L. A., and E. D. Glandt. 1990a. Partitioning of spherical particles into fibrous matrices. 1. Density-functional theory. J. Colloid Interface Sci. 135:385–395. [Google Scholar]
- Fanti, L. A., and E. D. Glandt. 1990b. Partitioning of spherical particles into fibrous matrices. 2. Monte Carlo simulation. J. Colloid Interface Sci. 135:396–404. [Google Scholar]
- Gibbs, S. J., E. N. Lightfoot, and T. W. Root. 1992. Protein diffusion in porous gel filtration chromatography media studied by pulsed field gradient NMR spectroscopy. J. Phys. Chem. 96:7458–7462. [Google Scholar]
- Johnson, E. M., D. A. Berk, R. K. Jain, and W. M. Deen. 1995. Diffusion and partitioning of proteins in charged agarose gels. Biophys. J. 68:1561–1568. [DOI] [PMC free article] [PubMed] [Google Scholar]
- Johnson, E. M., D. A. Berk, R. K. Jain, and W. M. Deen. 1996. Hindered diffusion in agarose gels: test of the effective medium model. Biophys. J. 70:1017–1026. [DOI] [PMC free article] [PubMed] [Google Scholar]
- Johnson, E. M., and W. M. Deen. 1996. Hydraulic permeability of agarose gels. AIChE J. 42:1220–1224. [Google Scholar]
- Johnston, S. T., and W. M. Deen. 1999. Hindered convection of proteins in agarose gels. J. Membr. Sci. 153:271–279. [Google Scholar]
- Johnston, S. T., and W. M. Deen. 2002. Hindered convection of Ficoll and proteins in agarose gels. Ind. Eng. Chem. Res. 41:340–346. [Google Scholar]
- Johnston, S. T., K. A. Smith, and W. M. Deen. 2001. Concentration polarization in stirred ultrafiltration cells. AIChE J. 47:1115–1125. [Google Scholar]
- Kapur, V., J. Charkoudian, and J. L. Anderson. 1997. Transport of proteins through gel-filled porous membranes. J. Membr. Sci. 131:143–153. [Google Scholar]
- Key, P. Y., and D. B. Sellen. 1982. A laser light-scattering study of the structure of agarose gels. J. Polym. Sci. Poly. Phys. Ed. 20:659–679. [Google Scholar]
- Kosar, T. F., and R. J. Phillips. 1995. Measurement of protein diffusion in dextran solutions by holographic interferometery. AIChE J. 41:701–711. [Google Scholar]
- Kosto, K. B. 2004. Hindered transport in composite hydrogels. PhD thesis. Massachusetts Institute of Technology, Cambridge, MA. 97–99.
- Kosto, K. B., and W. M. Deen. 2004. Diffusivities of macromolecules in composite hydrogels. AIChE J. 50:2648–2658. [Google Scholar]
- Kosto, K. B., S. Panuganti, and W. M. Deen. 2004. Equilibrium partitioning of Ficoll in composite hydrogels. J. Colloid Interface Sci. 277:404–409. [DOI] [PubMed] [Google Scholar]
- Laurent, T. C. 1963. The interaction between polysaccharides and other macromolecules. V. The solubility of proteins in the presence of dextran. Biochem. J. 89:253–257. [DOI] [PMC free article] [PubMed] [Google Scholar]
- Laurie, G. W., C. P. Leblond, S. Inoue, G. R. Martin, and A. Chung. 1984. Fine structure of the glomerular basement membrane and immunolocalization of five basement membrane components to the lamina densa (basal lamina) and its extensions in both glomeruli and tubules of the rat kidney. Am. J. Anat. 169:463–481. [DOI] [PubMed] [Google Scholar]
- Lazzara, M. J., D. Blankschtein, and W. M. Deen. 2000. Effects of multisolute steric interactions on membrane partition coefficients. J. Colloid Interface Sci. 226:112–122. [DOI] [PubMed] [Google Scholar]
- Lazzara, M. J., and W. M. Deen. 2004. Effects of concentration on the partitioning of macromolecule mixtures in agarose gels. J. Colloid Interface Sci. 272:288–297. [DOI] [PubMed] [Google Scholar]
- Mackie, W., D. B. Sellen, and J. Sutcliffe. 1978. Spectral broadening of light scattered from polysaccharide gels. Polymer. 19:9–16. [Google Scholar]
- Ogston, A. G. 1958. The spaces in a uniform random suspension of fibers. Trans. Faraday Soc. 54:1754–1757. [Google Scholar]
- Pernodet, M., M. Maaloum, and B. Tinland. 1997. Pore size of agarose gels by atomic force microscopy. Electrophoresis. 18:55–58. [DOI] [PubMed] [Google Scholar]
- Phillips, R. J. 2000. A hydrodynamic model for hindered diffusion of proteins and micelles in hydrogels. Biophys. J. 79:3350–3353. [DOI] [PMC free article] [PubMed] [Google Scholar]
- Phillips, R. J., W. M. Deen, and J. F. Brady. 1989. Hindered transport of spherical macromolecules in fibrous membranes and gels. AIChE J. 35:1761–1769. [Google Scholar]
- Phillips, R. J., W. M. Deen, and J. F. Brady. 1990. Hindered transport in fibrous membranes and gels: effect of solute size and fiber configuration. J. Colloid Interface Sci. 139:363–373. [Google Scholar]
- Robinson, G. B., and H. A. Walton. 1987. Ultrafiltration through basement membrane. In Renal Basement Membranes in Health and Disease. R. G. Price and B. G. Hudson, editors. Academic Press, London, UK. 147–161.
- Sangani, A. S., and A. Acrivos. 1982. Slow flow past periodic arrays of cylinders with application to heat transfer. Int. J. Multiphase Flow. 8:193–206. [Google Scholar]
- White, J. A., and W. M. Deen. 2000. Equilibrium partitioning of flexible macromolecules in fibrous membranes and gels. Macromolecules. 33:8504–8511. [Google Scholar]
- White, J. A., and W. M. Deen. 2002. Agarose-dextran gels as synthetic analogs of glomerular basement membrane: water permeability. Biophys. J. 82:2081–2089. [DOI] [PMC free article] [PubMed] [Google Scholar]
- Yurchenco, P. D., and J. C. Schittny. 1990. Molecular architecture of basement membranes. FASEB J. 4:1577–1590. [DOI] [PubMed] [Google Scholar]


