Abstract
To characterize elastic properties and geometrical parameters of individual, whole myosin molecules during their interaction with actin we sparsely adsorbed myosin molecules to nanometer-sized microspheres. Thermally driven position fluctuations of these microspheres were recorded with the three-dimensional detection scheme of the photonic force microscope. Upon binding of single myosin molecules to immobilized actin filaments in the absence of ATP, these thermally driven position fluctuations of the microspheres change significantly. From three-dimensional position fluctuations stiffness and geometrical information of the tethering molecule can be derived. Axial stiffness was found to be asymmetric, ∼0.04 pN/nm for extension, ∼0.004 pN/nm for compression. Observed stiffness of whole myosin molecules is much less than estimated for individual myosin heads in muscle fibers or for single-molecule studies on myosin fragments. The stiffness reported here, however, is identical to stiffness found in other single-molecule studies with full-length myosin suggesting that the source of this low stiffness is located outside the myosin head domain. Analysis of geometrical properties of tethering myosin molecules by Brownian dynamics computer simulations suggests a linker length of ∼130 nm that is divided by a free hinge located ∼90 nm above the substrate. This pivot location coincides with myosin's hinge region. We demonstrate the general applicability of thermal fluctuation analysis to determine elastic properties and geometrical factors of individual molecules.
INTRODUCTION
In a contracting muscle myosin and actin filaments slide past each other as the muscle fiber shortens. If filament sliding is prevented active force is generated. Both filament sliding and force generation are the results of a cyclic interaction of myosin molecules with the actin filaments. Fundamental to the generation of motile forces is an elastic distortion of the actomyosin complex when filament sliding is prevented. For this concept an elastic element within the actomyosin cross-bridge was postulated (Huxley, 1957).
Thus, aside from knowledge about the structure of myosin and of its binding partner actin, characterization of elastic properties of myosin and the actomyosin complex is essential to understand the precise mechanisms of energy transduction and force generation at the molecular level.
Myosin molecules are thought to contain at least two flexible regions, one between each subfragment 1 (S-1) and the myosin rod, and a second located near the center of the rod, the so-called hinge region at the end of subfragment 2 (S-2). In the rotating head model (Huxley and Simmons, 1971; Huxley, 1969) this hinge region has been postulated to allow cross-bridges to swing away from the myosin filaments to permit attachment of myosin heads to actin filaments. It is, however, unclear which part(s) of the actomyosin complex can be elastically deformed, or which other parts of the molecule behave more as rigid bodies. To date it has been suggested that the main element that can be elastically deformed is located in the so-called converter domain of the myosin molecule (Köhler et al., 2002) or in the light chain-binding domain, the lever arm (Dobbie et al., 1998; Irving et al., 2000; Uyeda et al., 1996), whereas others have postulated the elastic element to be located in the myosin subfragment 2 near the heavy meromyosin (HMM)-light meromyosin (LMM) junction (Harrington et al., 1990; Highsmith et al., 1977; Sugi et al., 1992) or at the actomyosin interface (Huxley, 1974). Within a sarcomere, additional sources of compliance were found, e.g., in both the actin and myosin filaments themselves (Higuchi et al., 1995; Huxley et al., 1994; Wakabayashi et al., 1994). These studies were performed using multimolecule systems like muscle fibers. Extrapolation of elastic properties of individual myosin heads based on measurements of muscle fiber studies, however, suffer from the lack of precise knowledge of the number of actomyosin complexes formed at any one moment and from unknown compliance elsewhere in the system, like within the actin and myosin filaments themselves. A few attempts have been made to measure elastic properties of myosin outside the sarcomeric environment. In some attempts a so-called three-bead geometry (Finer et al., 1994) was used, in which two beads captured in optical traps are used to hold an actin filament in the vicinity of a myosin molecule fragment, which is immobilized on the surface of a third bead (Mehta et al., 1997; Molloy et al., 1995; Veigel et al., 1998). Alternatively, instead of the third bead, full-length one- or two-headed myosin molecules incorporated into synthetic myosin/rod cofilaments were used (Ishijima et al., 1996, 1998; Tanaka et al., 1998). In yet another approach, single beads tethered by an actin filament were pulled by a laser trap away from HMM or S-1 fragments immobilized on a glass surface (Nishizaka et al., 1995, 2000). S-1 fragments attached to a zinc-oxide whisker on a scanning probe were also used to characterize the interactions with an actin filament immobilized on a substrate surface (Kitamura et al., 1999). Stiffness was calculated from the position changes of the microsphere when forces were exerted by moving the trap (Nishizaka et al., 1995, 2000; Veigel et al., 1998), or from the variance of bead fluctuations (Ishijima et al., 1998; Mehta et al., 1997; Molloy et al., 1995; Tanaka et al., 1998). Due to the geometry of the double-trap arrangement, observation and characterization of interactions between myosin and actin were limited to one dimension or, by changing the angle between synthetic myosin/rod cofilaments and the actin filament, to two dimensions.
To study mechanical and geometrical characteristics of individual myosin molecules like length of structural elements or their elasticity while the myosin molecule is attached to actin, we made use of thermally driven position fluctuations of microspheres tethered by a single myosin molecule to an immobilized actin filament. In solution, a microsphere is agitated by randomly directed collisions with the surrounding water molecules and the resulting thermal fluctuations are restricted by elasticity, length, and geometry of the tether, e.g., a myosin molecule.
Using the photonic force microscope (PFM) with its three-dimensional detection scheme (Florin et al., 1997; Pralle et al., 1999), bead movements were recorded in all three dimensions with microsecond time and nanometer spatial resolution. From the probability distributions of the positions of such a tethered bead we derived elastic properties (stiffness) and geometry (linker length and pivot point) of the tethering myosin molecule. First results of this work have been communicated to the Biophysical Society (Scholz et al., 2002).
MATERIALS AND METHODS
Protein preparation
Extraction of myosin
Myosin was extracted from skinned rabbit psoas muscle fibers as described previously (Scholz and Brenner, 2003; Thedinga et al., 1999). First, muscle fiber bundles were isolated and permeabilized (Kraft et al., 1995a,b; Yu and Brenner, 1989) from which single muscle fibers of ∼1 cm in length and ∼100 μm in diameter were separated. Finally, myosin was extracted by incubation of fibers for 30 min in a high-salt extraction buffer (500 mM NaCl, 10 mM Hepes, 5 mM MgCl2, 2.5 mM MgATP, and 30 mM dithiothreitole, DTT (all from Sigma, Deisenhofen, Germany), pH 7, T = 1–2°C) (Hasselbach and Schneider, 1951; Scholz and Brenner, 2003; Thedinga et al., 1999). Five fibers were extracted in 25 μl extraction buffer. After termination of the extraction procedure by removing the fibers from the extraction buffer the myosin-containing extraction buffer was used for both in vitro motility assays and the experiments with the PFM.
Preparation of fluorescently labeled biotinylated and nonbiotinylated actin filaments
Actin was purified from rabbit back muscle as described by Pardee and Spudich (1982). Actin was biotinylated according to Ishijima et al. (1998), and the monomeric biotinylated actin was frozen in liquid nitrogen and stored at −80°C. Tetramethylrhodamine B isothiocyanate (TRITC)-labeled biotinylated actin filaments were produced by polymerizing, overnight, 2.5 μM biotinylated globular actin (biotinylated G-actin) in the presence of 5 μM TRITC-phalloidin (Molecular Probes Europe, Leiden, The Netherlands) at 4°C in a buffer containing 100 mM KCl and 10 mM Hepes, pH 7.0 (Harada et al., 1987). For in vitro motility assays the suspensions of fluorescently labeled and biotinylated or nonbiotinylated actin filaments were diluted by adding 9 volumes of assay buffer A (25 mM imidazole, 25 mM NaCl, 4 mM MgCl2, 1 mM EGTA, 10 mM DTT, 10 mM D-glucose, 10 U/ml glucose oxidase, 800 U/ml catalase, pH 7.4).
In vitro motility assay
To assure normal function of both myosin and actin used for the PFM studies, in vitro motility assays were performed as previously described (Kron et al., 1991; Thedinga et al., 1999). After rinsing the myosin-coated surface with assay buffer B (25 mM imidazole, 25 mM NaCl, 4 mM MgCl2, 1 mM EGTA, 10 mM DTT, 10 mM D-glucose, 10 U/ml glucose oxidase, 800 U/ml catalase, 1 mg/ml bovine serum albumin (BSA; Sigma), pH 7.4), diluted (∼0.025 μM) TRITC-phalloidin-labeled biotinylated or nonbiotinylated actin filaments were applied to the assay chamber and the flow cell was rinsed twice with buffer B to remove free TRITC-phalloidin. Injecting one chamber volume of buffer B with an additional 2 mM of MgATP started the motility assay.
Movement of biotinylated or nonbiotinylated TRITC-phalloidin-labeled actin filaments was visualized by total internal reflection fluorescence microscopy (TIRFM) using an oil immersion objective (PlanApo, 100×, NA 1.40, Olympus, Tokyo, Japan). The image was visualized by an image intensifier (VS4-1845, Video Scope International, Dulles, VA) followed by a CCD-camera (C 2400-87, Hamamatsu Photonics Deutschland, Herrsching, Germany) with an image processor (Argus 10, Hamamatsu Photonics Deutschland). Video sequences were recorded with a S-VHS recorder (AG-7355, Panasonic, Secaucus, NJ). Sliding velocities were measured using a computer-based program (Mark-V) (Sheetz et al., 1986).
Photonic force microscopy
Sample preparation
Homogeneously labeled red fluorescent (580/605) latex beads (FluoSpheres, Molecular Probes Europe, Leiden, The Netherlands) with a nominal diameter of 500 nm were used as probes. These carboxylate-modified latex beads were coated with BSA by incubation for at least 15 min at 1–2°C with buffer B containing 1 mg/ml BSA to block nonspecific adhesion. Beads only coated with BSA were used for control experiments. Beads sparsely coated with myosin molecules were prepared by incubation of the BSA-coated beads with a solution containing freshly extracted full-length striated muscle myosin (0.1 nM myosin with 0.1% beads) for 15 min at 1–2°C. For the PFM experiments, microspheres that were sparsely coated with myosin molecules or coated only with BSA were diluted in buffer B plus 2 mM ATP, or with 0.01 U/ml hexokinase (Sigma) to remove traces of ATP for experiments in the absence of ATP.
Immobilization of actin filaments
For immobilization of actin filaments the surface of the assay chamber was coated with neutravidin by incubation of the flow chamber with a solution of 1 mg/ml neutravidin (Molecular Probes Europe) in buffer A for 5 min at room temperature. Fluorescently labeled, biotinylated actin filaments were adsorbed to the neutravidin-coated surface by applying a solution of biotinylated actin filaments diluted 10 times in buffer A for 10 s. The degree of biotinylation of actin filaments was determined as previously described (Kunioka and Ando, 1996). It was found to be 1 biotin in 7 actin monomers. After adsorption of the biotinylated actin filaments, the chamber surface was blocked with BSA to prevent nonspecific adhesion of beads. This blocking was achieved by incubation with buffer B at room temperature for 5 min.
Calibration of the detector response
The detector response was calibrated 2 μm above the chamber surface. Calibration was based on confined diffusion of the bead inside the trap (Florin et al., 1998; Pralle et al., 1999), correcting for hydrodynamic drag due to the proximity of the surface (Happel and Brenner, 1965). Calibration was cross-checked by a second calibration based on free diffusion of the bead in all three dimensions.
Experimental procedure
Diluted microspheres, sparsely coated with myosin molecules or coated only with BSA, were injected into a flow chamber with immobilized actin filaments, produced as described above. For manipulation and positioning of beads close to immobilized actin filaments single beads were trapped a few micrometers above the chamber surface in the focused beam of a low-noise laser (wavelength 1064 nm, CrystaLaser, Reno, NV). Axial trap stiffness was adjusted to ∼0.0008 pN/nm by proper attenuation of the laser beam. After calibration of the detector response the trapped microsphere was positioned above a fluorescently labeled, immobilized actin filament by moving the assay chamber with a piezoelectric x/y-scanning stage (Queensgate, Torquay, UK). Position and orientation of the actin filaments were determined by TIRFM. For excitation of TRITC a Nd:YAG laser was used (frequency doubled to a wavelength of 532 nm, 20 mW; Laser2000, Wessling, Germany), and the emitted light was recorded by an Orca ER CCD camera (Hamamatsu Photonics Deutschland). Only those actin filaments that showed tight attachment to the glass surface, were straight, and aligned along the x or y axis were chosen for experiments. The focus of the optical tweezers with the trapped bead was brought closer to an actin filament by moving the objective with a piezo positioner (PI-foc, Physik Instrumente, Karlsruhe, Germany) while the microsphere position was recorded with the three-dimensional detection scheme of the PFM (Florin et al., 1997; Pralle et al., 1999). For position detection an InGaAs quadrant photodiode (Hamamatsu Photonics Deutschland) with a sampling rate of 100 kHz was used. After a bead became tethered to an immobilized actin filament by a myosin molecule and the thermally driven position fluctuations had been recorded to derive the three-dimensional probability distribution of the bead position, the position of the laser trap was changed systematically relative to the actin filament. From the starting position the microsphere was moved once or twice 100 nm relative to the actin filament to either side of the starting position, both along and across the actin filament axis. At each position again the three-dimensional probability distribution of the bead position was recorded. For data collection a data acquisition card (PCI-6110E, National Instruments, Munich, Germany) was used. Calibration and analysis of PFM data were carried out using control software based on Igor Pro (Wavemetrics, Lake Oswego, OR).
Characterization of mechanical parameters from thermal fluctuations of a tethered bead
Elastic properties of a linker molecule are determined from thermally driven position fluctuations of the tethered bead using Boltzmann's equation that connects position probability and confining potential. The principle is illustrated in Fig. 1. Due to random bombardment of surrounding water molecules in an aqueous solution, the tethered bead undergoes thermal motion restricted in space by properties of the linker element. The probability of finding the bead at a certain point in space is related to the mechanical properties of the linker. For example, for the elastic linker shown in Fig. 1, the probability distribution of the bead position along x is described by Boltzmann's law:
 |
(1) |
FIGURE 1.
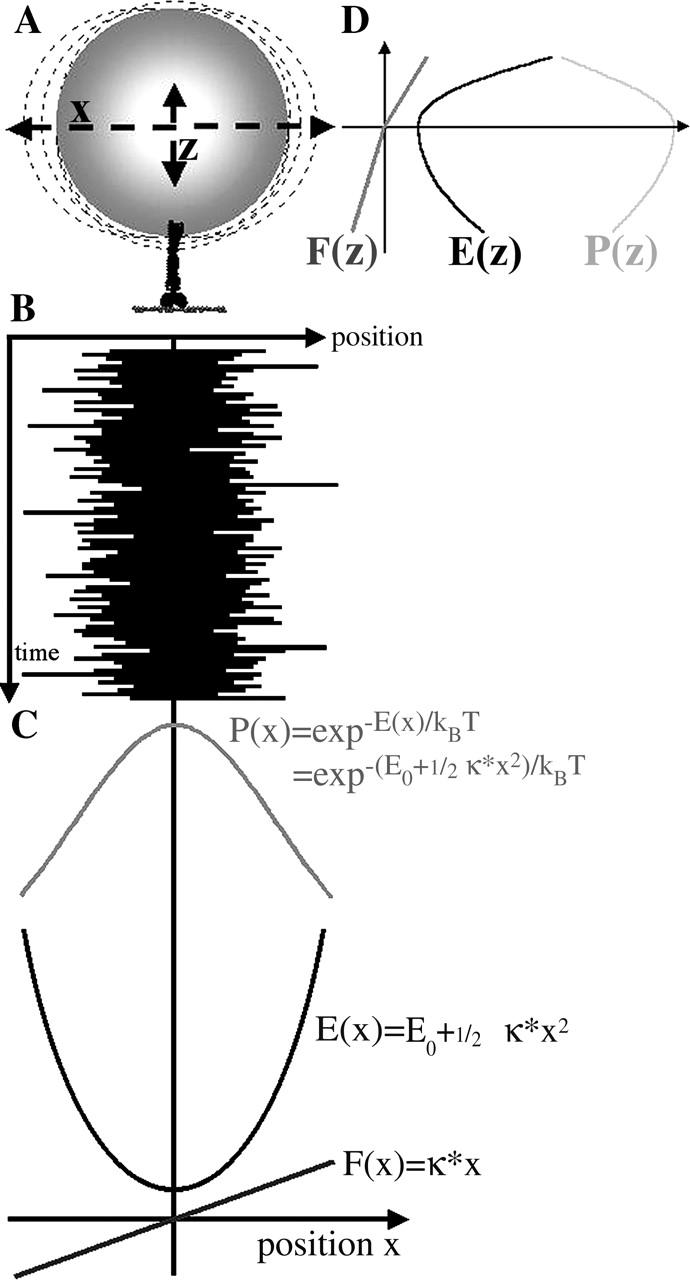
Relations between thermally driven position fluctuations of a tethered bead, probability distribution of bead position, free energy profiles, and force functions along x (linear elasticity assumed) and along z (linear but asymmetric elasticity). (A) Schematic drawing of a microsphere tethered to an actin filament by a single myosin molecule. (B) Time course of bead position along x. (C) Plots of probability distribution of bead position along x, free energy profile, and force function with respect to x. (D) Force function F(z), free energy profile E(z), and probability distribution P(z) for position fluctuations along z.
E(x) in an harmonic case or harmonic approximation can be written as
 |
(2) |
The first derivative in this case is Hook's law:
 |
(3) |
The second derivative is the spring constant κ of the linear elastic element illustrated in Fig. 1. For an asymmetric elasticity (e.g., z-direction in Fig. 1) or any nonlinear elastic element, F(x) can be derived in the same way as the first derivative of E(x), with E(x) = −kBT × logP(x). The stiffness in such a case is not a constant, but a function, κ(x), of the nonlinear elastic element.
Thus, recording the probability distribution of the bead position in x-, y-, and z-directions we can derive the elastic properties of the linker element in x, y, and z, whether the linker has linear or nonlinear elastic properties.
The probability distribution of the bead position along the x, y, and z axes is the histogram of the time course of the bead positions along the x-, y-, and z-coordinates, respectively. The bead positions along x, y, and z are directly recorded as a function of time by the three-dimensional detection geometry of the photonic force microscope.
In the experiments described in this article, it was necessary to manipulate the beads, e.g., to move them close to an immobilized actin filament and to allow the myosin molecule bound to the bead to attach to the actin filament thus forming the tether. Furthermore, controlled prepositioning of tethered beads away from the minimum of the free energy landscape allowed to also map out parts of the probability distribution that would otherwise be visited by the bead only rather rarely due to unfavorable energy potential. For such manipulation of the bead a laser beam of 1064 nm was used to form a weak laser trap (stiffness: ∼0.0008 pN/nm). This weak trap thus restricted the free Brownian motion of the bead as it represents a shallow harmonic potential (low linear stiffness). In the absence of a tethering molecule, the Brownian motion of the bead, restricted only by the weak trap, shows a probability distribution of the bead position that is determined by the low and essentially linear stiffness of the trap. Once the tether has formed, the properties of the tether dominate the probability distributions of the bead. However, the very low trap stiffness is still present and adds to the tether stiffness, i.e., total stiffness and related total free energy profile result from tether-stiffness plus trap-stiffness. In quantitative analysis this needs to be considered and is specifically relevant for low, or essentially absent, tether stiffness.
Determination of structural parameters from thermal fluctuations of a tethered bead using Brownian dynamics simulations
Structural parameters like the length of the tether and the location of possible joints within the tether were characterized using Brownian dynamics computer simulations (Altmann, 2002). A single-joint, asymmetric harmonic linker model was assumed. The system of equations used in the simulations accounted for optical forces of the trap, thermal forces, elastic forces of the linker molecule, and repulsive surface forces between bead and substrate. Elastic forces were assumed to be a function of displacement from the equilibrium position, i.e., displacement from the equilibrium length of the linker. Compliances were modeled as purely enthalpic. The simplest tether geometry that could reproduce our measurements had to include 1), two rigid elements connected by a free hinge, and 2), rigid connections between substrate and actin filament, actin filament and the attached myosin molecule, and tethering myosin molecule and microsphere. After setting both the tether length and the position of the hinge above the glass surface to initial values these parameters were adjusted to obtain the best fit of the simulation data to the recorded data with the center of the optical trap and the surface potential (double-layer repulsive potential) fixed. The values of the asymmetric linker stiffness along the z axis (optical axis) were taken from the experimental data.
RESULTS
Elastic properties of single myosin molecules bound to an actin filament in the absence of ATP
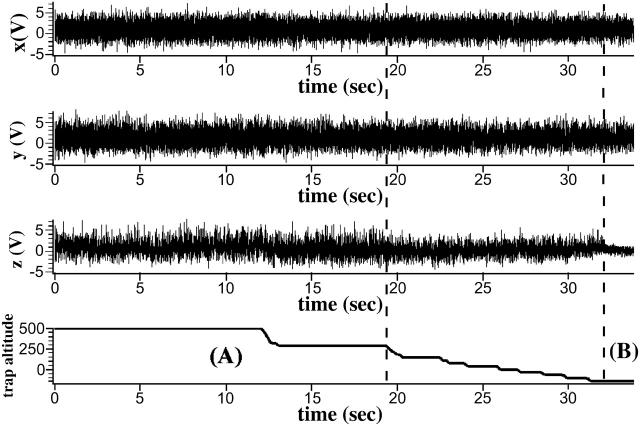
Fig. 2 shows raw data of position signals of a diffusing bead in a very weak laser trap for x-, y-, and z-directions. During the first 19 s, up to the first dashed line, the bead was freely diffusing in the trap. After 12 s the microsphere was moved toward an actin filament immobilized on the glass surface by moving the focus of the laser trap along the optical axis toward the glass surface. Using the signal of the position sensor of the microscope objective, the relative z-position of the trap, the trap altitude, has been recorded separately and is shown in Fig. 2 (bottom trace). After 19 s the bead was moved even closer to the surface and its fluctuations along the z axis began to become further reduced, whereas fluctuations along both the x and y axes remained unchanged. At 32 s, indicated by the second vertical dashed line, the position fluctuations in the z-direction suddenly decreased to a much smaller amplitude, although at this moment the trapped bead had not been moved closer to the surface. This indicates an additional restriction of thermal fluctuations in the z-direction established at this moment.
FIGURE 2.
Raw data of an approach of a trapped bead with myosin II molecules in very low density on its surface. For further details see text.
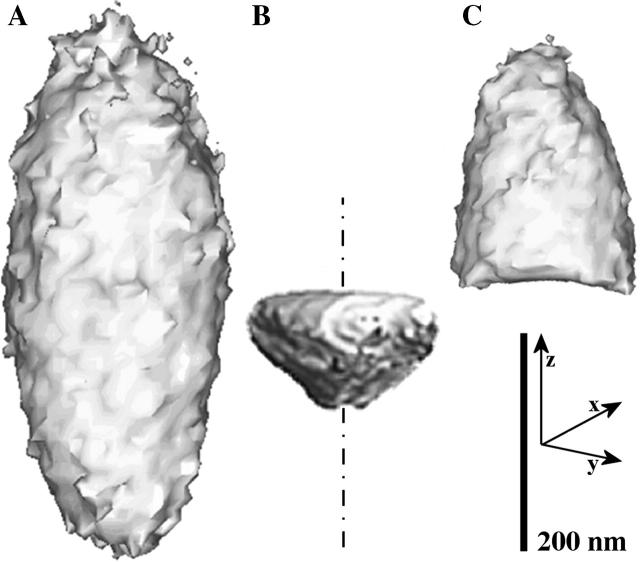
To characterize the bead fluctuations in all three dimensions we constructed three-dimensional surfaces of equal position probability from three-dimensional probability distributions derived from the position signals shown in Fig. 2. Three examples are shown in Fig. 3, derived from the periods labeled A and B in Fig. 2 and from a control experiment in which a bead without myosin molecules was brought close to the substrate surface (Fig. 3 C). In period A, when the bead is well above the BSA-coated coverslip, the surface of equal position probability forms an ellipsoid (Fig. 3 A), reflecting the symmetry of the confining potential (stiffness) of the laser trap used. Note that the weaker trapping stiffness (shallow trapping potential) along the z axis results in an elongated, ellipsoid-like shape of the isoprobability surface.
FIGURE 3.
Surfaces of equal position probability (95% probability) derived from position fluctuations recorded during approaches such as that shown in Fig. 2. (A) Ellipsoid-like shape of a freely fluctuating bead in a very weak laser trap, e.g., during period A in Fig. 2. (B) New shape of surface of equal position probability after sudden reduction in thermal fluctuation along the z axis, e.g., in period B of Fig. 2. (C) “Cut-off” ellipsoid observed when myosin-free microspheres are moved against a BSA-coated surface with or without immobilized actin filaments.
Beads sparsely coated with myosin can suddenly change the fluctuation amplitude in the z-direction when kept at constant distance from the BSA-coated glass surface if they are in the vicinity of an immobilized actin filament (e.g., Fig. 2, period B). This corresponds to a restriction of the space accessible for the fluctuating bead as revealed by the sudden change in the shape of the isoprobability surface from the elongated shape in Fig. 3 A to that shown in Fig. 3 B. Specifically, there is a sudden reduction in bead movement along the z axis with a sharp cutoff for the movement away from the BSA-coated surface with the immobilized actin filaments. In contrast, movement down to the surface is much less restricted and movements in the x- and y-directions remain essentially unchanged. Such sudden change in space accessible for the fluctuating bead is expected if a myosin molecule attaches to an actin filament thus restricting thermal fluctuation of the bead due to limited extensibility of the tethering myosin molecule. This interpretation is supported by the behavior observed with myosin-free microspheres. When myosin-free microspheres are moved closer to the BSA-coated glass surface, such that thermal fluctuations along the z axis become restricted (e.g., Fig. 2 between the two dashed lines), no sudden reduction in thermal fluctuation is observed. Instead, by further moving the myosin-free bead down to the BSA-coated surface the isoprobability surface shows the shape of a “cut-off” ellipsoid as part of the ellipsoid space apparently becomes inaccessible, presumably due to collision of the bead with the BSA-coated surface (Fig. 3 C).
Comparison of the data with myosin-coated versus myosin-free microspheres suggest that tethering a microsphere to an actin filament by a myosin molecule results in a restricted accessibility of space along the z axis, whereas position fluctuations in either the x- or y-direction show no significant changes. The tethering molecule very strongly restricts thermal fluctuation along the z axis away from the surface, whereas fluctuations along the z axis toward the BSA-coated surface are less sharply restricted. Fluctuations along the x and y axes, in contrast, appear completely unrestricted by the tethering myosin molecule, but are restricted only by the trapping potential.
To characterize the tether stiffness along the z axis we further analyzed (along the dash-dotted line in Fig. 3 B) the probability distributions for the period after the bead fluctuations were suddenly reduced, i.e., after the tether had formed (Figs. 2 B and 3 B).
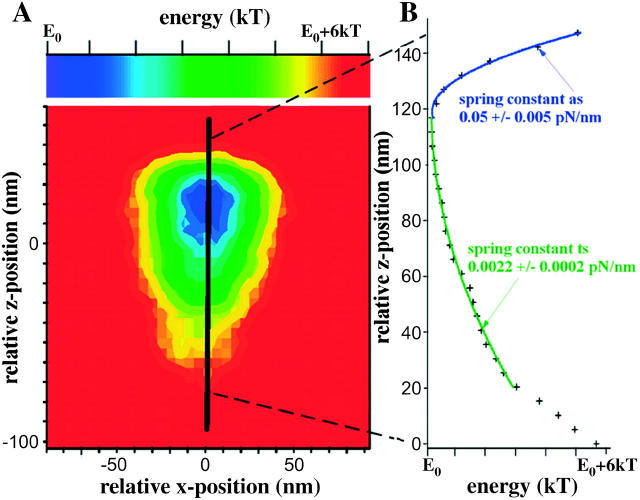
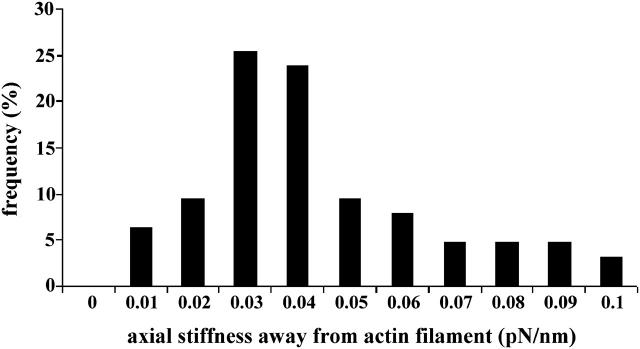
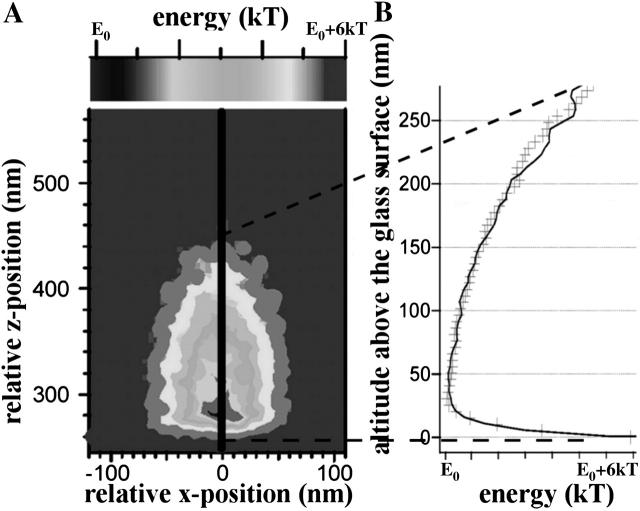
Fig. 4 A shows the color-encoded, two-dimensional energy landscape in the xz-plane, derived from the three-dimensional probability distribution of the tethered microsphere shown in Fig. 3 B. Fig. 4 B shows the one-dimensional energy profile along the z axis (through the center of the three-dimensional distribution), i.e., along the solid line in the two-dimensional energy landscape in Fig. 4 A that corresponds to the dash-dotted line in Fig. 2 B. As pointed out, the second derivative of this one-dimensional energy profile is the stiffness of the linker for the corresponding direction, e.g., along the z axis. As shown in Fig. 4 B the stiffness along the z axis through the center of the three-dimensional probability distribution, i.e., the axial stiffness of the tether, is asymmetric with respect to extension versus compression, i.e., toward versus away from the actin filament. The axial stiffness of this myosin molecule away from the actin filament (as in Fig. 4 B) was found to be 0.05 ± 0.005 pN/nm and is more than 10 times higher than the stiffness toward the actin filament (ts in Fig. 4 B), which was found to be only 0.0022 ± 0.0002 pN/nm. In Fig. 5, data recorded from 63 beads for axial stiffness away from actin filaments are summarized. The average stiffness away from actin filaments was 0.044 pN/nm (mean ± 0.017 pN/nm), whereas average stiffness toward the actin filaments was found to be 10 times less (data not shown). As shown in Figs. 2 B and 3 B, the sudden reduction of thermal fluctuations of the beads in the z-direction is not accompanied by any detectable change in the amplitude of the thermal fluctuations along the x and y axes, i.e., the width of the isoprobability surface in the x- and y-directions remains unchanged (see Fig. 3 B). This reflects that the tether does not restrict bead fluctuation along the x and y axes, i.e., the fluctuations along the x and y axes are limited only by the potential of the optical trap needed for manipulation/prepositioning of the bead.
FIGURE 4.
(A) Two-dimensional (x, z), color-encoded energy landscape derived from the three-dimensional probability distribution of the tethered microsphere shown in Fig. 3 B. (B) Asymmetric one-dimensional energy profile along the z axis (black solid line) in the energy landscape shown in A. The spring constants away (as) and toward (ts) the actin filament were fitted to the experimental data (+) using two different harmonic fits starting at the minimum of the energy profile.
FIGURE 5.
Distribution of axial spring constants away from the surface, i.e., away from the actin filament. Data of 63 myosin molecules tethering a microsphere to an actin filament immobilized on a glass surface.
Actin filaments were immobilized by binding of biotinylated actin to a neutravidin-coated glass surface. To examine the stiffness of these links we recorded thermal fluctuations of streptavidin-coated microspheres attached to immobilized biotinylated actin filaments. For total stiffness we found values between 2 and 14 pN/nm. These values are two orders of magnitude larger than found for beads tethered to immobilized actin filaments by myosin molecules. This demonstrates that the low stiffness observed with a myosin molecule as a tether is not dominated by, e.g., bending of the actin filament.
Geometrical parameters of single myosin molecules bound to an actin filament in the absence of ATP
To further characterize the linker properties, including x- and y-directions, it was necessary to extend the range of accessible space in the x- and y-directions beyond the limits set by the trapping potential. To achieve this, the position of the laser trap was changed systematically relative to the starting position once the tether had formed, i.e., once a myosin molecule had attached to the actin filament indicated by the sudden reduction in fluctuations along the z axis. The microsphere was moved once or twice by 100 nm away from the starting position, both along the x axis, i.e., along the actin filament, and along the y axis, i.e., across the actin filament axis. At each new position the three-dimensional probability distribution of the bead position was again recorded. Examples are shown in Fig. 6, A and B, for different positions along and across the actin filament axis, respectively. The situation in the setup can also be observed optically, and Fig. 6 C shows an image of a fluorescently labeled microsphere (bright dot) sparsely coated with myosin molecules to ensure single molecule binding. The microsphere is bound to an immobilized actin filament in the absence of ATP. The horizontal and vertical axes of the image correspond to the x and y axes of the three-dimensional detection scheme, respectively, i.e., the actin filament was orientated along the x axis. Note that there is no other actin filament within the reach of the bead.
FIGURE 6.
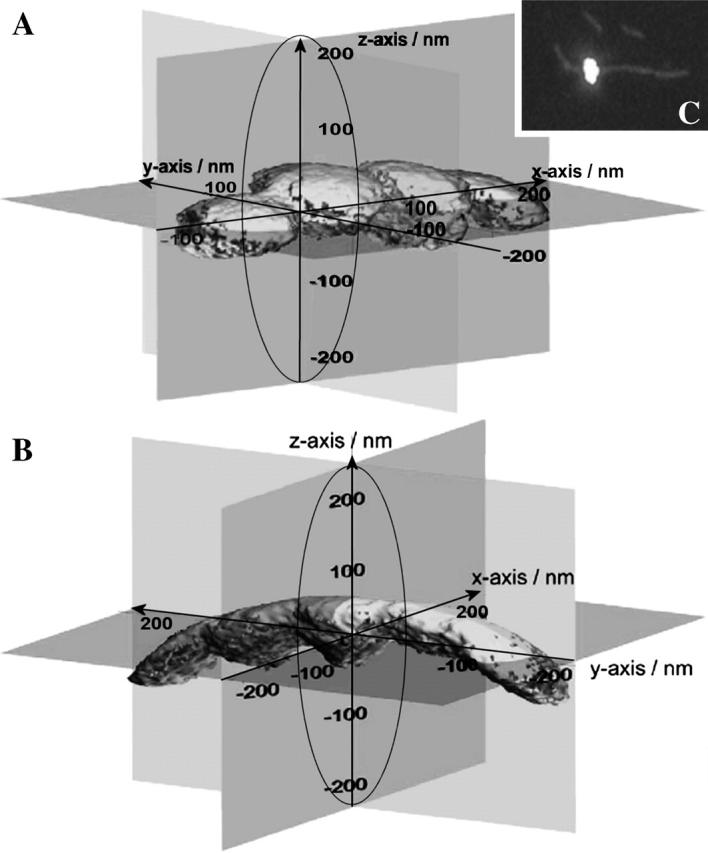
Extension of the range of bead fluctuations (A) along and (B) across the actin filament after the tether had formed. Isoprobability surfaces (95% probability) of the three-dimensional probability distributions of the tethered bead are shown for four different positions along the actin filament axis (x axis; A) and for five different positions across the actin filament axis (y axis; B). The isoprobability surface located at the origin of the coordinates is the surface observed at the position of the bead when the tether had formed. The ellipsoid illustrated by the solid line represents the isoprobability surface observed for the free bead fluctuating in the optical trap just before the tether had formed. (C) Image of a fluorescently labeled microsphere of 500 nm in diameter bound in an ATP-free solution to a single TRITC-phalloidin labeled, biotinylated actin filament immobilized on a neutravidin-coated glass surface.
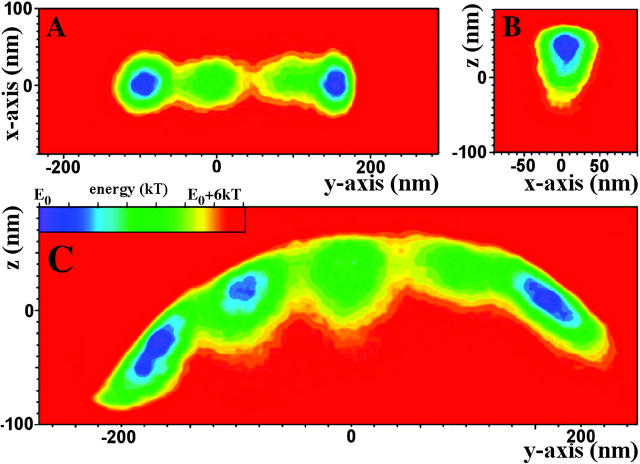
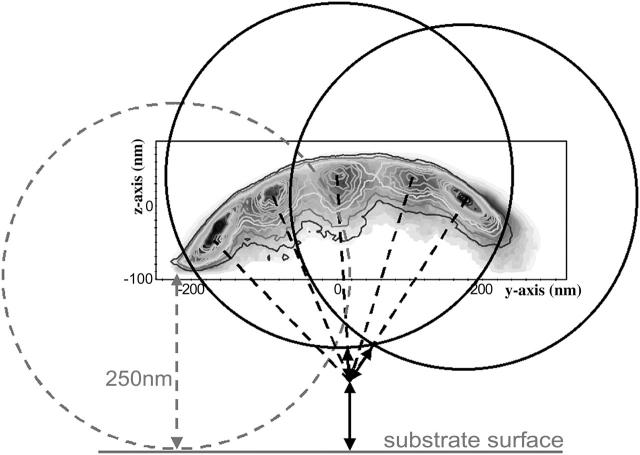
Fig. 7 depicts two-dimensional energy landscapes derived from the three-dimensional probability distributions shown in Fig. 6 B, i.e., obtained at different positions across the actin filament axis. Slices were taken along planes as indicated in Fig. 6 B. Fig. 7 A is the energy landscape resulting from a cut parallel to the glass surface at a z-position of ∼20 nm. Fig. 7 C is a cut along the yz-plane, i.e., across the long axis of the immobilized actin filament. Fig. 7 B shows a cut through the central probability distribution along the xz-plane. Figs. 6 and 7 demonstrate that the individual probability distributions recorded at each position are all more restricted for fluctuations away from the actin filament and less so for fluctuations toward the actin filament, just as seen for the initial position. All five probability distributions together (Fig. 6 B) exhibit a curved overall appearance of the composite probability distribution. However, for each individual position, fluctuations perpendicular to the presumed linker axis are essentially restricted only by the stiffness (potential) of the optical trap, just as seen for the distribution at the starting point (Fig. 3 B). The leftmost distribution is compressed at the lower end (see Fig. 7 C). Note that compared with the rightmost distribution, the leftmost distribution shows a steep gradient in the probability distribution at its lower end. The change across the color code from red to green via yellow occurs over a much shorter distance than in the other distributions. This also shows up as a much narrower separation of lines of equal probability in Fig. 8. The steepness of the probability distribution gradient corresponds to that of the interaction potential between a bead and the substrate surface (see Fig. 9). The steep gradient in the leftmost probability distribution thus most likely reflects the presence of the substrate surface restricting the thermal fluctuations of the bead. The position where the leftmost individual probability distribution becomes zero was, therefore, taken as the position where the bead reaches the substrate surface. This position can be used to determine the absolute altitude of the bead position (position of bead center) above the substrate surface (see Fig. 8), i.e., for a 500-nm bead the leftmost probability distribution becomes zero 250 nm above the substrate surface. This allows relating the composite probability distribution of bead positions to the substrate surface (see Fig. 8).
FIGURE 7.
Two-dimensional color-encoded energy landscapes derived from slices through the probability distributions shown in Fig. 6 B. Slices were performed along the planes as indicated in Fig. 6 B, except for A, which is the energy landscape resulting form a cut parallel to the glass surface at a z-position of ∼20 nm.
FIGURE 8.
Schematic drawing of the location of the pivot and the effective linker length derived from Brownian dynamics simulations. Experimental data (shown in Fig. 7 C) superimposed as line profiles onto data derived from Brownian dynamics simulations (shown in gray scale). The absolute altitude of the bead position above the surface was derived from the lowest position at the leftmost end of the distribution. For a 500-nm bead this position is 250 nm above the substrate surface.
FIGURE 9.
(A) Brightness-encoded two-dimensional energy landscape of a BSA-coated bead (no myosin) derived from three-dimensional probability distributions. When the bead was moved toward a neutravidin-coated, BSA-blocked surface the accessible space became restricted (see Fig. 3 C). (B) Energy profile along the black line in A that is perpendicular to the substrate surface. Experimental data are represented by crosses, whereas data from Brownian dynamics simulations appear as a solid line.
The dashed gray circle shown in Fig. 8 illustrates this extreme bead position where the bead touches the substrate surface. Fig. 8 also shows two bead positions (black circles) for the position of highest probability at the initial position and +200 nm away from the starting position. The dashed lines drawn perpendicular to the probability distributions through the center of each of the bead positions illustrated in Fig. 8 intersect at an area above the substrate surface. Such behavior is consistent with having a stiff tether essentially rigidly bound to the immobilized actin filament, but with a free two-dimensional hinge at the intersection of the perpendicular lines.
To obtain values for tether properties (geometry, position of hinge, stiffness) Brownian dynamics simulations were performed based on the absolute altitude above the substrate surface with the optical forces derived from the calibration of the optical trap, and the asymmetric linker stiffness toward and away from the surface derived from the respective data sets (see Fig. 4). The Brownian dynamics simulations were used to account for possible systematic deviations caused by the trapping potential, especially at the two extreme trap positions at ±200 nm, as well as by repulsive surface forces between bead and substrate. These forces were derived from control experiments (see below). Assuming the geometry shown in Fig. 8 we needed a linker with one free hinge and rigid connections to the bead and to the actin filament to reproduce the observations. The overall length of the tether as well as the location of the free hinge (pivot) above the surface were adjusted to obtain the best fit to the experimental data. The agreement between simulated and experimental data is illustrated in Fig. 8, in which experimental data (shown before in Fig. 7 C) are superimposed as line profiles onto data derived from Brownian dynamics simulations (shown in gray scale). For the best fit the total linker length had to be set to ∼130 nm and the position of the pivot had to be located ∼90 ± 7 nm (with 95% confidence interval) above the glass surface, leaving ∼40 nm for the unstretched rotating part of the tether.
Biotinylated actin filaments and myosin molecules attached to microspheres are still functional
To ensure that both biotinylated actin filaments and freshly extracted myosin were functional, sliding velocities of fluorescently labeled actin filaments and of fluorescently labeled biotinylated actin filaments were compared and found to be similar with 2.77 μm/s (SD ± 0.58 μm/s) and 2.78 μm/s (SD ± 0.61 μm/s), respectively (T = 19°C). Freshly extracted muscle myosin was checked for motility daily before incubation with BSA-coated beads. To further ensure proper functioning of the extracted myosin we also tested the ATP-dependent detachment of myosin-coated beads from immobilized actin filaments using a standard epifluorescence microscope (Axiovert 135 TV, Zeiss, Oberkochen, Germany). After myosin-coated beads were allowed to bind to immobilized actin filaments in the absence of ATP, injection of an ATP-containing solution (2 mM) into a chamber resulted in dissociation of almost all beads from the filaments within 1 min (data not shown).
For single-molecule experiments only preparations of myosin-coated beads were selected if at most 3 out of 10 beads bound to actin filaments in the absence of ATP within 30 s. Following a statistical reasoning for kinesin molecules bound to beads described by Block et al. (1990), the probability that a microsphere of such a preparation of myosin-coated beads carried no myosin molecule at all was 0.7, whereas the chance that it carried one or two myosin molecules was 0.25 and 0.05, respectively.
In contrast to binding of myosin-coated beads to immobilized actin filaments, we found no binding of myosin-free microspheres, either to the BSA- and neutravidin-coated surface or to immobilized actin filaments, i.e., we observed no sudden reduction in fluctuations in the z-direction, specifically away from the surface (see Fig. 3 B), even when these beads were brought into contact with such surfaces, as indicated by the restriction of the bead fluctuations by the substrate surface (Fig. 9 A). The behavior of BSA-coated beads without myosin molecules could also be reproduced by Brownian dynamics simulations with the known trapping potential and a repulsive double-layer potential between BSA-coated bead and BSA-coated surface.
DISCUSSION
The goal of our study was to establish and test an experimental approach for characterizing elastic properties and geometrical parameters of single myosin molecules during their interaction with immobilized actin filaments. We explored the possibility of using thermally driven position fluctuations of small microspheres tethered to a substrate by the molecule of interest. The link between elastic properties, geometrical parameters, and position probabilities during thermal fluctuations is described by Boltzmann's equation, with elastic properties and geometrical factors acting as confining potentials. With the three-dimensional position sensor of a PFM it was possible to record the time course of the thermally driven position fluctuations of a tethered bead in three-dimensional space. Our main finding is that the PFM technique allows, on the one hand, quantifying elastic properties, e.g., the axial elasticity of the linker molecule. On the other hand, with systematic prepositioning of the bead, i.e., with biasing the space explored by thermal fluctuations by imposing trapping potentials onto the free energy landscape of the tethering molecule, it is also possible to expand the range over which elastic properties can be mapped out and to determine geometrical parameters of the tethering molecule.
The observed linker stiffness is much less than the stiffness of a single myosin head expected on the basis of muscle fiber studies and most single myosin molecule measurements. The stiffness of a single cross-bridge was first estimated from muscle fiber studies to be ∼0.25 pN/nm (Huxley and Simmons, 1971). More recently, however, this value was reconsidered on the basis of experimental evidence that compliance of muscle fibers, initially thought to be almost exclusively located in the cross-bridges themselves (Ford et al., 1981), is ∼50% located within the actin and myosin filaments (Higuchi et al., 1995; Huxley et al., 1994; Kojima et al., 1994; Wakabayashi et al., 1994). Together with more recent results from improved single-muscle fiber measurements, Huxley and Tideswell (1996) estimated values of ∼2 pN/nm for the stiffness of a single cross-bridge.
From single-molecule measurements with myosin two different values for myosin elasticity were reported. Independently of the experimental systems, i.e., whether double-trap, single-trap, or scanning-probe techniques were used, for whole myosin molecules an elasticity of 0.03–0.06 pN/nm was reported (Ishijima et al., 1996, 1998; Tanaka et al., 1998), whereas for proteolytic fragments like myosin S-1 or HMM an elasticity between 0.5 and 1.5 pN/nm was derived (Kitamura et al., 1999; Mehta et al., 1997; Molloy et al., 1995; Nishizaka et al., 1995; Veigel et al., 1998). Our values of 0.044 pN/nm for the stiffness of a myosin molecule in the direction away from actin filaments are almost identical with values derived from both single- and double-headed full-length myosin molecules incorporated into synthetic myosin/rod cofilaments (Ishijima et al., 1996, 1998; Tanaka et al., 1998). This suggests that the main differences in studies in which much higher stiffness was found are due to the use of full-length myosin molecules versus proteolytic fragments without the myosin S-2 and/or LMM. This implies that the source of the very low stiffness seen in isolated full-length myosin molecules resides within or between the S-2 and LMM fragments. Since stiffness of attached myosin heads in muscle fibers was estimated to be close to the stiffness seen for isolated S-1 or HMM fragments, the compliant structure(s) in isolated full length myosin do not dominate the compliance in muscle fibers. This may be due to the incorporation of myosin molecules into thick filaments and/or to the specific geometrical constraints within a muscle fiber. Using full-length myosin molecules incorporated in synthetic myosin/rod cofilaments (Ishijima et al., 1996, 1998; Tanaka et al., 1998), however, myosin elasticity was found to be comparable to that of isolated myosin molecules, i.e., close to the values found in this study. It is possible that this results from incomplete reconstitution of the synthetic myosin/rod cofilaments with reduced stabilization of the incorporated myosin molecules, since additional proteins are associated with native myosin filaments, e.g., myosin-binding protein C and titin, that may contribute significantly to the stability of the native thick filaments.
An alternative possibility for the observed low axial stiffness could be the assumption of detachment of actin filaments from the glass surface onto which the filaments were immobilized via a biotin-neutravidin system. We therefore recorded thermal fluctuations of microspheres coupled via streptavidin to immobilized biotinylated actin filaments. The stiffness in the z-direction was found to be at least two orders of magnitude larger than found for beads tethered to the immobilized actin filaments by myosin molecules. Therefore, the measured low elasticity with myosin as the tethering molecule is unlikely to be due to, e.g., bending, rotation, or detachment of actin filaments from the neutravidin-coated surface. Instead, these controls support our assumption that the observed stiffness represents the elasticity of parts of single, full-length myosin molecules that, however, become stiffened by incorporation of the myosin molecules into native thick filaments.
In addition to information about axial linker stiffness, thermal fluctuation analysis also provides information about the linker geometry. Detailed information about linker geometry cannot simply be derived from geometric analysis (see Fig. 8) since effects of the trapping potentials, although weak, and repulsive forces near the substrate surface need to be accounted for. That these factors indeed can have a significant effect is seen when comparing the modeling results with values of total linker length and position of the hinge above the substrate that were directly measured from Fig. 8. Such direct measurement gives a linker length and height of the hinge above the substrate of ∼150 and 115 nm, respectively. The Brownian dynamics simulations yielded a total linker length between microsphere and glass surface of ∼130 nm and a height of the hinge above the substrate of 90 nm. The mechanical model for the myosin molecule used in these simulations was based on the known high bending stiffness of coiled-coil protein structures like the myosin rod, and on electron microscopic observations suggesting up to two hinges within this stiff coiled coil (Elliott and Offer, 1978; Walker et al., 1985). This led us to the simplest model that could account for our data. This model consisted of two rigid elements connected by a free hinge, rigid connections to both actin filament and microsphere, as well as a rigid connection between actin filament and substrate. A simple worm-like chain model and a freely jointed chain forming an entropic spring appeared less realistic on the basis of the electron microscopic observations. The ability to account for the observed data by our simple model, however, does not preclude other more elaborate models, and further studies will be needed to establish the molecular nature of the elastic properties of the tether.
Since we used freshly extracted full-length myosin from skinned skeletal muscle fibers with a length of ∼180 nm including the head domains (Elliott and Offer, 1978), the estimated total linker length is reasonable. For the best fit with two rigid elements and a free hinge, the equilibrium length of the rotating part of the tether is ∼40 nm, and the free hinge is located ∼90 nm above the substrate surface (see Fig. 8). Thus, the free hinge is located inside the S-2 part of the myosin molecule. Previously, two bending points inside the S-2 fragment of full-length myosin molecules have been described by electron microscopy, one at ∼44 nm (Elliott and Offer, 1978; Walker et al., 1985) and a second at ∼76 nm (Takahashi, 1978; Walker et al., 1985) away from the flexible head-tail junction (Elliott and Offer, 1978). Including 19 nm for the myosin head domain (Elliott and Offer, 1978; Walker et al., 1985), these points are located at ∼63 nm and ∼95 nm, respectively, from the actin binding interface. Including 11 nm for the actin filament the bending points should be 74 nm and 106 nm above the substrate surface if all these elements are aligned precisely along the z axis. Cryoelectron microscopy of actin filaments with myosin head domains attached in the absence of ATP, however, shows that the myosin head domain is tilted both axially and azimuthally with respect to the actin filament axis, such that the myosin head domain contributes much less than 19 nm to the distance of the free hinge above the substrate surface. In addition, the estimate of absolute height above the substrate surface (see Fig. 8, dashed circle) did not consider the BSA coating of the beads that increases the apparent radius of the bead and thus the absolute height above the substrate. Thus, the height of the free hinge from Brownian dynamics simulations could well be around 90–100 nm instead of 80–90 nm. Considering both of these points, the height of the free hinge above the surface from the Brownian dynamics simulation is well consistent with the position of the second bending point within the S-2, which is the S-2/LMM junction in the myosin rod fragment, i.e., the so-called hinge region of myosin (see Fig. 10). Concerning the second rigid element located after the free hinge, it was found that the LMM fragment behaves as a rigid cylinder (Highsmith et al., 1977). A small region, however, ∼20 nm in length and located at the very end of the rod, was found to be significantly different from the rest (Walker et al., 1985). Often, a hook-like shape of this small region was observed in electron microscopy. This different shape indicates the presence of some flexibility both at the junction between the rod and the last 20 nm and within this region. The size of the total linker length implied by our study is consistent with the possibility that it is this last ∼20-nm-long segment of the LMM part that adsorbs to the bead surface.
FIGURE 10.
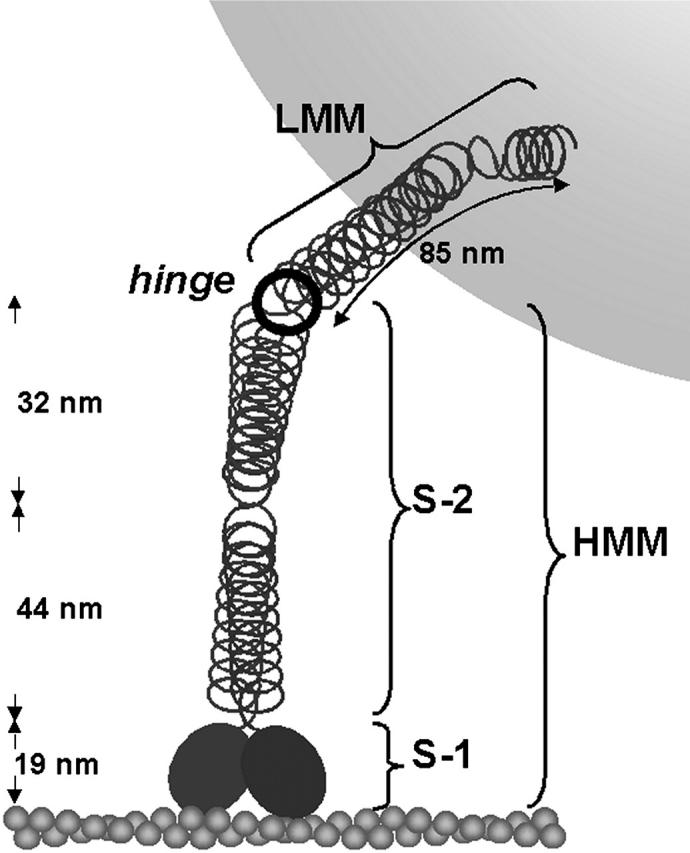
Schematic drawing of a myosin molecule tethering a microsphere to an immobilized actin filament. Names of proteolytic fragments (S-1, S-2, HMM, and LMM) as well as distances between bending points within a myosin molecule (Elliott and Offer, 1978; Walker et al., 1985) are indicated in black.
In the rotating head model (Huxley and Simmons, 1971; Huxley, 1969), the myosin hinge region has been postulated to allow cross-bridges to swing away from the myosin filaments to make attachment of myosin heads to actin filaments possible. Unique properties of the S-2/LMM junction were proposed on the basis of temperature-dependent changes that were interpreted as a helix/coil transition between 20 and 40°C (Rodgers and Harrington, 1987). Functional relevance and accessibility of the S2/LMM junction is suggested by the effect of antibodies directed against the myosin subfragment 2 that decreased active force and fiber stiffness in proportion while ATPase activity remained unchanged (Sugi et al., 1992). Thus, with modulated function of the myosin hinge region myosin heads can still hydrolyze ATP, whereas high-affinity binding of myosin to actin and contribution to force generation appear impaired. These observations show that the S-2/LMM junction, i.e., the hinge derived from the Brownian dynamics simulations, apparently is accessible to antibodies in the intact myosin filament, i.e., it is outside the myosin filament backbone. The axial compliance we observed, in contrast, seems to be located distal from this hinge, i.e., between the myosin hinge and the bead, as it seems to be located in a region normally incorporated and thus stabilized in the native thick filaments.
The presented data illustrate the general applicability of thermal fluctuation analysis to determine elastic properties and geometrical factors of individual molecules. The structural correlate of our measured axial compliance seems to be stabilized in native thick filaments while the observed hinge is accessible and of functional relevance. Identification of the structural correlate of the observed linker geometry and more precise identification of the source of the observed compliance will be possible in future experiments by making use of myosin constructs of variable length.
Acknowledgments
We thank Arnd Pralle and Ernst-Ludwig Florin for helpful discussions, especially in the early stages of this work.
T.S. was supported by a short-term fellowship from the European Molecular Biology Organization. S.M.A. thanks the Cusanuswerk for financial support. M.A. was funded by European Union grant HPRN-CT-2000-00091. This work was funded partially by the Deutsche Forschungsgemeinschaft (HO 1252/6-1, BR 849/21-2).
Stephan M. Altmann's present address is BASF AG, Carl-Bosch-Str. 38, 67056 Ludwigshafen, Germany.
J.-K. Heinrich Hörber's present address is Wayne State University, School of Medicine, Dept. of Physiology, 5374 Scott Hall, 540 E. Canfield Ave., Detroit, MI 48201 USA.
References
- Altmann, S. M. 2002. Single molecule mechanics: linking structure and function of proteins; development and application of local probe techniques. PhD thesis. Universität Ulm, Ulm, Germany.
- Block, S. M., L. S. Goldstein, and B. J. Schnapp. 1990. Bead movement by single kinesin molecules studied with optical tweezers. Nature. 348:348–352. [DOI] [PubMed] [Google Scholar]
- Dobbie, I., M. Linari, G. Piazzesi, M. Reconditi, N. Koubassova, M. A. Ferenczi, V. Lombardi, and M. Irving. 1998. Elastic bending and active tilting of myosin heads during muscle contraction. Nature. 396:383–387. [DOI] [PubMed] [Google Scholar]
- Elliott, A., and G. Offer. 1978. Shape and flexibility of the myosin molecule. J. Mol. Biol. 123:505–519. [DOI] [PubMed] [Google Scholar]
- Finer, J. T., R. M. Simmons, and J. A. Spudich. 1994. Single myosin molecule mechanics: piconewton forces and nanometre steps. Nature. 368:113–119. [DOI] [PubMed] [Google Scholar]
- Florin, E. L., A. Pralle, J. K. H. Hörber, and E. H. K. Stelzer. 1997. Photonic force microscope based on optical tweezers and two-photon excitation for biological applications. J. Struct. Biol. 119:202–211. [DOI] [PubMed] [Google Scholar]
- Florin, E. L., A. Pralle, E. H. K. Stelzer, and J. K. H. Hörber. 1998. Photonic force microscope calibration by thermal noise analysis. Appl. Phys. A. 66:S75–S78. [Google Scholar]
- Ford, L. E., A. F. Huxley, and R. M. Simmons. 1981. The relation between stiffness and filament overlap in stimulated frog muscle fibres. J. Physiol. (Lond.). 311:219–249. [DOI] [PMC free article] [PubMed] [Google Scholar]
- Happel, J., and H. Brenner. 1965. Low Reynolds Number Hydrodynamics. Prentice Hall, Englewood Cliffs. NJ.
- Harada, Y., A. Noguchi, A. Kishino, and T. Yanagida. 1987. Sliding movement of single actin filaments on one-headed myosin filaments. Nature. 326:805–808. [DOI] [PubMed] [Google Scholar]
- Harrington, W. F., T. Karr, W. B. Busa, and S. J. Lovell. 1990. Contraction of myofibrils in the presence of antibodies to myosin subfragment 2. Proc. Natl. Acad. Sci. USA. 87:7453–7456. [DOI] [PMC free article] [PubMed] [Google Scholar]
- Hasselbach, W., and G. Schneider. 1951. Der L-Myosin und Aktingehalt des Kaninchenmuskels. Biochem. Zeitschriften. 321:462–475. [PubMed] [Google Scholar]
- Highsmith, S., K. M. Kretzschmar, C. T. O'Konski, and M. F. Morales. 1977. Flexibility of myosin rod, light meromyosin, and myosin subfragment-2 in solution. Proc. Natl. Acad. Sci. USA. 74:4986–4990. [DOI] [PMC free article] [PubMed] [Google Scholar]
- Higuchi, H., T. Yanagida, and Y. E. Goldman. 1995. Compliance of thin filaments in skinned fibers of rabbit skeletal muscle. Biophys. J. 69:1000–1010. [DOI] [PMC free article] [PubMed] [Google Scholar]
- Huxley, A. F. 1957. Muscle structure and theories of contraction. Prog. Biophys. Biophys. Chem. 7:255–318. [PubMed] [Google Scholar]
- Huxley, A. F. 1974. Muscular contraction. J. Physiol. 243:1–43. [PMC free article] [PubMed] [Google Scholar]
- Huxley, A. F., and R. M. Simmons. 1971. Proposed mechanism of force generation in striated muscle. Nature. 233:533–538. [DOI] [PubMed] [Google Scholar]
- Huxley, A. F., and S. Tideswell. 1996. Filament compliance and tension transients in muscle. J. Muscle Res. Cell Motil. 17:507–511. [DOI] [PubMed] [Google Scholar]
- Huxley, H. E. 1969. The mechanism of muscular contraction. Science. 164:1356–1365. [PubMed] [Google Scholar]
- Huxley, H. E., A. Stewart, H. Sosa, and T. Irving. 1994. X-ray diffraction measurements of the extensibility of actin and myosin filaments in contracting muscle. Biophys. J. 67:2411–2421. [DOI] [PMC free article] [PubMed] [Google Scholar]
- Irving, M., G. Piazzesi, L. Lucii, Y. B. Sun, J. J. Harford, I. M. Dobbie, M. A. Ferenczi, M. Reconditi, and V. Lombardi. 2000. Conformation of the myosin motor during force generation in skeletal muscle. Nat. Struct. Biol. 7:482–485. [DOI] [PMC free article] [PubMed] [Google Scholar]
- Ishijima, A., H. Kojima, T. Funatsu, M. Tokunaga, H. Higuchi, H. Tanaka, and T. Yanagida. 1998. Simultaneous observation of individual ATPase and mechanical events by a single myosin molecule during interaction with actin. Cell. 92:161–171. [DOI] [PubMed] [Google Scholar]
- Ishijima, A., H. Kojima, H. Higuchi, Y. Harada, T. Funatsu, and T. Yanagida. 1996. Multiple- and single-molecule analysis of the actomyosin motor by nanometer-piconewton manipulation with a microneedle: unitary steps and forces. Biophys. J. 70:383–400. [DOI] [PMC free article] [PubMed] [Google Scholar]
- Kitamura, K., M. Tokunaga, A. H. Iwane, and T. Yanagida. 1999. A single myosin head moves along an actin filament with regular steps of 5.3 nanometres. Nature. 397:129–134. [DOI] [PubMed] [Google Scholar]
- Köhler, J., G. Winkler, I. Schulte, T. Scholz, W. McKenna, B. Brenner, and T. Kraft. 2002. Mutation of the myosin converter domain alters cross-bridge elasticity. Proc. Natl. Acad. Sci. USA. 99:3557–3562. [DOI] [PMC free article] [PubMed] [Google Scholar]
- Kojima, H., A. Ishijima, and T. Yanagida. 1994. Direct measurement of stiffness of single actin filaments with and without tropomyosin by in vitro nanomanipulation. Proc. Natl. Acad. Sci. USA. 91:12962–12966. [DOI] [PMC free article] [PubMed] [Google Scholar]
- Kraft, T., J. M. Chalovich, L. C. Yu, and B. Brenner. 1995a. Parallel inhibition of active force and relaxed fiber stiffness by caldesmon fragments at physiological ionic strength and temperature conditions: additional evidence that weak cross-bridge binding to actin is an essential intermediate for force generation. Biophys. J. 68:2404–2418. [DOI] [PMC free article] [PubMed] [Google Scholar]
- Kraft, T., M. Messerli, B. Rothen-Rutishauser, J. C. Perriard, T. Wallimann, and B. Brenner. 1995b. Equilibration and exchange of fluorescently labeled molecules in skinned skeletal muscle fibers visualized by confocal microscopy. Biophys. J. 69:1246–1258. [DOI] [PMC free article] [PubMed] [Google Scholar]
- Kron, S. J., Y. Y. Toyoshima, T. Q. Uyeda, and J. A. Spudich. 1991. Assays for actin sliding movement over myosin-coated surfaces. Methods Enzymol. 196:399–416. [DOI] [PubMed] [Google Scholar]
- Kunioka, Y., and T. Ando. 1996. Innocuous labeling of the subfragment-2 region of skeletal muscle heavy meromyosin with a fluorescent polyacrylamide nanobead and visualization of individual heavy meromyosin molecules. J. Biochem. (Tokyo). 119:1024–1032. [DOI] [PubMed] [Google Scholar]
- Mehta, A. D., J. T. Finer, and J. A. Spudich. 1997. Detection of single-molecule interactions using correlated thermal diffusion. Proc. Natl. Acad. Sci. USA. 94:7927–7931. [DOI] [PMC free article] [PubMed] [Google Scholar]
- Molloy, J. E., J. E. Burns, J. Kendrick-Jones, R. T. Tregear, and D. C. White. 1995. Movement and force produced by a single myosin head. Nature. 378:209–212. [DOI] [PubMed] [Google Scholar]
- Nishizaka, T., H. Miyata, H. Yoshikawa, S. Ishiwata, and K. Kinosita, Jr. 1995. Unbinding force of a single motor molecule of muscle measured using optical tweezers. Nature. 377:251–254. [DOI] [PubMed] [Google Scholar]
- Nishizaka, T., R. Seo, H. Tadakuma, K. Kinosita Jr., and S. Ishiwata. 2000. Characterization of single actomyosin rigor bonds: load dependence of lifetime and mechanical properties. Biophys. J. 79:962–974. [DOI] [PMC free article] [PubMed] [Google Scholar]
- Pardee, J. D., and J. A. Spudich. 1982. Purification of muscle actin. Methods Enzymol. 85:164–181. [DOI] [PubMed] [Google Scholar]
- Pralle, A., M. Prummer, E. L. Florin, E. H. K. Stelzer, and J. K. H. Hörber. 1999. Three-dimensional high-resolution particle tracking for optical tweezers by forward scattered light. Microsc. Res. Tech. 44:378–386. [DOI] [PubMed] [Google Scholar]
- Rodgers, M. E., and W. F. Harrington. 1987. Hinging of rabbit myosin rod. Biochemistry. 26:8697–8703. [DOI] [PubMed] [Google Scholar]
- Scholz, T., S. M. Altmann, J. K. H. Hörber, and B. Brenner. 2002. Mechanical properties of myosin probed with the Photonic Force Microscope. Biophys. J. 82:372a. (Abstr.) [DOI] [PMC free article] [PubMed] [Google Scholar]
- Scholz, T., and B. Brenner. 2003. Actin sliding on reconstituted myosin filaments containing only one myosin heavy chain isoform. J. Muscle Res. Cell Motil. 24:77–86. [DOI] [PubMed] [Google Scholar]
- Sheetz, M. P., S. M. Block, and J. A. Spudich. 1986. Myosin movement in vitro: a quantitative assay using oriented actin cables from Nitella. Methods Enzymol. 134:531–544. [DOI] [PubMed] [Google Scholar]
- Sugi, H., T. Kobayashi, T. Gross, K. Noguchi, T. Karr, and W. F. Harrington. 1992. Contraction characteristics and ATPase activity of skeletal muscle fibers in the presence of antibody to myosin subfragment 2. Proc. Natl. Acad. Sci. USA. 89:6134–6137. [DOI] [PMC free article] [PubMed] [Google Scholar]
- Takahashi, K. 1978. Topography of the myosin molecule as visualized by an improved negative staining method. J. Biochem. (Tokyo). 83:905–908. [DOI] [PubMed] [Google Scholar]
- Tanaka, H., A. Ishijima, M. Honda, K. Saito, and T. Yanagida. 1998. Orientation dependence of displacements by a single one-headed myosin relative to the actin filament. Biophys. J. 75:1886–1894. [DOI] [PMC free article] [PubMed] [Google Scholar]
- Thedinga, E., N. Karim, T. Kraft, and B. Brenner. 1999. A single-fiber in vitro motility assay. In vitro sliding velocity of F-actin vs. unloaded shortening velocity in skinned muscle fibers. J. Muscle Res. Cell Motil. 20:785–796. [DOI] [PubMed] [Google Scholar]
- Uyeda, T. Q., P. D. Abramson, and J. A. Spudich. 1996. The neck region of the myosin motor domain acts as a lever arm to generate movement. Proc. Natl. Acad. Sci. USA. 93:4459–4464. [DOI] [PMC free article] [PubMed] [Google Scholar]
- Veigel, C., M. L. Bartoo, D. C. White, J. C. Sparrow, and J. E. Molloy. 1998. The stiffness of rabbit skeletal actomyosin cross-bridges determined with an optical tweezers transducer. Biophys. J. 75:1424–1438. [DOI] [PMC free article] [PubMed] [Google Scholar]
- Wakabayashi, K., Y. Sugimoto, H. Tanaka, Y. Ueno, Y. Takezawa, and Y. Amemiya. 1994. X-ray diffraction evidence for the extensibility of actin and myosin filaments during muscle contraction. Biophys. J. 67:2422–2435. [DOI] [PMC free article] [PubMed] [Google Scholar]
- Walker, M., P. Knight, and J. Trinick. 1985. Negative staining of myosin molecules. J. Mol. Biol. 184:535–542. [DOI] [PubMed] [Google Scholar]
- Yu, L. C., and B. Brenner. 1989. Structures of actomyosin crossbridges in relaxed and rigor muscle fibers. Biophys. J. 55:441–453. [DOI] [PMC free article] [PubMed] [Google Scholar]


