

Abstract
Two families of actin regulatory proteins are the tropomodulins and tropomyosins. Tropomodulin binds to tropomyosin (TM) and to the pointed end of actin filaments and “caps” the pointed end (i.e., inhibits its polymerization and depolymerization). Tropomodulin 1 has two distinct actin-capping regions: a folded C-terminal domain (residues 160–359), which does not bind to TM, and a conserved, N-terminal region, within residues 1–92 that binds TM and requires TM for capping activity. NMR and circular dichroism were used to determine the structure of a peptide containing residues 1–92 of tropomodulin (Tmod11-92) and to define its TM binding site. Tmod11-92 is mainly disordered with only one helical region, residues 24–35. This helix forms part of the TM binding domain, residues 1–35, which become more ordered upon binding a peptide containing the N-terminus of an α-TM. Mutation of L27 to E or G in the Tmod helix reduces TM affinity. Residues 49–92 are required for capping but do not bind TM. Of these, residues 67–75 have the sequence of an amphipathic helix, but are not helical. Residues 55–62 and 76–92 display negative 1H-15N heteronuclear Overhauser enhancements showing they are flexible. The conformational dynamics of these residues may be important for actin capping activity.
INTRODUCTION
A dynamic actin cytoskeleton allows a cell to respond rapidly to intracellular and extracellular signals by interacting with proteins that spatially and temporally influence the nucleation and kinetics of actin polymerization, as well as the stability and state of assembly of the actin filament (reviewed in Pollard et al., 2000; Pollard and Borisy, 2003). The actin filaments found in the sarcomeres of striated muscles, as well as in stress fibers and microvilli in nonmuscle cells, are stable, unbranched structures. Actin binding proteins that regulate addition and loss of actin subunits at the two ends of the filaments, and stabilize the filament against severing proteins, are needed to maintain stable actin filaments. A class of proteins referred to as capping proteins block the rapidly growing, “barbed” or “plus” end (Cooper and Schafer, 2000). In addition, two proteins, tropomyosin (TM) and tropomodulin (Tmod), act together to regulate the dynamics of the slow growing, “pointed”, or “minus” end of the filament (Fowler, 1990, 1997; Fowler et al., 2003; Kostyukova and Hitchcock-DeGregori, 2004; Weber et al., 1999).
The tropomodulins, which cap the pointed end of the actin filaments, are a family of widely expressed proteins that bind both to TM and actin (reviewed in Conley, 2001; Conley et al., 1998; Fowler, 1997; Fowler and Conley, 1999). Tropomodulin 1 (Tmod1, E-Tmod) was originally isolated from human erythrocytes as a tropomyosin-binding protein (Fowler, 1987, 1990), and is also the prevalent form in mammalian cardiac muscle and slow skeletal muscle. Other isoforms include Tmod2, found only in neuronal tissue (Cox and Zoghbi, 2000; Sussman et al., 1994; Watakabe et al., 1996), Tmod3 (ubiquitous Tmod), which is widely expressed in a variety of different organs and tissues (Cox and Zoghbi, 2000), and Tmod4 (Sk-Tmod), restricted to skeletal muscle (Almenar-Queralt et al., 1999; Conley et al., 2001; Cox and Zoghbi, 2000). Tropomodulin has been localized to the pointed end of actin filaments in the sarcomeres of striated muscle (Fowler et al., 1993), in the spectrin-actin cytoskeleton in erythrocytes (Ursitti and Fowler, 1994) and in cultured cells (Fischer et al., 2000, 2003a).
The most extensive functional analysis has been of Tmod1 using native and recombinant protein, and protein fragments, although Tmod3 and Tmod4 have also been shown to block actin filament elongation in vitro (Fischer et al., 2003a,b). Full-length Tmod1 can bind TM and block actin filament polymerization and depolymerization in a TM-dependent fashion (Fowler, 1990; Weber et al., 1994, 1999). Tropomodulin 1 has two domains, which are functionally and structurally distinct (Fujisawa et al., 2001; Kostyukova et al., 2000, 2001). The C-terminal half is the major actin binding domain and at high concentrations can cap the pointed end of filaments in the absence of TM. In addition, it weakly nucleates polymerization (Fowler et al., 2003). This domain also binds nebulin (Krieger et al., 2002; McElhinny et al., 2001). The domain unfolds in a two-state transition and its atomic structure is a right-handed superhelix composed of alternating α-helices and β-strands (Krieger et al., 2002). The C-terminal folded region contains a leucine-rich repeat domain, which is involved in many protein-protein interactions (Kobe and Deisenhofer, 1994).
The N-terminal domain of Tmod1 binds TM in an isoform-specific manner (Babcock and Fowler, 1994; Greenfield and Fowler, 2002; Kostyukova and Hitchcock-DeGregori, 2004; Sung et al., 1992; Sussman and Fowler, 1992) and it becomes more structured upon binding to TM (Greenfield and Fowler, 2002; Kostyukova and Hitchcock-DeGregori, 2004; Kostyukova et al., 2001). The structure of the N-terminal region of Tmod1 is elongated and disordered (Fujisawa et al., 2001; Kostyukova et al., 2001), and attempts to crystallize it and full-length Tmod1 have failed. It can cap actin filaments in the presence of TM (Fowler et al., 2003; Kostyukova and Hitchcock-DeGregori, 2004). The interaction between the N-terminal domain of Tmod1 and TM is required to maintain stable thin filaments in cardiac myocyte sarcomeres (Mudry et al., 2003).
In this work we used high-resolution NMR and circular dichroism (CD) to characterize the structure of the N-terminal capping domain of Tmod and to define precisely the TM binding region. In this study we used three fragments of Tmod containing residues 1–92 (Tmod11-92), 1–48 (Tmod11-48) (Kostyukova and Hitchcock-DeGregori, 2004), and 38–92 (Tmod138-92). In the presence of TM, Tmod11-92, inhibits both polymerization and depolymerization at the actin filament's pointed end. Tmod11-48 retains full affinity for TM, but it has no capping activity (Kostyukova and Hitchcock-DeGregori, 2004). Our results show that Tmod11-92 has two domains that differ in structure and flexibility. The N-terminal domain is partially ordered and contains the TM binding site, whereas the C-terminal end, necessary for capping activity, is extended and flexible. Mutagenesis of a hydrophobic residue in the observed short helical region (residues 24–35) shows that a coiled-coil motif is required for high affinity TM binding, suggesting that part of the TM/Tmod1 interface contains a triple helical region.
MATERIALS AND METHODS
Materials
Unlabeled Tmod11-92 and Tmod11-48, containing the first 48 and 92 residues of chicken Tmod1 were expressed and purified as previously reported (Kostyukova and Hitchcock-DeGregori, 2004). The peptides contain a His tag (a Met residue followed by six histidines) at the N-terminus. To prepare Tmod11-92 labeled with 15N alone or 15N and 13C, the proteins were expressed in minimal medium containing 15N ammonium sulfate with or without glucose uniformly labeled with 13C as previously described (Greenfield et al., 2001). Tmod138-92 was synthesized and purified by the Keck Facility at Yale University (New Haven, CT). Unlabeled TM1a1-14Zip (also called GlyTM1aZip, Palm et al., 2003; or TM1a1-14, Greenfield et al., 2002a) and TM1b1-19Zip (also called GlyTM1bZip; Greenfield and Fowler, 2002), chimeric peptides containing the first 14 residues of the N-terminus of rat striated muscle TM encoded by exon 1a or the first 19 residues of the N-terminus of rat nonmuscle TMs encoded by exon 1b, respectively (Helfman et al., 1986), and the last 18 C-terminal residues of the yeast transcription factor GCN4 (Landschulz et al., 1988) and with glycines substituted for the N-terminal acetyl groups, were prepared as previously described (Greenfield et al., 2001, 2002b). Purified acetylated TM1b1-19Zip (AcTM1b1-19Zip) and TM1a1-14Zip (AcTM1a1-14Zip), which have an acetyl group instead of glycine at the N-terminus, were purchased from SynPep (Dublin, CA). Chicken muscle αα-tropomyosin was prepared as previously described (Hitchcock-DeGregori et al., 1985).
Preparation of Tmod11-92L27E and Tmod11-92L27G
Mutations were introduced into DNA encoding Tmod11-92 using a QuikChange site-directed mutagenesis kit (Stratagene, La Jolla, CA). The plasmids were amplified by PCR using PfuTurbo DNA polymerase with the plasmid pET(His)Tmod11-92 (Kostyukova et al., 2004) as the template using two complementary sets of oligonucleotides. To change L27 to G the oligonucleotides were:
5′-CCT GAC GGA GGA AGA GGG CAG GAA GTT GGA GAA CG-3′ and
5′-CGT TCT CCA ACT TCC TGC CCT CTT CCT CCG TCA GG-3′.
To change L27 to E the oligonucleotides were:
5′-GCC CTG ACG GAG GAA GAG GAG AGG AAG TTG GAG AAC G-3′and
5′-CGT TCT CCA ACT TCC TCT CCT CTT CCT CCG TCA GGG C-3′.
The mutations are underlined. The original plasmid was digested using Dpn I and the mixture was used to transform Escherichia coli (DH5α). The presence of the mutations was confirmed by sequencing of the full tropomodulin insert. Synthesis of all oligonucleotides and sequence determination were done at the University of Medicine and Dentistry of New Jersey DNA synthesis and sequencing facility (Robert Wood Johnson Medical School, Piscataway, NJ).
The mutated Tmod11-92 fragments were overexpressed in E. coli strain BL21(DE3)pLysE and purified as described for the wild-type Tmod11-92 fragment (Kostyukova and Hitchcock-DeGregori, 2004). The molecular masses of these fragments, determined by electrospray mass spectroscopy (Keck Biotechnology Resource Laboratory, Yale University), were 11,820 found versus 11,820.1 predicted for L27E and 11,748 found versus 11,748.1 predicted for L27G. Their purity was determined using SDS-PAGE (Laemmli, 1970).
Electrophoresis
Native gel electrophoresis of the Tmod fragments and mutants and their 1:1 mixtures with AcTM1b1-19Zip were performed in 9% polyacrylamide gels that were polymerized in the presence of 10% glycerol without SDS at pH 8.8 as previously described (Greenfield et al., 2002b). To prepare the complexes for loading on the gel, stock solutions containing 48 μM Tmod peptide in the absence or presence of 48 μM AcTM1b1-19Zip in 100 mM NaCl, 10 mM sodium phosphate, pH 6.5, were mixed 1:1 with buffer containing 20 mM Tris, pH 8.8, 20% glycerol, plus 0.004% bromphenol blue as a marker. Fifteen microliters of each sample were loaded on the gels.
Determination of protein concentration
The concentrations of Tmod11-48, the wild-type and mutated Tmod11-92 peptides, the TM1a1-14Zip and TM1b1-19Zip peptides, and chicken muscle αα-tropomyosin were determined by measuring the difference spectra of their tyrosine residues in 6 M guanidine-HCl between pH 12.5 and 6.0 (Edelhoch, 1967) using an extinction coefficient of 2357 per tyrosine residue (Fasman, 1989). The concentration of Tmod138-92 was estimated from its phenylalanine absorption at 257.6 nm in 100 mM NaCl, 10 mM sodium phosphate, pH 6.5, using a molar extinction coefficient of 195.1 per phenylalanine (Fasman, 1989).
Circular dichroism spectroscopy, secondary structure estimation, and thermodynamics of folding
CD measurements were carried out on Aviv Model 62D (Aviv Biomedical, Lakewood, NJ) or Aviv Model 215 (Proterion, Piscataway, NJ) spectrophotometers. All measurements were made in 100 mM NaCl, 10 mM sodium phosphate, pH 6.5. Protein and peptide concentrations ranged from 5 to 20 μM. The secondary structures of Tmod11-92 and Tmod11-48 were estimated from the mean residue ellipticity between 260 and 200 nm using three computer programs: CDNN, a neural net analysis method that uses a protein reference set (Bohm et al., 1992); SELCON1, a self-consistent singular value decomposition method with a protein database as standards (Sreerama and Woody, 1994), and LINCOMB, a constrained least squares analysis method (Perczel et al., 1992), using a fixed peptide reference set for α-helix, β-structure, β-turn, and random coil (Brahms and Brahms, 1980). The enthalpies and TMs of folding of the Tmod1 peptide/TM peptide complexes were measured by following the ellipticity at 222 nm as a function of temperature as previously described (Greenfield and Fowler, 2002).
NMR spectroscopy of Tmod11-92
NMR data of unbound Tmod11-92 were collected on a Varian Inova 500 spectrometer (Varian, Palo Alto, CA) at 10°C. The concentration of 15N labeled peptide was 1.1 mM and that of the 13C15N labeled peptide was 0.8 mM. Measurements of the complex of 13C15N-Tmod1-92, 0.9 mM with an excess of unlabeled TM1a1-14Zip, 1.3 mM, were made on a Varian Inova 600 spectrometer (Varian) at 10 and 20°C. All spectral measurements were made in susceptibility-matched NMR tubes (Shigemi, Allison Park, PA) in 100 mM NaCl, 10 mM sodium phosphate, 5% D2O, pH 6.5. The programs VNMR (Varian) and NMRpipe (Delaglio et al., 1995) were used for data processing. All of the spectra were processed with twofold zero filling, Gaussian or sine bell multiplication, and linear prediction. The program Sparky (T. Goddard and T. Kneller, University of California at San Francisco, unpublished) was used for peak peaking and determining the intensity of the crosspeaks.
Resonance assignments
The assignments of the backbone resonances of the N, H, Cα Cβ, C′, and Hα atoms were determined from spectra acquired using NMR pulse sequences that transfer magnetization through bonds including 15N-1H-heteronuclear single quantum correlation (HSQC) (Bodenhausen and Ruben, 1980; Kay et al., 1992), H(CA)NH and CANH (Feng et al., 1996; Montelione and Wagner, 1990), H(CA)(CO)NH and CA(CO)NH (Boucher et al., 1991; Feng et al., 1996), and CBCANH (Grzesiek and Bax, 1992a,b; Rios et al., 1996), as previously described (Greenfield et al., 2003). In addition, an HNN experiment (Panchal et al., 2001) was performed to confirm some of the assignments of the 15N and 1H backbone resonances. Side-chain resonance assignments were made using two three-dimensional (3D) correlated spectroscopy (cosy) pulse sequences, HCCHcosy and CCHcosy (Bax et al., 1990; Kay et al., 1990) and a 1H-13C-HSQC (Bodenhausen and Ruben, 1980) spectrum. Two-dimensional planes of 13C edited nuclear Overhauser enhancement and exchange spectroscopy (NOESY) spectra (Ikura et al., 1990; Pascal et al., 1994) of the aromatic region were used to assign the side-chain resonances of the aromatic resonances of the tyrosines. Most of the aromatic resonances arising from the histidine and phenylalanine resonances were not resolved and could not be assigned.
Determination of the structure and dynamic properties of Tmod11-92
Distance constraints for structure analysis of the uncomplexed Tmod11-92 fragment were obtained by analysis of 3D 15N edited pulsed field gradient (PFG) NOESY-HSQC (Driscoll et al., 1990; Pascal et al., 1994) and 13C edited PFG NOESY-HSQC (Ikura et al., 1990; Pascal et al., 1994) experiments, with mixing times of 80 and 100 ms, respectively. The intensities were converted to distances and the structure was calculated using AutoStructure v1.2.1 (Huang et al., 2003; Moseley and Montelione, 1999; Zheng et al., 2003) as previously described (Greenfield et al., 2001, 2003). Heteronuclear 15N-1H Overhauser enhancement (HNOE) data were collected on the Tmod11-92/TM1a1-14Zip peptide complex to characterize the relative flexibility of the Tmod residues when bound to the TM peptide (Kay et al., 1989; Li and Montelione, 1994a, 1995).
RESULTS AND DISCUSSION
A specific function of Tmod is to bind to TM and to cap the pointed end of actin filaments in a TM-dependent fashion (Fischer and Fowler, 2003). A fragment of Tmod1 that contains residues 1–92, originally identified in preparations of full-length Tmod1 expressed in E. coli (Kostyukova et al., 2000) (Fig. 1), retains these functions (Kostyukova et al., 2000; Kostyukova and Hitchcock-DeGregori, 2004). Here we determined the structure of this fragment, identified the TM binding site within it, and defined the structural requirements for TM binding using site-directed mutagenesis.
FIGURE 1.
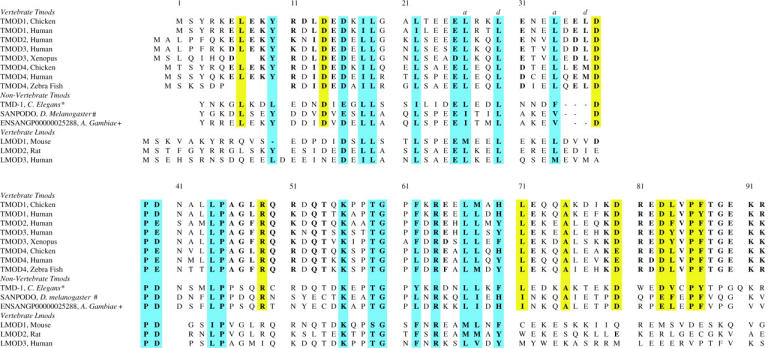
Alignment of the sequences to chicken Tmod11-92 of vertebrate tropomodulins (Tmods) encoded by four different genes, invertebrate Tmod analogs encoded by three genes, and vertebrate leiomodins (Lmods) encoded by three different genes. The residues that are identical or homologous (same charge and hydrophobicity) in all of the Tmods and Lmods are highlighted in cyan. The residues that are homologous in both vertebrate and invertebrate Tmods but not Lmods are highlighted in yellow, whereas those that are homologous only in vertebrate Tmods are in bold typeface. (*) Residue 3 of Chicken Tmod1 aligns with residue 33 of tmd-1 of C. elegans. (#) Residue 3 of Chicken Tmod1 aligns with residue 61 of Sanpodo CG1539-PC. (+) Residue 3 of Chicken Tmod1 aligns with residue 20 of Ensangp00000025288. References are as follows: Chicken Tmod1 (Babcock and Fowler, 1994), Human Tmod1 (Strausberg et al., 2002); Human Tmod2 (Cox and Zoghbi, 2000), Human Tmod3 (Cox and Zoghbi, 2000), Xenopus Tmod3 (Klein et al., 2002), Chicken Tmod4 (Almenar-Queralt et al., 1999), Human Tmod4 (Cox and Zoghbi, 2000), Zebra Fish Tmod4 (Almenar-Queralt et al., 1999), C. elegans Tmd-1 (Wilson, 1998), D. melanogaster Sanpodo, (Adams et al., 2000), A. gambaiae EnsangP00000025288 NCBI XP_309162, Mouse Lmod1 (Okazaki et al., 2002), Human Lmod2 (NCBI XP_351745), Human Lmod3 (Strausberg et al., 2002).
The structure of Tmod11-92
Circular dichroism and NMR spectra showed that Tmod11-92 is mainly disordered and highly flexible with one short stable helical region. CD spectra (Fig. 2) were analyzed to compare the secondary structures of Tmod11-48, Tmod11-92, and Tmod138-92 with that of a longer N-terminal fragment, Tmod11-130, previously reported (Greenfield and Fowler, 2002). The percent helical contents, estimated using three different computer programs (see Materials and Methods), were 24 ± 5, 22 ± 1, 15 ± 2, and 20 ± 2, respectively. The agreement among the programs for the estimates of other secondary structures was poor, showing the only regular secondary structural element is α-helix and that the N-terminal half of Tmod1-92 has a higher helical content than the C-terminal half.
FIGURE 2.

Circular dichroism spectra of fragments of tropomodulin 1. (▪) Tmod11-130, 10 μM, (•) Tmod11-92, 1 10 μM, (∇) Tmod11-48, 10 μM, and (⋄)Tmod138-92, 20 μM. All peptides were in 100 mM NaCl, 10 mM sodium phosphate, pH 6.5, 0°C.
NMR spectra showed that Tmod11-92 has only one stable helical region, localized to residues 24–35 (Figs. 3 and 4). Most of the crosspeaks arising from the backbone in the 15N-1H spectrum of Tmod11-92 at 10°C (Fig. 3, cyan crosspeaks) are resolved, but are poorly dispersed, showing that the peptide fragment has little secondary structure, consistent with the CD analysis. The 1Hα and 13Cα chemical shift displacements (Fig. 4 A) and the pattern of  to
to  to
to  to
to  and
and  to
to  nuclear Overhauser enhancements (NOEs) (Fig. 4 B) show that residues 24–35 are α-helical (Wang and Jardetzky, 2002; Wishart and Sykes, 1994; Wishart et al., 1992). The presence of Hαi to
  NOEs suggests there may be some poorly defined regions with turns between residues 18–23 and 61–70 (Wüthrich, 1986). The minor displacements of the rest of the resonances indicate there is little other regular secondary structure.
FIGURE 3.

The 15N-1H HSQC spectrum of the backbone resonances of 15N- Tmod11-92, 0.8 mM (cyan) overlaid with the spectrum of the complex of 13C15N-Tmod1-92, 0.9 mM with an excess (1.3 mM) of TM1a1-14Zip (black) at 10°C. Several of the residues following prolines showed two sets of resonances in both spectra. The set with lower intensities, following prolines in the cis conformation are labeled in magenta. The crosspeaks arising from the Gln and Asn side chains, and the folded crosspeaks from the Arg side chains, are not shown to simplify the figure. The samples were dissolved in 100 mM NaCl, 10 mM sodium phosphate 5% deuterium oxide, pH 6.5.
FIGURE 4.

The displacements of the 1Hα and 13Cα resonances and the sequential NOEs of Tmod11-92 show that residues 24–33 are helical but there is little other regular structure. (A) The chemical shift displacements of the resonances of the 1Hα, 1HN, 13Cα, and 13Cβ atoms of Tmod11-92 compared to the shifts of residues in random conformations (Wang and Jardetzky, 2002). The minor sets of resonances, following prolines in the cis conformations are not shown. (B) Summary of the principal NOE crosspeaks used to complete the assignments and determine the secondary structure of Tmod11-92.
Fig. 5 A shows the 10 backbone structures of Tmod11-92 with lowest constraint violations, calculated using the program AutoStructure. Analysis of all of the NOEs in Tmod11-92 shows it has little defined tertiary structure. There are no long-range interactions. Only the backbone atoms of residues 22–36 can be aligned to give a root mean square deviation of <1 Å. Fig. 5 B shows a detail of the heavy atoms of residues 22–36. As would be predicted from the sequential NOEs, there is little regular secondary structure with the exception of residues 24–35 being helical. Several residues following prolines have two sets of NOEs (see below) in slow chemical exchange with each other. The minor sets were not used for structural determinations.
FIGURE 5.

The structure of Tmod11-92. Residues 22–36 are aligned. (A) The 10 backbone structures of Tmod11-92, with lowest constraint violations, calculated from the NOE data using the program AutoStructure. (B) A detail of the heavy atoms of residues 19–37.
The number of helical residues, 12, observed via NMR is lower than would be predicted from CD measurements, 21, or the sequence, 28 (residues 15–20, 24–33, and 64–75; Cuff and Barton, 1999; Cuff et al., 2000). The discrepancy arises because optical transitions, which occur on the order of femtoseconds, can detect secondary structures that are present for short time periods, whereas NOEs characteristic of secondary structures take much longer to develop (on the order of milliseconds). For example, residues 65–75 have the sequence of an amphipathic helix, and although they do not form a stable structure, they may contribute to the helical content measured using CD. There are often discrepancies between the helical content measured by CD and by characteristic NOEs in NMR spectra in partially folded proteins with the characteristics of molten globules. For example, in a recent study of the lactalbumin molten globule (Ramboarina and Redfield, 2003) the protein was highly helical when measured by CD but no NOEs characteristic of α-helices were observed.
Mapping the TM binding site in Tmod1
NMR experiments localized the binding site for TM within residues 1–35 of Tmod1. When complexed with TM1a1-14Zip, a peptide containing the N-terminus of long TMs found in muscle and nonmuscle cells, the crosspeaks in the 1H-15N-HSQC spectra originating from residues 1–35 of Tmod11-92 were completely broadened and/or shifted at 10°C and only peaks from residues 36–92 (Fig. 3, black crosspeaks) were observed. Only a few low-intensity shifted crosspeaks originating from the 35 N-terminal residues were observed. Their HN resonances could not be assigned because there were almost no crosspeaks to them in the set of through-bond spectra used for sequential assignments. The crosspeaks from residues 36–47 were slightly shifted and broadened, but there was no significant effect on the crosspeaks of residues 48–92. Thus, the direct binding site lies within residues 1–35, although TM binding may influence the conformation of residues 36–47.
The NMR spectra of the complex were initially obtained at 10°C to maximize the structure of the Tmod fragments. To determine if the broadening of the NMR spectra at 10°C was due to slow tumbling resulting from formation of a rigid rod upon binding TM1a1-14, the temperature of the Tmod/TM complex was raised to 20°C to increase the rate of tumbling. At 20°C, ∼30 new well-dispersed peaks appeared in the 1H-15N HSQC spectrum (Fig. 6) arising from residues within the TM binding region. Only the crosspeaks from residues 20–26 could be unambiguously assigned due to low signal/noise in most of the 3D NMR spectra needed for resonance assignment and structure determination. The chemical shifts of the Cα and Hα resonances of residues 20–26 suggest that residues 20–23 do not become helical, but 24–26 remain helical upon complex formation. Residues 20–26 have positive 15N-1H HNOEs (Fig. 6, magenta crosspeaks) showing that they are ordered in the complex. In addition, many of the new unassigned crosspeaks in the HSQC spectrum are associated with positive HNOEs showing that most of the TM binding region becomes ordered upon complex formation. The resonances arising from residues 40–92, outside of the TM binding region, are only slightly displaced by raising the temperature from 10 to 20°C. The results show that the low signal/noise of the resonances in the TM binding site at 10°C is probably due to slow tumbling rather than broadening from conformational exchange of Tmod1 residues within the binding site. CBCACONH and CBCANH spectra were obtained at 750 MHz in addition to those obtained at 500 MHz, but the higher field strength did not improve the signal/noise.
FIGURE 6.

The 15N-1H HSQC spectrum of the 15N13C- Tmod11-92/14N12C-GlyTM1a1-14Zip complex at 20°C overlaid with a heteronuclear 15N-1H HNOE spectrum. The concentrations of Tmod and TM peptides were 0.9 and 1.3 mM, respectively, in 100 mM NaCl, 10 mM sodium phosphate, 10% D2O, pH 6.5, at 20°C. The HSQC spectrum is shown in blue, the positive crosspeaks in the HNOE spectrum are magenta, and the negative crosspeaks are yellow. Resonances originating from residues in the binding site become more dispersed and have positive HNOEs showing that they become structured upon binding. The minor crosspeaks following proline in the cis conformation are labeled in magenta. The crosspeaks arising from Arg, Gln, and Asp side chains are not shown.
To address the possibility that the C-terminal domain of Tmod11-92 might contain a second TM binding site, because the TM model peptides contain only the extreme N-terminal residues, we assayed the ability of Tmod138-92 to bind to TM1b1-19Zip and to full-length chicken striated muscle αα-tropomyosin (α-TM). As expected from the NMR binding results, the Tmod138-92 peptide does not bind to AcTM1b1-19Zip as measured using CD (Fig. 7 C) or native gel electrophoresis (results not shown). Tmod138-92 also has no effect on the stability of full-length chicken muscle striated α-TM (data not shown), in contrast to the effect of Tmod11-92, which increases the stability and cooperativity of folding of TM (Kostyukova et al., 2001).
FIGURE 7.

The binding of wild-type and mutated fragments of tropomodulin 1 to peptides containing the N-terminus of rat αα-tropomyosin encoded by exon 1b. Panels A, B, D, and E show the effect of complex formation on the folding of the AcTM1b1-19Zip peptide, and panel C the effect on TM1b1-19Zip, monitored by CD spectroscopy. Panel F shows native gel electrophoresis studies. (∇) Sum of the folding curves of the TM1b1-19Zip peptides and Tmod fragment alone; (•) the folding of the mixture of the TM and Tmod peptides. The data are normalized to a scale of 0–1. Mixing AcTM1b1-19Zip, with Tmod11-92 (A), or Tmod1-48 (B) increases the TM and cooperativity of folding showing complex formation. In contrast Tmod38-92 (C) and Tmod11-92 containing the mutations L27E (D) and L27G (E) have little effect on the folding. All folding studies were performed in 100 mM NaCl, 10 mM phosphate, pH 6.5. The concentrations of the TM and Tmod peptides were 10 μM except in the case of TMod39-92, where both peptides were 20 μM. (F) Native gel electrophoresis of Tmod peptides alone (lanes 1, 3, and 5) and Tmod peptides mixed with AcTM1b1-19Zip (lanes 2, 4, and 6). Lane 1 and 2 contain wild-type Tmod11-92, lanes 3 and 4 have Tmod11-92 L27 G, and lanes 5 and 6 contain Tmod11-92 L27G. Only the wild-type peptide shows the formation of a complex with the TM peptide. AcTM1b1-19Zip alone does not enter the gel.
Requirement of a coiled coil motif in Tmod11-92 for tropomyosin binding
The α-helix (residues 24–35) within the TM binding site is in a region with coiled coil propensity (Fig. 1, residues 23–38) (Lupas et al., 1991), but the lack of periodicity of the displacements of the 1HN resonances in the helical region showed that Tmod11-92 does not contain a coiled coil (Goodman and Kim, 1991). Because the CD studies showed that the helical content of Tmod11-92 increases when it binds to TM, we designed mutants to test the importance of the amphipathic coiled-coil motif for binding to TM. Leu-27 at a hydrophobic interface a position in a heptapeptide repeat was mutated to Gly, which would destabilize the α-helix (O'Neil and DeGrado, 1990), or Glu, whose charged side chain would destroy a hydrophobic coiled-coil interaction, without perturbing the α-helix. We tested binding to AcTM1b1-19Zip using native gel electrophoresis and CD (Fig. 7). Neither mutant formed a stable complex with AcTM1b1-19Zip suggesting that part of the Tmod/TM interface forms a three-chained coiled coil.
The specificity of Tmod1-TM binding is within Tmod1 residues 1–48
Studies with full-length TMs and model peptides containing the N-termini of long and short TMs, TM1a1-14Zip, and TM1b1-19Zip (Greenfield and Fowler, 2002) show that Tmod1, as well as the N-terminal fragments, Tmod11-130 and Tmod11-92, have higher affinity for short, 247-residue than long, 284-residue tropomyosins (Babcock and Fowler, 1994; Greenfield and Fowler, 2002; Kostyukova and Hitchcock-DeGregori, 2004). It was possible that the higher affinity of the Tmod11-92 peptide for the 1b peptide is influenced by the C-terminal region of the Tmod fragment, even though the C-terminal peptide, Tmod138-92 does not bind to TM. Here we show that the binding specificity resides within residues 1–48. Fig. 8 shows the temperature-induced unfolding of AcTM1a1-14Zip and AcTM1b1-19Zip in the absence or presence of Tmod11-48. In the absence of the Tmod fragment the two TM peptides had similar enthalpies of unfolding, 31.5 and 31.9 Kcal/mol, respectively. The unfolding and refolding of the TMZip peptides and the Tmod1-92/TMZip complexes were completely reversible. Mixing with Tmod11-48 increased the TMs of unfolding by 12.0 and 12.6°C, respectively. The enthalpies of unfolding of the complexes were 47.7 and 73.8 Kcal/mol, respectively. The higher TM and enthalpy of unfolding of the 1b complex than the 1a complex reflect tighter binding (reviewed in Greenfield, 2004a,b) showing that the binding specificities for the tropomyosin isoforms is a property of residues 1–48.
FIGURE 8.

Circular dichroism at 222 nm of Tmod11-48, with peptides containing the N-termini of tropomyosins encoded by exon 1a, AcTM1a1-14Zip (A) and exon 1b, AcTM1b1-19Zip (B) and their mixtures as a function of temperature. (∇) AcTM1a1-14Zip or AcTM1b1-19Zip, (•) Tmod11-48, (⋄) addition of the curves of the unbound TM and Tmod peptides, (▪) mixture of the TM and Tmod peptides. The concentration of Tmod11-48 was 10 μM and the concentration of the TM peptides were each 5 μM. All peptides were in 100 mM NaCl, 10 mM sodium phosphate, pH 6.5.
The localization of the binding sites for both long and short TMs to residues 1–48 of Tmod1, and more specifically to residues 1–35 based on the NMR study, contradicts earlier studies that mapped the binding site of short TMs to residues 90–184 or residues 39–139 (Sung et al., 1992) of Tmod1 and of long TMs to residues 6–94 (Babcock and Fowler, 1994). Although we cannot fully explain the discrepancies, the earlier studies measured binding of 125I-TM to immobilized Tmod on a nitrocellulose membrane. In our hands, 125I-TM was not an optimal ligand. Degradation of TM was evident within days of labeling with 125I and after six weeks no full-length 125I-TM remained when examined by gel electrophoresis. Here, and in previous studies from our laboratories, three independent, direct methods (native gel electrophoresis, CD, and NMR) have given consistent results. Most relevant, the broadening of NMR spectra is a well-established method for showing that residues are in a binding site, especially when broadening is confined to specific regions of the molecule, as it is here.
The flexibility of Tmod11-92
Analysis of the “through bond” NMR spectra used to assign the backbone resonances (see Materials and Methods) showed that the N- and C-terminal halves of Tmod11-92 have different dynamics. In this class of spectra crosspeaks may be broadened by transverse relaxation (also called spin-spin or T2 relaxation) if a protein or a region of a protein has a large radius of gyration and tumbles slowly, or by exchange broadening if residues switch between multiple conformations. Proline-39, conserved in all Tmods and related proteins (Fig. 1), defines a boundary between two domains in Tmod11-92: the TM binding site and the region required for TM-dependent capping of the actin filament. The residues preceding P39 contain the only helical region, residues 24–35, and most of the residues with interresidue NOEs (Fig. 4 B). Residues in this region have through-bond crosspeaks with relatively low intensities (Fig. 9). In contrast, most of the crosspeaks to Hα, Cα, and Cβ resonances originating from residues 40–92 in the through-bond spectra are sharp and ∼3–4 times more intense than those from residues preceding P39, suggesting that the C-terminal region is more flexible and disordered than the N-terminal end of Tmod11-92.
FIGURE 9.

The intensities of the Cα-HN crosspeaks in the HN(CO)CA spectrum of Tmod11-92 relative to the average intensities. The crosspeaks from the residues preceding P39 have ∼25% of the intensity of the residues following P39 suggesting that the C-terminal region is more flexible than the N-terminal region. Crosspeaks to proline residues, which do not have a HN residue, are missing from the graph, as are crosspeaks that were not resolved in the spectrum.
An unusual feature of the structure of the domain following P39 is that four of the prolines exhibited cis/trans isomerization, adding to conformational flexibility. There were two sets of crosspeaks following P58 (T59 and G60) and P61 (F62, K63, R64, and E65) showing that these prolines have at least two conformations in slow exchange with each other. The minor (lower intensity) peaks following the prolines are labeled in magenta in Fig. 3. There were also two sets of crosspeaks for D40 following P39, and A46 following P45, but the minor peaks were visualized only at low-intensity thresholds. Analysis of the chemical shifts of the α-and β-carbon atom sequential peaks from P58 to the T59 HN and P61 to the F62 HN indicate that the higher intensity peaks originate from residues following trans prolines. The preferred trans proline state favors an elongated conformation, consistent with the x-ray scattering results (Fujisawa et al., 2001).
The spectra of the Tmod11-92/TM1a1-14Zip complex at 20°C give additional information about the structure and dynamics of the C-terminal domain of the Tmod1 peptide. Fig. 6 shows the 15N-1H HSQC spectrum overlaid with a heteronuclear 15N-1H HNOE spectrum (Li and Montelione, 1994b). The crosspeaks of residues 40–92 from Tmod in the complex had high intensities in the through-bond spectra that were used for sequential assignments, and the HN resonances in this region were all assigned. Residues 40–54 have positive 1H-15N-HNOEs showing they are ordered in the complex whereas residues 40–48 are disordered in the unbound Tmod11-92, indicating they become more ordered when TM binds. Residues 65–72 are also ordered, based on their positive HNOEs. These residues, which are not affected by TM1a1-14Zip binding, have lower than average intensities in the through-bond spectra of the uncomplexed peptide (e.g., see Fig. 9) suggesting there may be conformational exchange of these residues between ordered and less-ordered conformations. Residues 79–92, nearly identical in the vertebrate Tmods, are flexible, displaying negative HNOEs.
Relationship of the structure to tropomodulin family sequence homologies
To consider whether the structural domains and TM binding site we have identified within Tmod11-92 are conserved in other members of the tropomodulin family, we compared their sequences to the first 92 residues of chicken Tmod1 in Fig. 1. We aligned the sequences encoded by representatives of four Tmod genes (Tmod1–Tmod4) found throughout vertebrates, three invertebrate homologs, and three mammalian leiomodin (Lmod) genes whose functions are unknown (Conley, 2001; Conley et al., 2001).
Although the extreme N-termini are variable, all of the Tmod sequences can be aligned with chicken Tmod1 starting at residue L7 and with the Lmods starting at residue D14. The pattern of hydrophobic and hydrophilic residues in the Tmods, corresponding to residues 7–34 in chicken Tmod1, is almost completely conserved suggesting that they have similar folds. This pattern is also substantially conserved in the Lmods. There are, however, significant sequence differences among vertebrate Tmod isoforms that may be responsible for the affinity differences of Tmod isoforms for TM isoforms (Greenfield and Fowler, 2002).
The region containing residues 39–70, following the TM binding domain, is the most conserved among Tmods and Lmods: P39, P45, K56, G60, and R64 are identical throughout and another six residues are highly homologous (same charge and hydrophobicity). Residues 55–62, containing the conserved T59 and G60, are flexible as evidenced by the negative HNOEs of the residues in this region and the cis/trans isomerization of P58 and P61. The conformational dynamics of this conserved region may be important for binding to actin with TM. Residues 71–92 are highly conserved among the vertebrate Tmods (17 conserved residues), but less well conserved with the invertebrate sequences (seven conserved residues) and not conserved with the Lmods. Residues 67–75 in the Tmods have an amphipathic helix-like sequence, often implicated in protein-protein interactions. This region is not helical in Tmod11-92 in the presence or absence of TM, although it may become helical when Tmod is bound to actin.
CONCLUSIONS
NMR studies have shown that the N-terminal 92-residue peptide of Tmod1 that binds TM and caps actin filaments is mainly disordered, with one short helical region, residues 24–35. This helical region forms part of the TM binding domain, residues 1–35, that becomes more ordered when TM is bound. Mutagenesis experiments suggest the helical region forms a three-chained coiled coil upon binding to TM. A conserved proline (P39) marks the boundary between the TM binding region and an actin capping region. Residues 55–62 are highly conserved and flexible. The flexibility may be necessary for proper positioning of the capping regions on actin.
Acknowledgments
We thank Dr. Thomas Palm, Sarah Graboski, and Padma Damera for preparation of the TM peptides, Brian Rapp for assistance in the preparation of the Tmod1 mutant peptides, Dr. G. T. V. Swapna for expert collection of the NMR spectra, and Dr. Yuanpeng Janet Huang for assistance with the AutoStructure program. We also thank Dr. Gaetano Montelione for support and encouragement.
This work was funded by a Grant-In-Aid from the American Heart Association Heritage Affiliate to N.J.G. (0256468T), and by grants from the National Institutes of Health to S.E.H-D. (GM63257) and to S.E.H-D. and N.J.G. (GM36326).
References
- Adams, M. D., S. E. Celniker, R. A. Holt, C. A. Evans, J. D. Gocayne, P. G. Amanatides, S. E. Scherer, P. W. Li, R. A. Hoskins, R. F. Galle, R. A. George, S. E. Lewis, et al. 2000. The genome sequence of Drosophila melanogaster. Science. 287:2185–2195. [DOI] [PubMed] [Google Scholar]
- Almenar-Queralt, A., A. Lee, C. A. Conley, L. Ribas de Pouplana, and V. M. Fowler. 1999. Identification of a novel tropomodulin isoform, skeletal tropomodulin, that caps actin filament pointed ends in fast skeletal muscle. J. Biol. Chem. 274:28466–28475 [published erratum appears in J. Biol. Chem. 275:13164]. [DOI] [PubMed] [Google Scholar]
- Babcock, G. G., and V. M. Fowler. 1994. Isoform-specific interaction of tropomodulin with skeletal muscle and erythrocyte tropomyosins. J. Biol. Chem. 269:27510–27518. [PubMed] [Google Scholar]
- Bax, A., G. M. Clore, and A. M. Gronenborn. 1990. 1H-1H correlation via isotropic mixing of 13C magnetization, a new three-dimensional approach for assigning 1H and 13C spectra of 13C enriched proteins. J. Magn. Reson. 88:425–431. [Google Scholar]
- Bodenhausen, G., and D. J. Ruben. 1980. Natural abundance nitrogen-15 NMR by enhanced heteronuclear spectroscopy. Chem. Phys. Lett. 69:185–189. [Google Scholar]
- Bohm, G., R. Muhr, and R. Jaenicke. 1992. Quantitative analysis of protein far UV circular dichroism spectra by neural networks. Protein Eng. 5:191–195. [DOI] [PubMed] [Google Scholar]
- Boucher, W., E. D. Laue, S. L. Campbell-Burk, and P. J. Domaille. 1991. Four dimensional heteronuclear triple resonance NMR methods for the assignment of backbone nuclei in proteins. J. Am. Chem. Soc. 114:2262–2264. [Google Scholar]
- Brahms, S., and J. Brahms. 1980. Determination of protein secondary structure in solution by vacuum ultraviolet circular dichroism. J. Mol. Biol. 138:149–178. [DOI] [PubMed] [Google Scholar]
- Conley, C. A. 2001. Leiomodin and tropomodulin in smooth muscle. Am. J. Physiol. Cell Physiol. 280:C1645–C1656. [DOI] [PubMed] [Google Scholar]
- Conley, C. A., A. Almenar-Queralt, and V. M. Fowler. 1998. Identifying novel tropomodulin isoforms. Mol. Biol. Cell. 9,:18A [Google Scholar]
- Conley, C. A., K. L. Fritz-Six, A. Almenar-Queralt, and V. M. Fowler. 2001. Leiomodins: larger members of the tropomodulin (tmod) gene family. Genomics. 73:127–139. [DOI] [PubMed] [Google Scholar]
- Cooper, J. A., and D. A. Schafer. 2000. Control of actin assembly and disassembly at filament ends. Curr. Opin. Cell Biol. 12:97–103. [DOI] [PubMed] [Google Scholar]
- Cox, P. R., and H. Y. Zoghbi. 2000. Sequencing, expression analysis, and mapping of three unique human tropomodulin genes and their mouse orthologs. Genomics. 63:97–107. [DOI] [PubMed] [Google Scholar]
- Cuff, J. A., and G. J. Barton. 1999. Evaluation and improvement of multiple sequence methods for protein secondary structure prediction. Proteins. 34:508–519. [DOI] [PubMed] [Google Scholar]
- Cuff, J. A., E. Birney, M. E. Clamp, and G. J. Barton. 2000. ProtEST: protein multiple sequence alignments from expressed sequence tags. Bioinformatics. 16:111–116. [DOI] [PubMed] [Google Scholar]
- Delaglio, F., S. Grzesiek, G. W. Vuister, G. Zhu, J. Pfeifer, and A. Bax. 1995. NMRPipe: a multidimensional spectral processing system based on UNIX pipes. J. Biomol. NMR. 6:277–293. [DOI] [PubMed] [Google Scholar]
- Driscoll, P. C., G. M. Clore, D. Marion, P. T. Wingfield, and A. M. Gronenborn. 1990. Complete resonance assignment for the polypeptide backbone of interleukin 1 using three-dimensional heteronuclear NMR spectroscopy. Biochemistry. 29:3542–3556. [DOI] [PubMed] [Google Scholar]
- Edelhoch, H. 1967. Spectroscopic determination of tryptophan and tyrosine in proteins. Biochemistry. 6:1948–1954. [DOI] [PubMed] [Google Scholar]
- Fasman, G. D. 1989. Practical Handbook of Biochemistry and Molecular Biology. CRC Press, Baton Raton, FL.
- Feng, W., C. B. Rios, and G. T. Montelione. 1996. Phase labeling of C-H and C-C spin-system topologies: application in PFG-HACANH and PFG-HACA(CO)NH triple-resonance experiments for determining backbone resonance assignments in proteins. J. Biomol. NMR. 8:98–104. [DOI] [PubMed] [Google Scholar]
- Fischer, R. S., and V. M. Fowler. 2003. Tropomodulins: life at the slow end. Trends Cell Biol. 13:593–601. [DOI] [PubMed] [Google Scholar]
- Fischer, R. S., K. L. Fritz-Six, and V. M. Fowler. 2003a. Pointed-end capping by tropomodulin3 negatively regulates endothelial cell motility. J. Cell Biol. 161:371–380. [DOI] [PMC free article] [PubMed] [Google Scholar]
- Fischer, R. S., A. Lee, and V. M. Fowler. 2000. Tropomodulin and tropomyosin mediate lens cell actin cytoskeleton reorganization in vitro. Invest. Ophthalmol. Vis. Sci. 41:166–174. [PubMed] [Google Scholar]
- Fischer, R. S., R. A. Quinlan, and V. M. Fowler. 2003b. Tropomodulin binds to filensin intermediate filaments. FEBS Lett. 547:228–232. [DOI] [PubMed] [Google Scholar]
- Fowler, V. M. 1987. Identification and purification of a novel Mr 43,000 tropomyosin-binding protein from human erythrocyte membranes. J. Biol. Chem. 262:12792–12800. [PubMed] [Google Scholar]
- Fowler, V. M. 1990. Tropomodulin: a cytoskeletal protein that binds to the end of erythrocyte tropomyosin and inhibits tropomyosin binding to actin. J. Cell Biol. 111:471–481. [DOI] [PMC free article] [PubMed] [Google Scholar]
- Fowler, V. M. 1997. Capping actin filament growth: tropomodulin in muscle and nonmuscle cells. Soc. Gen. Physiol. Ser. 52:79–89. [PubMed] [Google Scholar]
- Fowler, V. M., and C. A. Conley. 1999. Tropomodulin. In Guidebook to the Cytoskeletal and Motor Proteins, 2nd Ed. T. E. Kreis and R. D. Vale, editors. Oxford University Press, Oxford, UK. 154–159.
- Fowler, V. M., N. J. Greenfield, and J. Moyer. 2003. Tropomodulin contains two actin filament pointed end-capping domains. J. Biol. Chem. 278:40000–40009. [DOI] [PubMed] [Google Scholar]
- Fowler, V. M., M. A. Sussmann, P. G. Miller, B. E. Flucher, and M. P. Daniels. 1993. Tropomodulin is associated with the free (pointed) ends of the thin filaments in rat skeletal muscle. J. Cell Biol. 120:411–420. [DOI] [PMC free article] [PubMed] [Google Scholar]
- Fujisawa, T., A. Kostyukova, and Y. Maeda. 2001. The shapes and sizes of two domains of tropomodulin, the P-end-capping protein of actin-tropomyosin. FEBS Lett. 498:67–71. [DOI] [PubMed] [Google Scholar]
- Goodman, E. M., and P. S. Kim. 1991. Periodicity of amide proton exchange rates in a coiled-coil leucine zipper peptide. Biochemistry. 30:11615–11620. [DOI] [PubMed] [Google Scholar]
- Greenfield, N., T. Palm, and S. E. Hitchcock-DeGregori. 2002a. Structure and interactions of the carboxyl terminus of striated muscle α-tropomyosin: it is important to be flexible. Biophys. J. 83:2754–2766. [DOI] [PMC free article] [PubMed] [Google Scholar]
- Greenfield, N. J. 2004a. Analysis of circular dichroism data. Methods Enzymol. 383:282–317. [DOI] [PubMed] [Google Scholar]
- Greenfield, N. J. 2004b. Circular dichroism analysis for protein-protein interactions. Methods Mol. Biol. 261:55–78. [DOI] [PubMed] [Google Scholar]
- Greenfield, N. J., and V. M. Fowler. 2002. Tropomyosin requires an intact N-terminal coiled coil to interact with tropomodulin. Biophys. J. 82:2580–2591. [DOI] [PMC free article] [PubMed] [Google Scholar]
- Greenfield, N. J., J. H. Huang, T. Palm, G. V. T. Swapna, D. Monleon, G. T. Montelione, and S. E. Hitchcock-DeGregori. 2001. Solution NMR structure and folding dynamics of the N terminus of a rat non-muscle α-tropomyosin in an engineered chimeric protein. J. Mol. Biol. 312:833–847. [DOI] [PubMed] [Google Scholar]
- Greenfield, N. J., T. Palm, and S. E. Hitchcock-DeGregori. 2002b. Structure and interactions of the carboxyl terminus of striated muscle alpha-tropomyosin: it is important to be flexible. Biophys. J. 83:2754–2766. [DOI] [PMC free article] [PubMed] [Google Scholar]
- Greenfield, N. J., G. V. Swapna, Y. Huang, T. Palm, S. Graboski, G. T. Montelione, and S. E. Hitchcock-DeGregori. 2003. The structure of the carboxyl terminus of striated alpha-tropomyosin in solution reveals an unusual parallel arrangement of interacting alpha-helices. Biochemistry. 42:614–619. [DOI] [PubMed] [Google Scholar]
- Grzesiek, S., and A. Bax. 1992a. Correlating backbone amide and side chain resonances in larger proteins by multiple relay triple resonance NMR. J. Am. Chem. Soc. 114:6291–6293. [Google Scholar]
- Grzesiek, S., and A. Bax. 1992b. An efficient experiment for sequential backbone assignment of medium-sized isotopically enriched proteins. J. Magn. Reson. 99:201–207. [Google Scholar]
- Helfman, D. M., S. Cheley, E. Kuismanen, L. A. Finn, and Y. Yamawaki-Kataoka. 1986. Nonmuscle and muscle tropomyosin isoforms are expressed from a single gene by alternative RNA splicing and polyadenylation. Mol. Cell. Biol. 6:3582–3595. [DOI] [PMC free article] [PubMed] [Google Scholar]
- Hitchcock-DeGregori, S. E., S. F. Lewis, and T. M. Chou. 1985. Tropomyosin lysine reactivities and relationship to coiled-coil structure. Biochemistry. 24:3305–3314. [DOI] [PubMed] [Google Scholar]
- Huang, Y. J., G. V. Swapna, P. K. Rajan, H. Ke, B. Xia, K. Shukla, M. Inouye, and G. T. Montelione. 2003. Solution NMR structure of ribosome-binding factor A (RbfA), a cold-shock adaptation protein from Escherichia coli. J. Mol. Biol. 327:521–536. [DOI] [PubMed] [Google Scholar]
- Ikura, M., L. E. Kay, and A. Bax. 1990. A novel approach for sequential assignment of 1H, 13C, and 15N spectra of proteins: heteronuclear triple-resonance three-dimensional NMR spectroscopy. Application to calmodulin. Biochemistry. 29:4659–4667. [DOI] [PubMed] [Google Scholar]
- Kay, L. E., M. Ikura, and A. Bax. 1990. Proton proton correlation via carbon-carbon couplings. A three dimensional NMR approach for the assignment of aliphatic resonances in proteins labeled with C-13. J. Am. Chem. Soc. 112:888–889. [Google Scholar]
- Kay, L. E., P. Keifer, and T. Saarinen. 1992. Pure absorption gradient enhanced heteronuclear single quantum correlation spectroscopy with improved sensitivity. J. Am. Chem. Soc. 114:10663–10665. [Google Scholar]
- Kay, L. E., D. A. Torchia, and A. Bax. 1989. Backbone dynamics of proteins as studied by 15N inverse detected heteronuclear NMR spectroscopy: application to staphylococcal nuclease. Biochemistry. 28:8972–8979. [DOI] [PubMed] [Google Scholar]
- Klein, S. L., R. L. Strausberg, L. Wagner, J. Pontius, S. W. Clifton, and P. Richardson. 2002. Genetic and genomic tools for Xenopus research: the NIH Xenopus initiative. Dev. Dyn. 225:384–391. [DOI] [PubMed] [Google Scholar]
- Kobe, B., and J. Deisenhofer. 1994. The leucine-rich repeat: a versatile binding motif. Trends Biochem. Sci. 19:415–421. [DOI] [PubMed] [Google Scholar]
- Kostyukova, A., K. Maeda, E. Yamauchi, I. Krieger, and Y. Maeda. 2000. Domain structure of tropomodulin: distinct properties of the N-terminal and C-terminal halves. Eur. J. Biochem. 267:6470–6475. [DOI] [PubMed] [Google Scholar]
- Kostyukova, A. S., and S. E. Hitchcock-DeGregori. 2004. Effect of the structure of the N terminus of tropomyosin on tropomodulin function. J. Biol. Chem. 279:5066–5071. [DOI] [PubMed] [Google Scholar]
- Kostyukova, A. S., E. I. Tiktopulo, and Y. Maeda. 2001. Folding properties of functional domains of tropomodulin. Biophys. J. 81:345–351. [DOI] [PMC free article] [PubMed] [Google Scholar]
- Krieger, I., A. Kostyukova, A. Yamashita, Y. Nitanai, and Y. Maeda. 2002. Crystal structure of the C-terminal half of tropomodulin and structural basis of actin filament pointed-end capping. Biophys. J. 83:2716–2725. [DOI] [PMC free article] [PubMed] [Google Scholar]
- Laemmli, U. K. 1970. Cleavage of structural proteins during the assembly of the head of bacteriophage T4. Nature. 227:680–685. [DOI] [PubMed] [Google Scholar]
- Landschulz, W. H., P. F. Johnson, and S. L. McKnight. 1988. The leucine zipper: a hypothetical structure common to a new class of DNA binding proteins. Science. 240:1759–1764. [DOI] [PubMed] [Google Scholar]
- Li, Y. C., and G. T. Montelione. 1994a. Overcoming solvent saturation-transfer artifacts in protein NMR at neutral pH. Application of pulsed field gradients in measurements of 1H–15N Overhauser effects. J. Magn. Reson. B. 105:45–51. [DOI] [PubMed] [Google Scholar]
- Li, Y. C., and G. T. Montelione. 1994b. Overcoming solvent saturation-transfer artifacts in protein NMR at neutral pH. Application of pulsed field gradients in measurements of 1H-15N Overhauser effects. J. Magn. Reson. B. 105:45–51. [DOI] [PubMed] [Google Scholar]
- Li, Y. C., and G. T. Montelione. 1995. Human type-alpha transforming growth factor undergoes slow conformational exchange between multiple backbone conformations as characterized by nitrogen-15 relaxation measurements. Biochemistry. 34:2408–2423. [DOI] [PubMed] [Google Scholar]
- Lupas, A., M. Van Dyke, and J. Stock. 1991. Predicting coiled coils from protein sequences. Science. 252:1162–1164. [DOI] [PubMed] [Google Scholar]
- McElhinny, A. S., B. Kolmerer, V. M. Fowler, S. Labeit, and C. C. Gregorio. 2001. The N-terminal end of nebulin interacts with tropomodulin at the pointed ends of the thin filaments. J. Biol. Chem. 276:583–592. [DOI] [PubMed] [Google Scholar]
- Montelione, G. T., and G. Wagner. 1990. Conformation-independent sequential NMR connections in isotope-enriched polypeptides by 1H-13C-15N triple-resonance experiments. J. Magn. Reson. 87:183–188. [Google Scholar]
- Moseley, H. N., and G. T. Montelione. 1999. Automated analysis of NMR assignments and structures for proteins. Curr. Opin. Struct. Biol. 9:635–642. [DOI] [PubMed] [Google Scholar]
- Mudry, R. E., C. N. Perry, M. Richards, V. M. Fowler, and C. C. Gregorio. 2003. The interaction of tropomodulin with tropomyosin stabilizes thin filaments in cardiac myocytes. J. Cell Biol. 162:1057–1068. [DOI] [PMC free article] [PubMed] [Google Scholar]
- Okazaki, Y., M. Furuno, T. Kasukawa, J. Adachi, H. Bono, S. Kondo, I. Nikaido, N. Osato, R. Saito, H. Suzuki, I. Yamanaka, H. Kiyosawa, et al. 2002. Analysis of the mouse transcriptome based on functional annotation of 60,770 full-length cDNAs. Nature. 420:563–573. [DOI] [PubMed] [Google Scholar]
- O'Neil, K. T., and W. F. DeGrado. 1990. A thermodynamic scale for the helix-forming tendencies of the commonly occurring amino acids. Science. 250:646–651. [DOI] [PubMed] [Google Scholar]
- Palm, T., N. J. Greenfield, and S. E. Hitchcock-DeGregori. 2003. Tropomyosin ends determine the stability and functionality of overlap and troponin T complexes. Biophys. J. 84:3181–3189. [DOI] [PMC free article] [PubMed] [Google Scholar]
- Panchal, S. C., N. S. Bhavesh, and R. V. Hosur. 2001. Improved 3D triple resonance experiments, HNN and HN(C)N, for HN and 15N sequential correlations in (13C, 15N) labeled proteins: application to unfolded proteins. J. Biomol. NMR. 20:135–147. [DOI] [PubMed] [Google Scholar]
- Pascal, S. M., D. R. Muhandiram, T. Yamazaki, J. D. Forman-Kay, and L. E. Kay. 1994. Simultaneous acquisition of 15N- and 13C-edited NOE spectra of proteins dissolved in H2O. J. Magn. Reson. B. 103:197–201. [Google Scholar]
- Perczel, A., K. Park, and G. D. Fasman. 1992. Analysis of the circular dichroism spectrum of proteins using the convex constraint algorithm: a practical guide. Anal. Biochem. 203:83–93. [DOI] [PubMed] [Google Scholar]
- Pollard, T. D., L. Blanchoin, and R. D. Mullins. 2000. Molecular mechanisms controlling actin filament dynamics in nonmuscle cells. Annu. Rev. Biophys. Biomol. Struct. 29:545–576. [DOI] [PubMed] [Google Scholar]
- Pollard, T. D., and G. G. Borisy. 2003. Cellular motility driven by assembly and disassembly of actin filaments. Cell. 112:453–465. [DOI] [PubMed] [Google Scholar]
- Ramboarina, S., and C. Redfield. 2003. Structural characterisation of the human alpha-lactalbumin molten globule at high temperature. J. Mol. Biol. 330:1177–1188. [DOI] [PubMed] [Google Scholar]
- Rios, C. B., W. Feng, M. Tashiro, Z. Shang, and G. T. Montelione. 1996. Phase labeling of C-H and C-C spin-system topologies: application in constant-time PFG-CBCA(CO)NH experiments for discriminating amino acid spin-system types. J. Biomol. NMR. 8:345–350. [DOI] [PubMed] [Google Scholar]
- Sreerama, N., and R. W. Woody. 1994. Poly(pro)II helices in globular proteins: identification and circular dichroic analysis. Biochemistry. 33:10022–10025. [DOI] [PubMed] [Google Scholar]
- Strausberg, R. L., E. A. Feingold, L. H. Grouse, J. G. Derge, R. D. Klausner, F. S. Collins, L. Wagner, C. M. Shenmen, G. D. Schuler, S. F. Altschul, B. Zeeberg, K. H. Buetow, et al. 2002. Generation and initial analysis of more than 15,000 full-length human and mouse cDNA sequences. Proc. Natl. Acad. Sci. USA. 99:16899–16903. [DOI] [PMC free article] [PubMed] [Google Scholar]
- Sung, L. A., V. M. Fowler, K. Lambert, M. A. Sussman, D. Karr, and S. Chien. 1992. Molecular cloning and characterization of human fetal liver tropomodulin. A tropomyosin-binding protein. J. Biol. Chem. 267:2616–2621. [PubMed] [Google Scholar]
- Sussman, M. A., and V. M. Fowler. 1992. Tropomodulin binding to tropomyosins. Isoform-specific differences in affinity and stoichiometry. Eur. J. Biochem. 205:355–362. [DOI] [PubMed] [Google Scholar]
- Sussman, M. A., S. Sakhi, G. Tocco, I. Najm, M. Baudry, L. Kedes, and S. S. Schreiber. 1994. Neural tropomodulin: developmental expression and effect of seizure activity. Brain Res. Dev. Brain Res. 80:45–53. [DOI] [PubMed] [Google Scholar]
- Ursitti, J. A., and V. M. Fowler. 1994. Immunolocalization of tropomodulin, tropomyosin and actin in spread human erythrocyte skeletons. J. Cell Sci. 107:1633–1639. [DOI] [PubMed] [Google Scholar]
- Wang, Y., and O. Jardetzky. 2002. Probability-based protein secondary structure identification using combined NMR chemical-shift data. Protein Sci. 11:852–861. [DOI] [PMC free article] [PubMed] [Google Scholar]
- Watakabe, A., R. Kobayashi, and D. M. Helfman. 1996. N-tropomodulin: a novel isoform of tropomodulin identified as the major binding protein to brain tropomyosin. J. Cell Sci. 109:2299–2310. [DOI] [PubMed] [Google Scholar]
- Weber, A., C. R. Pennise, G. G. Babcock, and V. M. Fowler. 1994. Tropomodulin caps the pointed ends of actin filaments. J. Cell Biol. 127:1627–1635. [DOI] [PMC free article] [PubMed] [Google Scholar]
- Weber, A., C. R. Pennise, and V. M. Fowler. 1999. Tropomodulin increases the critical concentration of barbed end-capped actin filaments by converting ADP.P(i)-actin to ADP-actin at all pointed filament ends. J. Biol. Chem. 274:34637–34645. [DOI] [PubMed] [Google Scholar]
- Wilson, R. 1998. Genome sequence of the nematode C. elegans: a platform for investigating biology. The C. elegans sequencing consortium. Science. 282:2012–2018. [DOI] [PubMed] [Google Scholar]
- Wishart, D. S., and B. D. Sykes. 1994. The 13C chemical-shift index: a simple method for the identification of protein secondary structure using 13C chemical-shift data. J. Biomol. NMR. 4:171–180. [DOI] [PubMed] [Google Scholar]
- Wishart, D. S., B. D. Sykes, and F. M. Richards. 1992. The chemical shift index: a fast and simple method for the assignment of protein secondary structure through NMR spectroscopy. Biochemistry. 31:1647–1651. [DOI] [PubMed] [Google Scholar]
- Wüthrich, K. 1986. NMR of Proteins and Nucleic Acids. John Wiley & Sons, New York.
- Zheng, D., Y. J. Huang, H. N. Moseley, R. Xiao, J. Aramini, G. V. Swapna, and G. T. Montelione. 2003. Automated protein fold determination using a minimal NMR constraint strategy. Protein Sci. 12:1232–1246. [DOI] [PMC free article] [PubMed] [Google Scholar]