

Abstract
The structure of polyamines-DNA precipitates was studied by x-ray diffraction. Precise measurements of the interhelix distance aH were obtained at different NaCl, polyamine, and DNA concentrations. Most of the results were obtained using spermine and few others using spermidine. The precipitates are liquid crystalline, either hexagonal and/or cholesteric, with an interhelical spacing that depends on the ionic concentrations and on the polyamine type. In our experimental conditions, the spacing varies from 28.15 to 33.4 Å. This variation is interpreted in terms of different ionic components that are present inside the precipitates and that are thought to regulate the value of the cohesive energy of DNA. These results are discussed in relation to the biological processes requiring a closeness of double helices and to the role played by polyamine analogs in cancer therapy.
INTRODUCTION
Polyamines are ubiquitous small polycations with multiple functions in the cell growth and differentiation (Cohen, 1998; Tabor and Tabor, 1984). Because of their positive charges, putrescine (2+), spermidine (3+), and spermine (4+) show a high affinity with the acidic constituents of the cell (RNA, DNA, ATP, acidic proteins, phospholipids, etc.). Most of the intracellular polyamines are thought to be sequestered and “bound” to these cell constituents (Rubin, 1977; Davis et al., 1992; Watanabe et al., 1991). The pool of “free” polyamines would show rapid fluctuations in response to intracellular signals (Veress et al., 2000). Actually normal cells maintain the polyamine concentrations within narrow ranges by synthesis, catabolism, and transport that are regulated by hormones, growth factors, and feedback mechanisms. These intracellular concentrations that depend on the polyamine type, are estimated to be in the millimolar range (0.1–2 mM in mammalian cells, ∼7 mM in Neurospora crassa) (Davis et al., 1992; Watanabe et al., 1991). Polyamine depletion as well as overproduction can lead to cell death (Thomas and Thomas, 2001). In cancer cells, however, the level of polyamines is significantly increased. As reported by Thomas et al. (2002), a cyclic process of increased polyamine synthesis and cancer cell growth appears to be sustained because high polyamine concentrations facilitate transcription of growth-related genes. To interfere with these cellular functions of natural polyamines, polyamine analogs have been designed and developed as therapeutic agents (for a review, see Thomas et al., 2002). All these studies display the essential role played by polyamines in the cell life, but little is known on the mechanism used by the polyamines to control the activity of the genome (Childs et al., 2003).
In solution, it has been shown that polyamines stabilize the double-stranded DNA helix (Tabor, 1962) and may induce changes in its conformation (B–Z transition) (Behe and Felsenfeld, 1981). Polyamines also induce the collapse of isolated long DNA chains from dilute solutions with formation of toroids (Gosule and Schellman, 1976; Lambert et al., 2000; Bloomfield, 1996) showing a local hexagonal packing of DNA (Hud and Downing, 2001). Multimolecular aggregates form using shorter DNA fragments of higher initial DNA concentration (Osland and Kleppe, 1977; Damaschun et al., 1978; Schellman and Parthasarathy, 1984). Later on, it was shown, using short DNA fragment, 146-bp long, that the aggregate is liquid crystalline, either cholesteric or hexagonal when the precipitation is induced by spermidine (Sikorav et al., 1994; Pelta et al., 1996a,b) or by spermine (Pelta et al., 1996a), and the authors hypothesized that this state, combining ordering and fluidity of condensed DNA may be of biological interest. X-ray diffraction analyses have been performed on these aggregates. In hexagonally packed DNA aggregates formed with spermine, a distance of 29.1 Å was found by Suwalsky et al. (1969). In aggregates formed with spermidine, Rau and Parsegian (1992) measured a distance of 29.75 Å, and Schellman and Parthasarathy (1984) obtained values comprised between 29.4 and 29.55 Å. Interestingly, two ranges of interhelix distances were found in spermidine-DNA aggregates: 31.6–32.6 Å in the cholesteric phase, 29.85 ± 0.05 Å in the hexagonal phase (Pelta et al., 1996a). Intermediate values were not obtained by changing the spermidine and sodium chloride concentrations. Instead, it was the relative amount of both phases that was modulated in the biphasic samples. We suspect that this variety of measured values comes either from metastability effects (Becker et al., 1979) or from differences in experimental conditions.
In an earlier work, we determined the concentration conditions required to induce the precipitation and resolubilization of DNA by spermine and reported these experimental data into a phase diagram (Raspaud et al., 1998). These conditions were also analyzed according to a model, developed by Olvera de la Cruz et al. (1995), which is based on an electrostatic bridging. Here, our aim is to investigate the local structure of the dense DNA precipitates and to focus on the DNA-DNA interactions mediated by cationic species. We want to know whether the interhelix distances measured in the precipitate vary with the location in the phase diagram. In the experiments presented here, the amount of monovalent and multivalent ions was precisely controlled, as well as the method of preparation of the samples. A systematic analysis was performed with spermine and a few experimental points with spermidine. We show that the type and amount of polyamines together with the concentration of monovalent salt determine the structural parameters of the precipitate and how the cohesive energy between DNA helices is related to these distances.
MATERIAL AND METHODS
Material
Mononucleosomal DNA of ∼146 bp were extracted from calf thymus according to the method described in Strzelecka and Rill (1987). A small but not quantified percentage of dinucleosomal DNA was also detected in polyacrylamide gel electrophoresis. Some experiments were done with λ-DNA (48,500 bp) (Invitrogen, Carlsbad, CA). We used spermine 4HCl and spermidine 3HCl (Fluka, Milwaukee, MI).
The DNA samples were prepared following two distinct methods to control the valence of the initial DNA counterions. In the first method, DNA was extensively dialyzed against 2 M NaCl and then against TE buffer (10 mM Tris HCl, 1 mM EDTA). In this DNA salt that we denote “Na-DNA”, all counterions are monovalent (mostly Na+, with some Tris+). In the second method, Na-DNA was first extensively dialyzed against a reservoir of 1 mM spermine 4HCl in distilled water at 4°C. An aggregation of DNA occurs inside the dialysis bag. Part of the sample (precipitate and supernatant) was taken off, weighted, and mixed with an appropriate volume of a solution of spermine concentrated in water to obtain a final 150 mM spermine concentration. DNA was redissolved at this high spermine concentration. A unique homogeneous phase was obtained and the DNA concentration was determined by measuring the absorbance at 260 nm. We denote this DNA salt “spermine-DNA.”
In the following, the DNA concentration CDNA defines the total DNA phosphate concentration in the whole sample (precipitate plus supernatant). We recall that a concentration of 1 mg/ml DNA corresponds to 3 mM DNA phosphate. The spermine concentration Cspermine corresponds to the concentration of the spermine chloride “added salt” in the whole sample (each spermine cation comes with 4 Cl− anions). It does not include the concentration of spermine counterions associated with the spermine-DNA salt. In the same way, the monovalent salt concentration CNaCl does not include the Na+ counterions coming with Na-DNA samples and that neutralize the DNA phosphate charges.
Choice and preparation of the samples
X-ray diffraction experiments were done on more than 100 samples prepared under conditions for which an aggregation of DNA occurred in the solution. These conditions were studied in an earlier work (Raspaud et al., 1998). Data were collected with 146 bp Na-DNA fragments in the presence of 13 mM monovalent salt (coming from the 10 mM TE buffer). Spermine chloride salt (4+) was diluted in the same buffer and added to DNA to reach various final concentrations. A schematic representation of this phase diagram is given on Fig. 1. For spermine concentrations below the concentration Cprecip., all DNA fragments are soluble; a single phase exists. Above Cprecip., a fraction of DNA fragments aggregate and precipitate. Two phases coexist: the precipitate (dense DNA phase(s); the precipitate may be monophasic or multiphasic) and the supernatant (dilute DNA phase). The aggregation is suppressed above Credissol: all DNA fragments are soluble, and the sample is monophasic again. In the precipitation domain, limited by the Cprecip and Credissol thresholds, we explored lines 1a–1c (low DNA concentration) and lines 2 and 3 (high DNA concentration). Lines 1 and 2 correspond to fixed concentrations: CDNA = 0.6 mM (1b), CDNA = 3 mM (1c), and CDNA = 90 mM (2); a few experiments were also performed at CDNA = 0.03 mM (1a). Line 3 corresponds to a constant Cspermine/CDNA ratio equal to 1/6.
FIGURE 1.

Schematic representation of the phase diagram obtained in a previous study (Raspaud et al., 1988) for the precipitation of DNA fragments by spermine. The precipitation domain, where the dense precipitate separates from the dilute supernatant, is limited by the Cprecip and Credissol curves. In this representation, each experimental point is defined by the DNA concentration (CDNA phosphate) and the spermine salt concentration (Cspermine). Experimental points were located along five lines: (1a) CDNA = 0.03 mM; (1b) CDNA = 0.6 mM; (1c) CDNA = 3 mM; (2) CDNA = 90 mM; and (3)  at different monovalent salt concentrations. Two protocols were used to prepare the samples: 1), starting from spermine-DNA solution, water was added to dilute the sample, thus crossing the Credissol threshold, as indicated by the top arrow; and 2), starting from Na-DNA solutions, spermine was added to induce the precipitation by crossing the Cprecip threshold, as indicated by the bottom arrow. In Figs. 4–7, solid symbols refer to samples prepared from spermine-DNA (crossing the redissolution limit) and open symbols refer to samples prepared from Na-DNA (crossing the precipitation limit).
Samples were prepared either by diluting the spermine-DNA solution, i.e., by crossing down the Credissol boundary or by addition of spermine to the Na-DNA solution, i.e., by crossing up the Cprecip line. Experiments done with spermine-DNA were first performed in the absence of any monovalent salt and then with 50, 100, and 200 mM NaCl added. For experimental reasons, 13 mM monovalent salt was always present in Na-DNA samples. After mixing the different components, the samples were let to stabilize at least 15 min at room temperature. The precipitate and all its supernatant (when possible) were then introduced into the capillary 1–1.5 mm in diameter and centrifuged during a few minutes at 100 × g to help the precipitate to fall to the bottom of the capillary. Capillaries were then sealed. Each capillary contains 40–150 μg of DNA in a volume limited to 150–200 μl. For very low DNA concentrations (CDNA = 0.03 mM; line 1a), a large volume of solution was prepared to obtain a macroscopic precipitate and only a fraction of the supernatant was inserted into the capillary. This manipulation does not modify the structure of the pellet, as explained in the Results section. A few experiments were also performed with spermidine instead of spermine (using Na-DNA and exploring line 1a).
X-ray diffraction experiments
The x-ray experiments were performed using the synchrotron source DCI at Laboratoire LURE (Orsay, France) on station D43. The size of the incident beam was limited by a collimator 0.5 mm in diameter. The x-ray signals were detected by phosphor image plates that were scanned by a Molecular Dynamics PhosphoreImager (Sunnyvale, CA). The typical distance between the detector and the samples was ∼320 mm and the wavelength of the incident beam ∼1.45 Å. The wavelength λ was determined by a precalibration with a silver behenate powder (Gilles et al., 1998). Using these configurations, the accessible range of the transfer vector q = (4 π /λ) sin θ, with 2θ the scattering angle, was between 0.05 and 0.5 Å−1. Because only diffraction rings were detected for all the samples, the intensity profiles I(q) were obtained by radial integration. For some samples prepared along line 2, with spermine-DNA, some thin Bragg's spots dispersed in the rings were also observed.
Conductivity measurements
The conductivity of the spermine salt at high concentration (>1 mM) was measured using a Coulter Delsa 440 instrument (Beckman, Fullerton, CA). This instrument is more generally used to measure the electrophoretic mobility but is also convenient to determine the conductivity of ionic solutions. Three milliliters of each spermine solution was sufficient. The instrument was previously calibrated using some standard saline solutions. For the samples of low spermine salt concentration (<10 mM), we preferred to use a more classical conductivity meter (CyberScan CON 100; Eutech Instruments, Singapore).
RESULTS
Conductivity measurements
Before the structural measurements, the conductivity of the spermine chloride salt without DNA was determined for spermine concentrations ranging from 0.01 mM to 100 mM in distilled water, 200 mM NaCl, and 10 mM TE solution. To display the molar conductivity Λm of the spermine salt, the contribution of the residual salt, NaCl, and TE was simply subtracted from the conductivity data. Data, which are also divided by z = 4, are plotted in Fig. 2 as a function of κ (the inverse of the Debye screening length). This length takes into account the contribution of the different salts to the electrostatic screening. It may be written as:
 |
(1) |
with z = 4, the spermine valence. In Fig. 2 the molar conductivity is found to decrease with κ. However two different variations are observed at low and high κ values. At low κ values or equivalently at low spermine salt concentration, a steep linear decrease is observed. By extrapolation to zero concentration, the limiting molar conductivity of the spermine salt is found equal to  in Siemens cm2 mol−1. Subtracting then the known contribution of the z chloride anions (Lide, 1999), we can extract the limiting ionic conductivity of spermine4+ 77.6 × z, a value close to the tabulated data 73.5 for the monovalent cation [NH4]+ (Lide, 1999). To understand this first variation, the properties of the ionic atmosphere around each ions must be taken into account. These properties are known to be responsible for the molar conductivity decrease that is commonly observed for completely dissociated electrolytes. This effect, called relaxation and electrophoretic effect, is described by the Debye-Hückel-Onsager theory. The theory predicts for the asymmetric spermine chloride salt the following limiting molar conductivity:
 |
(2) |
where κ is expressed in Å−1 unit. The theoretical prediction, which is reported in Fig. 2, is in very good agreement with the experimental data in the left-handed side of the curve. Hence this first linear decrease is due to interionic attractive interactions and indicates that spermine is fully ionized at low concentration. In other words, the co-ions, i.e., the chloride anions, tend to surround the spermine cations or to create an “ionic atmosphere” around them.
FIGURE 2.

Molar conductivity of the spermine salt reduced by its valence (z = 4) as a function of the inverse of the Debye screening length κ. Measurements were done at 20–25°C. Spermine salt (with no DNA) was diluted in: distilled water (•),10 mM TE buffer (○), and 200 mM NaCl (▪). The contribution of the monovalent salts has been subtracted to display the molar conductivity of the spermine salt only. The straight line represents the variation predicted by the Debye-Hückel-Onsager theory in its limiting form when ions are fully dissociated.
In the right side of the curve, the molar conductivity still decreases when κ increases but with a low slope. In fact for strong electrolytes, deviation from the Debye-Hückel-Onsager prediction in its limiting form and even flattening of the molar conductivity are commonly reported at large salt concentrations. These deviations and flattening may be attributed to an effect of ion size that cannot be neglected for large κ values. In our case, a deviation without flattening is observed. This behavior—different from those reported for the classical fully dissociated electrolytes—suggests that some ion pairing could be formed in addition to the traditional “ionic atmosphere” and could be responsible for the continuous decrease of the molar conductivity.
X-ray diffraction experiments
X-ray diffraction experiments were done with 146-bp DNA fragments in the precipitation domain limited by Cprecip and Credissol, (lines 1a–c, 2, and 3) as detailed in the Material and Methods section. A typical intensity profile I(q) is presented in Fig. 3. Similar spectra were already reported (Pelta et al., 1996a) and interpreted as a hexagonal packing—schematized in Fig. 3. The first peak comes from the lateral hexagonal arrangement of the DNA fragments. If one considers the large three-dimensional unit cell described in Durand et al. (1992), the lateral interaxial spacing aH can be deduced from the position of this first peak q110 by the relation  leading to a typical spacing of the order of 29 Å. The second, less pronounced, peak does not come from the lateral hexagonal lattice but from a longitudinal order between neighboring DNA fragments. Such an order was already quantified for highly concentrated DNA without polyamines (Durand et al., 1992). As detailed in this reference, this peak is related to the helix pitch P. Its value may be extracted from the following expression:
 |
(3) |
FIGURE 3.

Typical diffraction spectrum of the dense DNA precipitate. The diffracted intensity profile has been obtained by radial integration. The first intense peak is due to the lateral hexagonal arrangement of the DNA chains in the plane perpendicular to the double-helix axis. The interaxial spacing aH between two neighboring DNA (insert) is determined from this peak position q110 via the equation aH = (2π / q110) × (2/√3). The second peak (q111) comes from a longitudinal order between the double helices. This profile was obtained from a spermine-DNA sample diluted in a 6 mM spermine salt solution.
For all spectra exhibiting this peak, the helix pitch was found equal to P = 34.9 ± 0.1 Å. This corresponds to ∼10 bp per helical turn. Although the helix pitch doesn't depend on the different concentrations, slight changes in the interhelices distances aH with the salt concentrations were observed.
Other diffraction spectra (not shown) of some samples were also attributed to a cholesteric structure. In these spectra, there exists a single peak q*. According to Durand et al. (1992), the interhelical spacing am is related in this case to the peak position q* by the equation am = 1.117 × 2π / q*.
Variation of interhelix distances
Experiments were performed for three DNA concentrations CDNA = 0.6, CDNA = 3 mM, and CDNA = 90 mM. Measurement recorded for CDNA = 0.6 and CDNA = 3 mM are presented together using the same symbols because no difference between these two DNA concentrations was detected.
Samples prepared at low DNA concentration
A first series of experiments was performed in the low DNA concentration range (CDNA = 0.6 and 3 mM) using spermine-DNA, by crossing the Credisssol boundary upon dilution. Samples of different Cspermine concentrations were prepared without monovalent salt. Another series of experiments was carried out starting from Na-DNA (CDNA = 0.03, 0.6, and 3 mM). Spermine was added to the Na-DNA solution, and aggregation occurred while crossing the Cprecip threshold. Experiments were performed with short DNA fragments and also with λ-DNA chains. The x-ray diffraction results are found independent on the method of preparation and on the DNA length (see Fig. 4). The two sets of data are also plotted as a function of the Debye screening length κ−1 in the insert of Fig. 4. For 30 ≥ κ−1 (Å) >10 or for Cspermine (mM) ≤ 10, the local spacing is found nearly constant, equal to aH = 28.15 ± 0.10 Å in the absence of monovalent salt and to 28.25 ± 0.10 Å in the presence of 13 mM monovalent ions. For lower κ−1 values or larger spermine concentrations, the double helices are progressively moved apart when the length κ−1 diminishes or when the concentration Cspermine approaches the Credissol limit. It can be noted that the κ−1 length corresponds to the scale length of electrostatic interactions in the supernatant because most of the spermine salt stand in the supernatant, because of the low DNA amount. The two axes in the insert of Fig. 4 represent, therefore, the two lengths characteristic of the two coexisting phases aH and κ−1.
FIGURE 4.

Interhelix spacings measured in samples prepared with short DNA fragments (146 pb; ○,•). Some additional experiments were done with λ-DNA (⋄). Experiments were done in the low DNA concentration range (CDNA = 0.03 mM, 0.6 mM, and 3 mM). Spacings aH are presented in a semilogarithmic plot as a function of the spermine salt concentration and as a function of the Debye screening length κ−1 in the insert. Solid and open symbols refer to samples prepared from spermine-DNA and from Na-DNA, respectively.
The two sets of data measured for low DNA concentration have been replotted using linear axes (Fig. 5 a). This graph displays the existence of a linear increase of aH with Cspermine for spermine salt concentrations larger than 10 mM. A fit of the two sets in that range gives:
 |
(4) |
FIGURE 5.
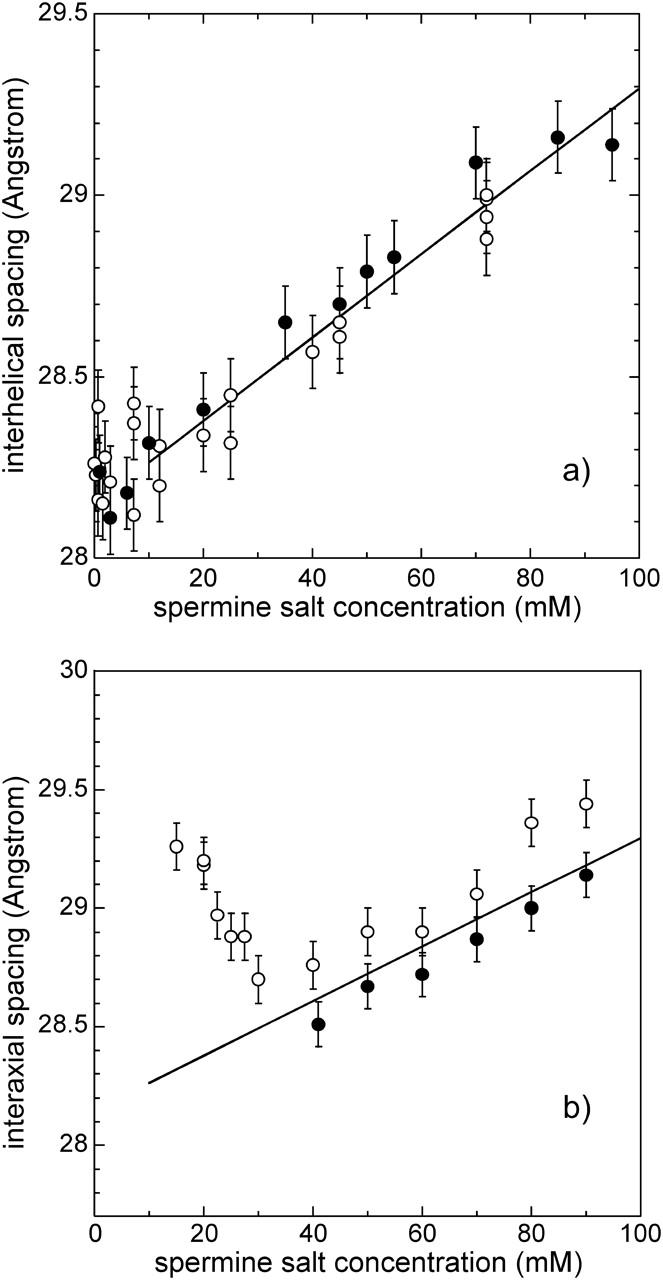
Variation of the interhelix spacing aH as a function of the spermine salt concentration for two DNA concentration ranges. Solid and open symbols refer to samples prepared from spermine-DNA and from Na-DNA, respectively. (a) In the low DNA concentration range (CDNA = 0.03 mM, 0.6 mM, and 3 mM; lines 1a–c in Fig. 1), experimental points have been fitted by a linear relationship for spermine concentrations >10 mM. (b) In the high DNA concentration range (CDNA = 90 mM; line 2 in Fig. 1), data are compared to the linear fit given in panel a.
Experiments performed at high DNA concentration
Experiments were also performed at high DNA concentrations (CDNA = 90 mM). Samples were prepared using the two methods described above. Results are presented in Fig. 5 b. Using Na-DNA, we observe that the spacing first decreases from 29.5 to 28.7 Å when the spermine concentration increases from 15 to 30 mM and further increases for Cspermine > 30 mM. Using spermine-DNA, data were collected only for Cspermine > 40 mM for experimental reasons (it was not possible to prepare stock solutions of spermine-DNA—in 150 mM spermine—of high enough DNA concentration to reach by dilution CDNA = 90 mM and Cspermine < 40 mM). Values increase progressively with the spermine concentration. For both Na-DNA and spermine-DNA, above 40 mM spermine, the interaxial spacing increases linearly with Cspermine and distances are comparable to the distances measured in the low DNA concentration range (Fig. 5 a and straight line in Fig. 5 b). Therefore, in this range, the DNA concentration has no significant effect on the local distances for these spermine-DNA samples.
For low spermine concentrations, the interhelix spacing varies differently at low and high DNA concentrations. As shown above, for low DNA concentrations, DNA spacing remains constant up to 10 mM spermine. In contrast, for high DNA concentration (CDNA = 90 mM), and using Na-DNA, DNA spacing decreases sharply from 29.3 to 28.7 Å when the spermine concentrations is raised from 17 to 30 mM. A plausible explanation of this difference would be that the monovalent counterions coming with Na-DNA cannot be neglected anymore at high DNA concentration. To replace all the monovalent counterions that neutralize the DNA phosphate charges, the spermine concentration should be equal to 90 / z = 22.5 mM. The minimal spacing is observed at 30 mM spermine, which is close to this expected value. The progressive decrease of spacing demonstrates that added multivalent cations progressively replace the monovalent counterions.
Effect of DNA concentration at a low constant spermine/DNA concentrations ratio
Using Na-DNA samples, the ratio Cspermine/Cphosphate was kept constant for DNA concentrations increasing from 90 to 270 mM phosphate. A weak ratio Cspermine/Cphosphate = 1/6 was chosen (Fig. 1, line 3). This ratio is lower than the electroneutrality condition (Cspermine/Cphosphate = 1/z = 1/4) to keep a fraction of monovalent Na ions in the precipitate. For Cphosphate = 90 mM, the spermine concentration becomes equal to 90 / 6 = 15 mM (corresponding to the smallest spermine concentration in Fig. 5). The results measured at different Cphosphate are plotted in Fig. 6. For Cspermine < 35 mM, a hexagonal packing was observed and the interaxial distance increases linearly with the spermine concentration. The data may be fitted by aH (Å) = 28.6 + 38.6 × Cspermine (M). The precipitate of the sample Cspermine = 35 mM is biphasic (hexagonal and cholesteric). The large error bar of the last sample (45 mM), which is purely cholesteric, is due to the weak recorded signal. Isotropic precipitates were also found close to this line for a higher DNA concentration (CDNA = 350 mM; Cspermine = 65 mM).
FIGURE 6.

Interaxial spacing aH between short DNA fragments as a function of the spermine salt concentration (line 3 in Fig. 1). Samples were prepared by mixing the Na-DNA solution with the spermine salt solution, both being in 10 mM TE. For these samples, the ratio between the spermine salt concentration and the total DNA phosphate concentration, scaled on the upper x axis, is set to the constant value 1/6. The dashed line indicates the discontinuous transition between the hexagonal and the cholesteric phase.
Effects of monovalent salts
Experiments using spermine-DNA were also performed in the presence of different amounts of monovalent salts: 50 and 100 mM NaCl for CDNA = 0.6 and CDNA = 3 mM; 200 mM NaCl for CDNA = 3 mM.
No effect of the DNA concentration has been detected, as shown in Fig. 7. At least for 50 and 100 mM, the variation of aH with the spermine concentration is qualitatively identical to the variation observed in the absence of NaCl, except that the value of the constant spacing observed at small spermine concentration (large screening length) increases with the addition of NaCl. One gets aH (±0.10 Å) = 28.45 Å for 50 mM, 28.75 Å for 100 mM, and 29.40 Å for 200 mM NaCl. With a further increase of the spermine concentration, the interaxial spacing increases progressively and seems to follow the evolution of the data collected in the absence of NaCl, within the error bars. We see that the distance (28.25 Å) found for 13 mM monovalent ions, using Na-DNA, fits well in this series.
FIGURE 7.

Semilogarithmic representation of the interaxial spacing aH as a function of the spermine salt concentration in the low DNA concentration range (lines 1b and 1c in Fig. 1). Experiments were performed with short fragments, except the four points that correspond to long λ-DNA molecules, as indicated in the figure. The dilution of the spermine-DNA sample was performed in distilled water (•), 50 mM NaCl (▴), 100 mM NaCl (▾), and 200 mM NaCl (▪). At each salt concentration, the constant spacing is indicated by a horizontal line. The curve corresponds to Eq. 4. The dilution of the four Na-λ DNA samples was performed in 10 mM TE (○), 10 mM TE + 40 mM NaCl (▵), 10 mM TE + 90 mM NaCl (∇), and 10 mM TE + 190 mM NaCl (□).
Other measurements were done with Na-λ DNA for several monovalent salt concentrations. The interaxial distance aH (±0.10 Å) is equal to 28.25 Å (1 mM spermine salt, 10 mM TE), 28.65 Å (1 mM spermine salt, 10 mM TE + 40 mM NaCl), 28.95 Å (2 mM spermine salt, 10 mM TE + 90 mM NaCl), and 29.30 Å (15 mM spermine salt, 10 mM TE + 190 mM NaCl). All these values are to be found in Table 1 and also shown in Fig. 7 for comparison with short DNA fragments. The values are quite comparable with short and long molecules. Thus, we see that the DNA length has no effect here.
TABLE 1.
Characteristic polyamines concentrations (Cprecip, Cmax) and interhelical spacings (aH) measured on λ-DNA at different monovalent salt concentrations
| Spermine |
Spermidine |
Cobalthexamine |
||||||||
|---|---|---|---|---|---|---|---|---|---|---|
| Monovalent salt (mM) | Cprecip (mM) | Cmax (mM) | aH (Å) | E / kT | Cprecip (mM) | Cmax (mM) | aH (Å) | E / kT | aH (Å) | E / kT |
| 2 | 0.1* | 5* | 29.65 | 0.051 | ||||||
| 0.0415† | ||||||||||
| 10 | 28.30‡ | 0.085‡ | ||||||||
| 13 | 0.007 | 2§ | 28.25 | 0.085 | 0.35 | 8 | 29.90 | 0.049 | ||
| 50 | 0.08 | 3.3* | 28.65 | 0.060 | 2.5* | 15* | 30.45 | 0.027 | ||
| 31.75¶ | ||||||||||
| 100 | 0.45 | 6.5* | 28.95 | 0.040 | 9 | 27* | 33.40¶ | 0.014 | ||
| 200 | 2.5 | 22.5 | 29.30 | 0.036 | ||||||
The relative cohesive energy per nucleotide E / kT was calculated from these concentration values according to Eq. 5 from Nguyen et al. (2000). Additional data came from references below. Cmax corresponds to the polyamine concentration required to induce the maximum precipitation of the DNA chains.
Extrapolated or interpolated data.
From Baumann et al. (2000).
From Rau and Parsegian (1992) using long DNA extracted from chicken blood.
Estimated from the electrophoretic mobility measurements (Raspaud et al., 1999).
Cholesteric phase.
Effects of polyamine valence
A few experiments were performed using spermidine and Na-λ DNA in the low DNA concentration range. Spacings were measured for monovalent salts concentrations ranging from 2 to 200 mM. Results are shown in Table 1. DNA in the precipitate forms a hexagonal lattice below 50 mM with aH values equal to 29.65 (2 mM) and 29.90 Å (13 mM). The precipitate becomes biphasic (cholesteric and hexagonal) at 50 mM NaCl (with aH = 30.45 Å and am = 31.75 Å) and fully cholesteric at 100 mM NaCl (am = 33.40 Å). Such a coexistence of the two liquid crystalline phases was already reported (Pelta et al., 1996b).
Metastability
The above experiments highlight the influence of the ionic environment on the DNA spacing in the precipitate. To go further, three samples were prepared according to a different method. Once the structural parameters of the precipitate in equilibrium with all its supernatant were determined, the supernatant was removed and replaced by solutions of different salt concentrations, directly into the capillaries. After one week of incubation without any vortexing or stirring, the expected change in the parameters was not detected. We may wonder whether the pellet is trapped in a metastable state as already suggested by Becker et al. (1979) or whether the spacing variations observed above describe different metastable states. However, as shown in the low DNA concentration range, the precipitates formed from Na-DNA and from spermine-DNA solutions, and from long and short chains, have exactly the same structural parameters. They present an identical variation of the distances with the ionic environment. This superimposition is rather in favor of reversible states. For that reason, we assume that the thermodynamic equilibrium has been reached in our experiments. We can imagine that the absence of spacing variation when the supernatant is replaced is simply due to: 1), the high local DNA density that limits the ions diffusion and exchange inside the precipitate once it is formed, and 2), the limited surface of contact between the precipitate and the supernatant in the capillary.
DISCUSSION
These measurements display unambiguously a variation of the interhelix spacing in the different parts of the precipitation domain. In the following, we will try to relate the interhelix distances in the precipitate to the location of the precipitation domain in the phase diagram. These two parameters (interhelical distances and thresholds of precipitation and of redissolution) are connected in the sense that for a classical phase separation described by a coexistence curve, the local concentration of the dense phase (the precipitate) is related to the cohesive energy of the chain whereas at the thresholds, this cohesive energy per chain becomes equal to the energy of the dissolved chain.
Spermine-DNA samples
Approach of the redissolution threshold: increase of the interhelical spacing
We observe an increase of interhelical spacing for concentrations of spermine chloride salt approaching the redissolution threshold. This increase suggests that more and more spermine and chloride ions are present inside the precipitate. This effect is observed for all DNA concentrations. The origin of such an increase is not understood yet but two hypotheses may be formulated: 1), this variation could be related to the overcharging effect predicted when chains redissolve (Nguyen et al., 2000), although this variation is not taken into consideration in this theory. Recently a reorganization of ions and an overcharging effect in excess of multivalent salt have been observed using molecular dynamics simulations (Lee et al., 2004); and 2), it could be due to a simple polyamine effect. From the conductivity experiments with no DNA, we have seen that the decrease in the molar conductivity is firstly due to interionic attractive interactions for which the chloride co-ions tend to surround the spermine cations. In addition, some of them could be dehydrated and associated to the cations. As analyzed by Solis and Olvera de la Cruz (2000) (see also Solis, 2002), the interionic attractions could change the ionic distribution along DNA when the redissolution threshold is approached. Both hypotheses could lead to an increase of the distances. To discriminate between these two effects, it would be informative to know how the distances vary with the spermine concentration in these two cases.
The expected phase diagram
The phase diagram of the “spermine-DNA” salt is not known. To estimate the extension of the precipitation domain, we may use the structural parameters measured here together with the results of a previous experimental work done with another negatively charged polymer (Olvera de la Cruz et al., 1995). This work was done in the absence of monovalent counterions but in the presence of multivalent cations. The authors found a precipitation domain delimited by two lines: a horizontal line illustrating the polymer redissolution in excess of multivalent salt and a vertical line located at high polymer concentration. Inspired from their results, we propose in Fig. 8, a schematic phase diagram for the spermine-DNA fragments. We must locate this vertical line at a DNA concentration that cannot exceed the local concentration inside the precipitate. For the DNA hexagonal lattice, the local DNA concentration can be calculated from the interaxial spacing values according to the following relation  A typical spacing aH = 28.5 Å leads to a concentration of 1.4 M. This value is chosen as the threshold value in Fig. 8. With regard to the horizontal line, the spermine redissolution concentration Credissol was not measured precisely in the absence of monovalent salt. We observed that fragments are solubilized at 150 mM spermine and Credissol = 105 ± 10 mM in 10 mM TE buffer. A compromise value of the order of 120 mM has been considered in Fig. 8. For long DNA chains, this value is rather close to 180 mM as found by Saminathan et al. (1999).
FIGURE 8.

Comparison of the experimental phase diagram determined for Na-DNA fragments in 10 mM TE buffer (open symbols) with the expected phase diagram for spermine-DNA fragments (dotted line) (double logarithmic plot).
Interestingly one may compare this spermine concentration Credissol to the local spermine concentration  in the precipitate, both being roughly independent of the total DNA concentration. Assuming
  (i.e., electroneutrality and no additional spermine chloride in the precipitate), the ratio between the two concentrations (
 ) is found of the order of 1/3. In other words, if the volume of the precipitate is neglected compared to the total volume, the spermine concentration in the supernatant required to redissolve the chains must be ∼1/3 times less than the local spermine concentration in the precipitate. Surprisingly a ratio of the order of 1/4–1/3 was also observed for the flexible poly(styrene-sulfonate) chains precipitated and redissolved by the trivalent lanthanum chloride salt (cf. Fig. 2 a in Olvera de la Cruz et al., 1995). Indeed, this estimated ratio doesn't take into account the fact that some additional chloride anions and spermine cations could be present in the precipitate as mentioned in the previous paragraph. This effect would increase the local spermine concentration
  or decrease the ratio (
 ).
).
Na-DNA samples and monovalent salt effect
In Fig. 8, we also report the phase diagram of the “Na-DNA” salt measured in a previous work (Raspaud et al., 1998). The comparison of the two diagrams highlights the predominant role of the monovalent cations in the DNA precipitation conditions and how these conditions result from a competition of condensation between mono and multivalent cations onto DNA. This effect has been recently studied by Burak et al. (2003). The presence of the initial monovalent counterions clearly reduces the domain in which DNA precipitation occurs. This shrinkage is manifest in the range of high DNA concentration whereas for the “spermine-DNA” salt, we suspect that DNA may precipitate at extremely low value of spermine salt concentration and independently of the DNA concentration.
Closure of the phase diagram in the concentrated range
Parallel to the shrinkage of the precipitation domain, the spacing values increase with the DNA concentration and the precipitated phase transits from a hexagonal to a cholesteric structure (Fig. 7). At the extreme DNA concentration of 350 mM (or ∼120 g/l) and 65 mM spermine, large isotropic aggregates have been detected (data not shown). We have verified that these isotropic aggregates are not present in the initial DNA solution and thus that the added spermine cations are truly responsible for their formation. For larger DNA concentrations, the isotropic-anisotropic Onsager transition of the Na-DNA samples without polyamines is approached, yielding to extremely difficult experimental manipulations. For that reason, no quantitative analysis has been done above 350 mM DNA phosphate. However the observation of isotropic aggregates strongly suggests that the phase diagram closure occurs at a nearby DNA concentration. It seems reasonable to think that the “neck” shape extension of the phase diagram predicted by Nguyen and Shklovskii (2001) does not exist in our system.
This increase of the spacing values in the high Na-DNA concentration range is most probably due to the presence of the monovalent cations. As previously suggested in Raspaud et al. (1998) in that range, they participate in the screening of the electrostatic interactions when they are replaced by the spermine ions along DNA but some of them remain condensed along DNA and are still present in the precipitate. This effect is clearly illustrated in Fig. 5 b. The presence of Na+ along the precipitated chains enlarges the interhelical spacing. When the spermine concentration increases, these initial monovalent counterions are progressively replaced by the spermine ions lowering then the interaxial distances. Once most of these monovalent cations are displaced, the variation in spacing is comparable to the variation observed in the absence of monovalent cations. It is not excluded that during the sodium displacement, some chloride anions could accompany the spermine ions into the precipitate as discussed previously. The presence of these anions could explain why in Fig. 5 b, the minimal distance is observed at a spermine concentration larger than the concentration required to neutralize all the phosphate charges.
Lower boundary of the phase diagram in the DNA dilute range
In the dilute range, we do not observe any effect of the DNA concentration and of the DNA length on the interhelical spacing. The spacing only depends on the spermine chloride concentration and on the presence of monovalent salt. At low values of the spermine concentration, in the range where the spacing is found independent of the spermine concentration, the increase of spacing with the amount of monovalent salt reflects again the presence of monovalent ions inside the precipitate. The monovalent salt effect is also observed with spermidine (3+) but the interaxial distances are found larger. Interestingly the precipitation boundary of the phase diagram in the DNA dilute range also strongly depends on the kind of polyamine and on the amount of monovalent salt. Compared to the spermine case, higher spermidine amount is required to induce the DNA precipitation. This effect is not simply due to the valence that differs for the two polyamines because cobalthexamine (3+) ions are able to precipitate DNA at concentrations comparable not to the spermidine but to the spermine (4+) concentrations. There is another parameter that must be taken into account: the ions specificity. This specificity is also reflected in the value of the interhelical distances. For the DNA precipitated by cobalthexamine ions, the interaxial spacing is found of the order of 28.3 Å as determined by Rau and Parsegian (1992) in the absence of applied osmotic stress. This distance is quite comparable to the distance that we measure not for the spermidine but for the spermine case. This comparison suggests that large interhelical spacings are measured when high concentrations of the multivalent ions are required to precipitate DNA. If a cohesive energy may be extracted from the phase diagram boundary, one may guess in a simple vision that larger interhelical spacing corresponds to lower cohesive energy between DNA molecules.
To evaluate the value of the cohesive energy, we can use the model of Nguyen et al. (2000). For the spermine case, the authors have already estimated that a cohesive energy of the order of 0.07 kT per nucleotide (kT being the thermal energy) is sufficient to reproduce the phase diagram boundaries measured at low monovalent salt concentration. The onset of DNA condensation and redissolution was found by equating the DNA chemical potentials in the precipitated and in the dissolved states. The chemical potential of a long DNA condensed chain μc was set equal to  with L / b the number of nucleotides per chain and E the cohesive energy per nucleotide. For the other part, by treating the long DNA chain dissolved in the bulk as a cylindrical capacitor, its chemical potential was written as μd = −1/2Qeff
V with Qeff the effective or net charge of the chain and V the voltage difference applied to the capacitor, both Qeff and V being related (Nguyen et al., 2000). In this approach, the effective DNA charge Qeff is negative at low spermine salt, nil at the spermine concentration C0, and becomes positive at larger spermine salt concentration. The overcharging effect explains the chain redissolution. Expressing Qeff and V in terms of polyamine concentration and screening length κ−1, the authors obtained an explicit equation for the cohesive energy at the onset of precipitation Cprecip (see Eq. 17 in Nguyen et al., 2000):
with L / b the number of nucleotides per chain and E the cohesive energy per nucleotide. For the other part, by treating the long DNA chain dissolved in the bulk as a cylindrical capacitor, its chemical potential was written as μd = −1/2Qeff
V with Qeff the effective or net charge of the chain and V the voltage difference applied to the capacitor, both Qeff and V being related (Nguyen et al., 2000). In this approach, the effective DNA charge Qeff is negative at low spermine salt, nil at the spermine concentration C0, and becomes positive at larger spermine salt concentration. The overcharging effect explains the chain redissolution. Expressing Qeff and V in terms of polyamine concentration and screening length κ−1, the authors obtained an explicit equation for the cohesive energy at the onset of precipitation Cprecip (see Eq. 17 in Nguyen et al., 2000):
 |
(5) |
with ξ the Manning parameter equal to 4.2 and a the double-helix radius equal to 10 Å. To estimate the E value, only the concentration C0 must be known because the onset of precipitation Cprecip was already measured for long chains of DNA in the range of low DNA concentrations (Raspaud et al., 1998). In a first attempt, the concentration C0 may be assigned to Cmax the polyamine concentration required to induce the maximum precipitation of the DNA chains (Fig. 8 in Raspaud et al., 1999). Based on this assumption, and using the experimental values Cprecip and Cmax, we have estimated the cohesive energies per nucleotide relative to kT. These values for the two kinds of polyamines are given in Table 1. The corresponding interhelical spacings, also reported in Table 1, were measured on the λ-DNA samples in the low polyamine concentration range, where the spacing remains constant. Each couple (aH, E) is determined for a given concentration of monovalent salt. Two values reported in the literature are also given in this table: 1), the cohesive energy estimated by Rau and Parsegian (1992) for the cobalthexamine ions from their osmotic stress experiments and using the interhelical spacing aH = 28.3 Å measured in the absence of stress; and 2), the work done during a change in DNA extension when DNA is collapsed by spermidine in a low-salt buffer (Baumann et al., 2000). In Fig. 9, these cohesive energy values are plotted as a function of the interhelical spacings. All the data (including the two bibliographical data) follow the same decreasing curve. This indicates that all the ions specificities mentioned earlier disappear in such a representation. Interestingly, the transition that we observe between the cholesteric and the hexagonal phases looks like the transition observed by Rau and Parsegian (1992) in their osmotic stress experiments, both occurring at similar spacing values.
FIGURE 9.

Cohesive energy E per nucleotide, relative to the thermal energy kT, as a function of the interaxial spacing when DNA is condensed by spermine (•) or by spermidine (□) at different monovalent salt concentrations. The cohesive energy was estimated according to Eq. 5. The energies determined by Baumann et al. (2000) for spermidine (Δ), and by Rau and Parsegian (1992) for cobalthexamine (∇) are also plotted for comparison. The continuous curves are just guides for eyes whereas the dashed line illustrates the structural transition from a hexagonal to a cholesteric phase. All the data plotted here are given in Table 1.
Although the estimated cohesive energies are in good agreement with others already published, these estimations should be used carefully for two main reasons: 1), the model that we use applies in principle only to low monovalent salt concentrations because the authors consider the case for which only multivalent ions are condensed onto DNA. Therefore, corrections due to the presence of monovalent ions inside the precipitate must be added to quantify precisely the cohesive energy in our range of high concentration of monovalent salt; and 2), the estimated energy depends on the concentration C0. This concentration has been set equal to the spermine salt concentration for which a maximum precipitation was observed. This assumption is generally verified in colloid science and has been precisely verified for our material only at low concentration of monovalent salt (Raspaud et al., 1999). It is not excluded that this assumption may not be appropriate anymore at high concentrations of monovalent salt. Altogether these two reasons should induce large deviations between this estimated energy and the effective energy. However, we do not observe such a large deviation. It rather suggests a compensation effect, which could be present in the equation that we used for instance by the scaling in C0 / Cprecip.
Finally to proceed further, the curve displayed in Fig. 9 could serve in turn to evaluate the cohesive energy from the spacing distances, that were measured everywhere in the phase diagram. For instance, the progressive increase of the distances, which is measured when spermine concentration approaches the redissolution threshold, reflects a progressive decrease of the cohesive energy. More precisely, a spacing increase from 28.15 to 29.2 Å means, according to Fig. 9, a cohesive energy reduced by half; for the 150-bp fragments, their energy would decrease from 25 to 12 kT. It indicates that a variation of aH as small as 1 Å must be taken into account in the energetic statement. This effect must be incorporated in the future models to understand why DNA is redissolved by an excess of polyamines and to predict the correct boundaries of the phase diagram. Such a variation of the local distances near the redissolution limit could be observed for other polyelectrolytes precipitated by other multivalent cations.
The results, that we present here on natural polyamines, could be also important for the development of polyamine analogs as therapeutic agents. Polyamines are known to have preferential binding (Ruiz-Chica et al., 2001) or preferential spatial orientations in the DNA environment and they may also act as hydrators of DNA (van Dam et al., 2002). Their polycationic shape with discrete charges may also change the binding properties (Lyubartsev and Nordenskiöld, 1997). A modification of their chemical structures leads to a change of their binding properties. It changes the interhelical spacing between precipitated DNA (Schellman and Parthasarathy, 1984) as well as the precipitation conditions (Smirnov et al., 1988). In other words these analogs modify the DNA-DNA interaction and the cohesive energy of DNA. It could be informative to measure the spacing, to extract the corresponding cohesive energy when DNA chains are precipitated by different polyamine analogs and in parallel to determine their efficiency to inhibit the growth of cancer cells. Because polyamines are involved in many cellular processes, a simple correlation between the two effects may be not so evident. However we believe that differences in some of these processes should be observed and correlated to a change in the cohesive energy because DNA-DNA interactions are involved in many reactions. A beautiful example of modulations of these interactions has been reported by Srivenugopal et al. (1987) using a series of polyamine analogs, and connecting aggregation and enzymatic studies.
In a few cases, it was demonstrated that the aggregation of DNA by polyamines stimulates reactions involving DNA with or without coupled enzymatic reactions. The rate of cyclization of λ-DNA (through the annealing of its cohesive ends) varies over more than six orders of magnitude as a function of spermidine concentration. This variation is strictly correlated with the conformation of the chain. The higher rates are obtained when the chain is collapsed in a dense globular shape, for spermidine concentrations ranging from 1 to 80 mM, in the presence of 13 mM monovalent salt (Jary and Sikorav, 1999). From our measurements with spermidine, we know that under conditions of higher efficiency, distances are close to 29.9 Å (0.05 kT per nucleotide). Maybe even higher efficiencies would have been obtained using spermine instead of spermidine. It was shown also that the same critical concentration of spermidine induces aggregation and catenation of DNA rings by topoisomerases (Krasnow and Cozzarelli, 1982). A similar effect with coupling between coaggregation and homologous pairing of single strands with duplex DNA involving the protein RecA, in the presence of spermidine (Gonda and Radding, 1986). Baeza et al. (1987) and Tsumoto et al. (2003) also followed the transcriptional activity of DNA, under polyamine aggregation.
An optimal distance is probably required between two DNA helices for a given reaction to occur. Under aggregating conditions, the interplay between polyamines and other ionic species are able to bring two DNA molecules to this optimal distance range, thus facilitating the reaction. The efficiency of the reactions may also depend on the orientation between the two DNA helices. We may hypothesize that parallel alignment would be favored in recombination experiments, whereas a twist between parallel helices may be more favorable for topoisomerase activity or strand crossing reactions. Over the range of favorable cohesive energies, the hexagonal phase would be the best candidate in the first case, and the cholesteric phase in the second one. Finally, this analysis was restricted to DNA-DNA interactions. It could be relevant to extend it to more complex systems involving DNA, proteins, and RNA.
Acknowledgments
The authors are grateful to Monica Olvera de la Cruz, Boris Shklovskii, and Bill Gelbart for valuable discussions and comments and also to the two referees who helped us to improve significantly this manuscript. We thank Marianne Clerc-Imperor and Patrick Davidson (Laboratoire de Physique des Solides, Université Paris-Sud, Orsay) for allowing us to do some test measurements on their x-ray diffraction bench, and Gilbert Zalczer and Alan Braslau (SPEC-CEA) for allowing us to perform the conductivity measurements on their apparatus. Part of this work was supported by the European RTN network (MRTN-CT-2003-504932).
References
- Baeza, I., P. Gariglio, L. M. Rangel, P. Chavez, L. Cervantes, C. Arguello, C. Wong, and C. Montanez. 1987. Electron microscopy and biochemical properties of polyamine-compacted DNA. Biochemistry. 26:6387–6392. [DOI] [PubMed] [Google Scholar]
- Baumann, C., V. A. Bloomfield, S. B. Smith, C. Bustamante, M. D. Wang, and S. M. Block. 2000. Stretching of single collapsed DNA molecules. Biophys. J. 78:1965–1978. [DOI] [PMC free article] [PubMed] [Google Scholar]
- Becker, M., R. Misselwitz, H. Damaschun, G. Damaschun, and D. Zirwer. 1979. Spermine-DNA complexes build up metastable structures. Small-angle X-ray scattering and circular dichroism studies. Nucleic Acids Res. 7:1297–1309. [DOI] [PMC free article] [PubMed] [Google Scholar]
- Behe, M., and G. Felsenfeld. 1981. Effects of methylation on a synthetic polynucleotide: the B-Z transition in poly(dG-m5dC).poly(dG-m5dC). Proc. Natl. Acad. Sci. USA. 78:1619–1623. [DOI] [PMC free article] [PubMed] [Google Scholar]
- Bloomfield, V. A. 1996. DNA condensation. Curr. Opin. Struct. Biol. 6:334–341. [DOI] [PubMed] [Google Scholar]
- Burak, Y., G. Ariel, and D. Andelman. 2003. Onset of DNA aggregation in presence of monovalent and multivalent counterions. Biophys. J. 85:2100–2110. [DOI] [PMC free article] [PubMed] [Google Scholar]
- Childs, A. C., D. J. Mehta, and E. W. Gerner. 2003. Polyamine-dependent gene expression. Cell. Mol. Life Sci. 60:1394–1406. [DOI] [PMC free article] [PubMed] [Google Scholar]
- Cohen, S. S. 1998. A Guide to the Polyamines. Oxford University Press, New York, NY; Oxford, UK.
- Damaschun, H., G. Damaschun, M. Becker, E. Buder, R. Misselwitz, and D. Zirwer. 1978. Study of DNA-spermine interactions by use of small-angle and wide-angle X-ray scattering and circular dichroism. Nucleic Acids Res. 5:3801–3809. [DOI] [PMC free article] [PubMed] [Google Scholar]
- Davis, R. H., D. R. Morris, and P. Coffino. 1992. Sequestered end products and enzyme regulation: the case of ornithine decarboxylase. Microbiol. Rev. 56:280–290. [DOI] [PMC free article] [PubMed] [Google Scholar]
- Durand, D., J. Doucet, and F. Livolant. 1992. A study of the structure of highly concentrated phases of DNA by X-ray diffraction. J. Phys. II. (France) 2:1769–1783. [Google Scholar]
- Gilles, R., U. Keiderling, and A. Wiedenmann. 1998. Silver behenate powder as a possible low-angle calibration standard for small-angle neutron scattering. J. Appl. Crystallogr. 31:957–959. [Google Scholar]
- Gonda, D. K., and C. M. Radding. 1986. The mechanism of the search for homology promoted by recA protein. J. Biol. Chem. 261:13087–13096. [PubMed] [Google Scholar]
- Gosule, L. C., and J. A. Schellman. 1976. Compact form of DNA induced by spermidine. Nature. 259:333–335. [DOI] [PubMed] [Google Scholar]
- Hud, N. V., and K. H. Downing. 2001. Cryoelectron microscopy of λ phage DNA condensates in vitreous ice: the fine structure of DNA toroids. Proc. Natl. Acad. Sci. USA. 98:14925–14930. [DOI] [PMC free article] [PubMed] [Google Scholar]
- Jary, D., and J. L. Sikorav. 1999. Cyclization of globular DNA. Implications for DNA-DNA interactions in vivo. Biochemistry. 38:3223–3227. [DOI] [PubMed] [Google Scholar]
- Krasnow, M. A., and N. R. Cozzarelli. 1982. Catenation of DNA rings by topoisomerases. J. Biol. Chem. 257:2687–2693. [PubMed] [Google Scholar]
- Lambert, O., L. Letellier, W. M. Gelbart, and J. L. Rigaud. 2000. DNA delivery by phage as a strategy for encapsulating toroidal condensates of arbitrary size into liposomes. Proc. Natl. Acad. Sci. USA. 97:7248–7253. [DOI] [PMC free article] [PubMed] [Google Scholar]
- Lee, K.-C., I. Borukhov, W. M. Gelbart, A. J. Liu, and M. J. Stevens. 2004. Effect of mono- and multivalent salt on angle dependant attraction between charged rods. Phys. Rev. Lett. 93:128101. [DOI] [PubMed] [Google Scholar]
- Lide, D. R. (ed.) 1999. Handbook of Chemistry and Physics, 80th Ed. CRC Press, Boca Raton, FL.
- Lyubartsev, A. P., and L. Nordenskiöld. 1997. Monte Carlo simulation study of DNA polyelectrolyte properties in the presence of multivalent polyamine ions. J. Phys. Chem. B. 101:4335–4342. [Google Scholar]
- Nguyen, T. T., I. Rouzina, and B. I. Shklovskii. 2000. Reentrant condensation of DNA induced by multivalent counterions. J. Chem. Phys. 112:2562–2568. [Google Scholar]
- Nguyen, T. T., and B. I. Shklovskii. 2001. Complexation of DNA with positive spheres: phase diagram of charge inversion and reentrant condensation. J. Chem. Phys. 115:7298–7308. [Google Scholar]
- Olvera de la Cruz, M., L. Belloni, M. Delsanti, J. P. Dalbiez, O. Spalla, and M. Drifford. 1995. Precipitation of highly charged polyelectrolyte solutions in the presence of multivalent salts. J. Chem. Phys. 103:5781–5791. [Google Scholar]
- Osland, A., and K. Kleppe. 1977. Polyamine induced aggregation of DNA. Nucleic Acids Res. 1:685–695. [DOI] [PMC free article] [PubMed] [Google Scholar]
- Pelta, J., D. Durand, J. Doucet, and F. Livolant. 1996a. DNA mesophases induced by spermidine: structural properties and biological implications. Biophys. J. 71:48–63. [DOI] [PMC free article] [PubMed] [Google Scholar]
- Pelta, J., F. Livolant, and J. L. Sikorav. 1996b. DNA aggregation induced by polyamines and cobalthexamine. J. Biol. Chem. 271:5656–5662. [DOI] [PubMed] [Google Scholar]
- Raspaud, E., I. Chaperon, A. Leforestier, and F. Livolant. 1999. Spermine-induced aggregation of DNA, nucleosome, and chromatin. Biophys. J. 77:1547–1555. [DOI] [PMC free article] [PubMed] [Google Scholar]
- Raspaud, E., M. Olvera de la Cruz, J. L. Sikorav, and F. Livolant. 1998. Precipitation of DNA by polyamines: a polyelectrolyte behavior. Biophys. J. 74:381–393. [DOI] [PMC free article] [PubMed] [Google Scholar]
- Rau, D. C., and V. A. Parsegian. 1992. Direct measurement of the intermolecular forces between counterion-condensed DNA double helices. Evidence for long range attractive hydration forces. Biophys. J. 61:246–259. [DOI] [PMC free article] [PubMed] [Google Scholar]
- Rubin, R. L. 1977. Spermidine-desoxyribonucleic acid interactions in vitro and in Escherichia coli. J. Bacteriol. 129:916–925. [DOI] [PMC free article] [PubMed] [Google Scholar]
- Ruiz-Chica, J., M. A. Medina, F. Sánchez-Jiménez, and F. J. Ramírez. 2001. Fourier transform Raman study of the structural specificities on the interaction between DNA and biogenic polyamines. Biophys. J. 80:443–454. [DOI] [PMC free article] [PubMed] [Google Scholar]
- Saminathan, M., T. Antony, A. Shirahata, L. Sigal, T. Thomas, and T. J. Thomas. 1999. Ionic and structural specificity effects of natural and synthetic polyamines on the aggregation and resolubilization of single-, double-, and triple-stranded DNA. Biochemistry. 38:3821–3830. [DOI] [PubMed] [Google Scholar]
- Schellman, J. A., and N. Parthasarathy. 1984. X-ray diffraction studies on cation-collapsed DNA. J. Mol. Biol. 175:313–329. [DOI] [PubMed] [Google Scholar]
- Sikorav, J. L., J. Pelta, and F. Livolant. 1994. A liquid crystalline phase in spermidine-condensed DNA. Biophys. J. 67:1387–1392. [DOI] [PMC free article] [PubMed] [Google Scholar]
- Smirnov, I. V., S. I. Dimitrov, and V. L. Makarov. 1988. Polyamine-DNA interactions. Condensation of chromatin and naked DNA. J. Biomol. Struct. Dyn. 5:1149–1161. [DOI] [PubMed] [Google Scholar]
- Solis, F. J. 2002. Phase diagram of dilute polyelectrolytes: collapse and redissolution by association of counterions and co-ions. J. Chem. Phys. 117:9009–9015. [Google Scholar]
- Solis, F. J., and M. Olvera de la Cruz. 2000. Flexible linear polyelectrolytes in multivalent salt solutions: solubility conditions. Eur. Phys. J. E. 1:1–18. [Google Scholar]
- Srivenugopal, K. S., D. E. Wemmer, and D. R. Morris. 1987. Aggregation of DNA by analogs of spermidine; enzymatic and structural studies. Nucleic Acids Res. 15:2563–2580. [DOI] [PMC free article] [PubMed] [Google Scholar]
- Strzelecka, T. E., and R. L. Rill. 1987. Solid-state 31P NMR studies of DNA liquid crystalline phases. The isotropic to cholesteric transition. J. Am. Chem. Soc. 109:4513–4518. [Google Scholar]
- Suwalsky, M., W. Traub, U. Shmueli, and J. A. Subirana. 1969. An X-ray study of the interaction of DNA with spermine. J. Mol. Biol. 42:363–373. [DOI] [PubMed] [Google Scholar]
- Tabor, H. 1962. The protective effect of spermine and other polyamines against heat denaturation of deoxyribonucleic acid. Biochemistry. 1:496–501. [DOI] [PubMed] [Google Scholar]
- Tabor, C. W., and H. Tabor. 1984. Polyamines. Annu. Rev. Biochem. 53:749–790. [DOI] [PubMed] [Google Scholar]
- Thomas, T., S. Balabhadrapathruni, M. A. Gallo, and T. J. Thomas. 2002. Development of polyamine analogs as cancer therapeutic agents. Oncol. Res. 13:123–135. [PubMed] [Google Scholar]
- Thomas, T., and T. J. Thomas. 2001. Polyamines in cell growth and cell death: molecular mechanisms and therapeutic applications. Cell. Mol. Life Sci. 58:244–258. [DOI] [PMC free article] [PubMed] [Google Scholar]
- Tsumoto, K., F. Luckel, and K. Yoshikawa. 2003. Giant DNA molecules exhibit on/off switching of transcriptional transition. Biophys. Chem. 106:23–29. [DOI] [PubMed] [Google Scholar]
- van Dam, L., N. Korolev, and L. Nordenskiöld. 2002. Polyamine-nucleic interactions and the effects on structure in oriented DNA fibers. Nucleic Acids Res. 30:419–428. [DOI] [PMC free article] [PubMed] [Google Scholar]
- Veress, I., S. Haghighi, A. Pulkka, and A. Pajunen. 2000. Changes in gene expression in response to polyamine depletion indicates selective stabilization of mRNAs. Biochem. J. 346:185–191. [PMC free article] [PubMed] [Google Scholar]
- Watanabe, S. I., K. Kusama-Eguchi, H. Kobayashi, and K. Igarashi. 1991. Estimation of polyamine binding to macromolecules and ATP in bovine lymphocytes and rat liver. J. Biol. Chem. 266:20803–20809. [PubMed] [Google Scholar]