Abstract
While the emergence of a power-law degree distribution in complex networks is intriguing, the degree exponent is not universal. Here we show that the betweenness centrality displays a power-law distribution with an exponent η, which is robust, and use it to classify the scale-free networks. We have observed two universality classes with η ≈ 2.2(1) and 2.0, respectively. Real-world networks for the former are the protein-interaction networks, the metabolic networks for eukaryotes and bacteria, and the coauthorship network, and those for the latter one are the Internet, the World Wide Web, and the metabolic networks for Archaea. Distinct features of the mass-distance relation, generic topology of geodesics, and resilience under attack of the two classes are identified. Various model networks also belong to either of the two classes, while their degree exponents are tunable.
Emergence of a power law in the degree distribution PD(k) ∼ k−γ in complex networks is an interesting self-organized phenomenon in complex systems (1–3). Here, the degree k means the number of edges incident upon a given vertex. Such a network is called scale-free (SF; ref. 4). Real-world networks that are SF include the author-collaboration network (5) in social systems, the protein-interaction network (PIN; ref. 6), and the metabolic network (7) in biological systems, and the Internet (8) and World Wide Web (WWW; refs. 9 and 10) in communication systems. The power-law behavior means that most vertices are connected sparsely, while a few vertices are connected intensively to many others and play an important role in functionality. While the emergence of such a SF behavior in degree distribution itself is surprising, the degree exponent γ is not universal and depends on the detail of network structure. As listed in Table 1, numerical values of the exponent γ for various systems are diverse, but most of them are in the range of 2 < γ ≤ 3. From the viewpoint of theoretical physics, it would be interesting to search a universal quantity associated with SF networks.
Table 1.
Natures of diverse SF networks
| Class | System | N | 〈k〉 | γ | η | Ref. | |
|---|---|---|---|---|---|---|---|
| Class I | (i) | Coauthorship | 205,202 | 11.8 | 2.2 (1) | 2.2 (1) | 15 |
| (ii) | PIN1 | 1,846 | 2.39 | 2.4 (exp. cutoff) | 2.2 (2) | 6 | |
| (iii) | PIN2 | 797 | 1.96 | 2.7 (1) | 2.2 (1) | 16 | |
| (iv) | Metabolic (eukaryotes, bacteria) | ∼103 | 2–4 | 2.0–2.4 | 2.2 (1) | 7 | |
| (v) | BA model (m ≥ 2) | 3×10⁵ | 2m | 2.0–3.0 | 2.2 (1) | 17 | |
| (vi) | Huberman–Adamic model | 105 | 𝒪(1) | 3.0 (1) | 2.2 (1) | 10 | |
| (vii) | Copying model | 104 | 4 | 2.0–3.0 | 2.2 (1) | 18 | |
| (viii) | Static model | 104 | 4, 6, 8 | 2.0–3.0 | 2.2 (1) | 11 | |
| (ix) | Accelerated-growth model | 104 | 𝒪(1) | 3.0 (1) | 2.2 (1) | 19 | |
| (x) | Fitness model | 104 | 4 | 2.25 | 2.2 (1) | 20 | |
| (xi) | PIN model | 104 | ∼2 | 2–3 | 2.2 (1) | 21 | |
| Class IIa | (xii) | Internet AS | 12,058 | 4.16 | 2.2 | 2.0 (1) | 23 |
| (xiii) | Metabolic (Archaea) | ∼103 | 2–4 | 2.0–2.3 | 2.0 (1) | 7 | |
| Class IIb | (xiv) | WWW | 325,729 | 4.51 | 2.1/2.45 | 2.0 | 9 |
| (xv) | BA tree (m = 1) | ∞ | 2 | >2.0 | 2.0 | 17 | |
| (xvi) | Deterministic tree | ∞ | 2 | >2.0 | 2.0 | 24 |
Tabulated for each network are the size N, the mean degree 〈k〉, the degree exponent γ, and the BC exponent η.
Recently a physical quantity called “load” was introduced as a candidate for the universal quantity in SF networks. It quantifies the load of a vertex in the transport of data packet along the shortest pathways in SF networks (11). It was shown that the load distribution exhibits a power law, PL(ℓ) ∼ ℓ−δ, and the exponent δ is robust as δ ≈ 2.2 for diverse SF networks with various degree exponents in the range of 2 < γ ≤3. Since the universal behavior of the load exponent was obtained empirically, fundamental questions such as how the load exponent is robust in association with network topology or the possibility of any other universal classes existing have not been explored yet. In this paper, we address those issues in detail.
While the load is a dynamic quantity, it is closely related to a static quantity, the “betweenness centrality” (BC), commonly used in sociology to quantify how influential a given person in a society is (12). To be specific, BC is defined as follows. Let us consider the set of the shortest pathways, or geodesics, between a pair of vertices (i, j) and denote their number by C(i, j). Among them, the number of the shortest pathways running through a vertex k is denoted by Ck(i, j). The fraction gk(i, j) = Ck(i, j)/C(i, j) may be interpreted as the amount of the role played by the vertex k in social relation between two persons i and j. Then the BC of the vertex k is defined as the accumulated sum of gk(i, j) over all ordered pairs for which a geodesic exists, i.e.,
 |
1 |
Because of only slight difference between load and BC, both quantities behave very closely. In fact, the BC gk of each vertex is exactly the same as the load for tree graphs. In general, distributions of the two are indistinguishable within available resolutions. The BC distribution follows a power law,
 |
2 |
where g means BC, and the exponent η is the same as the load exponent δ. Since the topological feature of a network can be grasped more transparently by using BC, we deal with BC in this work.
Based on numerical measurements of the BC exponent for a variety of SF networks, we find that SF networks can be classified into only two classes, say, classs I and II. For class I the BC exponent is η ≈ 2.2(1), and for class II it is η ≈ 2.0(1). We conjecture the BC exponent for class II to be exactly η = 2, since it can be derived analytically for simple models. We show that such different universal behaviors in the BC distribution originate from different generic topological features of networks. Moreover, we study a physical problem, the resilience of networks under an attack, showing different behaviors for each class, as a result of such difference in generic topologies. It is found that the networks of class II are much more vulnerable to the attack than those for class I.
To obtain our results, we use available data for real-world networks or existing algorithms for model networks. Once a SF network is constructed, we select a pair of vertices (i, j) on the network and identify the shortest pathways between them. Next, BC is measured on each vertex along the shortest pathways by using the modified version of the breath-first search algorithm introduced by Newman (13, 14). We measure the BC distribution and the exponent η for a variety of networks both real world and in silico.
Real-World and Artificial Networks Investigated
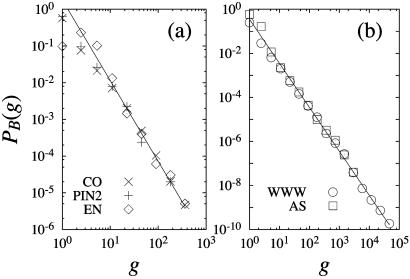
The networks that we find to belong to class I with η = 2.2(1) include: (i) the coauthorship network in the field of neuroscience, published in the period of 1991–1998 (15), where vertices represent scientists, and they are connected if they wrote a paper together; (ii) the PIN of the yeast Saccharomyces cerevisiae compiled by Jeong et al. (6) (PIN1), where vertices represent proteins, and the two proteins are connected if they interact§; (iii) the core of the PIN of the yeast S. cerevisiae (PIN2) obtained by Ito et al. (16, ¶); (iv) the metabolic networks for 5 species of eukaryotes and 32 species of bacteria in ref. 7, where vertices represent substrates, and they are connected if a reaction occurs between two substrates via enzymes (the reaction normally occurs in one direction, so that the network is directed); (v) the Barabási–Albert (BA) model (17), when the number of incident edges of an incoming vertex m ≥ 2; (vi) the geometric growth model by Huberman and Adamic (10); (vii) the copying model (18), the degree exponent of which is in the range of 2 < γ ≤ 3; (viii) the undirected or the directed static model (11), the degree exponent of which is in the range of 2 < γ ≤ 3 or 2 < (γin, γout) ≤ 3, respectively; (ix) the accelerated-growth model proposed by Dorogovtsev and Mendes (19); (x) the fitness model (20) with a flat fitness distribution; and (xi) the stochastic model for the PINs introduced by Solé et al. (21). All those networks (i–xi) exhibit a power-law behavior in the BC distribution with the exponent η ≈ 2.2(1). Detailed properties of each network are listed in Table 1. The representative BC distributions for real-world networks (i, iii, and iv) are shown in Fig. 1a.
Figure 1.
The BC distributions of real-world networks. (a) Networks belonging to class I: coauthorship network (×), core of PIN of yeast (+) by Ito et al. (16), and metabolic network of E. nidulans (EN, ⋄). The solid line is a fitted line with a slope of − 2.2. (b) Networks belonging to class II: WWW of www.nd.edu (○) and Internet AS as of October, 2001 (□). The solid line has a slope of −2.0.
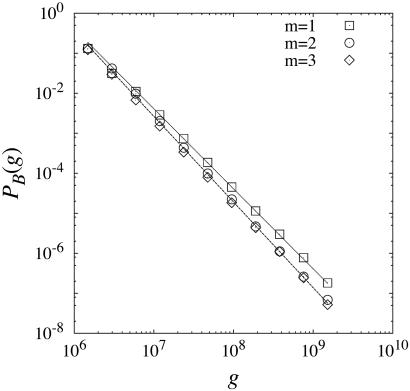
The networks that we find to belong to class II with η = 2.0 include: (xii) the Internet at the autonomous systems (ASs) level as of October, 2001 (23); (xiii) the metabolic networks for six species of Archaea in ref. 7; (xiv) the WWW of www.nd.edu (9); (xv) the BA model with m = 1 (17); and (xvi) the deterministic model by Jung et al. (24). In particular, the networks xv and xvi are of tree structure, where the edge BC distribution can be solved analytically. The detailed properties of each network are listed in Table 1. The BC distributions for real-world networks xii and xiv are shown in Fig. 1b. Since the BC exponents of each class are very close numerically, one may wonder whether there exist really two different universal classes apart from error bar. To make this point clear, we plot the BC distributions for the BA model with m = 1, 2, and 3 in Fig. 2, obtained from a large system size, n = 3 × 10⁵. We can see clearly different behaviors between the two BC distributions for the cases of m = 1 (class II) and m = 2 and 3 (class I).
Figure 2.
Comparison of the BC distributions for the two classes. BA models with m = 1, 2, and 3 are simulated for a large system size, n = 3 × 10⁵, averaged over 10 configurations. The dotted line has a slope of −2.0, and the dashed line has a slope of −2.2.
Topology of the Shortest Pathways
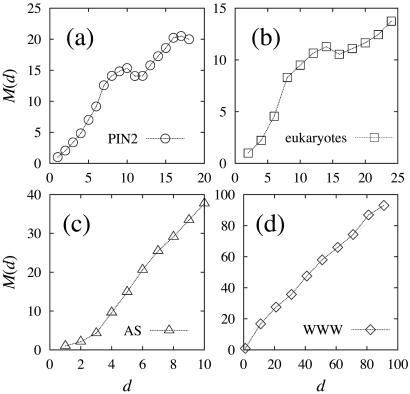
To understand the generic topological features of the networks in each class, we particularly focus on the topology of the shortest pathways between two vertices separated by a distance d. Along the shortest pathways, we count the total number of vertices ℳ(d) lying on these roads, averaged over all pairs of vertices separated by the same distance d. Adopting from the fractal theory, ℳ(d) is called the “mass-distance” relation. We find that it behaves in different ways for each class: for class I ℳ(d) behaves nonlinearly (Fig. 3 a and b), and for class II it is roughly linear (Fig. 3 c and d).
Figure 3.
The mass-distance relation ℳ(d). (a) Core of PIN of yeast obtained by Ito et al. (16). (b) Metabolic networks of eukaryotes. Data are averaged over all five organisms in ref. 7. Note that in this case we count only substrates for ℳ(d). (c) Internet AS as of October, 2001. (d) WWW of www.nd.edu.
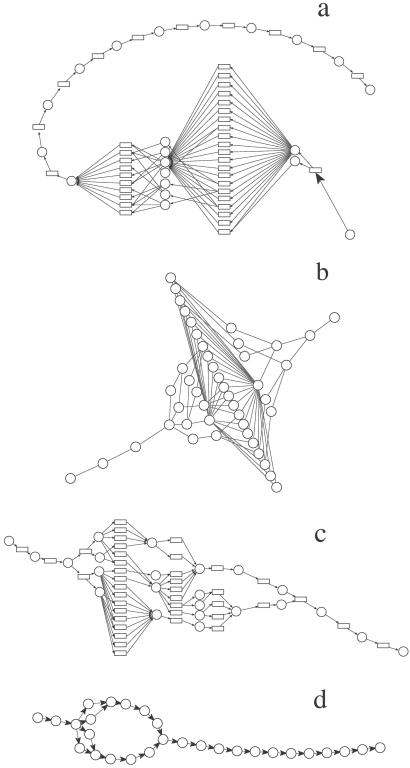
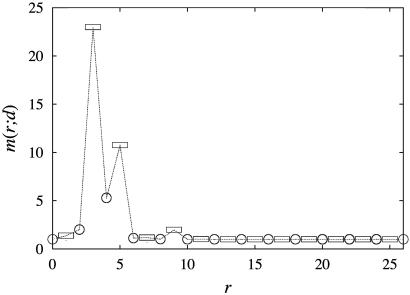
For the networks belonging to class I such as the PIN2 (iii) and the metabolic network for eukaryotes (iv), ℳ(d) exhibits a nonmonotonic behavior (Fig. 3 a and b), namely, it exhibits a hump at dh ≈ 10 for iii or dh ≈ 14 for iv. To understand why such a hump arises, we visualize the topology of the shortest pathways between a pair of vertices, taken from the metabolic network of a eukaryote organism, Emericella nidulans, as a prototypical example for class I. Fig. 4a shows such a graph with a linear size of 26 edges (d = 26), where an edge between a substrate and an enzyme is taken as the unit of length. From Fig. 4a, one can see that there exists a blob structure inside which vertices are multiply connected, while vertices outside are singly connected. What is characteristic for class I is that the blob is localized in a small region. To see this, we measure the mass density m(r; d), the average number of substrates or enzymes located at position r [Σ m(r; d) = ℳ(d)]. The average is taken over all possible pairs of vertices (56 pairs), separated by the same distance d = 26. Note that the metabolic network is directed such that the position r is uniquely defined. As shown in Fig. 5, we find that m(r; d) is sharply peaked at r = 3 and is larger than 1 only at r = 2, 4, and 6 for substrates. Thus the blob structure is present even after taking averages and is localized in a small region of size db ≃ 4∼5, centered at almost the same position r ≈ 3∼4 for different pairs of vertices. The blob size db can be measured in another way. In a given graph of the shortest pathways, we delete singly connected substrates successively until none is left and measure the linear size of the remaining structure. When averaged over all pairs of vertices with separations d > 10, it comes out to be db ≈ 4.5, well consistent with the value obtained previously for d = 26 only. Due to this blob structure, the mass-distance relation increases abruptly across d = 4 as shown in Fig. 3b.
Figure 4.
Topology of the shortest pathways. (a) The metabolic network of E. nidulans (eukaryote) of length 26. (b) The Internet AS of length 10. (c) The metabolic network of Methanococcus jannaschii (Archaea) of length 20. (d) WWW of www.nd.edu of length 20. In a and c, circles denote substrates, and rectangles denote intermediate states.
Figure 5.
The mass density. m(r; d) for E. nidulans with d = 26. Circles denote substrates, and rectangles denote intermediate states.
Next, we measure the average mass of blob, that is, the number of vertices inside a blob for a given graph of the shortest pathways with separation d, averaged over all pairs of vertices with the same separation. We find that the average blob mass is distributed broadly in the range of 3 < mb < 23. In particular, relatively heavy blob masses, mb = 15∼23, mainly come from the graphs with a linear size of d = 8∼14. Due to those blobs with heavy mass, the mass-distance relation exhibits a hump and decreases at around d = 14∼16, beyond which the mass ℳ(d) increases linearly by the presence of singly connected vertices. In short, the anomalous behavior in the mass-distance relation is due to the presence of a compact and localized blob structure in the topology of the shortest pathways between a pair of vertices for the metabolic network of eukaryotes. We have checked the mass-distance relations and the graphs of the shortest pathways for other networks belonging to class I such as the PIN2 and metabolic networks for other organisms and found that such topological features are generic, generating the anomalous behavior in the mass-distance relation. It still remains a challenge to derive the BC exponent η ≈ 2.2 analytically from such structures.
For class II, the mass depends on distance linearly, ℳ(d) ∼ Ad for large d (Fig. 3 c and d). Despite the linear dependence, the shortest pathway topology for the case of A > 1 is more complicated than that of the simple tree structure where A = 1. Therefore, the SF networks in class II are subdivided into two types called classes IIa and IIb, respectively. For class IIa A > 1, and the topology of the shortest pathways includes multiply connected vertices (Fig. 4 b and c), and for class IIb A ∼ 1, and the shortest pathway is almost singly connected (Fig. 4d). Examples in real-world networks in class IIa are the Internet at the AS level (A ∼ 4.5) and the metabolic network for Archaea (A ∼ 2.0), while that in class IIb is the WWW (A ∼ 1.0).
Let us examine the topological features of the shortest pathways for the networks in classes IIa and IIb more closely. First, for class IIa, we visualize in Fig. 4b a shortest pathway in the Internet system between a pair of vertices separated by 10 edges, the farthest separation. It contains a blob structure, but the blob is rather extended as db = 5, comparable to the maximum separation d = 10. We obtain db = 5 for d = 11 for another system. For comparison, db ≈ 4.5 for d = 26 in class I. Moreover, the featureless mass-position dependence m(r; d) we found implies that while most blobs are located almost in the middle of the shortest pathways, which seems to be caused by the geometric effect, there are a finite number of blobs located at the verge of the shortest pathways. Note that m(r; d) = m(d − r; d), since the Internet is undirected. Owing to the extended structure and scattered location of the blob, the mass-distance relation exhibits the linear behavior, ℳ(d) ∼ Ad, with A ≈ 4.5. The extended blob structure is observed also in the metabolic network for Archaea (Fig. 4c). Since the network in this case is directed, the symmetry in m(r; d) does not hold. However, the blob structure extends to almost one half of maximum separation, and the shortest pathways are very diverse, so that their topological property such as the mass-distance relation ℳ(d) is similar to that of the Internet.
The WWW is an example belonging to class IIb. For this network, the mass-distance relation exhibits ℳ(d) ∼ 1.0d, suggesting that the topology of the shortest pathway is almost singly connected, which is confirmed in Fig. 4d. When a SF network is of tree structure, one can solve the distribution of BC running through each edge analytically and obtain the BC exponent to be η = 2. A derivation of this exact result is presented in Appendix.
Comparison of the Resilience Under Attack
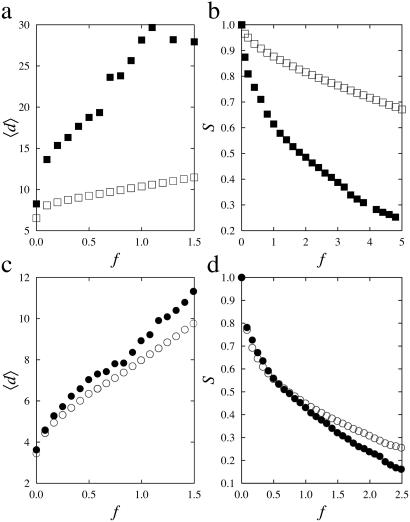
Thus far we have investigated the topological features of the shortest pathways of SF networks of each class. Then what would be distinct physical phenomena originated from such different topological features? Associated with this question, we investigate a problem of the resilience of a network under a malicious attack. It is known that SF networks are extremely vulnerable to the intentional attack to a few vertices with high degree, while it is very robust to random failures (25–27). To compare how vulnerable a network in each different class is under such attacks, we first construct a directed network, the numbers of vertices and edges and degree distribution of which are identical to those of the WWW (xiv) but with a BC exponent of 2.2. It can be generated, for example, by following the stochastic rule introduced in the directed static model (11). For both the WWW in real-world and artificial model network, we remove vertices in the descending order of BC successively. As vertices are removed, both the mean distance 〈d〉 between two vertices, known as the diameter, and the relative size of the giant cluster S are measured as a function of the fraction of removed vertices f. As can be seen in Fig. 6a, the diameter of the WWW with η = 2.0 (class IIb) increases more rapidly than that with η = 2.2 (class I) and shows discrete jumps while vertices are removed. Also the relative size of the largest cluster decreases more rapidly for η = 2.0 than for η ≈ 2.2 (Fig. 6b). This behavior arises from the fact that the shortest pathway consists of mainly singly connected vertices for class IIb such that there are no alternative pathways with the same distance when a single vertex lying on the shortest pathway is removed. For the Internet in real-world networks with η ≈ 2.0 in class IIa and an artificial network with η ≈ 2.2 with the same numbers of vertices and edges and the identical degree distribution, the differences in the diameter 〈d〉 and in the relative size S of the largest cluster appear to be rather small (Fig. 6 c and d) in comparison with the case of the WWW (Fig. 6 a and b). This is because the shortest pathways are multiply connected for class IIa.
Figure 6.
Attack vulnerability of the SF networks. The WWW (η = 2.0; ■) and the artificial directed SF network with η = 2.2 (□), the Internet (η = 2.0; ●), and the artificial undirected SF network with η = 2.2 (○): changes in network diameter (a and c) and the relative size of the largest cluster (b and d) are shown as a function of f, the fraction of removed vertices measured in percent (%).
Conclusions
In conclusion, we have found that the BC can determine the universal behavior of SF networks. By examining a variety of real-world and artificial SF networks, we observed two distinct universality classes with BC exponents of η ≃ 2.2(1) (class I) and 2.0 (class II), respectively. The mass-distance relation is introduced to characterize the topological features of the shortest pathways. It shows a hump for class I networks due to compact and localized blobs in the shortest pathway topologies, while it is roughly linear for the class II networks, which are more or less tree-like. The class II networks can be divided further into two types depending on whether the shortest pathway topology contains diversified pathways (class IIa) or mostly singly connected ones (class IIb). Distinct features of the resilience under attack arising from the different topologies of the shortest pathways are identified also. Since SF networks show the small-world property, the topology of the shortest pathways should be of relevance for characterizing the network geometry. Indeed the mass-distance relations for different universality classes show different behaviors. Such a relation between the universality class and the topological features of the shortest pathways may be understood from the perspective of the fact that the geometric fractal structure of the magnetic domains in equilibrium spin systems at criticality can classify the universality classes. Further characterizations in static and dynamic properties and possible evolutionary origin of the universality classes are interesting questions left for future study.
Acknowledgments
This work was supported by Korean Research Foundation Grant 01-041-D00061 and BK21 program of Ministry of Education and Human Resources Development (Seoul, Korea).
Abbreviations
- SF
scale-free
- PIN
protein-interaction network
- WWW
World Wide Web
- BC
betweenness centrality
- BA
Barabási–Albert
- AS
autonomous system
Appendix
Here we present the analytic derivation of the BC distribution for a tree structure; however, the derivation is carried out for the edge BC rather than the vertex version.‖ The edge BC is defined on edges as in Eq. 1, with the subscript k now denoting a bond. Without any rigorous proof, we assume that the distributions of vertex BC and edge BC behave in the same manner particularly on tree structures, which is confirmed by numerical simulations. We also checked the identity between the vertex BC and the edge BC distributions for a deterministic model of SF tree introduced by Jung et al. (24), which will be published elsewhere.
We consider a growing tree network such as the BA type model with m = 1, where a newly introduced vertex attaches an edge to an already existing vertex j with the probability proportional to its degree as (kj + a)/Σℓ(kℓ + a). Then the network consists of N(t) = t + 1 vertices and L(t) = t edges at time t. The stationary degree distribution is of a power law with γ = 3 + a (28, 29). Each edge of a tree divides the vertices into two groups attached to either sides of the edge. Let Ps(m, t) be the probability that the edge born at time s bridges a cluster with m vertices on the descendant side and another with remaining t + 1− m vertices on the ancestor side. Due to the tree structure, the BC running through that edge born at s is given as g = 2m(t + 1 − m) independent of the birth time s. The probability Ps(m, t) evolves as a new vertex attaches to one of the two clusters. The rate equation for this process is written as
 |
3 |
where r1(m, t) is the probability that a new vertex attaches to the cluster with (t + 1 − m) vertices on the ancestor side, and r2(m − 1, t) with (m − 1) vertices on the descendant side. They are given explicitly as
 |
4 |
Since the amount of the BC on the edge s is independent of the birth time, we introduce P(m, t),
 |
5 |
which is the probability for a certain edge to locate between two clusters with m and t + 1 − m vertices averaged over its birth time. The BC on that edge is still given by 2m(t + 1 − m). In terms of P(m, t), Eq. 3 can be written as
 |
6 |
 |
In the limit of t → ∞, one may rewrite P(m, t) in a scaling form, P(m, t) = 𝒫(m/t) and then Eq. 6 is rewritten as
 |
7 |
where x = m/t and the approximation 𝒫(x − 1/t) ≃ 𝒫(x) − (1/t)d𝒫(x)/dx has been used. From this we obtain that
 |
8 |
independent of the tuning parameter a. By using g = 2(t + 1 − m)m ∼ 2t2x for large t and finite m, Eq. 8 becomes
 |
9 |
Thus η = 2 is obtained for the tree structure, independent of γ > 2. General finite size-scaling relations for PB(g) are discussed in ref. 30.
Footnotes
This paper was submitted directly (Track II) to the PNAS office.
The network is composed of disconnected clusters of different sizes, namely, small isolated clusters as well as a giant cluster. For both ii and xi, the degree distribution is likely to follow a power law, but there needs to be an exponential cutoff to describe its tail behavior for finite systems. However, it converges to a clean power law for xi as system size increases, but the converging rate is rather slow (22). Despite this abnormal behavior in the degree distribution for finite systems, the BC distribution follows a pure power law with the exponent η ≈ 2.2(1) in ii and xi.
In contrast to ii, the degree distribution obeys a power law.
See Szabó et al. (31) for a mean field treatment of the vertex BC problem on trees.
References
- 1.Strogatz S H. Nature (London) 2001;410:268–276. doi: 10.1038/35065725. [DOI] [PubMed] [Google Scholar]
- 2.Albert R, Barabási A-L. Rev Mod Phys. 2002;74:47–97. [Google Scholar]
- 3.Dorogovtsev S N, Mendes J F F. Adv Phys. 2002;51:1079–1187. [Google Scholar]
- 4.Barabási A-L, Albert R, Jeong H. Physica A. 1999;272:173–187. [Google Scholar]
- 5.Newman M E J. Proc Natl Acad Sci USA. 2001;98:404–409. doi: 10.1073/pnas.021544898. [DOI] [PMC free article] [PubMed] [Google Scholar]
- 6.Jeong H, Mason S P, Barabási A-L, Oltvai Z N. Nature (London) 2001;411:41–42. doi: 10.1038/35075138. [DOI] [PubMed] [Google Scholar]
- 7.Jeong H, Tombor B, Albert R, Oltvani Z N, Barabási A-L. Nature (London) 2000;407:651–654. doi: 10.1038/35036627. [DOI] [PubMed] [Google Scholar]
- 8.Faloutsos M, Faloutsos P, Faloutsos C. Comp Comm Rev. 1999;29:251–262. [Google Scholar]
- 9.Albert R, Jeong H, Barabási A-L. Nature (London) 1999;401:130–131. [Google Scholar]
- 10.Huberman B A, Adamic L A. Nature (London) 1999;401:131. [Google Scholar]
- 11.Goh K-I, Kahng B, Kim D. Phys Rev Lett. 2001;87:278701. doi: 10.1103/PhysRevLett.87.278701. [DOI] [PubMed] [Google Scholar]
- 12.Freeman L C. Sociometry. 1977;40:35–41. [Google Scholar]
- 13.Newman M E J. Phys Rev E. 2001;64:016131. [Google Scholar]
- 14.Newman M E J. Phys Rev E. 2001;64:016132. [Google Scholar]
- 15.Barabási A-L, Jeong H, Ravasz R, Neda Z, Vicsek T, Schubert A. Physica A. 2002;311:590–614. [Google Scholar]
- 16.Ito T, Chiba T, Ozawa R, Yoshida M, Hattori M, Sakaki Y. Proc Natl Acad Sci USA. 2001;98:4569–4574. doi: 10.1073/pnas.061034498. [DOI] [PMC free article] [PubMed] [Google Scholar]
- 17.Barabási A-L, Albert R. Science. 1999;286:509–512. doi: 10.1126/science.286.5439.509. [DOI] [PubMed] [Google Scholar]
- 18.Kumar R, Raghavan P, Rajagopalan S, Sivakumar D, Tomkins A, Upfal E. Proceedings of the 41st Annual Symposium on Foundations of Computer Science. Los Alamitos, CA: IEEE Computer Society; 2000. pp. 57–65. [Google Scholar]
- 19.Dorogovtsev S N, Mendes J F F. Phys Rev E. 2001;63:025101. doi: 10.1103/PhysRevE.63.025101. (R). [DOI] [PubMed] [Google Scholar]
- 20.Bianconi G, Barabási A-L. Europhys Lett. 2001;54:436–442. [Google Scholar]
- 21.Solé R, Pastor-Satorras R, Smith E, Kepler T. Adv Complex Syst. 2002;5:43–54. [Google Scholar]
- 22.Kim J, Krapivsky P L, Kahng B, Redner S. Evolving Protein Interaction Networks. 2002. , cond-mat/0203167. [DOI] [PubMed] [Google Scholar]
- 23.Meyer D. University of Oregon Route Views Archive Project. 2001. http://archive.routeviews.org , http://archive.routeviews.org. . [Google Scholar]
- 24.Jung S, Kim S, Kahng B. Phys Rev E. 2002;65:056101. doi: 10.1103/PhysRevE.65.056101. [DOI] [PubMed] [Google Scholar]
- 25.Albert R, Jeong H, Barabási A-L. Nature (London) 2000;406:378–381. doi: 10.1038/35019019. [DOI] [PubMed] [Google Scholar]
- 26.Cohen R, Erez K, ben-Avraham D, Havlin S. Phys Rev Lett. 2000;85:4626–4629. doi: 10.1103/PhysRevLett.85.4626. [DOI] [PubMed] [Google Scholar]
- 27.Cohen R, Erez K, ben-Avraham D, Havlin S. Phys Rev Lett. 2001;86:3682–3685. doi: 10.1103/PhysRevLett.86.3682. [DOI] [PubMed] [Google Scholar]
- 28.Krapivsky P L, Redner S, Leyvraz F. Phys Rev Lett. 2000;85:4629–4632. doi: 10.1103/PhysRevLett.85.4629. [DOI] [PubMed] [Google Scholar]
- 29.Dorogovtsev S N, Mendes J F F, Samukhin A N. Phys Rev Lett. 2000;85:4633–4636. doi: 10.1103/PhysRevLett.85.4633. [DOI] [PubMed] [Google Scholar]
- 30. Goh, K.-I., Kahng, B. & Kim, D. (2002) Physica A, in press.
- 31.Szabó G, Alava M, Kertész J. Phys Rev E. 2002;66:026101. doi: 10.1103/PhysRevE.66.026101. [DOI] [PubMed] [Google Scholar]


