

Abstract
Human apolipoprotein A-1 (apo A-1) is the major protein component of high-density lipoproteins. The apo A-1 lipid-binding domain was used as a template for the synthesis of amphipathic helical proteins termed membrane scaffold proteins, employed to self-assemble soluble monodisperse discoidal particles called Nanodiscs. In these particles, membrane scaffold proteins surround a lipid bilayer in a beltlike fashion forming bilayer disks of discrete size and composition. Here we investigate the structure of Nanodiscs through molecular dynamics simulations in which Nanodiscs were built from scaffold proteins of various lengths. The simulations showed planar or deformed Nanodiscs depending on optimal length and alignment of the scaffold proteins. Based on mean surface area per lipid calculations, comparison of small-angle x-ray scattering curves, and the relatively planar shape of Nanodiscs made from truncated scaffold proteins, one can conclude that the first 17 to 18 residues of the 200-residue apo A-1 lipid-binding domain are not involved in formation of the protein “belts” surrounding the lipid bilayer. To determine whether the addition of an integral membrane protein has an effect on the overall structure of a Nanodisc, bacteriorhodopsin was embedded into a Nanodisc and simulated using molecular dynamics, revealing a planar disk with a slightly rectangular shape.
INTRODUCTION
Discoidal lipid/protein particles, termed Nanodiscs, can be self-assembled with controlled size and composition (Bayburt et al., 2002). Each Nanodisc contains two amphipathic α-helical proteins, termed membrane scaffold proteins, surrounding a cylindrical lipid bilayer; a schematic view is shown in Fig. 1. The size of Nanodiscs can be controlled by changing the length of the scaffold protein (Denisov et al., 2004). Nanodiscs can be used as a platform for studying the structure and mechanism of integral membrane proteins such as bacteriorhodopsin (bR) (Bayburt and Sligar, 2003), cytochrome P450 (Baas et al., 2004; Bayburt and Sligar, 2002; Civjan et al., 2003; Duan et al., 2004), and G-protein coupled receptors (Leitz et al., 2003).
FIGURE 1.

Schematic drawing of a Nanodisc. Two scaffold proteins are wrapped around a lipid bilayer in a beltlike fashion.
The membrane scaffold proteins used in making Nanodiscs were designed using the amino acid sequence of apolipoprotein A-1 (apo A-1) as a scaffold template (Bayburt et al., 2002). Apolipoproteins are the major protein component of high-density lipoproteins and can form water-soluble complexes with lipids and cholesterol derivatives (Segrest et al., 1994). Reconstituted high-density lipoproteins can be produced using purified apo A-1 and different lipids, with or without cholesterol (Jonas, 1986).
Based on predictions of its secondary structure, apo A-1 was proposed to have a 43 residue N-terminal globular domain and a 200-residue C-terminal lipid-binding domain (Segrest et al., 1994). The lipid-binding domain was characterized as having eight 22-mer and two 11-mer amphipathic α-helical repeats punctuated by the presence of prolines or glycines (Boguski et al., 1986; Nolte and Atkinson, 1992). The interaction between apo A-1 strands has been extensively studied, and it was proposed that the interaction between the two amphipathic proteins involves a series of salt bridges between oppositely charged residues (Klon et al., 2000, 2002a, 2002b; Segrest et al., 1999).
The x-ray crystal structure of a lipid-free 200-residue apo A-1 lipid-binding domain (Borhani et al., 1997) has been determined, but the structure of the protein bound to lipid remains unknown. Several models exist for the apo A-1 lipid-binding domain, including the picket fence (Phillips et al., 1997), helical hairpin (Rogers et al., 1998), and double-belt models (Segrest et al., 1999). The double-belt model, schematically presented in Fig. 1, is now the most widely accepted.
Recent experimental evidence resulting from Nanodiscs prepared from membrane scaffold proteins of various lengths suggests that up to 22 N-terminal residues of the originally predicted 200-residue lipid-binding domain do not bind lipid (Denisov et al., 2004). Under conditions where the lipid and scaffold protein stoichiometry is precisely controlled and optimized, the resultant Nanodiscs are of uniform size. Nanodiscs were prepared in which the first 11 or 22 residues of the membrane scaffold protein were removed, and it was shown that their size and composition do not depend on the presence of 20–22 N-terminal residues. Thus, it was suggested that the deleted residues do not participate in the scaffolding of the lipid bilayer.
Previous molecular dynamics simulations of the apo A-1 protein bound to lipid assumed the picket fence model (Phillips et al., 1997) and the double-belt model (Klon et al., 2002b). These simulations used two apo A-1 lipid-binding domains and 160 1-palmitoyl-2-oleoyl-sn-glycero-3-phosphocholine (POPC) lipids. However, recent experimental evidence suggests that the optimal ratio of POPC to scaffold protein (containing the full 200-residue lipid-binding domain of apo A-1) is 61:1, not the simulated 80:1.
However, a ratio of 80:1 lipids to scaffold protein is optimal for dipalmitoylphosphatidylcholine (DPPC) (Bayburt et al., 2002; Denisov et al., 2004). Accordingly, to mimic the Nanodiscs studied experimentally, the molecular dynamics simulations reported below use 160 DPPC lipids per Nanodisc with two scaffold proteins surrounding the lipid bilayer in a beltlike manner (Fig. 1). Simulations were done using scaffold proteins based on the predicted 200-residue lipid-binding domain of apo A-1 as well as N-terminal truncations of 11 or 22 residues. Additionally, bR was added to a Nanodisc and simulated to determine the effect of embedding an integral membrane protein on a disk.
METHODS
Molecular dynamics simulations of pure Nanodiscs
Each Nanodisc simulated is comprised of two membrane scaffold proteins and 160 DPPC lipids. Scaffold protein MSP1 contains the 200-residue lipid-binding C-terminal domain of apo A-1. MSP1 Δ(1–11), MSP1 Δ(1–22) and MSP1 Δ(1–22)g scaffold proteins contain truncations of portions of the first N-terminal helix, which are summarized in Table 1. All Nanodiscs were constructed using the program VMD (Visual Molecular Dynamics) (Humphrey et al., 1996).
TABLE 1.
Membrane scaffold proteins used for simulation of Nanodiscs
| Scaffold protein name | Protein deletions | Alignment of scaffold proteins | Simulation length (ns) |
|---|---|---|---|
| MSP1* | - | K90/K90 | 4.2 |
| MSP1 Δ(1–11) | 1–11 | K90/K90 | 4.5 |
| MSP1 Δ(1–22) | 1–22† | K90/K90 | 6.9 |
| MSP1 Δ(1–22)g | 1–22† | G23/Q200 | 4.5 |
The MSP1 membrane scaffold protein contains 200 amino acid residues. The sequence can be found in the supporting information of Denisov et al. (2004).
MSP1 Δ(1–22) and MSP1 Δ(1–22)g contain a proline to serine mutation at residue 23.
The scaffold proteins were initially modeled as α-helical circles with a central radius of between 43 and 48 Å depending on the length of the scaffold protein. The two scaffold protein belts were separated by 10 Å along the entire circumference for all Nanodiscs simulated. Proline residues were positioned at the outermost portion of the helices, and histidine residues were left unprotonated. The scaffold proteins were aligned using an antiparallel belt model with Lys-90 juxtaposed. The Lys-90 scaffold protein alignment was previously simulated together with 160 POPC lipids (referred to as the K133/K133 rotamer in the apo A-1 sequence) and found to be stable for up to 1 ns (Klon et al., 2002b). Additionally, Nanodiscs made with MSP1 Δ(1–22) scaffolds were simulated with Gly-23 and Glu-200 aligned. This arrangement, where the N- and C-terminals are aligned, leaves a gap in the coverage of the hydrophobic lipid tails by scaffold proteins.
The DPPC lipid bilayer was created from an initial membrane structure with a molecular area of 0.63 nm2 (Feller et al., 1997a). The initial membrane structure was replicated and translated to produce a bilayer with a total of 160 DPPC lipids, 80 per side. The bilayer was minimized with cylindrical harmonic boundaries at a radius of 39 Å. The minimized DPPC bilayer was then placed inside the previously constructed cylindrical membrane scaffold proteins (Fig. 1). The lipids fit easily into MSP1 scaffolds but were scaled down slightly to reduce steric clashes in the cases of MSP1 Δ(1–11) (99%), MSP1 Δ(1–22) (97.5%), and MSP1 Δ(1–22)g (97.5%).
The Nanodiscs were then solvated using the Solvate plug-in of VMD to create a hexagonal periodic water cell extending 10 Å above and below the lipid headgroups and 15 Å beyond the scaffold proteins. Sodium ions were added to neutralize the system. The entire system was then minimized to eliminate steric clashes.
All simulations were performed using the molecular dynamics program NAMD (Kalé et al., 1999) with CHARMM22 protein (Mackerell et al., 1998) and CHARMM27 lipid (Feller et al., 1997b) force fields. Constant temperature was maintained at 300 K using weakly coupled Langevin dynamics of nonhydrogen atoms; pressure was maintained at 1 atm using a Langevin piston Nose-Hoover barostat with an oscillation period of 200 fs and a decay time of 100 fs. Water molecules and all bonds to hydrogen atoms were held rigid, permitting a 2 fs time step. Full electrostatic forces were evaluated every three steps using the particle-mesh Ewald method with a 144 × 144 × 96 point grid. Short-range nonbonded terms were evaluated every step using a 10 Å cutoff for van der Waals (vdW) interactions and a smooth switching function. All simulations were first carried out with the scaffold protein Cα atoms harmonically restrained for 0.3–0.6 ns. The restraints were then removed and the system was allowed to equilibrate for another 3.9–6.6 ns, for total simulation times between 4.2 and 6.9 ns. The simulations contained between 145,000 and 156,000 atoms. Nanodiscs made with MSP1 scaffolds were simulated at the National Center for Supercomputing Applications (University of Illinois at Urbana-Champaign, Urbana, IL) on 256 1-GHz PIII processors and on 128 800-Mhz Itanium processors with performance of 0.6 ns/day and 0.75 ns/day, respectively. All other Nanodiscs were simulated on a cluster of 48 AMD Athlon MP 2600+ processors with performance of between 0.97 and 1.07 ns/day.
Molecular dynamics simulation of Nanodiscs with embedded bR
The structure of a Nanodisc with MSP1 Δ(1–11) scaffolds after 4.5 ns of simulation was used to embed an integral membrane protein, bR. A monomeric bR was constructed from coordinates obtained from the Protein Data Bank (PDB ID 1C3W) (Luecke et al., 1999). The protein was placed in the center of the Nanodisc, with the principal axes of the bR aligned with the principal axes of the Nanodisc, and lipids were removed to form a hole for the protein. All lipids within 1 Å of bR were removed, which resulted in a lipid layer consisting of between 58 and 62 lipids as opposed to the original 80 DPPC lipids per side. The entire structure was solvated using the VMD plug-in Solvate, sodium ions were added to neutralize the system, and then the system was minimized to eliminate steric clashes. Additional force-field parameters were added for the simulation of retinal in bR (Saam et al., 2002; Tajkhorshid et al., 2000; Tajkhorshid and Suhai, 1999). The simulation was performed using the same procedure as employed for pure Nanodiscs with the scaffold protein and bR Cα atoms harmonically restrained for 0.6 ns, at which time the restraints were removed and the system was allowed to equilibrate for an additional 3.9 ns for a total simulation time of 4.5 ns. The system consisted of 154,000 atoms, and was simulated on a cluster of 48 AMD Athlon MP 2600+ processors with a performance of 0.90 ns/day.
SAXS measurement and analysis
Small-angle x-ray scattering (SAXS) was measured at the Advanced Photon Source (Argonne National Laboratory, Argonne, IL) as described in Denisov et al. (2004). Raw scattering data were processed using the program FIT2D (Hammersley, 1998; Hammersley et al., 1996) to obtain the scattering curves in the form log(I/Io) versus Q = 4π sin (θ)/λ. Scattering curves for simulated structures were calculated using the program CRYSOL (Svergun et al., 1995). The CRYSOL program takes a Protein Data Bank file and generates a SAXS scattering curve; however, the program does not contain parameters for lipids. Therefore, the names of lipid groups, such as methyl, methylene, and others, were changed into the appropriate groups of the protein amino acids or nucleotides taken from the CRYSOL manual, assuming that they have the same electron densities. SAXS curves in the form of log(I/Io) versus Q were generated by CRYSOL using a hydration shell of 0.334 e/Å−3.
RESULTS AND DISCUSSION
Molecular dynamics simulations were carried out for the Nanodiscs generated from the scaffold proteins listed in Table 1. The goal of these simulations was to provide realistic atomic level images of Nanodiscs made with various truncated scaffold proteins, in particular to explore the involvement of the scaffold proteins N-terminal segment in binding the lipid bilayer and to investigate the importance of the alignment of the two scaffold proteins. Initially, Nanodiscs made with MSP1, MSP1 Δ(1–11), and MSP1 Δ(1–22) scaffolds were simulated with a K90/K90 alignment that had previously been found to form stable structures using N-terminal truncated apo A-1 in the double-belt model when simulated with 160 POPC lipids for up to 1 ns (Klon et al., 2002b). Additionally, a Nanodisc made with MSP1 Δ(1–22) scaffolds was simulated with the scaffold proteins N- and C-terminal gaps aligned (denoted as MSP1 Δ(1–22)g) in order to examine the significance of alignment to the overall shape of the Nanodisc.
Fig. 2 a shows a side view of a Nanodisc made with an MSP1 scaffold at 4.2 ns of simulation. The Nanodisc exhibits a severe deformation of both the scaffold protein and lipid bilayer. There appears to be insufficient lipid packing density for the length (number of amino acid residues) of the scaffold protein “belt” surrounding the Nanodisc resulting in an out-of-plane deformation and a significant flexibility of the MSP1 scaffold. A top view of the Nanodiscs shows that the two scaffold proteins do not align well with each other (Fig. 3 a). This suggests that the full 200-residues of the MSP1 scaffold do not bind optimally around a lipid bilayer of this size.
FIGURE 2.

Side view of Nanodiscs at 4.2 ns. Nanodiscs made with (a) MSP1, (b) MSP1 Δ(1–11), (c) MSP1 Δ(1–22), and (d) MSP1 Δ(1–22)g scaffold proteins. Each Nanodisc is constructed of two membrane scaffold proteins and 160 DPPC lipids. The membrane scaffold proteins are depicted in tube representation in blue and red. Prolines are highlighted in sphere representation in yellow and green. DPPC lipids are shown in MSMS surface representation. The lipid headgroups are shown in orange and the tail groups in gray. The alignment of the top (blue) and bottom (red) scaffold proteins is specified in Table 1.
FIGURE 3.

Top view of Nanodiscs at 4.2 ns. Nanodisc made with (a) MSP1, (b) MSP1 Δ(1–11), (c) MSP1 Δ(1–22), and (d) MSP1 Δ(1–22)g scaffolds. Lipids are removed to reveal the membrane scaffold proteins, which are shown in blue and red tube representation. Alignment of the prolines is highlighted in yellow and green using a sphere representation. Fig. 2 shows a side view of the scaffold proteins and lipids and explains the color coding of the scaffold proteins.
Simulations of Nanodiscs with smaller diameters, formed with MSP1 Δ(1–11) and MSP1 Δ(1–22) scaffolds, result in discoidal structures with little deformation of the lipid bilayer or scaffold proteins (Fig. 2, b and c). The two scaffold proteins and the proline residues align vertically over each other with minimal misalignment (Fig. 3 b). Although a Nanodisc made with MSP1 Δ(1–22) scaffolds has a stable structure with little out-of-plane deformation, the vertical alignment of the scaffold proteins is not as good as in the case of a Nanodisc made from MSP1 Δ(1–11) (Fig. 3 c). Since the alignment of MSP1, MSP1 Δ(1–11), and MSP1 Δ(1–22) scaffold proteins are very similar, the only differences stemming from the overlapping truncated regions— the out-of-plane deformation of the Nanodiscs—appears to be due to the overall size of the Nanodiscs and the packing density of the lipids. Nanodiscs made with MSP1 Δ(1–11) and MSP1 Δ(1–22) scaffolds have a more densely packed lipid bilayer due to the overall smaller diameter provided by the scaffold protein and exhibit less deformation.
As described in Methods, a Nanodisc made with MSP1 Δ(1–22) scaffolds was simulated with a second alignment of the scaffold proteins, termed MSP1 Δ(1–22)g, in which the gaps are aligned. This resulted in a structure with increased out-of-plane deformation of both the scaffold protein and the lipid bilayer (Figs. 2 d and 3 d). This deformation is due to the alignment of the two scaffold proteins, as the proteins have the same composition as Nanodiscs made with MSP1 Δ(1–22) scaffolds. The model suggests that the alignment of the two scaffold proteins and their prolines plays a role in reducing the out-of-plane deformation of the Nanodisc and stabilization of the planar bilayer.
Fig. 4 provides a view of Nanodiscs made with MSP1 Δ(1–22) scaffolds and illustrates the effective coverage of the hydrophobic tail groups of the DPPC lipids by the membrane scaffold proteins. The hydrophobic tails are effectively covered out to 6.9 ns of simulation. All other membrane scaffold proteins provided a similar coverage of the lipid tail groups. The majority of the hydrophobic residues of the amphiphatic membrane scaffold proteins are on the interior side of the helices, making contact with the hydrophobic lipid tail groups and enabling the membrane scaffold proteins to solubilize lipid bilayers with the outwardly oriented hydrophilic sides. Water is effectively shielded from the hydrophobic inside of the Nanodisc by the hydrophilic side of the scaffold protein. The presence of a hydrophilic solvent such as water is needed to maintain a discoidal lipid/protein structure. In the simulations, sodium ions are added to the water phase to neutralize the system. For all Nanodiscs simulated, the sodium ions diffuse freely during the simulations, never becoming stuck to the scaffold protein or lipid headgroups.
FIGURE 4.

Nanodiscs made with MSP1 Δ(1–22) scaffolds in side-by-side stereo view at 6.9 ns. All atoms are depicted using a sphere representation. DPPC lipid headgroups are shown in orange, and tail groups in gray. The amino acid residues in the membrane scaffold proteins are colored according to the residue property: basic residues are shown in blue, acid residues in red, polar residues in green, and nonpolar residues in white. The hydrophobic tail groups of the DPPC lipids (in gray) are covered by the membrane scaffold proteins.
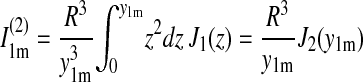
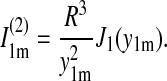
The calculated root mean-square deviation (RMSD) of all the atoms in the Nanodiscs (lipids and scaffold proteins) shows that the Nanodiscs do not reach an asymptotic RMSD value, even after 6.9 ns (Fig. 5 a). This is due to the extended random movement of lipids in the bilayer. In fact, the time needed for the lipids to reach an RMSD equilibrium value is ∼10 μs as determined by means of diffusion theory (see Appendix). The time dependence of the lipids' RMSD value is found to be in good approximation
 |
where R is the radius of the lipid bilayer (3.9 nm) and D is the lipid diffusion coefficient. Matching the theoretical time dependence at t ≈ t0 to the simulation data (see Appendix and Fig. 5) yields D = 1.5 nm2/μs. Since the microsecond time needed for the lipid bilayer to reach an asymptotic RMSD value is not within the timescale achievable by molecular dynamics, one can monitor the RMSD of the out-of-plane deformation of the scaffold protein alone to determine whether the scaffold protein itself has equilibrated. This RMSD value relative to a bisecting plane shows that the Nanodiscs made with MSP1 Δ(1–11) and MSP1 Δ(1–22) scaffolds reach equilibrium within 1.5 ns, but the Nanodiscs made with MSP1 and MSP1 Δ(1–22)g scaffolds do not (Fig. 5 b). We conclude that Nanodiscs made with MSP1 Δ(1–11) and MSP1 Δ(1–22) are more rigid and maintain a planar disk shape, whereas the other two Nanodiscs exhibit slow out-of-plane fluctuations.
FIGURE 5.

Root mean-square deviation of Nanodiscs. MSP1 shown in green, MSP1 Δ(1–11) in black, MSP1 Δ(1–22) in red, and MSP1 Δ(1–22)g in blue. (a) RMSD of Nanodiscs relative to the initial structure. (Inset) Mean-square deviation of the DPPC lipid bilayer bounded by the membrane scaffold proteins over time. For the lipid bilayer RMSD to reach its asymptotic value, i.e., equilibrium, requires ∼10 μs (diffusion coefficient 1.5 nm2/μs). (b) RMSD measuring the out-of-plane deformation of the membrane scaffold proteins, determined through the deviation of all atoms in each membrane scaffold protein relative to the plane bisecting the Nanodisc.
The interaction energy, consisting of the electrostatic and vdW energies between all atoms in one scaffold protein relative to the other, has been determined and is compared for the Nanodiscs in Fig. 6. For the purposes of this comparison, the energies shown have been divided by the number of residues per scaffold protein, i.e., represented energies are energies per residue. A lower interaction energy per residue, as seen for MSP1 Δ(1–11) and MSP1 Δ(1–22) scaffolds, indicates a stronger attraction between the two scaffold proteins. MSP1 and MSP1 Δ(1–22)g scaffolds are found to experience less attractive forces between the two scaffold proteins, which is consistent with the increased deformation seen in these structures (Fig. 2, a and d). MSP1 Δ(1–11) scaffold proteins have the strongest attraction and the respective Nanodisc assumes the flattest cylindrical shape of all Nanodiscs simulated (Figs. 2 b and 3 b).
FIGURE 6.

Interaction energy between the two membrane scaffold proteins. MSP1 is shown in green, MSP1 Δ(1–11) in black, MSP1 Δ(1–22) in red, and MSP1 Δ(1–22)g in blue. The energy shown accounts for the electrostatic and vdW interaction between all atoms in one membrane scaffold protein and all atoms of the other scaffold protein. The total interaction energy has been divided by the number of amino acid residues in the membrane scaffold protein to yield the interaction energy per residue.
Further analysis of the Nanodiscs reveals a decrease in the surface area per lipid over time, with the most dramatic change seen for the lipid bilayer of Nanodiscs made with MSP1 scaffolds (Fig. 7). This is another indication that these Nanodiscs do not contain an optimal lipid packing density. The experimentally determined surface area per lipid for Nanodiscs made with MSP1, MSP1 Δ(1–11), and MSP1 Δ(1–22) scaffolds is 52 Å2 at 293 K (Denisov et al., 2004). A comparison with Fig. 7 reveals that Nanodiscs made with MSP1 Δ(1–11) and MSP1 Δ(1–22) scaffolds reproduce this packing density best. We can conclude that the optimal lipid-binding domain has a length between that of MSP1 Δ(1–11) and MSP1 Δ(1–22) scaffolds.
FIGURE 7.

Mean surface area per DPPC lipid. The Nanodisc made with MSP1 is shown in green, with MSP1 Δ(1–11) in black, MSP1 Δ(1–22) in red, and MSP1 Δ(1–22)g in blue. The dashed line at 52 Å2 represents the mean surface area per lipid determined experimentally (Denisov et al., 2004).
SAXS can be used to provide low-resolution information on the structure of Nanodiscs in solution. Previous SAXS observations on Nanodiscs were analyzed using “bead” models, revealing that Nanodiscs are indeed discoidal particles (Denisov et al., 2004). Structures resulting from molecular dynamics simulations can also be used as models for back-calculating SAXS curves, providing an opportunity for comparison with experimental data. As shown in Fig. 8, SAXS curves generated from simulated structures, Nanodiscs made with full length MSP1 and truncated MSP1 Δ(1–11) and MSP1 Δ(1–22) scaffolds, show a characteristic minimum at ∼0.07 Å−1, corresponding to the diameter of the disk, and a broad maximum at 0.11–0.15 Å−1, which is a characteristic feature of lipid bilayers (Bolze et al., 2000; Denisov et al., 2004; Funari et al., 2001; Taya et al., 2002). The simulated Nanodiscs made with MSP1 Δ(1–22) yields a SAXS curve with characteristic minimum, maximum, and overall shape that most closely resembles the experimentally measured SAXS curve (Fig. 8, a and b), but its SAXS curve does not match the observed curve exactly. This suggests that the simulated structures of the Nanodiscs made with MSP1 Δ(1–22) still does not match the in vitro structure precisely. The remaining difference may result from changes in the packing density of the lipid bilayer, since the scattering contrast of the lipids undergoes dramatic changes in the range of mean surface area per lipid values seen in Nanodiscs (Sachs et al., 2003; Tristram-Nagle and Nagle, 2004).
FIGURE 8.
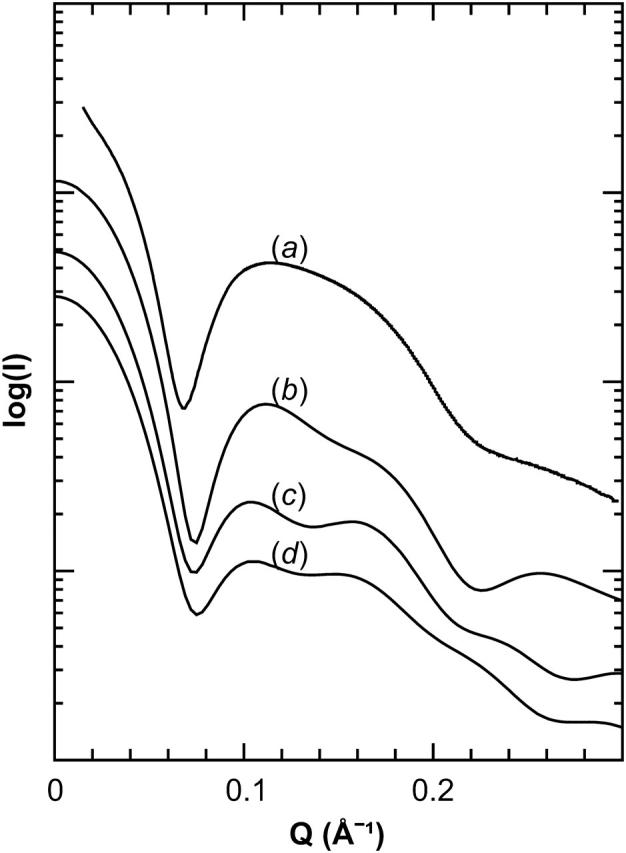
Small-angle x-ray scattering of Nanodiscs. Comparison of small-angle x-ray scattering signals observed for Nanodiscs made with MSP1 (a), and calculated for Nanodiscs with MSP1 Δ(1–22) (b), MSP1 Δ(1–11) (c), and MSP1 (d) scaffolds. The curves are vertically separated for clarity.
Based on previously reported experimental evidence (Denisov et al., 2004) and on the simulations described, it appears that the first 11–22 residues of the originally predicted 200-residue C-terminal lipid-binding domain of apo A-1 do not, in fact, bind to lipid. The actual lipid-binding domain of apo A-1 appears to start between residues 11 and 22, and based on the surface area per lipid results shown in Fig. 7 and SAXS curves shown in Fig. 8, the most likely starting point should be at residues 17–18. In experimentally prepared Nanodiscs, these 17–18 N-terminal residues most likely stick out from the discoidal structure and are not involved in forming belts around the lipid bilayer.
Nanodiscs can be used as platforms for studying integral membrane proteins such as bR (Bayburt and Sligar, 2003). To determine whether molecular dynamics could be used to study integral membrane proteins embedded in Nanodiscs, a simulation was done of bR in a Nanodisc formed with MSP1 Δ(1–11) scaffolds (Fig. 9). The resulting Nanodisc does not exhibit any out-of-plane deformation with the addition of bR; however, the Nanodisc adopts a slightly rectangular shape.
FIGURE 9.

A side and top view of bacteriorhodopsin in a Nanodisc made with MSP1 Δ(1–11) scaffolds at 4.5 ns. Shown in cyan and red are the two membrane scaffold proteins surrounding the DPPC lipid bilayer in a beltlike fashion. DPPC lipids are shown in orange (headgroups) and gray (tail groups). Embedded in the center of the lipid bilayer is a bacteriorhodopsin shown using a surface representation colored according to their residue properties; basic residues are shown in blue, acid residues in red, polar residues in green, and nonpolar residues in white.
CONCLUSIONS
Molecular dynamics has been proven to be a suitable method for studying the structure of Nanodiscs. The method can be used to investigate such issues as deformation of the Nanodisc, alignment of membrane scaffold proteins, and properties of the lipid bilayer. The Nanodiscs solvated in an aqueous environment are of small enough size to permit all-atom molecular dynamics simulations in the nanosecond time range, which is long enough to allow for the relaxation of the scaffold protein, but not long enough for an overall restructuring of the Nanodisc, e.g., a change in the scaffold protein alignment. Further collaboration between experiment and theory should lead to Nanodisc models that fit more closely the available experimental data. The models obtained here and further improved models could be used to design improved scaffold proteins and in planning experiments with proteins embedded into or adhering to Nanodiscs.
Such experiments allow one to study the interactions of the membrane proteins with a membrane, the mechanism of action of membrane proteins, and the three-dimensional structure in a native lipid membrane environment. No other experimental system currently allows for such precise control over the environment of membrane proteins. Since Nanodiscs contain a small patch of membrane of known composition, they are also ideally suited for studying the properties of bilayers such as lipid phase transitions (Shaw et al., 2004) and the effect of cholesterol.
Acknowledgments
The authors thank Dr. T. Bayburt and Dr. M. McLean for numerous discussions and assistance in SAXS data collection.
Portions of this work were performed at the DuPont-Northwestern-Dow Collaborative Access Team (DND-CAT) Synchrotron Research Center located at Sector 5 of the Advanced Photon Source. DND-CAT is supported by E. I. DuPont de Nemours & Co., Dow Chemical Co., the U.S. National Science Foundation through grant DMR-9304725, and the state of Illinois through the Department of Commerce and the Board of Higher Education grant IBHE HECA NWU 96. Use of the Advanced Photon Source was supported by the U.S. Department of Energy, Basic Energy Sciences, Office of Energy Research under Contract No. W-31-102-Eng-38. This work was supported by grants RO1 GM067887-01 and PHS 2 P41 RR05969 from the National Institutes of Health to Dr. Klaus Schulten, and by grant PHS R01 GM33775 from the National Institutes of Health to Dr. Stephen Sligar. The authors acknowledge computer time provided through grant MCA93S028 from the National Resource Allocations Committee.
APPENDIX
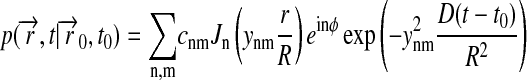
In this appendix, we derive an idealized description of lipids diffusing in a Nanodisc. The lipids are assumed to diffuse freely inside a disk of radius R, obeying the two-dimensional diffusion equation
 |
(1) |
along with the boundary conditions
 |
(2) |
 |
(3) |
and the initial condition
 |
(4) |
The boundary condition, Eq. 2, implies that the lipids are “reflected” at the circumference of the Nanodisc.
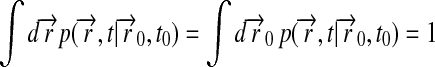
Here we seek to provide a mathematical expression for the mean-square deviation of the lipids defined through
 |
(5) |
where integrals are taken over the disk area. We employed in this expression the spatially independent initial distribution of lipids, 
To evaluate the right hand side of Eq. 5, we expand  in terms of eigenfunctions of the differential operator in Eq. 1, the so-called diffusion operator. This is accomplished through
 |
(6) |
since
 |
(7) |
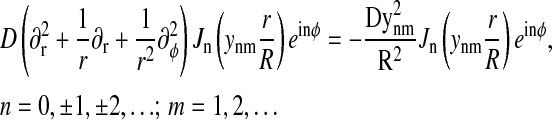
as one can readily verify using the well-known properties of the regular Bessel functions  (Abramowitz and Stegun, 1968). The eigenfunctions have been chosen such that they also obey the boundary condition, Eq. 2; this is realized if ynm are chosen as roots of the equation
 |
(8) |
One must also choose y00 = 0 in Eqs. 6 and 7. The coefficients cnm are determined through the initial condition, Eq. 4. Using the theory of the Fourier-Bessel series and of Fourier transforms, one can derive (Jackson, 1975)
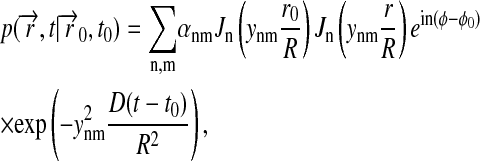 |
(9) |
where
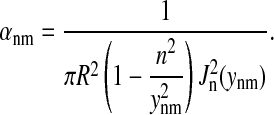 |
(10) |
Expression 9 permits one to determine readily the right-hand side of Eq. 5. For this purpose we note
 |
(11) |
Using
 |
(12) |
one can write after a little algebra
 |
(13) |
where
 |
(14) |
is given by
 |
(15) |
Using Eqs. 9 and 10 and the orthogonality of the functions exp(inφ), one derives
 |
(16) |
where
 |
(17) |
Exploiting known identities of Bessel functions (Lebedev, 1965), one obtains
 |
(18) |
and using  together with
 |
(19) |
It follows
 |
(20) |
Altogether, our derivation results in the identity
 |
(21) |
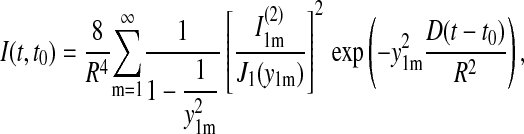
Given the values of ynm, which are in the order m = 1, 2, 3,… according to Abramowitz and Stegun (1968),
 |
(22) |
one can recognize that the series in Eq.21 is rapidly converging and, in fact, reaches zero for t = t0 due to the identity  This identity follows from
  For the overall shape of Eq.21, only the leading term needs to be included, which is approximated closely by
 |
(23) |
This expression is inaccurate near t = t0, where one can approximate the curve, however, by 4D(t − t0). This linear curve has been fitted to the experimental data in Fig. 5 c, resulting in a D value of 1.5 nm2/μs. Expression 23 reaches 90% of its saturation value at t − t0 = 0.68 R2/D. For R = 3.9 nm, this is 7 μs; the relaxation time τ = R2/(3.39 D) arising in Eq. 23 is ∼3 μs.
References
- Abramowitz, M., and I. A. Stegun. 1968. Handbook of Mathematical Functions. Dover Publications, New York.
- Baas, B. J., I. G. Denisov, and S. G. Sligar. 2004. Homotropic cooperativity of monomeric cytochrome P450 3A4 in a nanoscale native bilayer environment. Arch. Biochem. Biophys. 430:218–228. [DOI] [PubMed] [Google Scholar]
- Bayburt, T. H., Y. V. Grinkova, and S. G. Sligar. 2002. Self-assembly of discoidal phospholipid bilayer nanoparticles with membrane scaffold proteins. Nano Lett. 2:853–856. [Google Scholar]
- Bayburt, T. H., and S. G. Sligar. 2002. Single-molecule height measurements on microsomal cytochrome P450 in nanometer-scale phospholipid bilayer disks. Proc. Natl. Acad. Sci. USA. 99:6725–6730. [DOI] [PMC free article] [PubMed] [Google Scholar]
- Bayburt, T. H., and S. G. Sligar. 2003. Self-assembly of single integral membrane proteins into soluble nanoscale phospholipid bilayers. Protein Sci. 12:2476–2481. [DOI] [PMC free article] [PubMed] [Google Scholar]
- Boguski, M. S., M. Freeman, N. A. Elshourbagy, J. M. Taylor, and J. I. Gordon. 1986. On computer-assisted analysis of biological sequences: proline punctuation, consensus sequences, and apolipoprotein repeats. J. Lipid Res. 27:1011–1034. [PubMed] [Google Scholar]
- Bolze, J., T. Fujisawa, T. Nagao, K. Norisada, H. Saito, and A. Naito. 2000. Small angle X-ray scattering and 31-P NMR studies on the phase behavior of phospholipid bilayered mixed micelles. Chem. Phys. Lett. 329:215–220. [Google Scholar]
- Borhani, D. W., D. P. Rogers, J. A. Engler, and C. G. Brouillette. 1997. Crystal structure of truncated human apolipoprotein A-I suggests a lipid-bound conformation. Proc. Natl. Acad. Sci. USA. 94:12291–12296. [DOI] [PMC free article] [PubMed] [Google Scholar]
- Civjan, N. R., T. H. Bayburt, M. A. Schuler, and S. G. Sligar. 2003. Direct solubilization of heterologously expressed membrane proteins by incorporation into nanoscale lipid bilayers. Biotechniques. 35:556–560, 562–563. [DOI] [PubMed] [Google Scholar]
- Denisov, I. G., Y. V. Grinkova, A. A. Lazarides, and S. G. Sligar. 2004. Directed self-assembly of monodisperse phospholipid bilayer Nanodiscs with controlled size. J. Am. Chem. Soc. 126:3477–3487. [DOI] [PubMed] [Google Scholar]
- Duan, H., N. R. Civjan, S. G. Sligar, and M. A. Schuler. 2004. Co-incorporation of heterologously expressed Arabidopsis cytochrome P450 and P450 reductase into soluble nanoscale lipid bilayers. Arch. Biochem. Biophys. 424:141–153. [DOI] [PubMed] [Google Scholar]
- Feller, S. E., R. M. Venable, and R. W. Pastor. 1997a. Computer simulation of a DPPC phospholipid bilayer: structural changes as a function of molecular surface area. Langmuir. 13:6555–6561. [Google Scholar]
- Feller, S. E., D. Yin, R. W. Pastor, and A. D. MacKerell Jr. 1997b. Molecular dynamics simulation of unsaturated lipid bilayers at low hydration: parameterization and comparison with diffraction studies. Biophys. J. 73:2269–2279. [DOI] [PMC free article] [PubMed] [Google Scholar]
- Funari, S. S., B. Nuscher, G. Rapp, and K. Beyer. 2001. Detergent-phospholipid mixed micelles with a crystalline phospholipid core. Proc. Natl. Acad. Sci. USA. 98:8938–8943. [DOI] [PMC free article] [PubMed] [Google Scholar]
- Hammersley, A. P. 1998. ESRF Internal Report, ESRF98HA01T, FIT2D V9.129 Reference Manual V3.1.
- Hammersley, A. P., S. O. Svensson, M. Hanfland, A. N. Fitch, and D. Häusermann. 1996. Two-dimensional detector software: from real detector to idealised image or two-theta scan. High Pressure Res. 14:235–248. [Google Scholar]
- Humphrey, W., A. Dalke, and K. Schulten. 1996. VMD: visual molecular dynamics. J. Mol. Graph. 14:33–38. [DOI] [PubMed] [Google Scholar]
- Jackson, J. D. 1975. Classical Electrodynamics, 2nd ed. John Wiley, New York.
- Jonas, A. 1986. Reconstitution of high-density lipoproteins. Methods Enzymol. 128:553–582. [DOI] [PubMed] [Google Scholar]
- Kalé, L., R. Skeel, M. Bhandarkar, R. Brunner, A. Gursoy, N. Krawetz, J. Phillips, A. Shinozaki, K. Varadarajan, and K. Schulten. 1999. NAMD2: Greater scalability for parallel molecular dynamics. J. Comput. Phys. 151:283–312. [Google Scholar]
- Klon, A. E., M. K. Jones, J. P. Segrest, and S. C. Harvey. 2000. Molecular belt models for the apolipoprotein A-I Paris and Milano mutations. Biophys. J. 79:1679–1685. [DOI] [PMC free article] [PubMed] [Google Scholar]
- Klon, A. E., J. P. Segrest, and S. C. Harvey. 2002a. Comparative models for human apolipoprotein A-I bound to lipid in discoidal high-density lipoprotein particles. Biochemistry. 41:10895–10905. [DOI] [PubMed] [Google Scholar]
- Klon, A. E., J. P. Segrest, and S. C. Harvey. 2002b. Molecular dynamics simulations on discoidal HDL particles suggest a mechanism for rotation in the apo A-I belt model. J. Mol. Biol. 324:703–721. [DOI] [PubMed] [Google Scholar]
- Lebedev, N. N. 1965. Special Functions and Their Applications. Prentice Hall, Englewood Cliffs, NJ.
- Leitz, A., T. H. Bayburt, Y. V. Grinkova, I. G. Denisov, A. Barnakov, B. Springer, and S. G. Sligar. 2003. Functional reconstitution of seven-transmembrane proteins into a monodispersed Nanodisc system. Protein Sci. 12:269. (Abstr.) [Google Scholar]
- Luecke, H., B. Schobert, H. T. Richter, J. P. Cartailler, and J. K. Lanyi. 1999. Structure of bacteriorhodopsin at 1.55 A resolution. J. Mol. Biol. 291:899–911. [DOI] [PubMed] [Google Scholar]
- MacKerell Jr., A. D., D. Bashford, M. Bellott, R. L. Dunbrack Jr., J. D. Evanseck, M. J. Field, S. Fischer, J. Gao, H. Guo, S. Ha, D. Joseph-McCarthy, L. Kuchnir, K. Kuczera, F. T. K. Lau, C. Mattos, S. Michnick, T. Ngo, D. T. Nguyen, B. Prodhom, W. E. Reiher, III, B. Roux, M. Schlenkrich, J. C. Smith, R. Stote, J. Straub, M. Watanabe, J. Wiorkiewicz-Kuczera, D. Yin, and M. Karplus. 1998. All-atom empirical potential for molecular modeling and dynamics studies of proteins. J. Phys. Chem. B. 102:3586–3616. [DOI] [PubMed] [Google Scholar]
- Nolte, R. T., and D. Atkinson. 1992. Conformational analysis of apolipoprotein A-I and E-3 based on primary sequence and circular dichroism. Biophys. J. 63:1221–1239. [DOI] [PMC free article] [PubMed] [Google Scholar]
- Phillips, J. C., W. Wriggers, Z. Li, A. Jonas, and K. Schulten. 1997. Predicting the structure of apolipoprotein A-I in reconstituted high-density lipoprotein disks. Biophys. J. 73:2337–2346. [DOI] [PMC free article] [PubMed] [Google Scholar]
- Rogers, D. P., L. M. Roberts, J. Lebowitz, J. A. Engler, and C. G. Brouillette. 1998. Structural analysis of apolipoprotein A-I: effects of amino- and carboxy-terminal deletions on the lipid-free structure. Biochemistry. 37:945–955. [DOI] [PubMed] [Google Scholar]
- Saam, J., E. Tajkhorshid, S. Hayashi, and K. Schulten. 2002. Molecular dynamics investigation of primary photoinduced events in the activation of rhodopsin. Biophys. J. 83:3097–3112. [DOI] [PMC free article] [PubMed] [Google Scholar]
- Sachs, J. N., H. I. Petrache, and T. B. Woolf. 2003. Interpretation of small angle x-ray measurements guided by molecular dynamics simulations of lipid bilayers. Chem. Phys. Lipids. 126:211–223. [DOI] [PubMed] [Google Scholar]
- Segrest, J. P., D. W. Garber, C. G. Brouillette, S. C. Harvey, and G. M. Anantharamaiah. 1994. The amphipathic alpha helix: a multifunctional structural motif in plasma apolipoproteins. Adv. Protein Chem. 45:303–369. [DOI] [PubMed] [Google Scholar]
- Segrest, J. P., M. K. Jones, A. E. Klon, C. J. Sheldahl, M. Hellinger, H. De Loof, and S. C. Harvey. 1999. A detailed molecular belt model for apolipoprotein A-I in discoidal high density lipoprotein. J. Biol. Chem. 274:31755–31758. [DOI] [PubMed] [Google Scholar]
- Shaw, A. W., M. A. McLean, and S. G. Sligar. 2004. Phospholipid phase transitions in homogeneous nanometer scale bilayer discs. FEBS Lett. 556:260–264. [DOI] [PubMed] [Google Scholar]
- Svergun, D., C. Barberato, and M. H. J. Koch. 1995. CRYSOL: a program to evaluate x-ray solution scattering of biological macromolecules from atomic coordinates. J. Appl. Crystallogr. 28:768–773. [Google Scholar]
- Tajkhorshid, E., J. Baudry, K. Schulten, and S. Suhai. 2000. Molecular dynamics study of the nature and origin of retinal's twisted structure in bacteriorhodopsin. Biophys. J. 78:683–693. [DOI] [PMC free article] [PubMed] [Google Scholar]
- Tajkhorshid, E., and S. Suhai. 1999. Influence of the methyl groups on the structure, charge distribution and proton affinity of the retinal Schiff base. J. Phys. Chem. B. 103:5581–5590. [Google Scholar]
- Taya, K., K. Kubota, K. Ochiai, and K. Wakamatsu. 2002. Scattering study of assembled structure of phospholipid and detergent mixture. Trans. Materials Res. Soc. Japan. 27:605–608. [Google Scholar]
- Tristram-Nagle, S., and J. F. Nagle. 2004. Lipid bilayers: thermodynamics, structure, fluctuations, and interactions. Chem. Phys. Lipids. 127:3–14. [DOI] [PMC free article] [PubMed] [Google Scholar]