

Abstract
The conformation of the polysaccharide hyaluronan (HA) has been investigated by tapping mode atomic force microscopy in air. HA deposited on a prehydrated mica surface favored an extended conformation, attributed to molecular combing and inhibition of subsequent chain recoil by adhesion to the structured water layer covering the surface. HA deposited on freshly cleaved mica served as a defect in a partially structured water layer, and favored relaxed, weakly helical, coiled conformations. Intramolecularly condensed forms of HA were also observed, ranging from pearl necklace forms to thick rods. The condensation is attributed to weak adhesion to the mica surface, counterion-mediated attractive electrostatic interactions between polyelectrolytes, and hydration effects. Intermolecular association of both extended and condensed forms of HA was observed to result in the formation of networks and twisted fibers, in which the chain direction is not necessarily parallel to the fiber direction. Whereas the relaxed coil and partially condensed conformations of HA are relevant to the native structure of liquid connective tissues, fully condensed rods may be more relevant for HA tethered to a cell surface or intracellular HA, and fibrous forms may be relevant for HA subjected to shear flow in tight intercellular spaces or in protein-HA complexes.
INTRODUCTION
The polysaccharide hyaluronan (HA) is a linear polyanion, with the repeating disaccharide structure poly [(1→3)-β-d-GlcNAc-(1→4)-β-d-GlcA-]. HA is found primarily in the extracellular matrix and pericellular matrix, but has also been shown to occur intracellularly. The biological functions of HA include maintenance of the elastoviscosity of liquid connective tissues such as joint synovial fluid and eye vitreous, control of tissue hydration and water transport, supramolecular assembly of proteoglycans in the extracellular matrix, and numerous receptor-mediated roles in cell detachment, mitosis, migration, tumor development and metastasis, and inflammation (Balazs, 1968; Balazs and Denlinger, 1985; Laurent et al., 1996; Tammi et al., 2002; Day and Prestwich, 2002; Turley et al., 2002; Toole et al., 2002; Hascall et al., 2004).
The extensive repertoire of biological functions of HA suggest the existence of a correspondingly large repertoire of HA conformations and specific binding interactions. It is likely that the conformation is affected by the local environment, including ionic strength and specific ion interactions, local dielectric constant, excluded volume effects, tethering to surfaces and fixed macromolecular assemblies, exposure to perturbing mechanical forces, and presence of interacting species (including but not limited to proteins and lipids).
Studies of the solution properties of purified HA have provided a relatively clear view of the molecular conformation relevant to the hydrodynamic and mechanical properties of liquid connective tissues (Laurent and Gergely, 1955; Laurent et al., 1960; Cleland, 1984; Fouissac et al., 1993; Hayashi et al., 1995). In dilute solution, under physiological solvent conditions, HA chains adopt semiflexible random coil configurations, having an apparent persistence length of ∼5 nm. The chains occupy large hydrodynamic domains with a low density of chain segments, as a result of the: 1), high molecular weight of native hyaluronan; 2), local stiffness arising from the intrinsically large size of the monomeric units (sugar rings); 3), hindered rotations about the glycosidic linkages; and 4), dynamically formed and broken interresidue hydrogen bonds (Day and Sheehan, 2001; Cowman and Matsuoka, 2002). The dynamic nature of the chain conformation is evident in the observation of segmental motions on the nanosecond timescale, detected by NMR relaxation methods (Cavalieri et al., 2001; Cowman et al., 2001; Letardi et al., 2002) and predicted by molecular dynamics simulations (Almond et al., 1998, 2000).
In semidilute or concentrated solutions, the hydrodynamic domains of the hyaluronan chains overlap. Because the hydrodynamic domains of HA chains are so large, this can occur at quite low concentrations; for example, HA chains with a molecular weight of 3 × 10⁶ begin to overlap at a concentration of ∼0.6 mg/mL (Fouissac et al., 1993; Berriaud et al., 1998). The chains accommodate to one another by reducing domain size, allowing transient interpenetration of domains, and by transient intermolecular interactions, leading to altered hydrodynamic properties. The solution elastoviscosity is increased dramatically. Although this effect has been suggested to arise from formation of a network by intermolecular association, the changes in viscosity with increasing concentration or molecular weight are matched by a simple expression for polymer solution viscosity, which does not invoke entanglement or stable associations, and is equally applicable to rigid chain and flexible polymers (Kwei et al., 2000; Matsuoka and Cowman, 2002a,b). Recent studies of HA diffusion in semidilute solutions also lead to the conclusion that intermolecular association is not required to account for the diffusion coefficient dependence on concentration and molecular weight (Gribbon et al., 1999).
The above view of HA as a semiflexible random coil molecule must be reconciled with other evidence strongly suggesting that ordered conformations and stable self-association can exist under specific conditions: 1), in smooth muscle cells exposed to viral mimics or agents causing endoplasmic reticulum stress, HA is produced in the form of huge cable-like assemblies linking cells together, and having specific binding interactions with unactivated mononuclear leukocytes, thus mediating the inflammatory response (de la Motte et al., 2003; Majors et al., 2003; Hascall et al., 2004); 2) x-ray diffraction analysis of oriented fibers of HA show not only extended single helices, but also a double helical form, containing antiparallel chains (Guss et al., 1975; Winter et al., 1975; Sheehan et al., 1977; Winter and Arnott, 1977; Sheehan and Atkins, 1983; Arnott et al., 1983); 3), short segments of HA (having an average molecular weight of <∼15–20 × 103) can be shown to self-associate intermolecularly in aqueous NaCl solutions (Turner et al., 1988; Cowman et al., 1998a); and 4), electron microscopic and atomic force microscopic (AFM) studies show even high-molecular-weight HA has a strong tendency for intermolecular self-association when spread or sprayed on a mica surface. Continuous networks and fibers are usually formed, except at very low (<∼1–10 μg/mL) HA concentration (Hadler et al., 1982; Scott et al., 1990, 1991; Brewton and Mayne, 1992; Gunning et al., 1996; Cowman et al., 1998a; Jacoboni et al., 1999; Al-Assaf et al., 2002; McIntire and Brant, 2002; Scott et al., 2003). The network formation can be inhibited by specific and nonspecific protein binding to HA (Fessler and Fessler, 1966; Mörgelin et al., 1988; Brewton and Mayne, 1992). Because the physicochemical properties of high-molecular-weight HA in solution do not indicate stable intermolecular self-association under the same conditions, the networks are created on the surface during the sample preparation. These data should therefore be viewed as an indication of the potential for self-association under appropriate perturbing conditions.
Different AFM sample preparation and analysis techniques favoring the observation of isolated HA molecules can give an alternative view of the conformation of HA. Under ambient conditions, the surface of mica is covered by a layer of partially structured water (Israelachvili and Pashley, 1983; Hu et al., 1995a,b; Beaglehole, 1997; Xu et al., 1998; Miranda et al., 1998; Bluhm et al., 2000; Cantrell and Ewing, 2001; Cheng et al., 2001; Spagnoli et al., 2003) This thin water layer has been found to allow scanning tunneling microscopy and scanning electrochemical microscopy imaging of biological macromolecules without metallic coating (Guckenberger et al., 1994; Fan et al., 1995; Heim et al., 1997; Fan and Bard, 1999). In previous studies (Cowman et al., 1998a,b, 2000; Spagnoli et al., 2003), we used tapping mode AFM in air to examine isolated HA deposited on hydrated mica surfaces from dilute and semidilute aqueous solutions. In this study, we manipulate the interaction of HA with the surface and the water layer, revealing the potential for a wide variety of molecular conformations. HA can be visualized in extended forms, relaxed forms bearing significant helical character, and specific condensed forms. Ordered intermolecular associations based on extended and condensed forms are also documented. These differing shapes and assemblies may be relevant to the role of HA in specific environments in vivo. A preliminary account of some of this work has been presented (Cowman et al., 2002).
MATERIALS AND METHODS
Bacterial hyaluronan of low (∼1 × 10⁵), moderate (∼4–5 × 10⁵), and high (∼5 × 10⁶) average molecular weight was obtained from Genzyme (Cambridge, MA). Additional high average molecular weight (2.2 × 10⁶) bacterial HA was obtained from Sigma Chemical (St. Louis, MO). Pig skin HA with an average molecular weight of 1.5 × 10⁵ was obtained from Seikagaku Kogyo (Tokyo, Japan) Hylan A, a high (∼2–6 × 10⁶) molecular weight hyaluronan isolated under conditions that can result in limited cross-linking, was obtained from Biomatrix (Ridgefield, NJ). Except for the lowest molecular weight samples, all of the average molecular weights were determined by agarose gel electrophoresis or viscometry (Lee and Cowman, 1994). The identity of the HA sample used for each of the presented images is given in the figure legends, but we found no significant difference in behavior among the samples, except for some molecular weight dependence, as noted in the text. Each sample was dissolved and stored at 4°C, at a concentration of 0.5–1.0 mg/mL in H2O or 0.15 M NaCl solution. For the high-molecular-weight samples, the above stock solution concentration is close to or above the coil overlap concentration, at which the domains of isolated HA chains begin to interpenetrate. A secondary stock solution, from which final dilutions for AFM studies are to be made, should be well below this value to avoid excessive entanglements of the chains on the surface. The secondary stock solution should furthermore be equilibrated for a sufficient time to allow complete separation of the polymeric chains. (We use secondary stock solutions of ∼0.1 mg/mL, prepared weekly by dilution with H2O or 0.15 M NaCl, and have found that overnight equilibration after dilution is sufficient.) Subsequent dilutions, for example, to 2–10 μg/mL, in the presence of 10 mM MgCl2, were done on the day of analysis.
Mica was either: 1), freshly cleaved or 2), prehydrated after cleavage by storage under ambient temperature and humidity, protected from dust, for a period of at least 16 h before use. A 4-μL drop of HA solution was applied to the mica surface, allowed to interact for 30–120 s, then rinsed with H2O and dried under a gentle stream of dry N2. The movement of water droplets across the surface during drying can result in extension of HA molecules on the surface (molecular combing).
The AFM instrument was a multimode scanning probe microscope equipped with the type EV scanner, and Nanoscope IIIa controller (Veeco Instruments, Woodbury, NY). Images were obtained in air at ambient temperature and humidity, over a range of ∼30–60% relative humidity. Imaging under water was not achieved, due to the intrinsically poor adhesion of HA to mica. Imaging of HA on mica under butanol has been reported by Gunning et al. (1996) and Al-Assaf et al. (2002), where the butanol is used to inhibit HA solubility. The tapping mode was employed, using etched silicon probes of 125-μm nominal length, at a drive frequency of ∼300 kHz. The root mean square voltage for the free amplitude of the probe in air was set to 2.5–3.0 V. The large free amplitude was chosen specifically to aid imaging of the thin HA molecules through a water layer on mica surfaces. The amplitude set point value used was always ∼1 V lower, which corresponded to the highest value (i.e., lowest force) possible to retain contact with the surface. Data were recorded at a scan rate of 1–3 Hz, and stored in 256 × 256 pixel format. Images were processed using the Nanoscope version 4.43r8 software. For images to be used in measuring heights, only zero-order flattening was used. For image presentation, first-order flattening was used unless otherwise indicated. Contrast enhancement was used where indicated (parameters as follows: equalization 0, background removal 9, neighborhood size 16).
RESULTS
Extended forms of HA on prehydrated mica surfaces
Fig. 1 shows two examples of AFM images of HA chains in extended conformations. The nearly linear chain aspect is most commonly observed under the following conditions: 1), a sample preparation procedure that results in forced extension of the HA chain by molecular combing; 2), addition of 10 mM MgCl2 to the sample to reduce electrostatic repulsion between the polysaccharide and the surface; and 3), prehydration of the mica surface at ambient humidity, to create a layer of structured water before sample deposition (previously characterized by Spagnoli et al., 2003). In the absence of a preformed layer of structured water, extended forms of HA are much less commonly observed (see below).
FIGURE 1.
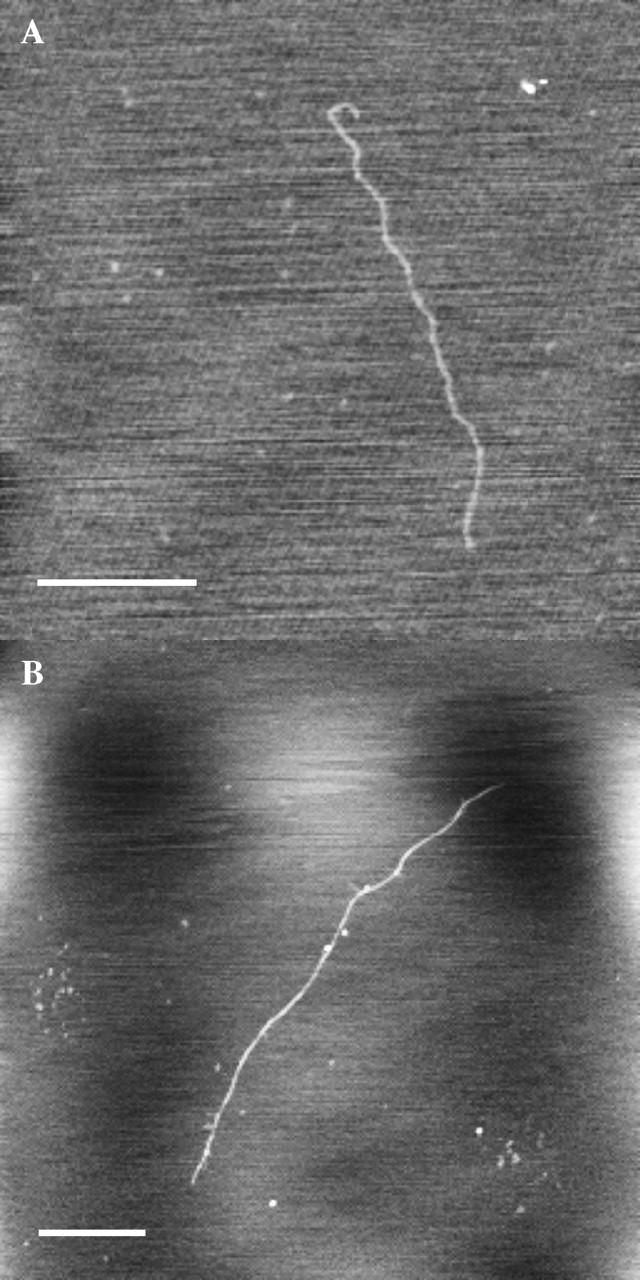
Extended conformations resulting from molecular combing in HA deposited on prehydrated mica, observed in tapping-mode atomic force microscopy (TMAFM) height images. Bar = 500 nm. Z range 1–2 nm. (A). Low molecular weight bacterial HA deposited from 7 μg/mL solution in 10 mM MgCl2. (B) Low molecular weight pig skin HA deposited from 2 μg/mL solution in 10 mM MgCl2.
The average height of HA chains in the extended form is ∼0.5–0.6 nm, relative to the apparent surface. This is in good agreement with the expected diameter of an HA chain. The chain height is uniform along the contour length of each chain, suggesting that the chains are fully extended. The conformation of an extended HA chain is likely to be similar to one of the extended single helices documented by x-ray diffraction analysis of pulled fibers of HA. The known single helix structures have 2, 3, or 4 disaccharide units per turn of the helix, and an extension of 0.85–0.98 nm per helical repeat. The polydispersity of our samples precludes use of the contour length to calculate the exact degree of chain extension.
The extended conformation is not compatible with the solution properties of HA in neutral aqueous salt solutions. The images are therefore not projections of the three-dimensional chain configuration in solution, which would occur if the chains had sufficiently strong affinity for the surface (“stick where they touch”) that subsequent rearrangement could not occur. The chain configurations are also not two-dimensional equilibrated forms of the polysaccharide, which would reflect the intrinsically short persistence length of ∼5–20 nm observed in aqueous solutions of differing ionic strength. This means that the chain conformation is significantly affected both by the extensional force applied, and by the subsequent moderately strong interaction with the surface, which prohibits equilibration.
Loosely coiled forms of HA on prehydrated mica surfaces
Fig. 2 shows four examples of loosely coiled HA chains imaged after deposition on prehydrated mica. These chains may not have been subjected to sufficient molecular combing forces for extension after deposition (possibly as a result of strong attachment to the water layer before combing, or the short length of some chains). Alternatively, significant relaxation may have occurred. The HA molecules exhibit curved segments, with radius of curvature of ∼20–60 nm. The chains show little variation in height along the contour length, and the heights are close to the expected chain diameter of ∼0.5–0.6 nm.
FIGURE 2.

Partial relaxation with marked curvature in HA deposited on prehydrated mica, observed in TMAFM height images. Bar = 250 nm. Z range 1–1.8 nm. (A) Low molecular weight bacterial HA deposited from 5 μg/mL solution in 10 mM MgCl2. (B) Low molecular weight bacterial HA deposited from 100 μg/mL solution in 30 mM NaCl (C) High molecular weight bacterial HA deposited from 2 μg/mL solution in 10 mM MgCl2. (D) Low molecular weight pig skin HA deposited from 2 μg/mL solution in 10 mM MgCl2.
Relaxed coil forms of HA on freshly cleaved mica
We have observed that it is more difficult to obtain clear images of HA after deposition on freshly cleaved mica, even in the presence of 10 mM MgCl2 to aid attachment to the surface. Frequently, the HA chains appear to be of very low height (0.2–0.4 nm), even if located physically close to a (much less common) prominent HA chain having the characteristic appearance described above for an extended or partially relaxed form, lying on top of the structured water layer. The clear inference is that the low-height chains are located within the water layer. The low apparent height is an artifact of the instrumental difficulty encountered in defining the surface position in the presence of structured water.
A second characteristic of the low-height chains is their coiled configuration. Fig. 3, A and B, show images containing multiple randomly coiled chains, which are reasonably compatible with the known solution properties of HA. An ensemble average conformation of loosely coiled structures like those seen here would be expected to result in the theoretical Gaussian distribution of chain segments for a random coil polymer model. Thus, these relaxed coil forms of HA provide a good mental image for the type of instantaneous chain configurations adopted by HA in dilute aqueous solution. No calculation of persistence length has been made from these images, because the number of chains observed in this way has been too small, the effective ionic strength and dielectric constant at the surface are not known, and the extent of conformational equilibration within the structured water layer is not known. Therefore the comparison to solution properties is made for qualitative purposes only.
FIGURE 3.
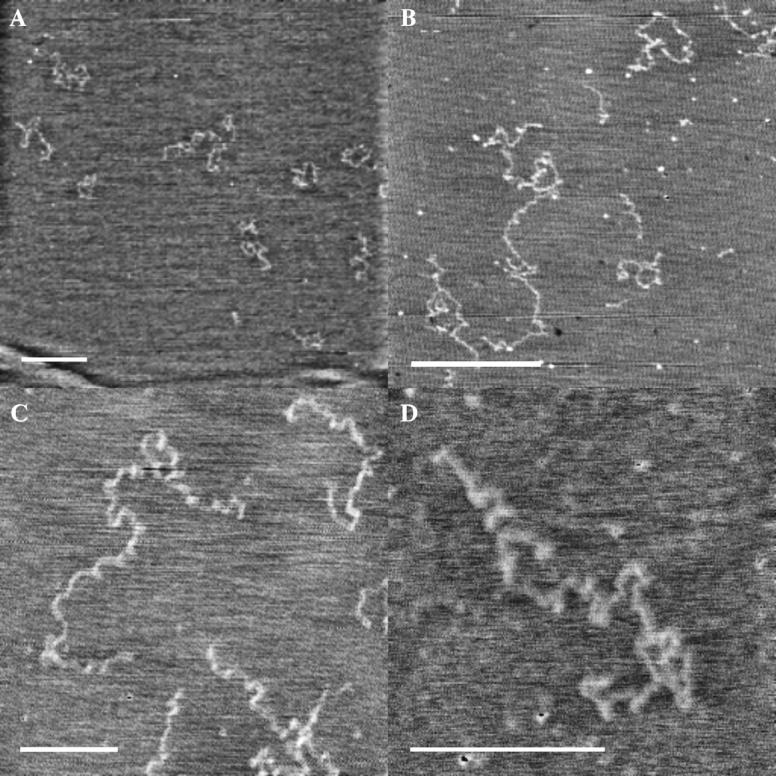
Relaxation to coiled conformations in HA deposited on freshly cleaved mica, observed in TMAFM height images. Images were contrast enhanced. Bar = 500 nm. Z range 1–1.3 nm (A) High molecular weight bacterial HA deposited from 5 μg/mL solution in 10 mM MgCl2. (B) High molecular weight bacterial HA deposited from 10 μg/mL solution in H2O. (C) High molecular weight bacterial HA deposited from 10 μg/mL solution in H2O. (D) High molecular weight rooster comb hylan A deposited from 5 μg/mL solution in 10 mM MgCl2.
Fig. 3, C and D, show coiled chains with an apparent repeated curvature, possibly reflecting a weak helical bias in the chain direction. The chain conformations appear to be relaxed forms of the extended helices observed by x-ray diffraction, rather like the relaxed helix of a telephone cord relative to a stretched cord. However, the number of residues in a coil turn of perhaps 100-nm length, corresponding to ∼100 disaccharide repeats, has no clear correspondence to the 3–4 disaccharides per turn observed in the solid state by x-ray diffraction. The helical bias can result from an intrinsic tendency for curvature in chain direction. It should be noted that the chains, if helical in tendency, are flattened by being trapped within the finite thickness of the water layer on mica. Thus the thin (<∼2 nm) layer of water forces HA chains to spread horizontally rather than vertically from the surface.
The images of loosely coiled HA chains deposited on freshly cleaved mica frequently require contrast enhancement, because the partially structured water layer interferes with the ability to image the HA chains. The HA chains are not strongly immobilized within the partially structured water layer; chain movement is sometimes seen during scanning. The HA appears to act as a defect in the water structure, which is formed at the same time as the deposition of the HA on the freshly exposed mica surface.
Condensed forms of HA on mica
The intrinsic affinity of HA for mica is weak, especially in the absence of a preformed structured water layer. The electrostatic repulsion between mica and polyanionic HA may be poorly masked by the concentrations of MgCl2 (10 mM) or NaCl (0–150 mM) used in our imaging experiments. The low affinity for the surface can result in configurations that range from loosely coiled forms of HA to partially or completely condensed chain configurations. Fig. 4, A–F, show images of HA with varying degrees of condensation. Such structures can be seen on either freshly cleaved or prehydrated mica, but are most commonly seen on the former.
FIGURE 4.
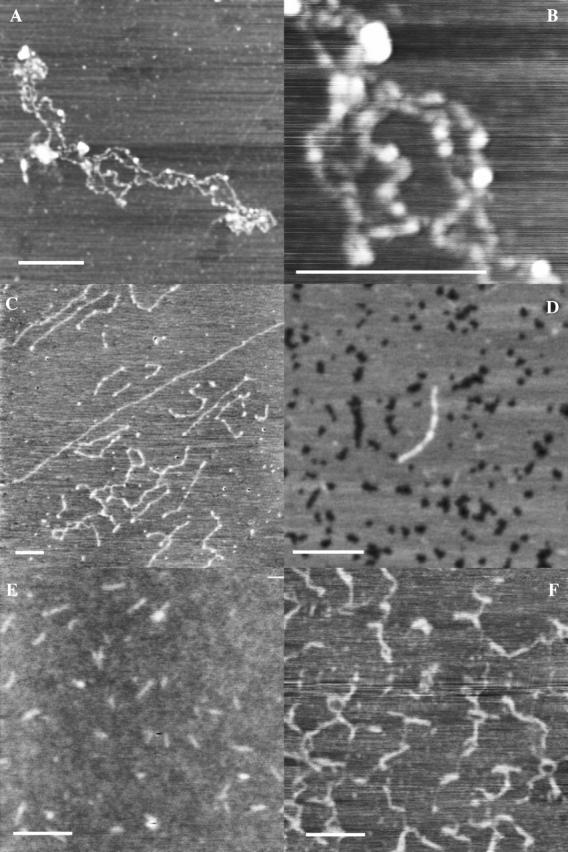
Condensation to pearl necklace or rodlike forms in HA deposited on either freshly cleaved or prehydrated mica, observed in TMAFM height images. Bar = 250 nm. Z range 1.5–3 nm. (A) High molecular weight rooster comb hylan A deposited from 5 μg/mL solution in 10 mM MgCL2. (B) Higher magnification image of same sample as in image A. (C) High molecular weight bacterial HA deposited from 10 μg/mL solution in H2O. (D) Moderate molecular weight bacterial HA deposited from 100 μg/mL solution in 15 mM NaCl. (E) Moderate molecular weight bacterial HA deposited from 5 μg/mL solution in H2O. (F) High molecular weight rooster comb hylan A deposited from 500 μg/mL solution in 0.15 M NaCl.
A frequent characteristic of partially condensed HA chains is the pearl necklace appearance, as seen in Fig. 4, A–B. The chains have thin segments alternating with higher globular features. The chains in Fig. 4 C appear to shorten in contour length as the number and frequency of globular features increases. Chains that are nearly fully condensed (Fig. 4 D) are thicker than single chains of HA, with the thick portions of the rods generally having a height of ∼0.8 ± 0.4 nm. This approximates the thickness of two chains.
Chains that appear to be fully condensed are seen in Fig. 4, E–F. The moderate-molecular-weight (∼4 × 10⁵) HA chains appear as short stiff chains. The width of the rodlike form is artifactually broadened by the finite width of the probe tip, but an estimate of ∼6 nm can be obtained from the measured width of 20 ± 5 nm, assuming a tip width of 14–16 nm (Margeat et al., 1998). The degree of linear condensation can be roughly estimated as ∼10- to 20-fold, by comparison of the expected average contour length for a given sample with the length of the condensed form. A very high molecular weight (∼6 × 10⁶) modified HA (hylan A) forms longer, less rigid, possibly imperfectly condensed, wormlike chains upon condensation.
Frequency of observation of different forms
Considering only isolated (nonaggregated) HA chains, the frequency of observation of each of the characteristic conformations of HA on mica was as follows: 1), on prehydrated mica, for 156 chains imaged, ∼80% of chains were extended or loosely coiled, <5% were relaxed coils, and ∼20% were substantially or completely condensed; 2), on freshly cleaved mica, for 366 chains imaged, <5% were extended or loosely coiled, ∼30% were relaxed coils, and ∼70% were substantially or completely condensed.
Intermolecular aggregation of condensed HA chains
The condensed forms of HA frequently exhibit further aggregation, especially in areas of local high concentration formed during sample drying. Loose clumps and fibrillar assemblies are seen in Fig. 5, A–D. The short rods of Fig. 5, A and B, show limited side-by-side association, and many single point contacts. The longer condensed HA chains of Fig. 5, C and D, also associated by twisting around each other, to form fibrillar assemblies, in which the HA chain direction was not constrained to be parallel to the fibril direction.
FIGURE 5.

Intermolecular aggregation of intramolecularly condensed chains of HA deposited on freshly cleaved mica, observed in TMAFM height images. Bar = 250 nm. Z range 2.5–6 nm. (A) Moderate molecular weight bacterial HA deposited from 10 μg/mL solution in H2O. (B) Moderate molecular weight bacterial HA deposited from 10 μg/mL solution in H2O. (C) High molecular weight bacterial HA deposited from 5 μg/mL solution in 10 mM MgCl2. (D) High molecular weight rooster comb hylan A deposited from 500 μg/mL solution in 0.15 M NaCl.
Intermolecular aggregation of extended HA chains
When HA is deposited on mica from a high concentration, and/or allowed to dry before rinsing away loosely bound material, the local concentration becomes quite high. Under these conditions, HA is well known to form networks on mica. Fig. 6 A shows that the network contains globular deposits of HA, linked by extended chain segments. HA molecules having segments immobilized in two or more different globules become extended by the self-association process driving the globule formation (Fig. 6, B and C). It is interesting to note that adjacent extended chain segments appear to twist around each other (with an apparent left-handed chirality in Fig. 6 B), to form fibrils in which the HA chain directions are nearly coincident with the fibril direction. Formation of this type of fibril requires the application of a force to extend the HA molecules (Marszalek et al., 2001), and is fundamentally different from the process by which fibrils form from condensed HA as described above.
FIGURE 6.

Network showing twisted fibrils formed by extension of chain segments between globules of HA deposited on freshly cleaved mica and not rinsed before drying, observed in TMAFM height images. Bar = 500 nm. (A) High molecular weight bacterial HA deposited from 100 μg/mL solution in H2O. Z range 15 nm. (B) High molecular weight bacterial HA deposited from 100 μg/mL solution in H2O. Z range 2.3 nm. (C) High molecular weight bacterial HA deposited from 100 μg/mL solution in H2O. Z range 2.4 nm.
DISCUSSION
Extended versus relaxed forms of HA: the role of structured water on mica surfaces in determining macromolecular conformation
It is generally understood that mica should be freshly cleaved before use in sample preparation for AFM or electron microscopic studies, to obtain a clean, hydrophilic surface. Upon cleavage, a negatively charged surface is obtained, as a result of partial loss of the potassium ions at the cleavage plane. The surface begins to take up water from the air, but the rate of surface hydration is not controlled. Recently we used AFM to image the formation of a structured water layer on mica at room temperature (Spagnoli et al., 2003). The induction time for the appearance of the ordered layer was variable, but growth proceeded rapidly once structure was nucleated. The depth of the structured part of the water layer (but not the unstructured part, if present, because its depth is not determinable by AFM) was measured by tapping mode AFM, and ranged from a buckled monolayer with an apparent height of 0.33 ± 0.04 nm to multiple layers with a total depth of ∼1.5 nm.
In AFM studies of DNA, it has been found that a dry atmosphere is preferred for imaging (Hansma et al., 1995). On the other hand, the presence of the water layer on mica has been exploited by Guckenberger and co-workers (Guckenberger et al., 1994; Heim et al., 1997) and Bard and co-workers (Fan et al., 1995; Fan and Bard, 1999) to allow imaging of biological macromolecules by scanning tunneling microscopy and scanning electrochemical microscopy without metallic coating being required, due to the conductivity of the water layer. The depth of the water layer in those studies was thought to be <∼0.5 nm, in which DNA with a diameter of 2 nm would be only partially submerged.
For HA and other thin, single-stranded biopolymers (even single-stranded DNA or RNA), the water layer can have a much more important role in determining the molecular characteristics. HA has a diameter of only ∼0.5–0.6 nm. It can therefore be located completely within a structured or partially structured water layer on a mica surface. We have found that we obtain characteristically different images of HA, depending on the hydration of the mica surface and the extent of water layer structure formation before sample deposition.
If a mica surface was allowed to prehydrate under ambient conditions for a suitable period (e.g., overnight) before sample deposition, HA chains were frequently imaged lying on top of a corrugated surface, which is identified as the structured portion of the water layer, with “holes” induced by the heating due to repeated scanning. (The use of the lightest possible tapping force, consistent with the large tapping amplitude that allows penetration of the water layer even at high humidity, is advantageous in imaging both the structured water and the polysaccharide chains.) In the absence of the corrugated appearance, the status of the surface hydration layer is not determined. An apparently smooth surface can be interpreted as either a mica surface with only unstructured water, or a surface having a complete layer of structured water. The HA chain height, measured relative to the top of a corrugated structured water layer, is in agreement with expectation for single chains, indicating that the HA chains are located on top of one or more layers of the structured water. The extent to which the HA chain is also surrounded by unstructured water is not known.
An extended conformation is favored for HA deposited on the structured water layer of prehydrated mica. This conformation is attributed to a process termed “molecular combing” (Bensimon et al., 1994; Allemand et al., 1997; Li et al., 1998). Inhibition of recoil is proposed to result from interaction of HA with the structured water layer. The persistence length of such a chain conformation, when caused by orientation and stretching, is larger than that characteristic of the macromolecule in solution (Stokke and Brant, 1990; Stokke and Elgsaeter, 1994; McIntire et al., 1995; Adams et al., 2003). The two-dimensional excluded volume effect, in which chain overlap is disfavored, also constrains the chains to structures with apparently increased persistence length (Rivetti et al., 1996).
Deposition of HA solutions on freshly cleaved mica, lacking the preformed layer of structured water, results in a different characteristic appearance. Chain configurations that are more compact and difficult to image are commonly observed. A weak helical tendency is apparent. The chains are trapped within a thin layer of partially structured water. This pseudo-two-dimensional trapping also results in an exaggerated persistence length (Bednar et al., 1995). The local environment in the thin water layer is not completely understood. Water at surfaces has a greater viscosity and lower dielectric constant than bulk water (Etzler, 1983). Fujimoto and Schurr (2002) point out that the effective ionic strength at the surface is not known, and that ionic distributions may show correlation effects. Additionally, these authors show that the conformation of a chain trapped in a thin water layer should favor the lowest energy form. This latter effect is conceptually similar to a reduction in temperature. Thus a semiflexible macromolecule like HA, which may have a large number of accessible conformations when free in solution, could favor a single low-energy conformation when trapped on a surface.
Intramolecularly condensed forms of HA: mechanisms for intramolecular condensation of polyelectrolytes on surfaces
HA on mica surfaces, regardless of the state of surface prehydration, oftens shows a strong tendency for intramolecular condensation. The characteristic forms we have seen by AFM are globules, pearl necklace arrays of subglobules, and varying degrees of ordered condensation leading to rodlike forms. The detailed molecular arrangements within the condensed structures are not yet known, but the condensed forms of HA are highly reminiscent of condensed forms of other macromolecules, including DNA. It is therefore useful to consider the theoretical explanations developed for the condensation of DNA and other polymers (recently reviewed by Bloomfield, 1998).
The solubility of a polyelectrolyte is enhanced by favorable enthalpic interactions between the polymer and solvent, by the entropic contributions favoring a statistically random polymer chain configuration, by the mixing entropy for polymer and solvent, and by electrostatic repulsion between charged groups on the polymer. Intramolecular condensation of a polyelectrolyte chain in solution is thought to occur when the polymer concentration is dilute and one of three types of conditions are met. These include: 1), near complete neutralization of polyelectrolyte charges by multivalent (+3 or higher) ions, 2), low dielectric constant (e.g., in aqueous-organic mixed solvents) and sufficient concentrations of (usually) divalent ions, or 3), high excluded volume, due to the presence of other species like polyethylene glycol, and sufficient mono- or higher-valent counterion concentrations to minimize repulsion. The effective neutralization of the polyelectrolyte charges in each case is almost but not quite complete. The counterions are localized to the immediate vicinity of the polyelectrolyte chain, but are not generally site bound. There are several models to explain the appearance of an attractive electrostatic force between segments of like-charged polyelectrolytes. Among these are: 1), an attraction arising from correlated fluctuations in position of condensed counterions on the polyelectrolytes (analogous to induced dipole–induced dipole interactions) (Oosawa, 1968; Ha and Liu, 1997), 2), sharing of counterions between chain segments, leading to an increased entropy for the counterions relative to their more restricted locations in a thin shell surrounding each separate chain segment (Ray and Manning, 1994), and 3), matching of lattices of counterions formed around separate chain segments, so that holes in one lattice are matched by counterions in a second lattice (Rouzina and Bloomfield, 1996). If the polyelectrolyte has specific site binding of the counterions, complementary arrays of charges from the polymer and the counterion could exist, leading to an “electrostatic zipper” mode of association (Sitko et al., 2003).
In addition to the attractive electrostatic interaction, a hydration contribution to polyelectrolyte condensation has been proposed. Highly hydrophilic polymers can structure the water in their immediate environment. In a manner conceptually similar to the hydrophobic effect, the hydration effect results in increased entropy for water molecules freed by association of two polymer segments. The associated polymer surfaces can retain one or more layers of water bridging between the polymers. An interesting aspect of this contribution to polyelectrolyte condensation is that chaotropic ions that disrupt bulk water structure will favor polymer condensation, because the entropic difference between bound water and bulk water is increased.
The effect of surface interactions on the condensation of polyelectrolytes is less well understood. By consideration of the driving forces for condensation in solution, it may be proposed that condensation would be favored if the polyelectrolyte is poorly solvated by the structured water at the surface, if counterion condensation leads to a more complete charge neutralization, if reduction in the effective dielectric constant increases the strength of attractive interactions due to correlated ion fluctuations, and if the polyelectrolyte-polyelectrolyte interactions are more favorable than surface-polyelectrolyte interactions.
Intramolecularly condensed forms of HA: morphologies for intramolecular condensation of polyelectrolytes on surfaces
There are several characteristic morphologies for intramolecularly condensed polyelectrolytes (Fig. 7). Polyelectrolytes having complete charge neutralization, like uncharged polymers in poor solvents, can collapse to toroids, rods, or spherical globules (Dobrynin et al., 1996; Vasilevskaya et al., 1997; Noguchi and Yoshikawa, 1998). The adopted form is dependent on the polymer stiffness. Moderately or highly charged polyelectrolytes in poor solvents retain too much intramolecular electrostatic repulsion to form spherical globules, and prefer extended cylinder or pearl necklace forms, in which multiple regularly spaced subglobules are separated by thin connecting segments (Dobrynin et al., 1996; Solis and Olvera de la Cruz, 1998). This form minimizes solvent exposure and electrostatic repulsion, but retains maximal short range attractive interactions between polymer segments. The most interesting morphologies are found for polyelectrolytes with nearly complete (perhaps 90%) charge neutralization. Even in good solvents, toroids or thin rods may form, depending on chain stiffness (Noguchi and Yoshikawa, 1998; Stevens, 2001). In the rods, more flexible chains are believed to be folded with relatively sharp turns at the fold points. The chain segments generally interact in a loosely packed side-by-side manner (although this would not exclude double helical folds). The counterions are trapped between chain segments, and the above-described attractive electrostatic interactions stabilize the condensed form (Vasilevskaya et al., 1997; Stevens, 2001). The thin rods are seen as quite extended, apparently stiff structures. They are especially favored in low dielectric solvents. The alternative toroid form is seen for stiffer polyelectrolytes with near complete charge neutralization. The polymer chain can have a minimum favored loop size for condensation, leading to the adoption of a short cylindrical structure containing packed loops (Hud et al., 1995; Bloomfield, 1998; Stevens, 2001; Hud and Downing, 2001; Sitko et al., 2003; Conwell et al., 2003). For DNA, the toroids are pseudohexagonally packed arrays of hydrated chain loops.
FIGURE 7.

Possible modes of hyaluronan polyelectrolyte condensation.
Experimental AFM observations of intramolecularly condensed polyelectrolytes confirm the above predictions. Stiff double-stranded DNA forms toroids or, less commonly, thin rods (Lyubchenko et al., 1992; Allen et al., 1997; Hansma et al., 1998; Golan et al., 1999; Sitko et al., 2003; Danielson et al., 2004). Circular supercoiled DNA forms flattened loops, which then can form toroids (Dunlap et al., 1997). Under some conditions, DNA toroids or rods are not uniformly smooth, but show globular substructure (Hansma et al., 1996; Golan et al., 1999). DNA decondensing upon exit from a viral capsid also shows the pearl necklace morphology (Serwer and Hayes, 2001). The same types of condensation have been seen for other polymers. The stiff double-stranded polysaccharide xanthan forms mainly toroids (Maurstad and Stokke, 2004). More flexible polyelectrolytes, presumably having increased counterion condensation when bound to surfaces rather than free in solution, tend toward the spherical globule and pearl necklace forms. Such forms have been observed for single-stranded DNA and RNA (Hansma et al., 1996; Fritz et al., 1997; Rivetti et al., 1998), mucins (Round et al., 2002), and the single-stranded forms of the polysaccharides amylose, carrageenan, scleroglucan, low-molecular-weight acetan, and HA (Vuppu et al., 1997; Ridout et al., 1998; McIntire and Brant, 1999, 2002; Cowman et al., 2000; Gunning et al., 2003).
In this study, the condensed forms adopted by HA on mica show that HA is poorly attracted to mica, even in the presence of 10 mM MgCl2. The partially structured water environment, with the consequent changes in ionic interactions, may also promote the intramolecular association of HA. Considering the above description of condensed forms seen for other polyelectrolytes, the globular, pearl necklace, and rodlike forms of HA are compatible with the collapse of a semiflexible polymer chain. An alternative mode of condensation, however, may also be considered. The loose helical appearance of relaxed HA chains could be part of a transition from statistically random solution conformations to ordered condensed forms. In such a case, the rodlike form of HA could exist as a cylindrical helix, rather than a repeatedly folded chain. The 10- to 20-fold reduction in length could thus correspond to helical tubes having diameters of 1.6–3.2 nm, or widths of 2.5–5 nm if flattened by the tapping motion of the AFM tip. This flattened form is in accord with the estimated width of ∼6 nm, and height equal to that of two chains. Further experiments are required to address this question.
Intermolecular association of HA on surfaces
HA was observed to form intermolecular aggregates on mica surfaces. Intramolecularly condensed HA chains form loose aggregates and twisted fibrillar associations. Fibrillar aggregates with extended HA chains can also form where molecular combing causes chains to touch, or globule formation by HA pulls chains into extended forms (Gunning et al., 1996; Cowman et al., 1998a, 2000; Jacoboni et al., 1999; McIntire and Brant, 2002; Al-Assaf et al., 2002).
The intermolecular association of polyelectrolytes is commonly observed in nondilute solutions, under the same ionic and solvent conditions that cause intramolecular condensation in dilute solution. The most favored forms of association are fibrous and network, built by side-by-side associations. Combinations of forms, such as intramolecularly condensed toroidal or globular segments interspersed with fibrous associations are also possible.
Relevance of AFM observations to the physiological roles of HA
AFM has allowed the imaging of a wide variety of HA structures. Extended chains resulting from extensional forces, relaxed chains with a possible helical bias, chains exhibiting varying degrees of condensation into globular and rodlike forms, and intermolecular associations based on the extended or condensed forms have been observed. Each of these structures may be represented in the physiological environments in which HA is found. HA in liquid connective tissues and the extracellular matrix of cartilage is probably well modeled by the relaxed coil forms of HA (where dilute) or condensed forms (where excluded volume effects are significant). HA in tight spaces between cells (Scott et al., 2003) or bound to cell surface receptors may undergo forced extension and subsequent fibrillar association under the influence of fluid flow. In the absence of extensional forces or specific protein-induced conformational changes, intracellular HA, being in a crowded environment, is likely to adopt a condensed form. The crowded environment of HA bound to the cell surface may also explain the observed difference between free HA and cell surface HA in binding to crystals of calcium-(R,R)-tartrate tetrahydrate (Zimmerman et al., 2002). Further investigations into the details of the HA conformation in such environments will be useful in understanding its physiological roles.
Acknowledgments
Portions of this work were presented at the Hyaluronan 2003 Conference, Cleveland, Ohio, October 11–16, 2003.
This work was supported by Biomatrix and its successor Genzyme Biosurgery, and by the Matrix Biology Institute.
References
- Adams, E. L., P. A. Kroon, G. Williamson, and V. J. Morris. 2003. Characterisation of heterogeneous arabinoxylans by direct imaging of individual molecules by atomic force microscopy. Carbohydr. Res. 338:771–780. [DOI] [PubMed] [Google Scholar]
- Al-Assaf, S., G. O. Phillips, A. P. Gunning, and V. J. Morris. 2002. Molecular interaction studies of the hyaluronan derivative, hylan A, using atomic force microscopy. Carbohydr. Polym. 47:341–345. [Google Scholar]
- Allemand, J.-F., D. Bensimon, J. Jullien, A. Bensimon, and V. Croquette. 1997. pH-dependent specific binding and combing of DNA. Biophys. J. 73:2064–2070. [DOI] [PMC free article] [PubMed] [Google Scholar]
- Allen, M. J., E. M. Bradbury, and R. Balhorn. 1997. AFM analysis of DNA-protamine complexes bound to mica. Nucleic Acids Res. 25:2221–2226. [DOI] [PMC free article] [PubMed] [Google Scholar]
- Almond, A., A. Brass, and J. K. Sheehan. 1998. Deducing polymeric structure from aqueous molecular dynamics simulations of oligosaccharides: predictions from simulations of hyaluronan tetrasaccharides compared with hydrodynamic and x-ray fibre diffraction data. J. Mol. Biol. 284:1425–1437. [DOI] [PubMed] [Google Scholar]
- Almond, A., A. Brass, and J. K. Sheehan. 2000. Oligosaccharides as model systems for understanding water-biopolymer interaction: hydrated dynamics of a hyaluronan decamer. J. Phys. Chem. B. 104:5634–5640. [Google Scholar]
- Arnott, S., A. K. Mitra, and S. Ragunathan. 1983. The hyaluronic acid double helix. J. Mol. Biol. 169:861–872. [DOI] [PubMed] [Google Scholar]
- Balazs, E. A. 1968. Viscoelastic properties of hyaluronic acid and biological lubrication. Univ. Mich. Med. Ctr. J. (Suppl.): 255–259. [PubMed]
- Balazs, E. A., and J. L. Denlinger. 1985. Sodium hyaluronate and joint function. J. Equine Vet. Sci. 5:217–228. [Google Scholar]
- Beaglehole, D. 1997. Aspects of vapor adsorption on solids. Physica A. 244:40–44. [Google Scholar]
- Bednar, J., P. Furrer, V. Katritch, A. Z. Stasiak, J. Dubochet, and A. Stasiak. 1995. Determination of DNA persistence length by cryo-electron microscopy. Separation of the static and dynamic contributions to the apparent persistence length of DNA. J. Mol. Biol. 254:579–594. [DOI] [PubMed] [Google Scholar]
- Bensimon, A., A. Simon, A. Chiffaudel, V. Croquette, F. Heslot, and D. Bensimon. 1994. Alignment and sensitive detection of DNA by a moving interface. Science. 265:2096–2098. [DOI] [PubMed] [Google Scholar]
- Berriaud, N., M. Milas, and M. Rinaudo. 1998. Characterization and properties of hyaluronic acid (hyaluronan). In Polysaccharides in Medicine and Biotechnology. D. Severian, editor. Marcel Dekker, New York. 313–334.
- Bloomfield, V. A. 1998. DNA condensation by multivalent cations. Biopolymers. 44:269–282. [DOI] [PubMed] [Google Scholar]
- Bluhm, H., T. Inoue, and M. Salmeron. 2000. Formation of dipole-oriented water films on mica substrates at ambient conditions. Surf. Sci. 462:L599–L602. [Google Scholar]
- Brewton, R. G., and R. Mayne. 1992. Mammalian vitreous humor contains networks of hyaluronan molecules: electron microscopic analysis using the hyaluronan-binding region (G1) of aggrecan and link protein. Exp. Cell Res. 198:237–249. [DOI] [PubMed] [Google Scholar]
- Cantrell, W., and G. E. Ewing. 2001. Thin film water on muscovite mica. J. Phys. Chem. B. 105:5434–5439. [Google Scholar]
- Cavalieri, F., E. Chiessi, M. Paci, G. Paradossi, A. Flaibani, and A. Cesàro. 2001. Conformational dynamics of hyaluronan in solution. 1. A 13C NMR study of oligomers. Macromolecules. 34:99–109. [Google Scholar]
- Cheng, L., P. Fenter, K. L. Nagy, M. L. Schlegel, and N. C. Sturchio. 2001. Molecular-scale density oscillations in water adjacent to a mica surface. Phys. Rev. Lett. 87:156103–156104. [DOI] [PubMed] [Google Scholar]
- Cleland, R. L. 1984. Viscometry and sedimentation equilibrium of partially hydrolyzed hyaluronate: comparison with theoretical models of wormlike chains. Biopolymers. 23:647–666. [Google Scholar]
- Conwell, C. C., I. D. Vilfan, and N. V. Hud. 2003. Controlling the size of nanoscale toroidal DNA condensates with static curvature and ionic strength. Proc. Natl. Acad. Sci. USA. 100:9296–9301. [DOI] [PMC free article] [PubMed] [Google Scholar]
- Cowman, M. K., J. Feder-Davis, and D. M. Hittner. 2001. 13C NMR studies of hyaluronan. 2. Dependence of conformational dynamics on chain length and solvent. Macromolecules. 34:110–115. [Google Scholar]
- Cowman, M. K., M. Li, and E. A. Balazs. 1998b. Tapping mode atomic force microscopy of hyaluronan: extended and intramolecularly interacting chains. Biophys. J. 75:2030–2037. [DOI] [PMC free article] [PubMed] [Google Scholar]
- Cowman, M. K., M. Li, A. Dyal, and E. A. Balazs. 2000. Tapping mode atomic force microscopy of the hyaluronan derivative, hylan A. Carbohydr. Polym. 41:229–235. [Google Scholar]
- Cowman, M. K., M. Li, A. Dyal, and S. Kanai. 2002. Tapping mode atomic force microscopy of hyaluronan and hylan A. In Hyaluronan. J. J. Kennedy, G. O. Phillips, and P. A. Williams, editors. Woodhead Publishing, Cambridge, MA. 109–116.
- Cowman, M. K., J. Liu, M. Li, D. M. Hittner, and J. S. Kim. 1998a. Hyaluronan interactions: self, water, ions. In The Chemistry, Biology, and Medical Applications of Hyaluronan and its Derivatives. T. C. Laurent, editor. Wenner-Gren International Series No. 72, Portland Press, London, UK 17–24.
- Cowman, M. K., and S. Matsuoka. 2002. The intrinsic viscosity of hyaluronan. In Hyaluronan. J. J. Kennedy, G. O. Phillips, and P. A. Williams, editors. Woodhead Publishing, Cambridge, UK. 75–78.
- Danielson, S., K. M. Vårum, and B. T. Stokke. 2004. Structural analysis of chitosan mediated DNA condensation by AFM: influence of chitosan molecular parameters. Biomacromolecules. 5:928–936. [DOI] [PubMed] [Google Scholar]
- Day, A. J., and G. D. Prestwich. 2002. Hyaluronan-binding proteins: tying up the giant. J. Biol. Chem. 277:4585–4588. [DOI] [PubMed] [Google Scholar]
- Day, A. J., and J. K. Sheehan. 2001. Hyaluronan: polysaccharide chaos to protein organisation. Curr. Opin. Struct. Biol. 11:617–622. [DOI] [PubMed] [Google Scholar]
- de la Motte, C. A., V. C. Hascall, J. Drazba, S. K. Bandyopadhyay, and S. A. Strong. 2003. Mononuclear leukocytes bind to specific hyaluronan structures on colon mucosal smooth muscle cells treated with polyinosinic acid: polycytidylic acid. Inter-α-trypsin inhibitor is crucial to structure and function. Am. J. Pathol. 163:121–133. [DOI] [PMC free article] [PubMed] [Google Scholar]
- Dobrynin, A. V., M. Rubinstein, and S. P. Obukhov. 1996. Cascade of transitions of polyelectrolytes in poor solvents. Macromolecules. 29:2974–2979. [Google Scholar]
- Dunlap, D. D., A. Maggi, M. R. Soria, and L. Monaco. 1997. Nanoscopic structure of DNA condensed for gene delivery. Nucleic Acids Res. 25:3095–3101. [DOI] [PMC free article] [PubMed] [Google Scholar]
- Etzler, F. M. 1983. A statistical thermodynamic model for water near solid interfaces. J. Colloid Interface Sci. 92:43–56. [Google Scholar]
- Fan, F.-R. F., and A. J. Bard. 1999. Imaging of biological macromolecules on mica in humid air by scanning electrochemical microscopy. Proc. Natl. Acad. Sci. USA. 96:14222–14227. [DOI] [PMC free article] [PubMed] [Google Scholar]
- Fan, F.-R. F., A. J. Bard, R. Guckenberger, and M. Heim. 1995. STM on wet insulators: electrochemistry or tunneling? Science. 270:1849–1852. [DOI] [PubMed] [Google Scholar]
- Fessler, J. H., and L. I. Fessler. 1966. Electron microscopic visualization of the polysaccharide hyaluronic acid. Proc. Natl. Acad. Sci. USA. 56:141–147. [DOI] [PMC free article] [PubMed] [Google Scholar]
- Fouissac, E., M. Milas, and M. Rinaudo. 1993. Shear-rate, concentration, molecular weight, and temperature viscosity dependences of hyaluronate, a wormlike polyelectrolyte. Macromolecules. 26:6945–6951. [Google Scholar]
- Fritz, J., D. Anselmetti, J. Jarchow, and X. Fernàndez-Busquets. 1997. Probing single biomolecules with atomic force microscopy. J. Struct. Biol. 119:165–171. [DOI] [PubMed] [Google Scholar]
- Fujimoto, B. S., and J. M. Schurr. 2002. Monte Carlo simulations of supercoiled DNAs confined to a plane. Biophys. J. 82:944–962. [DOI] [PMC free article] [PubMed] [Google Scholar]
- Golan, R., L. I. Pietrasanta, W. Hsieh, and H. G. Hansma. 1999. DNA toroids: stages in condensation. Biochemistry. 38:14069–14076. [DOI] [PubMed] [Google Scholar]
- Gribbon, P., B. C. Heng, and T. E. Hardingham. 1999. The molecular basis of the solution properties of hyaluronan investigated by confocal fluorescence recovery after photobleaching. Biophys. J. 77:2210–2216. [DOI] [PMC free article] [PubMed] [Google Scholar]
- Guckenberger, R., M. Heim, G. Cevc, H. F. Knapp, W. Wiegräbe, and A. Hillebrand. 1994. Scanning tunneling microscopy of insulators and biological specimens based on lateral conductivity of ultrathin water films. Science. 266:1538–1540. [DOI] [PubMed] [Google Scholar]
- Gunning, A. P., T. P. Giardina, C. B. Faulds, N. Juge, S. G. Ring, G. Williamson, and V. J. Morris. 2003. Surfactant-mediated solubilisation of amylose and visualisation by atomic force microscopy. Carbohydr. Polym. 51:177–182. [Google Scholar]
- Gunning, A. P., V. J. Morris, S. Al-Assaf, and G. O. Phillips. 1996. Atomic force microscopic studies of hylan and hyaluronan. Carbohydr. Polym. 30:1–8. [Google Scholar]
- Guss, J. M., D. W. L. Hukins, P. J. C. Smith, W. T. Winter, S. Arnott, R. Moorhouse, and D. A. Rees. 1975. Hyaluronic acid: molecular conformations and interactions in two sodium salts. J. Mol. Biol. 95:359–384. [DOI] [PubMed] [Google Scholar]
- Ha, B.-Y., and A. J. Liu. 1997. Counterion-mediated attraction between two like-charged rods. Phys. Rev. Lett. 79:1289–1292. [Google Scholar]
- Hadler, N. M., R. R. Dourmashkin, M. V. Nermut, and L. D. Williams. 1982. Ultrastructure of a hyaluronic acid matrix. Proc. Natl. Acad. Sci. USA. 79:307–309. [DOI] [PMC free article] [PubMed] [Google Scholar]
- Hansma, H. G., R. Golan, W. Hsieh, C. P. Lollo, P. Mullen-Ley, and D. Kwoh. 1998. DNA condensation for gene therapy as monitored by atomic force microscopy. Nucleic Acids Res. 26:2481–2487. [DOI] [PMC free article] [PubMed] [Google Scholar]
- Hansma, H. G., D. E. Laney, M. Bezanilla, R. L. Sinsheimer, and P. K. Hansma. 1995. Applications for atomic force microscopy of DNA. Biophys. J. 68:1672–1677. [DOI] [PMC free article] [PubMed] [Google Scholar]
- Hansma, H. G., I. Revenko, K. Kim, and D. E. Laney. 1996. Atomic force microscopy of long and short double-stranded, single-stranded, and triple-stranded nucleic acids. Nucleic Acids Res. 24:713–720. [DOI] [PMC free article] [PubMed] [Google Scholar]
- Hascall, V. C., A. K. Majors, C. A. de la Motte, S. P. Evanko, A. Wang, J. A. Drazba, S. A. Strong, and T. N. Wight. 2004. Intracellular hyaluronan, a new frontier for inflammation? Biochim. Biophys. Acta. In press. [DOI] [PubMed]
- Hayashi, K., K. Tsutsumi, F. Nakajima, T. Norisuye, and A. Teramoto. 1995. Chain-stiffness and excluded-volume effects in solutions of sodium hyaluronate at high ionic strength. Macromolecules. 28:3824–3830. [Google Scholar]
- Heim, M., R. Steigerwald, and R. Guckenberger. 1997. Hydration scanning tunneling microscopy of DNA and a bacterial surface protein. J. Struct. Biol. 119:212–221. [DOI] [PubMed] [Google Scholar]
- Hu, J., X.-D. Xiao, D. F. Ogletree, and M. Salmeron. 1995a. Imaging the condensation and evaporation of molecularly thin films of water with nanometer resolution. Science. 268:267–269. [DOI] [PubMed] [Google Scholar]
- Hu, J., X.-D. Xiao, D. F. Ogletree, and M. Salmeron. 1995b. The structure of molecularly thin films of water on mica in humid environments. Surf. Sci. 344:221–236. [Google Scholar]
- Hud, N. V., and K. H. Downing. 2001. Cryoelectron microscopy of λ phage DNA condensates in vitreous ice: the fine structure of DNA toroids. Proc. Natl. Acad. Sci. USA. 98:14925–14930. [DOI] [PMC free article] [PubMed] [Google Scholar]
- Hud, N. V., K. H. Downing, and R. Balhorn. 1995. A constant radius of curvature model for the organization of DNA in toroidal condensates. Proc. Natl. Acad. Sci. USA. 92:3581–3585. [DOI] [PMC free article] [PubMed] [Google Scholar]
- Israelachvili, J. N., and R. M. Pashley. 1983. Molecular layering of water at surfaces and origin of repulsive hydration forces. Nature. 306:249–250. [Google Scholar]
- Jacoboni, I., U. Valdrè, G. Mori, D. Quaglino, Jr., and I. Pasquali-Ronchetti. 1999. Hyaluronic acid by atomic force microscopy. J. Struct. Biol. 126:52–58. [DOI] [PubMed] [Google Scholar]
- Kwei, T. K., M. Nakazawa, S. Matsuoka, M. K. Cowman, and Y. Okamoto. 2000. The concentration dependence of solution viscosities of rigid polymers. Macromolecules. 33:235–236. [Google Scholar]
- Laurent, T. C., and J. Gergely. 1955. Light scattering studies on hyaluronic acid. J. Biol. Chem. 212:325–333. [PubMed] [Google Scholar]
- Laurent, T. C., U. B. G. Laurent, and J. R. Fraser. 1996. The structure and function of hyaluronan: an overview. Immunol. Cell Biol. 74:A1–A7. [DOI] [PubMed] [Google Scholar]
- Laurent, T. C., M. Ryan, and A. Pietruszkiewicz. 1960. Fractionation of hyaluronic acid. The polydispersity of hyaluronic acid from the bovine vitreous body. Biochim. Biophys. Acta. 42:476–485. [DOI] [PubMed] [Google Scholar]
- Lee, H. G., and M. K. Cowman. 1994. An agarose gel electrophoretic method for analysis of hyaluronan molecular weight distribution. Anal. Biochem. 219:278–287. [DOI] [PubMed] [Google Scholar]
- Letardi, S., G. La Penna, E. Chiessi, A. Perico, and A. Cesàro. 2002. Conformational dynamics of hyaluronan in solution. 2. Mode-coupling diffusion approach to oligomers. Macromolecules. 35:286–300. [Google Scholar]
- Li, J., C. Bai, C. Wang, C. Zhu, Z. Lin, Q. Li, and E. Cao. 1998. A convenient method of aligning large DNA molecules on bare mica surfaces for atomic force microscopy. Nucleic Acids Res. 26:4785–4786. [DOI] [PMC free article] [PubMed] [Google Scholar]
- Lyubchenko, Y. L., A. A. Gall, L. S. Shlyakhtenko, R. E. Harrington, B. L. Jacobs, P. I. Oden, and S. M. Lindsay. 1992. Atomic force microscopy imaging of double stranded DNA and RNA. J. Biomol. Struct. Dyn. 10:589–606. [DOI] [PubMed] [Google Scholar]
- Majors, A. K., R. C. Austin, C. A. de la Motte, R. E. Pyeritz, V. C. Hascall, S. P. Kessler, G. Sen, and S. A. Strong. 2003. Endoplasmic reticulum stress induces hyaluronan deposition and leukocyte adhesion. J. Biol. Chem. 278:47223–47231. [DOI] [PubMed] [Google Scholar]
- Margeat, E., C. Le Grimellac, and C. A. Royer. 1998. Visualization of trp repressor and its complexes with DNA by atomic force microscopy. Biophys. J. 75:2712–2720. [DOI] [PMC free article] [PubMed] [Google Scholar]
- Marszalek, P. E., H. Li, and J. M. Fernandez. 2001. Fingerprinting polysaccharides with single-molecule atomic force microscopy. Nat. Biotechnol. 19:258–262. [DOI] [PubMed] [Google Scholar]
- Matsuoka, S., and M. K. Cowman. 2002a. Equation of state for polymer solution. Polymer. 43:3447–3453. [Google Scholar]
- Matsuoka, S., and M. K. Cowman. 2002b. Viscosity of polymer solutions revisited. In Hyaluronan. J. F. Kennedy, G. O. Phillips, and P. A. Williams, editors. Woodhead Publishing, Cambridge, UK. 79–88.
- Maurstad, G., and B. T. Stokke. 2004. Metastable and stable states of xanthan polyelectrolyte complexes studied by atomic force microscopy. Biopolymers. 74:199–213. [DOI] [PubMed] [Google Scholar]
- McIntire, T. M., and D. A. Brant. 1999. Imaging of carrageenan macrocycles and amylose using noncontact atomic force microscopy. Int. J. Biol. Macromol. 26:303–310. [DOI] [PubMed] [Google Scholar]
- McIntire, T. M., and D. A. Brant. 2002. Hyaluronic acid self-association in the presence and absence of salts. In Hyaluronan. J. F. Kennedy, G. O. Phillips, and P. A. Williams, editors. Woodhead Publishing, Cambridge, UK. 137–140.
- McIntire, T. M., R. M. Penner, and D. A. Brant. 1995. Observations of a circular, triple-helical polysaccharide using noncontact atomic force microscopy. Macromolecules. 28:6375–6377. [Google Scholar]
- Miranda, P. B., L. Xu, Y. R. Shen, and M. Salmeron. 1998. Icelike water monolayer adsorbed on mica at room temperature. Phys. Rev. Lett. 81:5876–5879. [Google Scholar]
- Mörgelin, M., M. Paulsson, T. E. Hardingham, D. Heinegård, and J. Engel. 1988. Cartilage proteoglycans. Assembly with hyaluronate and link protein as studied by electron microscopy. Biochem. J. 253:175–185. [DOI] [PMC free article] [PubMed] [Google Scholar]
- Noguchi, H., and K. Yoshikawa. 1998. Morphological variation in a collapsed single homopolymer chain. J. Chem. Phys. 109:5070–5077. [Google Scholar]
- Oosawa, F. 1968. Interaction between parallel rodlike macroions. Biopolymers. 6:1633–1647. [Google Scholar]
- Ray, J., and G. S. Manning. 1994. An attractive force between two rodlike polyions mediated by the sharing of condensed counterions. Langmuir. 10:2450–2461. [Google Scholar]
- Ridout, M. J., G. J. Brownsey, A. P. Gunning, and V. J. Morris. 1998. Characterisation of the polysaccharide produced by Acetobacter xylinum strain CR1/4 by light scattering and atomic force microscopy. Int. J. Biol. Macromol. 23:287–293. [DOI] [PubMed] [Google Scholar]
- Rivetti, C., M. Guthold, and C. Bustamante. 1996. Scanning force microscopy of DNA deposited onto mica: equilibration versus kinetic trapping studied by statistical polymer chain analysis. J. Mol. Biol. 264:919–932. [DOI] [PubMed] [Google Scholar]
- Rivetti, C., C. Walker, and C. Bustamante. 1998. Polymer chain statistics and conformational analysis of DNA molecules with bends or sections of different flexibility. J. Mol. Biol. 280:41–59. [DOI] [PubMed] [Google Scholar]
- Round, A. N., M. Berry, T. J. McMaster, S. Stoll, D. Gowers, A. P. Corfield, and M. J. Miles. 2002. Heterogeneity and persistence length in human ocular mucins. Biophys. J. 83:1661–1670. [DOI] [PMC free article] [PubMed] [Google Scholar]
- Rouzina, I., and V. A. Bloomfield. 1996. Macroion attraction due to electrostatic correlation between screening counterions. 1. Mobile surface-adsorbed ions and diffuse ion cloud. J. Phys. Chem. 100:9977–9989. [Google Scholar]
- Scott, J. E., C. Cummings, A. Brass, and Y. Chen. 1991. Secondary and tertiary structures of hyaluronan in aqueous solution, investigated by rotary shadowing-electron microscopy and computer simulation. Biochem. J. 274:699–705. [DOI] [PMC free article] [PubMed] [Google Scholar]
- Scott, J. E., C. Cummings, H. Greiling, H. W. Stuhlsatz, J. D. Gregory, and S. Damle. 1990. Examination of corneal proteoglycans and glycosaminoglycans by rotary shadowing and electron microscopy. Int. J. Biol. Macromol. 12:180–184. [DOI] [PubMed] [Google Scholar]
- Scott, J. E., A. M. Thomlinson, and P. Prehm. 2003. Supramolecular organization in streptococcal pericellular capsules is based on hyaluronan tertiary structures. Exp. Cell Res. 285:1–8. [DOI] [PubMed] [Google Scholar]
- Serwer, P., and S. J. Hayes. 2001. Partially condensed DNA conformations observed by single molecule fluorescence microscopy. Biophys. J. 81:3398–3408. [DOI] [PMC free article] [PubMed] [Google Scholar]
- Sheehan, J. K., and E. D. T. Atkins. 1983. X-Ray fibre diffraction study of conformational changes in hyaluronate induced in the presence of sodium, potassium and calcium cations. Int. J. Biol. Macromol. 5:215–221. [Google Scholar]
- Sheehan, J. K., K. H. Gardner, and E. D. T. Atkins. 1977. Hyaluronic acid: a double-helical structure in the presence of potassium at low pH and found also with the cations ammonium, rubidium and caesium. J. Mol. Biol. 117:113–135. [DOI] [PubMed] [Google Scholar]
- Sitko, J. C., E. M. Mateescu, and H. G. Hansma. 2003. Sequence-dependent DNA condensation and the electrostatic zipper. Biophys. J. 84:419–431. [DOI] [PMC free article] [PubMed] [Google Scholar]
- Solis, F. J., and M. Olvera de la Cruz. 1998. Variational approach to necklace formation in polyelectrolytes. Macromolecules 31:5502–5506. [Google Scholar]
- Spagnoli, C., K. Loos, A. Ulman, and M. K. Cowman. 2003. Imaging structured water and bound polysaccharide on mica surface at ambient temperature. J. Am. Chem. Soc. 125:7124–7128. [DOI] [PubMed] [Google Scholar]
- Stevens, M. J. 2001. Simple simulations of DNA condensation. Biophys. J. 80:130–139. [DOI] [PMC free article] [PubMed] [Google Scholar]
- Stokke, B. T., and D. A. Brant. 1990. The reliability of wormlike polysaccharide chain dimensions estimated from electron micrographs. Biopolymers. 30:1161–1181. [DOI] [PubMed] [Google Scholar]
- Stokke, B. T., and A. Elgsaeter. 1994. Conformation, order-disorder conformational transitions and gelation of non-crystalline polysaccharides studied using electron microscopy. Micron. 25:469–491. [DOI] [PubMed] [Google Scholar]
- Tammi, M. I., A. J. Day, and E. A. Turley. 2002. Hyaluronan and homeostasis: a balancing act. J. Biol. Chem. 277:4581–4584. [DOI] [PubMed] [Google Scholar]
- Toole, B. P., T. N. Wight, and M. I. Tammi. 2002. Hyaluronan-cell interactions in cancer and vascular disease. J. Biol. Chem. 277:4593–4596. [DOI] [PubMed] [Google Scholar]
- Turley, E. A., P. W. Noble, and L. Y. W. Bourguignon. 2002. Signaling properties of hyaluronan receptors. J. Biol. Chem. 277:4589–4592. [DOI] [PubMed] [Google Scholar]
- Turner, R. E., P. Lin, and M. K. Cowman. 1988. Self-association of hyaluronate segments in aqueous NaCl solution. Arch. Biochem. Biophys. 265:484–495. [DOI] [PubMed] [Google Scholar]
- Vasilevskaya, V. V., A. R. Khokhlov, S. Kidoaki, and K. Yoshikawa. 1997. Structure of collapsed persistent macromolecule: toroid vs. spherical globule. Biopolymers. 41:51–60. [Google Scholar]
- Vuppu, A. K., A. A. Garcia, and C. Vernia. 1997. Tapping mode atomic force microscopy of scleroglucan networks. Biopolymers. 42:89–100. [DOI] [PubMed] [Google Scholar]
- Winter, W. T., and S. Arnott. 1977. Hyaluronic acid: the role of divalent cations in conformation and packing. J. Mol. Biol. 117:761–784. [DOI] [PubMed] [Google Scholar]
- Winter, W. T., P. J. C. Smith, and S. Arnott. 1975. Hyaluronic acid: structure of a fully extended 3-fold helical sodium salt and comparison with the less extended 4-fold helical forms. J. Mol. Biol. 99:219–235. [DOI] [PubMed] [Google Scholar]
- Xu, L., A. Lio, J. Hu, D. F. Ogletree, and M. Salmeron. Wetting and capillary phenomena of water on mica. 1998. J. Phys. Chem. B 102:540–548. [Google Scholar]
- Zimmerman, E., B. Geiger, and L. Addadi. 2002. Initial stages of cell-matrix adhesion can be mediated and modulated by cell-surface hyaluronan. Biophys. J. 82:1848–1857. [DOI] [PMC free article] [PubMed] [Google Scholar]