

Abstract
We present a three-dimensional individual cell-based, biophysical model to study the effect of normal and malfunctioning growth regulation and control on the spatial-temporal organization of growing cell populations in vitro. The model includes explicit representations of typical epithelial cell growth regulation and control mechanisms, namely 1), a cell-cell contact-mediated form of growth inhibition; 2), a cell-substrate contact-dependent cell-cycle arrest; and 3), a cell-substrate contact-dependent programmed cell death (anoikis). The model cells are characterized by experimentally accessible biomechanical and cell-biological parameters. First, we study by variation of these cell-specific parameters which of them affect the macroscopic morphology and growth kinetics of a cell population within the initial expanding phase. Second, we apply selective knockouts of growth regulation and control mechanisms to investigate how the different mechanisms collectively act together. Thereby our simulation studies cover the growth behavior of epithelial cell populations ranging from undifferentiated stem cell populations via transformed variants up to tumor cell lines in vitro. We find that the cell-specific parameters, and in particular the strength of the cell-substrate anchorage, have a significant impact on the population morphology. Furthermore, they control the efficacy of the growth regulation and control mechanisms, and consequently tune the transition from controlled to uncontrolled growth that is induced by the failures of these mechanisms. Interestingly, however, we find the qualitative and quantitative growth kinetics to be remarkably robust against variations of cell-specific parameters. We compare our simulation results with experimental findings on a number of epithelial and tumor cell populations and suggest in vitro experiments to test our model predictions.
INTRODUCTION
Epithelial tissues are organized in sheets that form protective barriers at inner and outer surfaces of organisms. For diagnosis and therapy of many diseases that involve epithelia it is essential to understand the principles underlying epithelial organization (Sheppard, 2003; Suzuki et al., 2003; Teller and Beaulieu, 2001; Bickenbach and Dunnwald, 2000; Wright and Alison, 1984). This process is a result of cell division, cell differentiation, programmed cell death, and cell migration, that involves a complex interplay among different interaction, regulation, and control mechanisms on the cellular and subcellular scale. To gain insight into this well-orchestrated interplay, many studies have been performed in vitro. They show that the mechanisms regulating epithelial organization depend on cell-cell and cell-substrate adhesion. For example, besides the depletion of growth factors (Balkovetz, 1999), the presence of cell-cell adhesion was shown to play an important role in the inhibition of epithelial growth at high cell density (Li et al., 2003; Warchol, 2002; Aplin et al., 1999). Cell-substrate adhesion was shown to be important for cell-cycle progress (Klekotka et al., 2001; Assoian, 1997). Furthermore, a loss of cell-substrate contact was found to trigger a special type of selective programmed cell death, called anoikis (Stupack and Cheresh, 2002).
Many of the epithelial cell populations that are subject to cell-substrate contact-dependent proliferation and anoikis grow in a cell culture into confluent cell monolayers (Li et al., 2003; Warchol, 2002; Klekotka et al., 2001) and simultaneously establish a cell polarity. The introduction of different oncogenes into cultured epithelial cell lines affects their signal transduction pathways (Orford et al., 1999; Yan et al., 1997; Lu et al., 1995). In cell lines that normally form cell monolayers this can result in a breakdown of the epithelial cell polarity due to changes of the cellular adhesion properties (Yan et al., 1997) and/or prevents anoikis due to an interruption of apoptotic signaling pathways (Lu et al., 1995). Thereby it may enable anchorage-independent growth, which is characteristic for tumor cell lines (Bates et al., 2000; Santini et al., 2000). The accumulation of such cells at confluence can lead to the formation of multilayers (Yan et al., 1997) or to the formation of spherical aggregates (Lu et al., 1995).
To explain these phenotypic differences between nontransformed and transformed cells, biologists are focusing on the molecular mechanisms for understanding how molecular signals from other cells or the substrate are transduced from the cell surface into the cell and affect the genetic control of cell proliferation and death (Orford et al., 1999; Yan et al., 1997; Lu et al., 1995). Although this approach has contributed much to unveil different classes of molecular control and regulation mechanisms, such as those mentioned above, it leaves largely open the question of how the different classes of control mechanisms collectively act together to determine the macroscopic dynamics of cell populations. Moreover, for endothelial cells it has been shown that cell shape appears to be a critical determinant that switches cells from life to death and between proliferation and quiescence, and that different adhesion receptors appear to tune the cellular response to shape distortion (Huang and Ingber, 1999; Chen et al., 1997). Epithelial cells are also able to sense changes within the local microenvironment by sensing the degree of their own extension or compression, and thereby couple any shape changes which can be sensed by the cytoskeleton with cell migration and proliferation (Gloushankova et al., 1997). Hence, some of the effects of cell contact formation and release during epithelial organization can be directly attributed to the physical interaction among individual cells and their neighbors, and with the substrate.
A deeper understanding of epithelial cell organization therefore requires to combine the biophysical and the cell-biological point of view, and, to study how the different classes of control mechanisms act collectively together. Due to recent advances in biophysics (Charras and Horton, 2002; Schwarz et al., 2002; Guck et al., 2001; Benoit et al., 2000; Mahaffy et al., 2000), the possibilities for collecting new information on the biophysical parameters of cells and tissues are strongly improving. This increasingly facilitates qualitative and quantitative individual cell-based models. A number of different individual-based models of cell populations have been studied so far (see Drasdo, 2003 and references therein):
Cellular automaton models, in which each cell is represented by a single lattice site (e.g., Dormann and Deutsch, 2002; Paulus et al., 1993; Loeffler et al., 1987). This rule-based model type allows our studying large system sizes, but, since it is not primarily based on a direct physical representation of individual cells, it facilitates to overlook certain physical effects. For example, cells inside a monolayer may be pushed out of the layer by mechanical forces exerted by their neighbor cells—a situation that is hard to properly represent with a cellular automaton.
Cellular automaton models, in which each cell is represented by many lattice sites. This model type allows to model complex cell shapes and to include such physical mechanisms as cell-cell and cell-surface adhesion and volume conservation, but it is difficult to directly relate experimental quantities on the cellular and subcellular scale to the model parameters; see, e.g., Hogeweg (2000) and Graner and Glazier (1993). The latter authors use an extended Potts model and simulate the spatial population dynamics by a Monte Carlo simulation. The transitions between different configurations of the cell populations are controlled by the configuration energy, and an additional parameter, T—a parameter that, so far, has not been accessible to experimental measurements.
Off-lattice models, in which cells are modeled as quasispherical particles that deform during cell division (e.g., Drasdo and Forgacs, 2000; Drasdo et al., 1995), or as deformable ellipsoids (e.g., Palsson and Othmer, 2000; Dallon and Othmer, 2004), or as Voronoi polygons (e.g., Brodland and Veldhuis, 2002; Meineke et al., 2001; Honda et al., 2000). The approaches by quasispherical particles, which model cell dynamics by a Monte Carlo dynamics, introduce spherical cell-cell interaction potentials but no explicit descriptions of cell shape. Thus, they do not consider the control of the cell volume explicitly. In the approach by deformable ellipsoids the cell dynamics are modeled as friction-dominated, and the cell deformation is assumed to conserve cell volume. If cell-cell contact is present, the detailed cell shape is not represented. In contrast, in the Voronoi concepts, the shape of a cell is well defined. It is a convex polygon that is exclusively determined by the position of its neighbors. However, as in the quasispherical particle approaches, the cell volume is not controlled.
The objective of our work is to present a novel class of lattice-free, three-dimensional individual-based models of epithelial cell populations, which includes an explicit representation of cell shape at explicit volume control as well as basic epithelial growth regulation and control mechanisms. The model introduced in this article is used to study the growth behavior of a number of different epithelial cell populations ranging from undifferentiated stem cell populations via transformed variants up to tumor cell lines in vitro. We carry out a systematic investigation of the generic properties of the model by parameter variations and selective model knockouts of regulation and control mechanisms. We then study the individual, and collective, effects of cell-specific properties such as cell-substrate adhesion and cell-cycle time on macroscopic growth behavior and on the growth regulation and control mechanisms. Although our model does not reproduce every minute detail of the cells and cell populations, it does demonstrate that a model, parameterized by characteristic, experimentally measurable cell and substrate properties, that involves a coupling between generic and genetic control mechanisms, is capable of explaining many complex pattern formation and growth processes of epithelial cell populations in vitro.
MODEL ASSUMPTIONS
In this article we focus on cell populations in their initial expanding growth phase. We assume that cell differentiation and maturation do not occur during this phase. Each population originates from a single cell, i.e., it represents an expanding clone of that cell. All cells are assumed to be capable of proliferation and also able to produce an unlimited number of progeny. We confine our investigations to populations that establish only a few cell layers. Accordingly, we assume that nutrients are abundant. We study epithelial cell populations, e.g., primary epithelial cell populations (Warchol, 2002) or cell lines including nontumorigenic cell lines (Orford et al., 1999; Lu et al., 1995) and tumor cell lines (Li et al., 2003; Yan et al., 1997), that are growing in a cell culture in standard petri dishes. Thus, the bottom of the culture is modeled as an impenetrable flat surface (represented as a sphere with infinite radius, 1/Rs = 0). It is assumed to be coated with a dense and homogeneous protein film to permit specific cell-substrate adhesion.
Cell shape and deformation
Motivated by the observation that isolated epithelial cells often adopt a spherical shape (Drubin and Nelson, 1996) we represent an isolated cell by a sphere of radius R. Each cell is characterized by an intrinsic target volume VT, which is the volume the cell adopts if it is isolated. If a cell gets into contact with the substrate or with other cells, its shape changes by flattening at the contact areas. In the model we represent a cell and a neighbor cell that are in contact by a pair of deformed spheres sharing a common, flat contact area. Outside the contact area we approximate the shape of the cells by their original sphere shape. To allow for a balance of the cell volume reduction due to flattening at the contact zone, we introduce the intrinsic cell radius R as a dynamic variable that increases during contact formation to adjust the actual volume VA to the target volume VT of the cell.
Our model neglects the polarized structure of the cell cytoskeleton and assumes that the elastic properties of the cells are determined by a homogeneous elastic solid. Hence each model cell is characterized by two elastic material constants; for example, the bulk modulus K and the Young modulus E. We approximate the energy related with a volume change by the energy of a uniform cell compression or cell inflation. Thus, the extent to which a cell is able to resist a compression depends on its bulk modulus,
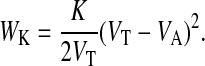 |
(1) |
Here VA is the actual cell volume, and VT is the target cell volume (Sevsek et al., 1992).
For two cells i and j in contact (or cell i in contact with the substrate j), we neglect shear deformations and assume that the deformation energy for sufficiently small deformations can be calculated from the Hertz model (Landau and Lifschitz, 1986; Hertz, 1882),
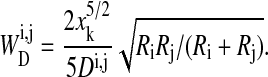 |
(2) |
Here, Ri, Rj are the cell radii and the terms xk (k = c, s) are defined by the distances of the cells (Fig. 1). Dij is related to the Young moduli Ei and Ej and the Poisson ratios νi and νj of the cells by
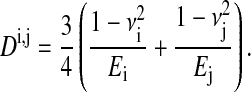 |
(3) |
We have chosen the parameter values for the Young modulus E in accordance with Guck et al. (2001) and Mahaffy et al. (2000). The Poisson ratio ν was assumed to be 1/3, as suggested by Maniotis et al. (1997) and also assumed by Mahaffy et al. (2000). Consequently the bulk modulus K is equal to E.
FIGURE 1.

Cell-cell and cell-substrate contact formation. VA and VT are the actual and the target cell volumes, respectively. During contact formation R increases to R′ to restore the target volume VT. The terms xc and xs are the terms used in Eq. 2.
Cell deformations are accompanied by changes of the cell surface area. We assume that the cells are able to rapidly exchange the material necessary for these changes with the intracellular reservoirs, and in such a way that cell surface energy does not need to be considered explicitly.
Cell adhesion
Cells in contact with other cells or the substrate can form adhesive bonds. With decreasing distance their contact area increases, and so does the number of the adhesive contacts. Cells form such adhesive contacts through interactions involving a large variety of cell adhesion molecules. They interact with the substrate components, e.g., via integrins and syndecan molecules, and with adjacent cells via members of the cadherin, selectin, and IG-cam families (Aplin et al., 1999). In our model both the cell-cell and cell-substrate adhesion are assumed to be dominated by interactions of different cell adhesion molecules (receptors) with their ligands. We assume that these receptors/ligands are homogeneously distributed on the cell surface, and that the substrate consists of a dense film of ligands.
We study the multicellular dynamics on timescales that are large compared to the intrinsic timescale for receptor-ligand binding, which is given by the inverse of the binding rates (typically 0.1–0.5 Hz; see Chesla et al., 1998; Piper et al., 1998). Accordingly, we can neglect the fluctuations of the number of binding sites during the formation and the release of bonds, and approximate both the adhesive cell-cell and the cell-substrate interaction energy by
 |
(4) |
where ɛk denotes the average adhesion energy per unit contact area, and AC the actual contact area for contact to another cell (k = c) or the substrate (k = s), respectively. This approach is similar to that used in Johnson-Kendall-Roberts theory predicting AC (Carpick et al., 1999). However, consistent with our shape and volume assumptions, we use for AC the circular area representing the base of the spherical caps of height xc/2 and xs for cell-cell and cell-substrate contact, respectively (Fig. 1). Consequently we get a slightly different force-distance profile than applied in the Johnson-Kendall-Roberts theory, with a pulloff force as in the Derjaguin-Müller-Toporov theory (Carpick et al., 1999). The value ɛk is proportional to the surface density of receptor-ligand bonds and the receptor-ligand interaction energy (Moy et al., 1994). It is a function of the kinetic rate constants of the specific binding, and depends on effects such as receptor aggregation and competition (van Opheusen et al., 1984). In the following, ɛk is termed anchorage, and it is assumed to be in the range from 100 to 1000 μN/m for both cell-cell and cell-substrate anchorage (compare Frisch and Thoumine, 2002, and references therein).
Cell cycle
The cell cycle can be divided into two phases: the mitotic phase, i.e., the process of nuclear division; and the interphase, the interlude between two mitotic events (Vermeulen et al., 2003). We assume that during the interphase, a cell doubles its mass and its volume, whereas during the mitotic phase, a cell divides into two daughter cells of equal target volume VT = V0. Furthermore, we assume that a cell re-enters the cell cycle after division only if it shares a contact area with the substrate, and if its actual volume, VA, exceeds a certain threshold volume, Vp. We will discuss these regulation mechanisms separately below.
In the interphase a cell is assumed to increase its target volume VT by stochastic increments (Drasdo, 1996; Drasdo et al., 1995). The growth of VT results in an increase of the compression energy (Eq. 1), and consequently, in a force transmission to the neighbor cells (see Appendices). Subsequently the actual volume VA adapts to VT quasicontinuously. The time a cell needs to double its target volume is in the following called cell growth time. The growth process assumed in our model results in an approximately Γ-distributed, i.e., variable, growth time of the cells as observed in experiments (Wright and Alison, 1984). The shape of the distribution is controlled by the number of volume growth steps needed to traverse the interphase. The more steps performed, the sharper the distribution is peaked. We use a step size (volume increment) of V0/10. In a free-cycling state the growth time of a cell equals the cell cycle time. However, the cycle time may be prolonged due to several growth arrests (see below). In the following the average cell growth time is referred to as τ.
After the intrinsic cell volume VT reaches a value of 2V0, a cell divides. We model the contraction of the actin-myosin ring that results in a separation of the cell body of the mother cell into two daughter cells in a single step by inserting a new membrane into the cell. This simplification is supported by results on the effects of cell shape changes on the growth behavior of cell populations, which have been tested in a previous work (Drasdo, 1996; Drasdo et al., 1995).
In the model we assume that the orientation of cell division is determined by the direction of the total force (the sum of the forces) exerted on the dividing cell by all its neighbors. We distinguish two cases. If the mother cell does not have contact to the substrate (case 1), then the contact area of the daughter cells immediately after division has an orientation parallel to that force; but in the case that the mother cell does have substrate contact (case 2), then we assume the contact area to be oriented in the direction of the projection of that force on the plane of the substrate. On the one hand, this assumption is motivated by the finding that tumor cells tend to grow in the direction of the lowest pressure (Helmlinger et al., 1997); on the other hand, it accounts for the experimental observation that for polar cells the orientation of cell division can be crucial to maintain a certain, e.g., monolayer structure (Drasdo and Loeffler, 2001; Drasdo and Forgacs, 2000).
Cell growth regulation and control
In this article we study the influence of three potential growth regulation and control mechanisms that are known to play a fundamental role in epithelial cell populations, namely
A cell-cell contact-mediated form of growth inhibition.
A cell-substrate contact-dependent cell-cycle arrest.
A cell-substrate contact-dependent programmed cell death.
Each of these mechanisms requires that the individual cells are able to sense their environment, and can adapt their growth and division to it by using the internal machinery of signal transduction and processing.
The first mechanism (mechanism 1) leads to an inhibition of growth as a consequence of cell-cell contact formation. In epithelial cells, developing cell-cell contacts result in a contraction or deformation of the cell cytoskeleton, and this is followed by several signal cascades (Aplin et al., 1999; Gloushankova et al., 1997). In our biomechanical model, any cell-cell contact formation yields a change of the cell-substrate contact area, or a cell compression, or both (see Fig. 1). Helmlinger et al. (1997) demonstrated that compression of cells (as a consequence of an external pressure) is followed by a growth arrest. Thus, we assume that one of the critical parameters determining whether a cell proliferates or not is the threshold volume Vp, with Vp < V0. In other words, if the actual volume VA is smaller than Vp, the cell is sufficiently compressed by their neighbor cells to inhibit growth. In the following, we refer to this mechanism simply as contact inhibition.
Experimental observations suggest that nontransformed epithelial cells in culture are able to divide only if they have formed sufficient contacts with the substrate (Assoian, 1997). This is validated by the experimental finding that proliferating cells in vivo are found, in most multilayered epithelia, to be almost exclusively in contact with the basal membrane (Tomakidi et al., 1998; Wright and Alison, 1984). We take this into account by assuming that only those cells for which the contact area to the substrate AC is larger than a threshold value  are able to enter the cell cycle. Here we assume
  We refer to this mechanism 2 as anchorage-dependent growth.
Cells originating from monolayered epithelial tissues undergo a form of programmed cell death (i.e., anoikis) if they lose substrate contact (Santini et al., 2000). In our model, we assume that cells for which the contact area to the substrate, AC, is smaller or equal to a threshold value of  (here,
  ), are removed at a rate of wa > 1/τ (Grossmann et al., 2001). Since this rate is larger than the average cell division rate, multilayered aggregates can no longer form in our model if this mechanism is activated (Galle et al., 2003). In the following, we specifically refer to this mechanism 3 as anoikis.
In summary, our model assumes three growth control and regulation mechanisms. A simple notation for specifying their eight different combinations is by a binary string of three digits. (E.g., [III] denotes that all three regulation mechanisms are considered, whereas [I0I] denotes that the regulation mechanisms 1 and 3 are considered while the mechanism 2 is not.) In the following, we use this short notation to specify the growth regulation in our simulation examples.
MODEL DYNAMICS AND SIMULATION TECHNIQUES
Motivated by the observations that isolated cells (Schienbein et al., 1994) and cells in aggregates (Mombach and Glazier, 1996) perform a random motion, we model the dynamics of each individual cell by Langevin equations. As previously pointed out by others, inertia terms are believed to be negligible compared to friction terms (see e.g., Palsson and Othmer, 2000; Drasdo et al., 1995; Odell et al., 1980).
For cells in contact with neighbor cells or substrate, the friction coefficients for movement normal (n) and parallel (p) to the contact areas are, in general, different. For movement in the normal direction, the friction is essentially determined by internal friction (transport of intracellular material); but for the parallel movement, it is essentially determined by the reorganization of cell-cell and cell-substrate contacts, which subsequently forces internal reorganization (Hu et al., 2003). In both cases the friction coefficients can be expressed in the functional form
 |
(5) |
where AC denotes the contact area and μl (l = p, n) indicates the friction constants of ∼1011 Pa s/m, corresponding to a high viscosity of the epithelial cell cytoplasm in the order of 105 Pa s (Beysens et al., 2000). Changes of the cell radius are affected only by friction components normal to the contact area, and by an additional coefficient recognizing the limited permeability of the cell membrane for water, which is denoted by bV. The friction with the surrounding medium is approximated by the constant cM, with cM ≪ bV. Cells that have lost contact to both the substrate and other cells are removed instantaneously.
The (active) random motion performed by isolated cells can be characterized by the same functional relationships as real diffusion (Schienbein et al., 1994). Accordingly, we assume that the equation of motion for cells comprises a stochastic force with zero mean and a delta-correlated autocorrelation function. We follow the line of argument by Beysens et al. (2000), who postulated a “cellular Einstein relation” (which relates the macroscopic diffusion constant of the cells with a thermal energy analog), and we therefore denote the amplitude of the noise-autocorrelation function as the macroscopic diffusion constant. The diffusion constant, and consequently the value of the thermal energy analog, FT, may depend on the cell type and the culture conditions (Koo et al., 2002; Maheshwari et al., 2001; DiMilla et al., 1993). We used values between 10−15 and 10−16 Nm, which are smaller than those suggested by cell-sorting experiments with embryonic chicken cells (5 × 10⁻¹⁵ Nm; Beysens et al., 2000).
In summary, the displacement and radius change of cells i are modeled in separate equations as
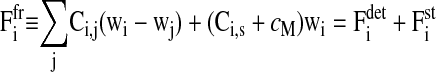 |
(6) |
for the force balance determining the translational cell movement with velocity wi = dri/dt, and
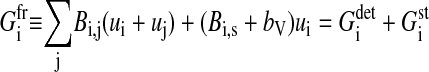 |
(7) |
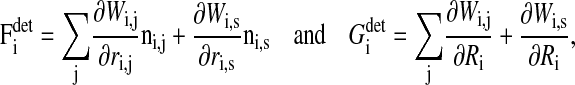
for the variation of the radius with velocity ui = dRi/dt. Here,  is the sum over all friction forces during translational movement;
  indicates the friction forces during changes of the radius of cell i; Ci,j is a (3 × 3) friction coefficient matrix; Bi,j is a scalar friction coefficient for the friction between cells i and j; and Ci,s and Bi,s denote the corresponding quantities for the friction between cell i and the substrate s. The right-hand sides of both equations denote the sums over all generalized forces that cause displacement and radius change, respectively. In particular,
  (
( ) summarize the deterministic forces, and
  (
( ) denotes the stochastic force. Details are explained in the Appendices.
For N cells, 4N linear ordinary stochastic differential equations have to be solved numerically. The position ri as well as the radius Ri of all cells i were updated in parallel. Our integration scheme uses a variable time step Δt that was chosen to be large enough to allow our studying the dynamics of the system over macroscopic time periods (large compared to the cycle time) but also to be small enough to insure that the maximum displacement of a cell is always less than the distance to its nearest neighbor. Our typical time step was τ/1000; i.e., ∼40 s for a cell growth time of 12 h (Meineke et al., 2001), which is much longer than the average receptor-ligand bond formation time (see above). The velocities of all neighbor cells wj(tn) (respectively, uj(tn)) at time step n is calculated iteratively.
The model was implemented from scratch using standard C programming code. For three-dimensional visualization we generated an interface utilizing POV-Ray for Windows rendering.
RESULTS
Reference model
In a first step we investigated the growth behavior of a cell population on a two-dimensional substrate in which all regulation mechanisms are present [III]. We assumed that the cell-substrate anchorage is larger than the cell-cell anchorage (ɛs > ɛc). In this case, the model cells essentially form cell monolayers. The full parameter set used for this reference model is given in Table 1.
TABLE 1.
| PARAMETER | SYMBOL | VALUE |
|---|---|---|
| Radius of a free cell | R0 | 5 μm |
| Volume of a free cell | V0 | V(R0) |
| Cell growth time | τ | 12 h |
| Young modulus | E | 1 kPa |
| Poisson ratio | ν | 1/3 |
| Cell-substrate anchorage | ɛs | 600 μN/m |
| Cell-cell anchorage | ɛc | 200 μN/m |
| Friction constant | μl (l = p, n), μp = μn | 1011 Ns/m3 |
| Friction coefficient | bV | 400 Ns/m |
| Friction coefficient | cM | 0.4 Ns/m |
| Anoikis rate | wa | 0.25/h |
| Threshold volume | Vp | 0.99 V0 |
| Energy equivalent | FT | 10−16 Nm |
Monolayer morphology and kinetics
Fig. 2 shows top views on a growing reference population for different population sizes. We characterized the populations by calculating radial averages (with respect to the center of mass) of the actual cell volume VA (average over a fixed number of cells) and the local cell number density ρ. In Fig. 3 these quantities are shown for “normal growth” versus the radial distance from the center of mass of the population. The average actual volume allows us to identify the interior and the growth zone of the monolayer. In the interior of the growing monolayer the cell volume is below the threshold for contact inhibition, VA ≈ 0.89, V0 < Vp = 0.99 V0 < V0, as a consequence of the large compression forces exerted on each cell by its neighbor cells (i.e., the cell growth is inhibited by contact inhibition). At the monolayer periphery, where the compression vanishes, the cell volume can increase to values above the contact inhibition threshold Vp and cells are able to start growing. In the interior we obtained a constant cell density of ∼170 cells/10,000 μm2, whereas in the growth zone we found a decreasing cell density correlated with an increasing number of proliferating cells. Both results are in qualitative agreement with the experimental findings of Warchol (2002).
FIGURE 2.

Top view on cell populations. The first row shows a normal growing population at population size of N1 = 2000, N2 = 5000, and N3 = 10,000. In the second row a growth arrest was applied to all cells at N2. The growth arrest results in a stress relaxation as explained in the text. In the third row 50% of all cells of the population were removed immediately after the population size reached N2. This injury is followed by a fast regrowth. In all cases the shaded value of the cells is a marker of the cell target volume VT. Dark-shaded cells indicate imminent cell division.
FIGURE 3.
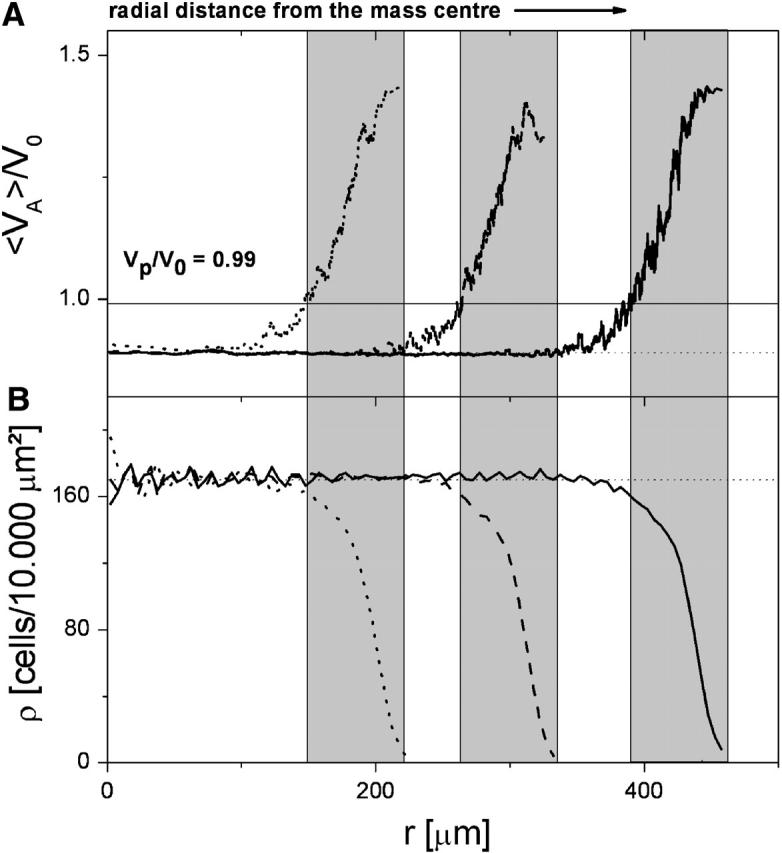
Properties of the reference cell population (normal growth). (Population size: dotted line, N1 = 2000; dashed line, N2 = 5000; and solid line, N3 = 10.000. (A) Average relative actual cell volume VA/V0. (B) Average number density of the cells ρ. The width of the proliferation zone (shaded range, ∼70 μm) is independent of N.
We further investigated whether the cell compression in the interior could result from incomplete relaxation due to the remaining active cell motion. As suggested by the experimental findings (Comijn et al., 2001; Andre et al., 1999; Gloushankova et al., 1997), we assumed that contact inhibition of growth is accompanied by an inhibition of (active) migration, i.e.,  for all cells, k, undergoing contact inhibition of growth. In that case, we found slightly less compressed cells in the interior. However, the effect was negligible for the amplitudes of the stochastic forces in the range considered here (average VA in the interior: 0.894 V0, compared to 0.889 V0; mean ± SD 0.015 V0 in both cases).
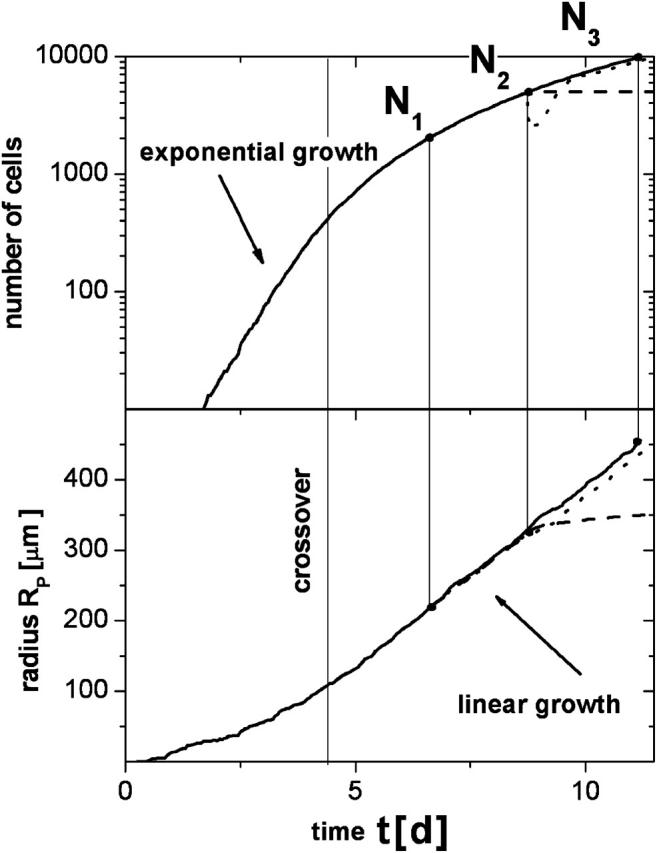
Fig. 4 shows an example of the time development of the population size N and of the monolayer radius, RP. As in Drasdo and Hoehme (2003) and Drasdo (1996), we find that the cell number grows exponentially fast only for small population sizes. The exponential growth of the population size is followed by a crossover to a subexponential growth. The latter corresponds to a linear growth regime of the radius of the layer RP. Within that regime we find a constant growth velocity v = dRP/dt of the monolayer radius RP. In the following, we denote v as the spreading velocity of the population. For the case shown in Fig. 4, the velocity is ∼v = 2.1 μm/h, which is close to the values for spreading velocities of growing tumor cell lines in vitro as observed by Bru et al. (1998). This constant velocity is obtained for a population size above N0 > 300–400 cells. Consistently, the profiles in Fig. 2 show a constant width of the growth zone.
FIGURE 4.
Growth kinetics: cell population size N and radius of the population RP versus time t for the reference population. (Solid lines, normal growth; dashed lines, relaxation after growth arrest; and dotted lines, regrowth after removing 50% of the cells.)
The actual compression of the cells is a consequence of the growth dynamics. This becomes immediately obvious if we apply a growth arrest on all cells by switching off cell growth in our computer simulations. In this case we observe a stress relaxation of the population with the following features: 1), the cell compression vanishes; 2), the average cell-cell contact area of the cells decreases; and 3), the average cell-substrate contact area increases. This stress relaxation causes a passive spreading of the population. In the presence of adhesive cell-cell interaction this spreading stops at a finite population radius (see Fig. 2). Without adhesive interaction, the cells would disperse as a result of random motion. In the case where cell population grows against the boundaries of the cell culture, stopping cell proliferation, the compression is maintained. But this balance may still be unsettled by perturbations; for example, those emanating from the death of cells. This is illustrated in Fig. 2, where we have removed a defined number of cells from a growing population, and observed immediate regrowth.
Parameter variations
In the following we present simulation results on various further cell populations with [III] and discuss how their growth kinetics and spatial structure depend on cell-specific parameters. If not explicitly specified, the model parameters belong to the reference set given in Table 1.
Effects of cell-substrate anchorage
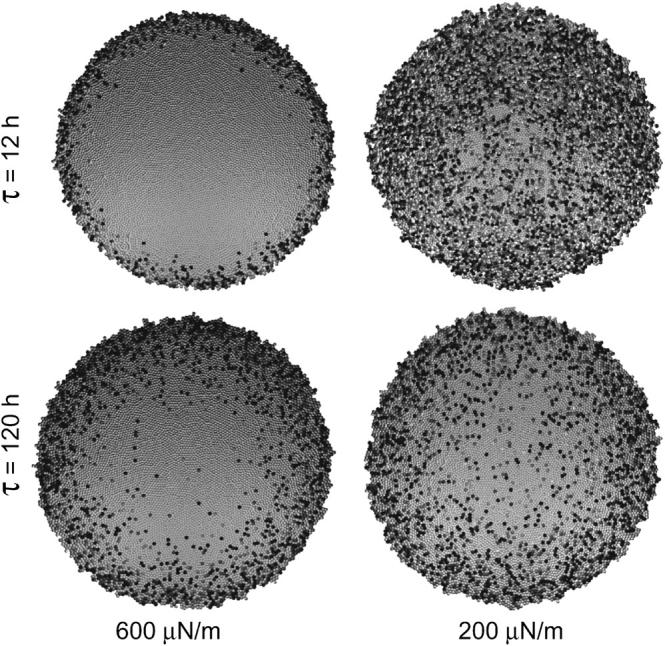
Fig. 5 shows a comparison of the macroscopic morphology of [III] cell populations that differ only in their cell-substrate anchorage. If the cell-substrate anchorage is strong (ɛs = 600 μN/m) only a very few cells lose substrate contact, and an almost perfect cell monolayer is formed. If the cell-substrate anchorage is weak (ɛs = 200 μN/m), many cells are forced out of the basal layer.
FIGURE 5.

Radius RP and averaged cell age versus time t of populations with different cell-substrate anchorage ɛs. (Solid lines, ɛs = 600 μN/m; dashed lines, ɛs = 400 μN/m; and dotted lines, ɛs = 200 μN/m.) Additional vertical sections of the populations at N = 10,000 are shown. Shaded values as in Fig. 2.
This can be explained as follows. Due to fluctuations of the spatial cell position perpendicular to the substrate, and to fluctuations of the cell size, the force vectors between neighboring cells do not perfectly lie within the plane of the substrate. Accordingly, the total force on an individual cell has a force component that is perpendicular to the substrate plane, either pointing into it or pointing out of it. In the latter case, the cells are able to maintain substrate contact only as long as the component of the force resultant perpendicular to the substrate plane is balanced by an equally strong attractive cell-substrate force. In the case shown, this is ensured by anchorage strength down to ∼400 μN/m.
Fig. 5 also shows a comparison of the corresponding time developments of the population radius, RP. If a perfect monolayer forms and cell proliferation only takes place in a small growth zone at the periphery of the monolayer, the radius grows linearly after small growth times (here <10 τ = 5 days; compare to Fig. 4). If cells in the basal layer force each other to leave the layer, then such a limited growth zone does not form. Under this condition, the populations have a much longer crossover time (here >30 τ = 15 days). During that time they establish a steady-state proliferation in their interior. The steady state is characterized by a finite average lifetime of all model cells, which is the time between birth and death due to anoikis or shedding. This finite lifetime is not observed if contact inhibition is able to suppress cell division in the interior of the cell population. In the case of ɛs = 200 μN/m, we observed the maximum average lifetime was slightly above 4 τ. The small drift obtained for t > 30 τ indicates a radial distribution of the lifetimes within the population. Only when the maximum lifetime is attained does Rp grow linearly (as in case of stable cell monolayers). However, the spreading velocity remains in the same range as for stable growth.
As long as the cells grow as a stable monolayer, a decrease of the cell-substrate anchorage leads to an, on average, smaller cell-substrate area, which results in a smaller cell-substrate friction (Eq. 5) and consequently in an increased spreading velocity v. If the cell-substrate anchorage is too small, however, cells are pushed out of the layer, leaving small holes in the basal layer. This is accompanied by a temporary interruption of the force transmission of interior cells to the cells in the periphery of the population, and consequently leads to a slowdown of the spreading velocity. Hence, the maximum spreading velocity of the population is observed at an intermediate cell-substrate anchorage.
Effects of cell growth time
Fig. 6 shows the results of an increase of the intrinsic growth time of the cells from τ = 12 h to τ = 120 h. Two populations with different cell-substrate anchorage strength are compared. As indicated in Fig. 6, for strong cell-substrate anchorage (600 μN/m), we observed an increase of the growth zone with increasing cell growth time (i.e., the proliferation activity is increased).
FIGURE 6.
Top views on cell populations (N = 10,000) with different intrinsic cell growth time τ. Populations with different cell-substrate anchorage are compared. Shaded values as in Fig. 2.
This can be explained as follows. At smaller cell division rates, cells have more time to migrate and locally relax mechanical stress by reducing their degree of compression (compare Fig. 2). Since the forces on cells decrease at the periphery of the population, the relaxational cell movement takes place in a radial direction from the center of mass, and increases the width of the boundary layer in which the cell volume is above the proliferation threshold for contact inhibition, Vp (i.e., it increases the growth zone). Contraintuitively, if the cell-substrate adhesion is weak (200 μN/m), an increase of the cell growth time has the opposite effect. Here, the same increase of τ results in a significant reduction of the proliferation activity in the interior of the cell monolayer. The reason is that, in this case, fewer cells in the interior of the cell layer are forced out of the basal layer, and consequently more cells experience a stop in proliferation by contact inhibition.
Therefore, our findings suggest that changes of the cell-kinetic quantities of individual cells as the cell growth time increases can account for either an increase or a decrease of cell proliferation activity, depending on the cell-substrate anchorage, and may, thereby, affect the population morphology in complex ways. In contrast, our simulations suggest that the self-regulation mechanisms described above keep the spreading velocities in a small range, regardless of the cell-substrate anchorage strength. For instance, the calculated spreading velocity in the case of ɛs = 600 μN/m is ∼v = 2.1 μm/h for τ = 12 h, but is still v = 0.49 μm/h for τ = 120 h (i.e., only approximately four times smaller, if τ is increased by one order of magnitude).
Knockout of regulation mechanisms
In a further step we investigated the growth behavior of cell populations where regulation mechanisms were knocked out selectively from the reference model. In this case, three-dimensional aggregates, as spheroids, form. In the following we present simulation results on the growth kinetics and spatial structure of these cell populations and discuss how they depend on the regulation mechanisms. If not explicitly specified, the model parameters again belong to the set given in Table 1.
Cell-substrate contact mediated regulation
Fig. 7, A and B, show snapshots of growing cell populations of a size of N = 5000 cells with regulation mechanisms [III] (contact inhibition, anchorage-dependent growth, and anoikis present), [II0] (no anoikis present), and [I00] (no anchorage-dependent growth, and no anoikis present). In Fig. 7 A the cell-substrate anchorage has a strength of 600 μN/m, and in Fig. 7 B, a strength of 200 μN/m. The macroscopic morphologies reflect the respective regulation mechanisms as well as the different strengths of cell-substrate adhesion.
FIGURE 7.

Vertical sections through cell populations with N = 5000 cells for a cell substrate anchorage of (A) 600 μN/m and (B) 200 μN/m. The growth regulation states [XXX] are indicated. Shaded level as in Fig. 2.
If the cell-substrate anchorage is strong, only a very few cells lose substrate contact. In this case a second layer does not form even in the absence of anoikis as long as the growth is anchorage-dependent ([III], [II0]). The reason for this is that almost all cells in the interior of the basal layer stop proliferation as a consequence of contact inhibition.
If anoikis is present ([III]), the few cells that lose contact to the basal layer are completely eliminated; but in the absence of anoikis ([II0]), they remain above the basal layer. Furthermore, if the growth becomes anchorage-independent ([I00]), cells that leave the basal layer continue to proliferate and form three-dimensional aggregates.
If the cell-substrate anchorage is weak, many cells are forced out of the basal layer. If all regulation mechanisms are present ([III]) most of the cells that lose substrate contact are eliminated by anoikis, hence no confluent second cell layer can form above the basal layer. If anoikis is absent ([II0], [I00]) a thick multilayer forms. If the growth is anchorage-dependent ([II0]), cells proliferate only near the basal layer. If cell division becomes anchorage-independent ([I00]), cells on the entire surface of the population proliferate.
Cell-cell contact-mediated regulation
We have shown above that if cells in the basal layer do not stop proliferation (thereby forcing other cells to leave the basal layer), a limited growth zone does not form. As demonstrated in Fig. 8, this situation occurs not only when the cell-surface anchorage is too weak to prevent cells from losing substrate contact, but also when the relative threshold compression, at which cells undergo contact inhibition, is so large that cells are forced out of the basal layer before a proliferation stop from contact inhibition occurs—despite the strong cell-substrate anchorage (600 μN/m).
FIGURE 8.

Population radius RP and averaged cell age versus time t of populations with different threshold compression VP/V0. (Full lines, VP/V0 = 0.99; dashed lines, VP/V0 = 0.95; and dotted lines, VP/V0 = 0.90.) Additional vertical sections through the populations at N = 10.000 are shown. Shaded values as in Fig. 2.
Morphology and growth kinetics are very similar in both cases. Both a decrease of the cell-substrate anchorage strength and an increase of the threshold compression at which cells stop proliferation by contact inhibition are able to destabilize a single-layered structure. Such a destabilization of the morphology is accompanied by a significant elongation of the crossover from exponential growth to a final constant spreading velocity at a very large population size. In analogy to the critical cell-substrate anchorage (compare to Fig. 5), a critical relative threshold volume VP/V0 exists, separating stable and unstable growth of the population. The spreading velocity v of the population is again maximal at this critical threshold. However, the spreading velocity v still remains within the small range of some μm/h.
DISCUSSION
We introduced a novel three-dimensional, individual-based model of epithelial cell populations in vitro that explicitly accounts for epithelial growth regulation and growth control mechanisms. We found that if all regulation and control mechanisms are active, and as long as the cell-substrate anchorage is larger than the cell-cell anchorage (i.e., ɛs > ɛc), our model cells essentially form confluent cell monolayers. Both the population morphology and kinetics in our findings are in qualitative agreement with those experimentally found. By parameter variations and selective knockouts of regulation and control mechanisms we studied how the temporal-spatial dynamics of the cell populations depend on biomechanical and kinetic cell properties, and how these may be affected by the absence, presence, and the interplay of the growth regulation and control mechanisms.
We found that, in particular, the cell-substrate anchorage has a significant impact on the population morphology. For instance, at an intrinsic cell growth time τ of ∼12 h, the cells within a monolayer undergo contact inhibition of growth only for strong cell-substrate anchorage. Furthermore, we found that the way the intrinsic cell growth time affects the growth of a population is determined by the balance between the strength of cell-substrate anchorage and the trigger for contact inhibition. In contrast, we found the growth kinetics to be remarkably robust against variations of that parameter within any specific model. In all simulations, the spreading velocities obtained were found to be restricted to a range between 0.5 and 5.0 μm/h due to self-regulation processes. Interestingly, a maximum spreading velocity of the population was found for an intermediate cell-substrate anchorage. This result is not related to findings of a maximum migration velocity of single cells at an intermediate cell-substrate anchorage (DiMilla et al., 1993). In our model the spreading velocity of a population on large timescales is determined by cell proliferation and not by the active (isotropic) cell migration introduced (compare to Eq. 6). A significant contribution of active cell migration requires a biased migration of the individual cells at least at the population periphery (unpublished results).
The substrate anchorage of epithelial cells can be easily varied in vitro by modifying the substrate, e.g., by replacement of the integrin ligands or blocking integrins using antibodies (Lee and Juliano, 2000). Moreover one can investigate transfected cells with up- or downregulated expression levels of specific integrins (Lee and Juliano, 2000). However, these changes may also affect those signal transduction pathways in the cell that involve growth regulation and control mechanisms (Stupack and Cheresh, 2002; Aplin et al., 1999; Assoian, 1997). This interplay of generic and genetic mechanisms makes it difficult to interpret the results of such experiments. By knockout simulations we have shown that our model approach allows us to interpret such experiments and to generate new hypotheses by experiments performed in silico. We found that the efficacy of the regulation mechanisms depends sensitively upon the cell-substrate anchorage. For instance, anoikis contributes relevantly to growth control only in the case of low cell-substrate anchorage, or if contact inhibition is deficient. We found that its failure can be balanced by cell-cell contact-mediated growth inhibition in the presence of strong cell-substrate anchorage (Fig. 7).
The efficacy of anoikis is known to depend also on cell-cell adhesion. Epithelial cells forming strong adhesive cell-cell contacts were found to survive longer after losing substrate contact (Santini et al., 2000). In our model we neglect this dependence of anoikis on cell-cell adhesion. Furthermore, we studied the effect of the presence or absence of anchorage-dependent growth and anoikis on epithelial organization in an all-or-nothing way. In experiments it was found that the proliferation activity and apoptosis rates of individual cells may depend on such variable quantities as the ligand-coating density of the support (Warchol, 2002; and Lee and Juliano, 2000).
To account for such specific regulation effects, our model has to be further stratified. For instance, one can consider the threshold size of the substrate contact ( ) that must be overcome to start cell proliferation, or a minimum size of cell-substrate contact (
 ), below which anoikis occurs. In this article we set both of these thresholds to zero. In the case of
  cell-cell contact formation (which is accompanied by a change of the cell substrate contact area; see above) may induce adherent cells to stop proliferation even if they have space to grow, and may undergo apoptosis regardless of an established substrate contact (in agreement with experimental findings; Huang and Ingber, 2000). However, these thresholds may depend on the cell type and culture conditions. Focusing on qualitative growth and regulation properties, we did not vary them in our model. Large values of
  and
and  may require us to consider large deviations from a spherical cell shape and effects such as surface receptor clustering (Woolf and Linderman, 2003; Koo et al., 2002).
In our model a prerequisite of activation of contact inhibition is a cell-cell contact formation causing cytoskeleton deformation and cell compression but not specific cell-cell adhesion. This scenario follows the experimental findings of Gloushankova et al. (1997) and is along the line of argument given by Huang and Ingber (1999), assuming the cell shape to be a critical determinant in growth regulation. Cell adhesion molecules tune the size of the contacts and enable surface coupling to the cytoskeleton, and also may be involved in autocrine circuits detecting extracellular volume compression (Tschumperlin et al., 2004). Thus, their expression profile specifies the trigger of signal transduction.
Our model interpretation requires intact signal transduction pathways to couple the physical events to intracellular regulation mechanisms. Decreasing the ability of the cells to sense cell compression as an indicator of strong cell deformation (see Fig. 8), we found the population morphology to be sustainably affected. However, the growth kinetics again was found to be remarkably robust. The full knockout of a regulation mechanism refers to perturbed signaling and interrupted pathways. Here, we have introduced a model to interpret experimental findings on transformed cell lines as the breakdown of cell polarity and three-dimensional aggregation (Yan et al., 1997; Lu et al., 1995) as failures of quasilinear signaling pathways (i.e., any control or regulation mechanism can be independently knocked out). Examples are given in Fig. 7. However, interference of different signal pathways is well known from experiments. For instance, the oncogene Bcl-2 is assumed to have a potent ability to disrupt apoptotic signal pathways (Stupack and Cheresh, 2002). In parallel, overexpressed Bcl-2 was found to deregulate the expression of E-cadherin (a major cell-cell adhesion molecule), which also affected contact inhibition (Lu et al., 1995). Perhaps the most complex response is observed as feedback to changes of the β-catenin expression. For transfectants of epithelial cells showing overexpression of that oncogene, a deregulation of growth was observed regarding contact inhibition, anchorage-dependent growth, anoikis, and the expression of adhesion molecules (Orford et al., 1999). To adopt such kind of complex coregulation, we will account for simple protein regulation networks (Huang and Ingber, 2000) in further studies.
In this article we focused on cell populations only in their initial expanding growth phase, with the assumption that cell differentiation and maturation do not occur during this phase. Furthermore, all cells were assumed to be capable of proliferation and able to produce an unlimited number of progeny. Thus each of the cells would be able to self-maintain the population and to regenerate it after injury (compare Fig. 2). Consequently, our cells comply with the stem cell criteria introduced by Loeffler and Potten (1997) and Loeffler and Roeder (2004, 2002), except in their ability to differentiate. Introducing differentiation in our model will open further perspectives, as the investigation of the spatial-temporal organization of tissue stem cell populations.
We stated that all model parameters introduced can be experimentally measured. Since we found no experiment in which all of them were measured simultaneously, we suggest that this might be done in the future. From our point of view, most interesting would be in an experimental quantification of the parameters characterizing cell compression of epithelial cells, first of all of the Poisson ratio as in Maniotis et al. (1997), and a detailed investigation of the mechanisms related to growth regulation mediated by cell-cell contact as in Helmlinger et al. (1997), providing more information about the effects of cell compression. For the computer simulations in this article, we estimated potential parameter ranges from the literature on different cell systems.
We finally stress that the growth behavior on large timescales, compared to the cell growth time τ, is quite insensitive to the details of the model. By variation of the model we found a remarkable robustness of the results 1), if the cell division was linked either to the actual cell volume (cell division at VA = 2V0) or to a second proliferation threshold (VA = 2Vp); 2), if the correlation between the orientation of the cell division and the force exerted on the dividing cell was skipped; and 3), if the size of the stochastic volume increments during cell growth was decreased up to one order of magnitude. This robustness agrees with findings in simpler models (Drasdo, 1996; Drasdo et al., 1995), and is a major reason why the growth behavior of cell populations can be approached on such different levels of complexity.
We close our discussion by suggesting an experiment we believe to be well suited to testing basic features of our model. We suggest growing different epithelial cell lines on an elastic substrate which, at the same time, is continuously stretched with a constant velocity (Fig. 9). The stretching velocity should be of the same order of magnitude as the spreading velocity of the population growing on a static substrate. This experimental setup insures passive cell motion (since the cell moves with the substrate) such that the cell density, and with it, any existing compression of the cells, is reduced. Fig. 9 summarizes our model predictions for this experiment: 1), that the population should no longer grow spherically; and 2), that contact inhibition, if present, should be reduced compared to the reference system with static substrate (i.e., the proliferation activity should increase). As a consequence, the number of cells within the population should grow faster (see Fig. 9, inset). We like to point out that such a proliferation increase has already been observed in stretched monolayers of Madin-Darby canine kidney cells in a similar experimental setting (Tanner et al., 1995).
FIGURE 9.

Stretched elastic substrate. Top view of a reference cell population of size N = 10,000. Whereas the left-hand boundary of the underlying substrate is fixed, the right-hand boundary is moved with a constant velocity of 5 μm/h. (Inset) Number of cells N versus time t. For comparison, the result for static substrate is included (dashed line).
In fact, these changes may be attributed to the dramatic changes of gene expression after shear stress in epithelial cells (Kaysen et al., 1999), leading directly to the largely open problem of how shape changes are linked to gene expression. Although the experimental study outlines the behavior as a specific property of Madin-Darby canine kidney cells, our model suggests that it should be generic at least for undifferentiated epithelial cells. Here, the interesting question arises whether there may be generic changes in the gene expression profiles as well.
We think this example demonstrates that individual cell-based models like the ones introduced in this article, which are parameterized by experimental measurable cell- and substrate-specific properties and involve a coupling between generic and genetic control mechanisms, will be capable not only of explaining the complex pattern formation and growth processes of cell populations, but will be also useful in separating specific from generic cell properties. This view is supported by simulations with a conceptual identical model approach, which suggest the same growth scenario for tumor spheroids as for monolayers. However, the specific origin for the linear expanding phase can either be contact inhibition (Drasdo and Hoehme, 2003) or nutrient limitation (D. Drasdo and S. Hoehme, unpublished).
Acknowledgments
We thank C.S. Potten (Manchester, UK) and A. Watson (Liverpool, UK) for helpful discussion and comments.
The work by D.D. was done while he was at the Planck Institute for Mathematics in the Sciences; he made fundamental contributions to the biophysical part and the thematic directions of the article.
J.G. was supported by Deutsche Forschungsgemeinschaft grant BIZ–6 1/1.
APPENDIX 1: DETERMINISTIC FORCES
The total interaction energy between two cells i and j is defined by
 |
(8) |
(compare Eqs. 1–4). Wij depends on the distance between the cells and the radius of both cells. The cell-substrate interaction energy Wi,s is defined analogously.
The generalized forces on the right-hand side of Eqs. 6 and 7 are given by
 |
(9) |
respectively; and rij = |rij| = |ri−rj|, where ri and rj are the position vectors of cell i and j, respectively. In the same way ri,s is the distance between cell i and the substrate s; ni,j = rij/|rij| and ni,s = ris/|ris|.
APPENDIX 2: STOCHASTIC FORCES
The friction coefficient matrix between cells i and j (or cell i and the substrate s) is defined by
 |
(10) |
where l,k = 1,2,3 ([nl nk] is a 3 × 3 matrix), and n1, n2, and n3 are the components of ni,j.
Here we assume that the normal and tangential friction constants are equal (compare Table 1), such that cn = cp. Hence Ci,jwi simplifies to ci,jwi, where ci,j is a (scalar) friction coefficient given by Eq. 5. We define γi by
 |
(11) |
Thus, for the amplitude of the stochastic force  it holds that
 |
(12) |
Furthermore, we assume 
References
- Andre, F., V. Rigot, J. Thimonier, C. Montixi, F. Parat, G. Pommier, J. Marvaldi, and J. Luis. 1999. Integrins and E-cadherin cooperate with IGF-I to induce migration of epithelial colonic cells. Int. J. Cancer. 83:497–505. [DOI] [PubMed] [Google Scholar]
- Aplin, A. E., A. K. Howe, and R. L. Juliano. 1999. Cell adhesion molecules, signal transduction and cell growth. Curr. Opin. Cell Biol. 11:737–744. [DOI] [PubMed] [Google Scholar]
- Assoian, R. K. 1997. Anchorage-dependent cell cycle progression. J. Cell Biol. 136:1–4. [DOI] [PMC free article] [PubMed] [Google Scholar]
- Balkovetz, D. F. 1999. Evidence that hepatocyte growth factor abrogates contact inhibition of mitosis in Madin-Darby canine kidney cell monolayers. Life Sci. 64:1393–1401. [DOI] [PubMed] [Google Scholar]
- Bates, R. C., N. S. Edwards, and J. D. Yates. 2000. Spheroids and cell survival. Crit. Rev. Oncol. Hematol. 36:61–74. [DOI] [PubMed] [Google Scholar]
- Benoit, M., D. Gabriel, G. Gerisch, and H. E. Gaub. 2000. Discrete interactions in cell adhesion measured by single-molecule force spectroscopy. Nat. Cell Biol. 2:313–317. [DOI] [PubMed] [Google Scholar]
- Beysens, D., G. Forgacs, and J. A. Glazier. 2000. Cell sorting is analogous to phase ordering in fluids. Proc. Natl. Acad. Sci. USA. 97:9467–9471. [DOI] [PMC free article] [PubMed] [Google Scholar]
- Bickenbach, J. R., and M. Dunnwald. 2000. Epidermal stem cells: characteristics and use in tissue engineering and gene therapy. Adv. Dermatol. 16:159–183. [PubMed] [Google Scholar]
- Brodland, G. W., and J. H. Veldhuis. 2002. Computer simulations of mitosis and interdependencies between orientation, cell shape and epithelia reshaping. J. Biomech. 35:673–681. [DOI] [PubMed] [Google Scholar]
- Bru, A., J. Pastor, I. Fernaud, I. Brú, S. Melle, and C. Berenguer. 1998. Super-rough dynamics on tumor growth. Phys. Rev. Lett. 81:4008–4011. [Google Scholar]
- Carpick, R. W., D. F. Ogletree, and M. Salmeron. 1999. A general equation for fitting contact area and friction vs. load measurements. J. Colloid Interface Sci. 211:395–400. [DOI] [PubMed] [Google Scholar]
- Charras, G. T., and M. A. Horton. 2002. Determination of cellular strains by combined atomic force microscopy and finite element modeling. Biophys. J. 83:858–879. [DOI] [PMC free article] [PubMed] [Google Scholar]
- Chen, C. S., M. Mrksich, S. Huang, G. M. Whitesides, and D. E. Ingber. 1997. Geometric control of cell life and death. Science. 276:1425–1428. [DOI] [PubMed] [Google Scholar]
- Chesla, S. E., P. Selvaraj, and C. Zhu. 1998. Measuring two-dimensional receptor-ligand binding kinetics by micropipette. Biophys. J. 75:1553–1572. [DOI] [PMC free article] [PubMed] [Google Scholar]
- Comijn, J., G. Berx, P. Vermassen, K. Verschueren, L. van Grunsen, E. Bruyneel, M. Mareel, D. Hylebroeck, and F. van Roy. 2001. The two-handed E-box binding zinc finger protein SIP1 downregulates E-cadherin and induces invasion. Mol. Cell. 7:1267–1278. [DOI] [PubMed] [Google Scholar]
- Dallon, J. C., and H. G. Othmer. 2004. How cellular movement determines the collective force generated by the Dictyostelium discoideum slug. J. Theor. Biol. 231:299–306. [DOI] [PMC free article] [PubMed] [Google Scholar]
- DiMilla, P. A., J. A. Stone, J. A. Quinn, S. M. Albelda, and D. A. Lauffenburger. 1993. Maximal migration of human smooth muscle cells on fibronectin and type IV collagen occurs at an intermediate attachment strength. J. Cell Biol. 122:729–737. [DOI] [PMC free article] [PubMed] [Google Scholar]
- Dormann, S., and A. Deutsch. 2002. Modelling of self-organized avascular tumor growth with a hybrid cellular automaton. In Silico Biol. 2:393–406. [PubMed] [Google Scholar]
- Drasdo, D., and S. Hoehme. 2003. Individual-based approaches to birth and death in avascular tumors. Math. Comp. Mod. 37:1163–1175. [Google Scholar]
- Drasdo, D. 2003. On selected individual-based approaches to the dynamics in multicellular systems. In Multiscale Modelling and Numerical Simulations. W. Alt, M. Chaplain, M. Griebel, and J. Lenz, editors. Birkhäuser, Basel, Switzerland.
- Drasdo, D., and M. Loeffler. 2001. Individual-based models on growth and folding in one-layered tissues: intestinal crypts and early development. Nonlin. Anal. 47:245–256. [Google Scholar]
- Drasdo, D., and G. Forgacs. 2000. Modelling the interplay of generic and genetic mechanisms in cleavage, blastulation, and gastrulation. Dev. Dyn. 219:182–191. [DOI] [PubMed] [Google Scholar]
- Drasdo, D. 1996. Different growth regimes found in a Monte Carlo model of growing tissue cell populations. In Self-Organization of Complex Structures: From Individual to Collective Dynamics. F. Schweitzer, editor. Gordon and Breach, London. 281–292.
- Drasdo, D., R. Kree, and J. S. McCaskill. 1995. Monte-Carlo approach to tissue-cell populations. Phys. Rev. E. 52:6635–6657. [DOI] [PubMed] [Google Scholar]
- Drubin, D. G., and W. J. Nelson. 1996. Origins of cell polarity. Cell. 84:335–344. [DOI] [PubMed] [Google Scholar]
- Frisch, T., and O. Thoumine. 2002. Predicting the kinetics of cell spreading. J. Biomech. 35:1137–1141. [DOI] [PubMed] [Google Scholar]
- Galle, J., M. Loeffler, and D. Drasdo. 2003. On the temporal-spatial organisation of epithelial cell populations in vitro. In Mathematical Modelling and Computing in Biology and Medicine. M.V. Capasso, editor. Progetto Leonardo, Bologna, Italy. 413–420.
- Gloushankova, N. A., N. A. Alieva, M. F. Krendel, E. M. Bonder, H. H. Feder, J. M. Vasiliev, and I. M. Gelfand. 1997. Cell-cell contact changes the dynamics of lamellar activity in nontransformed epitheliocytes but not in their ras-transformed descendants. Proc. Natl. Acad. Sci. USA. 94:879–883. [DOI] [PMC free article] [PubMed] [Google Scholar]
- Graner, F., and J. A. Glazier. 1993. Simulation of biological cell sorting using a two-dimensional extended Potts model. Phys. Rev. Lett. 69:2013–2016. [DOI] [PubMed] [Google Scholar]
- Grossmann, J., K. Walther, M. Artinger, S. Kiessling, and J. Schölmerich. 2001. Apoptotic signaling during initiation of detachment-induced apoptosis (“anoikis”) of primary human intestinal epithelial cells. Cell Growth Diff. 12:147–155. [PubMed] [Google Scholar]
- Guck, J., R. Ananthakrishnan, H. Mahmood, T. J. Moon, C. C. Cunningham, and J. Käs. 2001. The optical stretcher: a novel laser tool to micromanipulate cells. Biophys. J. 81:767–784. [DOI] [PMC free article] [PubMed] [Google Scholar]
- Helmlinger, G., P. A. Netti, H. C. Lichtenbeld, R. J. Melder, and R. K. Jain. 1997. Solid stress inhibits the growth of multicellular tumor spheroids. Nature Biotech. 15:778–783. [DOI] [PubMed] [Google Scholar]
- Hertz, H. 1882. Über die Berührung fester elastischer Körper (On the contact of elastic solids). J. Reine Angew. Math. 92:156–171. [Google Scholar]
- Hogeweg, P. 2000. Evolving mechanisms of morphogenesis: on the interplay between differential adhesion and cell differentiation. J. Theor. Biol. 203:317–333. [DOI] [PubMed] [Google Scholar]
- Honda, H., M. Tanemu, and A. Yoshida. 2000. Differentiation of wing epidermal scale cells in a butterfly under the lateral inhibition model—appearance of large cells in a polygonal pattern. Acta Biotheor. 48:121–136. [DOI] [PubMed] [Google Scholar]
- Hu, S., J. Chen, B. Fabry, Y. Numaguchi, A. Gouldstone, D. E. Ingber, J. J. Fredberg, J. P. Butler, and N. Wang. 2003. Intracellular stress tomography reveals stress focusing and structural anisotropy in cytoskeleton of living cells. Am. J. Physiol. 285:C1082–C1090. [DOI] [PubMed] [Google Scholar]
- Huang, S., and D. E. Ingber. 2000. Shape-dependent control of cell growth, differentiation, and apoptosis: switching between attractors in cell regulatory networks. Exp. Cell Res. 261:91–103. [DOI] [PubMed] [Google Scholar]
- Huang, S., and D. E. Ingber. 1999. The structural and mechanical complexity of cell-growth control. Nat. Cell Biol. 1:E131–E138. [DOI] [PubMed] [Google Scholar]
- Kaysen, J. H., W. C. Campbell, R. R. Majewski, F. O. Goda, G. L. Navar, F. C. Lewis, T. J. Goodwin, and T. G. Hammond. 1999. Select de novo gene and protein expression during renal epithelial cell culture in rotating wall vessels is shear-stress dependent. J. Membr. Biol. 168:77–89. [DOI] [PubMed] [Google Scholar]
- Klekotka, P. A., S. A. Santoro, A. Ho, S. F. Dowdy, and M. M. Zutter. 2001. Mammary epithelial cell-cycle progression via the α2β1-integrin. Am. J. Pathol. 159:983–992. [DOI] [PMC free article] [PubMed] [Google Scholar]
- Koo, L. Y., D. J. Irvine, A. M. Mayes, D. A. Lauffenburger, and L. G. Griffith. 2002. Co-regulation of cell adhesion by nanoscale RGD organization and mechanical stimulus. J. Cell Sci. 115:1423–1433. [DOI] [PubMed] [Google Scholar]
- Landau, L. D., and E. M. Lifschitz. 1986. Theory of Elasticity, 3rd Rev. Pergamon Press, Oxford.
- Lee, J. W., and R. L. Juliano. 2000. α5β1 Integrin protects intestinal epithelial cells from apoptosis through phosphatidylinositol 3-kinase and protein kinase B-dependent pathway. Mol. Biol. Cell. 11:1973–1987. [DOI] [PMC free article] [PubMed] [Google Scholar]
- Li, L., J. Backer, A. S. K. Wong, E. L. Schwanke, B. G. Stewart, and M. Pasdar. 2003. Bcl-2 expression decreases cadherin-mediated cell-cell adhesion. J. Cell Sci. 116:3687–3700. [DOI] [PubMed] [Google Scholar]
- Loeffler, M., and I. Roeder. 2004. Conceptual models to understand tissue stem cell organization. Curr. Opin. Hematol. 11:81–87. [DOI] [PubMed] [Google Scholar]
- Loeffler, M., and I. Roeder. 2002. Tissue stem cells: definition, plasticity, heterogeneity, self organization and models—a conceptual approach. Cells Tissues Organs. 171:8–26. [DOI] [PubMed] [Google Scholar]
- Loeffler, M., and C. S. Potten. 1997. Stem cells and cellular pedigrees—a conceptual introduction. In Stem Cells. C.S. Potten, editor. Academic Press, London. 1–27.
- Loeffler, M., C. S. Potten, and H. E. Wichmann. 1987. Epidermal cell proliferation. Virchows Arch. B. 53:286–300. [PubMed] [Google Scholar]
- Lu, P. J., Q. L. Lu, A. Rughetti, and J. Taylor-Papadimitriou. 1995. bcl-2 Overexpression inhibits cell death and promotes the morphogenesis, but not tumorigenesis of human mammary epithelial cells. J. Cell Biol. 129:1363–1378. [DOI] [PMC free article] [PubMed] [Google Scholar]
- Mahaffy, R. E., C. K. Shih, F. C. McKintosh, and J. Käs. 2000. Scanning probe-based frequency-dependent microrheology of polymer gels and biological cells. Phys. Rev. Lett. 85:880–883. [DOI] [PubMed] [Google Scholar]
- Maheshwari, G., H. S. Wiley, and D. A. Lauffenburger. 2001. Autocrine epidermal growth factor signaling stimulates directionally persistent mammary epithelial cell migration. J. Cell Biol. 155:1123–1128. [DOI] [PMC free article] [PubMed] [Google Scholar]
- Maniotis, A. J., C. S. Chen, and D. E. Ingber. 1997. Demonstration of mechanical connections between integrins, cytoskeletal filaments, and nucleoplasm that stabilize nuclear structure. Proc. Natl. Acad. Sci. USA. 94:849–854. [DOI] [PMC free article] [PubMed] [Google Scholar]
- Meineke, F. A., C. S. Potten, and M. Loeffler. 2001. Cell migration and organisation in the intestinal crypt using a lattice-free model. Cell Prolif. 34:253–266. [DOI] [PMC free article] [PubMed] [Google Scholar]
- Mombach, J. C., and J. A. Glazier. 1996. Single cell motion in aggregates of embryonic cells. Phys. Rev. Lett. 76:3032–3035. [DOI] [PubMed] [Google Scholar]
- Moy, V. T., E. L. Florin, and H. E. Gaub. 1994. Intermolecular forces and energies between ligands and receptors. Science. 266:257–259. [DOI] [PubMed] [Google Scholar]
- Odell, G. M., G. Oster, B. Burnside, and P. Alberch. 1980. A mechanical model for epithelial morphogenesis. J. Math. Biol. 9:291–295. [DOI] [PubMed] [Google Scholar]
- Orford, K., C. C. Orford, and S. W. Byers. 1999. Exogenous expression of β-catenin regulates contact inhibition. anchorage-independent growth, anoikis, and radiation-induced cell cycle arrest. J. Cell Biol. 146:855–867. [DOI] [PMC free article] [PubMed] [Google Scholar]
- Palsson, E., and H. G. Othmer. 2000. A model for individual and collective cell movement in Dictyostelium discoideum. Proc. Natl. Acad. Sci. USA. 97:10448–10453. [DOI] [PMC free article] [PubMed] [Google Scholar]
- Piper, J. W., R. A. Swerlick, and C. Zhu. 1998. Determining force dependence of two-dimensional receptor-ligand. binding affinity by centrifugation. Biophys. J. 74:492–513. [DOI] [PMC free article] [PubMed] [Google Scholar]
- Paulus, U., M. Loeffler, J. Zeidler, G. Owen, and C. S. Potten. 1993. The differentiation and lineage development of goblet cells in the murine small intestinal crypt: experimental and modeling studies. J. Cell Sci. 106:473–484. [DOI] [PubMed] [Google Scholar]
- Santini, M. T., G. Rainaldi, and P. L. Indovina. 2000. Apoptosis, cell adhesion and extracellular matrix in the three-dimensional growth of multicellular tumor spheroids. Crit. Rev. Oncol. Hematol. 36:75–87. [DOI] [PubMed] [Google Scholar]
- Schienbein, M., K. Franke, and H. Gruler. 1994. Random walk and directed movement: comparison between inert particles and self-organized molecular machines. Phys. Rev. E. 49:5462–5471. [DOI] [PubMed] [Google Scholar]
- Schwarz, U. S., N. Q. Balaban, D. Riveline, A. Bershadsky, B. Geiger, and S. A. Safran. 2002. Calculation of forces at focal adhesions from elastic substrate data: the effect of localized force and the need for regularization. Biophys. J. 83:1380–1394. [DOI] [PMC free article] [PubMed] [Google Scholar]
- Sevsek, F., S. Svetina, and B. Zeks. 1992. The effect of membrane elasticity on shapes of nearly spherical phospholipid vesicles. In Springer Proceedings in Physics 66. Springer Verlag, Berlin. 101–104.
- Sheppard, D. 2003. Functions of pulmonary epithelial integrins: from development to disease. Physiol. Rev. 83:673–686. [DOI] [PubMed] [Google Scholar]
- Stupack, D. G., and D. A. Cheresh. 2002. Get a ligand, get a life: integrins, signaling and cell survival. J. Cell Sci. 115:3729–3738. [DOI] [PubMed] [Google Scholar]
- Suzuki, K., J. Saito, R. Yanai, N. Yamada, T. Chikama, K. Seki, and T. Nishida. 2003. Cell-matrix and cell-cell interactions during corneal epithelial wound healing. Prog. Retinal Eye Res. 22:113–133. [DOI] [PubMed] [Google Scholar]
- Tanner, G. A., P. F. McQuillan, M. R. Maxwell, J. K. Keck, and J. A. McAteer. 1995. An in vitro test of the cell stretch-proliferation hypothesis of renal cyst enlargement. J. Am. Soc. Nephrol. 6:1230–1241. [DOI] [PubMed] [Google Scholar]
- Teller, I. C., and J.-F. Beaulieu. 2001. Interactions between laminin and epithelial cells in intestinal health and disease. Exp. Rev. Mol. Med. 28:1–16. [DOI] [PubMed] [Google Scholar]
- Tomakidi, P., D. Breitkreutz, N. E. Fusenig, J. Zoeller, A. Kohl, and G. Komposch. 1998. Establishment of oral mucosa phenotype in vitro in correlation to epithelial anchorage. Cell Tissue Res. 292:355–366. [DOI] [PubMed] [Google Scholar]
- Tschumperlin, D. J., G. Dai, I. V. Maly, T. Kikuchi, L. H. Laiho, A. K. McVittie, K. J. Haley, C. M. Lilly, P. T. C. So, D. A. Lauffenburger, R. D. Kamm, and J. M. Drazen. 2004. Mechanotransduction through growth-factor shedding into the extracellular space. Nature. 429:83–86. [DOI] [PMC free article] [PubMed] [Google Scholar]
- van Opheusen, J. H. J., F. W. Wiegel, and B. Goldstein. 1984. Forward rate constants for receptor clusters, variational methods for upper and lower bounds. Biophys. Chem. 20:237–248. [DOI] [PubMed] [Google Scholar]
- Vermeulen, K., D. R. Van Bockstaele, and Z. N. Berneman. 2003. The cell cycle: a review of regulation, deregulation and therapeutic targets in cancer. Cell Prolif. 36:131–149. [DOI] [PMC free article] [PubMed] [Google Scholar]
- Warchol, M. E. 2002. Cell density and N-cadherin interaction regulates cell proliferation in the sensory epithelia of the inner ear. J. Neurosci. 22:2607–2616. [DOI] [PMC free article] [PubMed] [Google Scholar]
- Woolf, P. J., and J. J. Linderman. 2003. Self organisation of membrane proteins via dimerization. Biophys. Chem. 104:217–227. [DOI] [PubMed] [Google Scholar]
- Wright, N. A., and M. Alison. 1984. The Biology of Epithelial Cell Population, Vols. 1 and 2. Clarendon Press, Oxford.
- Yan, Z., M. Chen, M. Perucho, and E. Friedman. 1997. Oncogenic Ki-ras but not oncogenic Ha-ras blocks integrin β1-chain maturation in colon epithelial cells. J. Biol. Chem. 272:30928–30936. [DOI] [PubMed] [Google Scholar]