Abstract
External control of oscillatory glycolysis in yeast extract has been performed by application of either homogeneous temperature oscillations or stationary, spatial temperature gradients. Entrainment of the glycolytic oscillations by the 1/2- and 1/3-harmonic, as well as the fundamental input frequency, could be observed. From the phase response curve to a single temperature pulse, a distinct sensitivity of NADH-oxidizing processes, compared with NAD-reducing processes, is visible. Determination of glycolytic intermediates shows that the feedback-regulated phosphofructokinase as well as the glyceraldehyde-3-phosphate dehydrogenase are the most temperature-sensitive steps of glycolysis. We also find strong concentration changes in ATP and AMP at varying temperatures and, accordingly, in the energy charge. Construction of a feedback loop for spatial control of temperature by means of a Peltier element allowed us to apply a temperature gradient to the yeast extract. With this setup it is possible to initiate traveling waves and to control the wave velocity.
INTRODUCTION
Feedback control in open systems is a characteristic property of life and can be observed at all levels of biological organization, ranging from single cells to organs and organisms. A common behavior, associated with this kind of regulation, is the occurrence of oscillations. Rhythmic changes of enzyme activities and their metabolites are known for many different organisms (Hess, 1997; Berridge and Rapp, 1979). There are more and more experimental as well as theoretical results, which demonstrate that temporal oscillations can have important impacts for biological information processing, e.g., as frequency encoding (De Koninck and Schulman, 1998; Hajnoczky et al., 1995; Dupont and Goldbeter, 1998; Tang and Othmer, 1995).
Investigations of chemical model systems, for example, the Belousov-Zhabotinsky reaction (Zaikin and Zhabotinsky, 1970), have shown that autocatalytic (e.g., feedback-regulated) reactions can lead to the formation of dynamic (Müller et al., 1985) as well as stationary (Castets et al., 1990) patterns, provided they are coupled to transport, e.g., diffusion in unstirred solutions. Recently, traveling reaction-diffusion waves have been reported in many different biological systems, for instance, traveling calcium waves in frog eggs (Lechleiter et al., 1991) or cAMP waves in Dictyostelium discoideum cell layers (Alcantara and Monk, 1974). The propagation dynamics of these waves also contain information, which may act at another hierarchic level of cellular organization; e.g., they can coordinate cellular processes at larger spatial scales (Petty and Kindzelskii, 2001).
Due to the enormous potential of nonlinear reactions for biological information processing, there is a general interest to control the dynamics of spatial and temporal patterns by external forces. Glycolysis plays a central role for the energy metabolism of nearly all living organisms as well as for the coordination of metabolic networks. Experimental (Markus et al., 1985; Boiteux et al., 1975) as well as theoretical (Termonia and Ross, 1982) work, has demonstrated that temporal oscillations of glycolysis in a yeast extract can be efficiently entrained by periodic glucose infusion. Our own findings (Mair and Müller, 1996; Mair et al., 2001), as well as the results from Petty and Kindzelskii (2001), have shown that oscillatory glycolysis is additionally associated with the generation of traveling NADH and proton waves. These glycolytic patterns may be a means for the regulatory functions of glycolysis, e.g., the propagation of spatial information (cf. Dzeja and Terzic, 2003). For the elucidation of the functions of these spatial phenomena an external control with noninvasive perturbations is required. The results of this work demonstrate that temperature can be efficiently used for this purpose.
MATERIALS AND METHODS
Preparation of yeast extract
All experiments were performed with cell-free yeast extracts from commercially available baker's yeast (Saccharomyces cerevisiae), except for the experiments with spatial temperature control, where aerobically grown Saccharomyces carlsbergensis was used. These two yeast strains differ in their sensitivity toward temperature for optimal growth. Although the temperature optimum for S. cerevisiae is 32°C, it is 28°C for S. carlsbergensis.
The extracts were prepared according to the method published by Hess and Boiteux (1968), except that the phosphate buffer was replaced by 25 mM MOPS, 50 mM KCl, pH 6.5.
Measurement of glycolytic oscillations and control of temperature
Two different methods were applied. For investigation of temporal dynamics, the glycolytic oscillations were started by addition of trehalose and phosphate to the yeast extract, and the absorbance changes of NADH at 344 nm were spectrophotometrically determined with a thermostatic photometer. These experiments were done with yeast extract from S. cerevisiae.
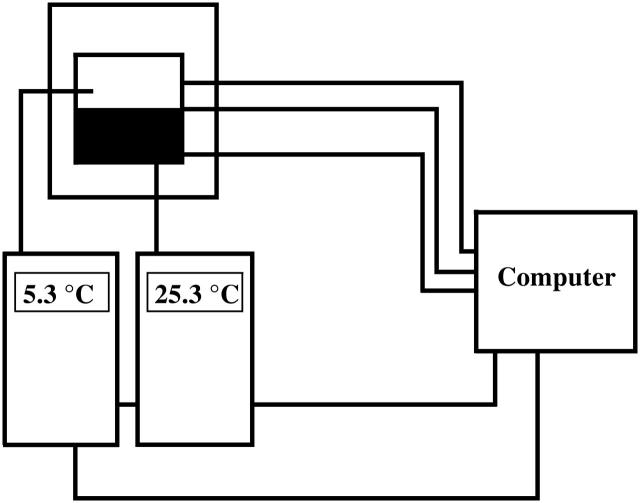
For investigations of spatial and temporal dynamics, yeast extract was fixed together with trehalose and phosphate in 1% agarose-gel (Type IXA; Sigma, St. Louis, MO). The gelation process was performed at ∼0°C and the resulting gel placed on a Peltier element. This Peltier element served to control the temperature in the gel, either in a spatially homogeneous way (oscillations) or to produce spatial temperature gradients. A detailed description of this setup will be presented elsewhere. Briefly, the current flow through the Peltier element is controlled by a computer in such a manner that one-half of the element can be cooled whereas the other half can be heated, which establishes well-defined temperature gradients. These gradients were measured and quantified with an infrared camera and with thermocouples. Conventional homogeneous cooling/heating is also possible. The temperature in the gel is measured at two opposite sides of the gel with thermocouples to control the temperature via a feedback loop regulated by PID controllers (Fig. 1). The time constant of this control loop is 18 s. This is well below the period length of glycolytic oscillations. The gel was then illuminated with monochromatic light (340 nm) and the spatiotemporal distribution of NADH was measured via its fluorescence at 460 nm with a charge-coupled device camera, containing an image intensifier (MCP-bialkali photocathode, Optronis GmbH, Kehl, Germany). The resulting movie was stored on a computer by a frame-grabber card.
FIGURE 1.
Schematic drawing of the experimental setup for spatial temperature control. See text for further explanations.
Perturbation by a temperature pulse
In the temperature-perturbation experiments, the temperature pulse, ΔT = 20 ± 1°C at 20°C (or ΔT = 19 ± 1°C at 25°C), was produced by immersing the cuvette (optical glass, 1 mm) into a hot-water bath of 46.1 s for ∼10 s until the temperature of the sample reached ≈40°C and immediately afterwards in an ice-water bath for ∼4 s to return to 20°C. The temperature was measured with a thermocouple (Fluka 2190A; Milwaukee, WI) immersed in a reference cuvette filled with water.
The total time consumed for this procedure is <30 s. The temperature pulse was applied typically after two cycles of oscillation. One or at most two pulses were applied for one run of the oscillation.
Entrainment by a temperature cycle
The entrainment experiments were carried out on a Shimadzu (Columbia, MD) ultraviolet-visible spectrophotometer (UV-2101 PC) in connection with an electronic temperature controller (Shimadzu SPR-8). The system was at first maintained at a constant temperature (20.0 ± 0.2°C) until the first minimum in the NADH oscillations was reached. Then, the temperature cycle was started with an increase in temperature. The oscillations were monitored in absorbance at 340 nm. The amplitude of the periodic temperature change was 7.5 ± 0.5°C as measured inside the reference cuvette (1 mm) as specified above.
Concentration measurements
The concentrations of metabolites, i.e., glucose 6-phosphate (G6P), fructose 6-phosphate (F6P), fructose 1,6-biphosphate (FBP), dihydroxy acetone phosphate (DAP), and glyceraldehyde 3-phosphate (GAP) were determined by enzymatic methods (Bergmeyer, 1974). The probes for each of the specific assays were taken both at the minima and maxima of the oscillation monitored in absorbance at 340 nm. The average concentration of the two extrema was taken to represent the average value of the metabolites during the oscillations.
RESULTS
As for chemical and biochemical reaction kinetics, we find a strong temperature dependence for the metabolic flow through the glycolytic pathway, measured via NADH-concentration changes. The period of the glycolytic oscillations depends exponentially on temperature (Fig. 2 A). From the slope of the Arrhenius plot we can calculate EA to be 75 kJ/mol for S. carlsbergensis (Fig. 2 B) and 85 kJ/mol for S. cerevisiae (data not shown). The temperature dependence of glycolytic oscillations is nearly identical for these two yeast strains, except that there is a shift of ∼4°C to lower temperatures for S. carlsbergensis, reflecting the different temperature optima for growth. For further analysis of the effect of temperature on the glycolytic dynamics, we choose the yeast extract from S. cerevisiae.
FIGURE 2.
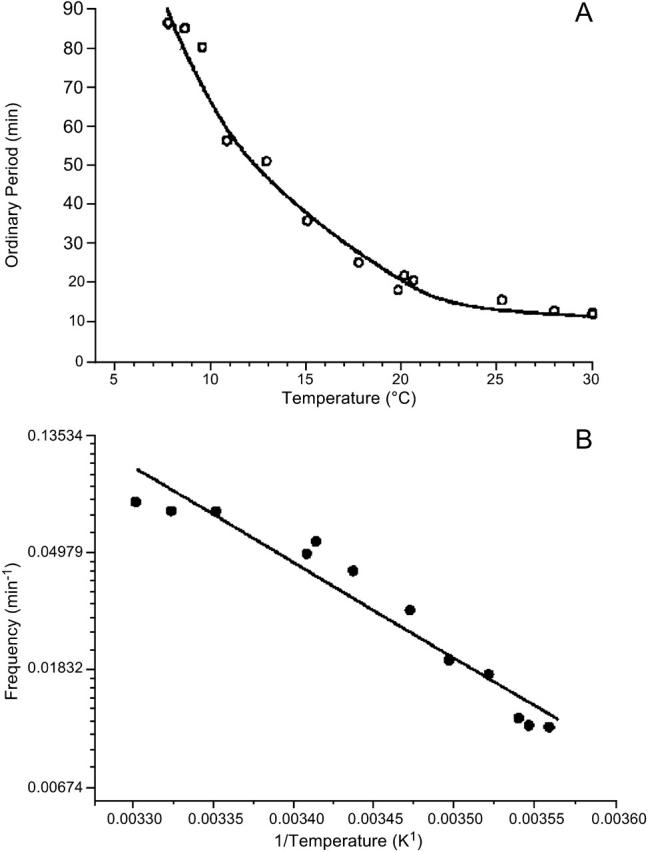
Temperature dependence of the period of the glycolytic oscillations of the cell-free cytoplasmic extracts of yeast S. cerevisiae. The oscillation was induced by addition of trehalose and potassium phosphate and monitored by absorption at λ = 340 nm. (A) Plot of the period versus temperature. (B) Arrhenius plot of the data shown in panel A.
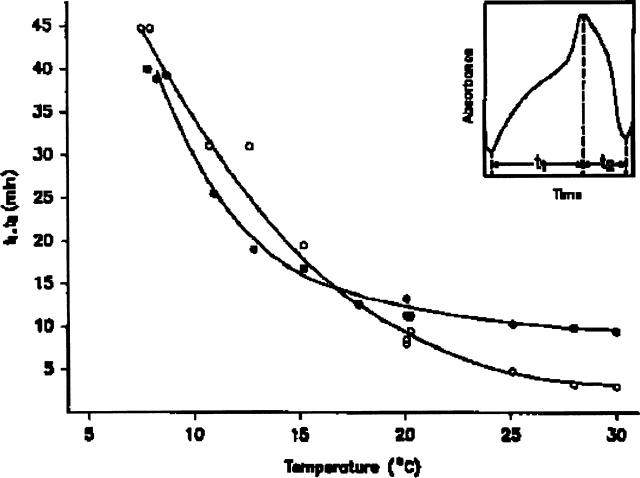
The wave form of the oscillations is influenced by temperature. As shown in the insert of Fig. 3, an oscillatory cycle can be divided into two parts: regime I extends from the absorption minimum to the maximum (time t1) and regime II from the maximum to the minimum (time t2). Both t1 and t2 decrease with increasing temperature (Fig. 3). However, they change in a different manner; the slope of t2 is larger than that of t1 in the lower temperature range (8–17°C) and the opposite is true in the higher temperature range (17–30°C).
FIGURE 3.
Temperature dependence of the times for the first (t1) and second (t2) phase of the glycolytic oscillation from S. cerevisiae extract. Here, t1 is defined as the time interval from the absorption minimum to the maximum and t2, from the maximum to the minimum (insert). t1 (○); t2 (•).
Fig. 4 A illustrates typical phase-shifting effects of a temperature pulse (ΔT = 20°C) applied during regime I and II during one cycle of the oscillation. When the temperature pulse is applied to regime I, the oscillation is drastically accelerated, whereas no remarkable change is observed when the pulse is applied to regime II.
FIGURE 4.
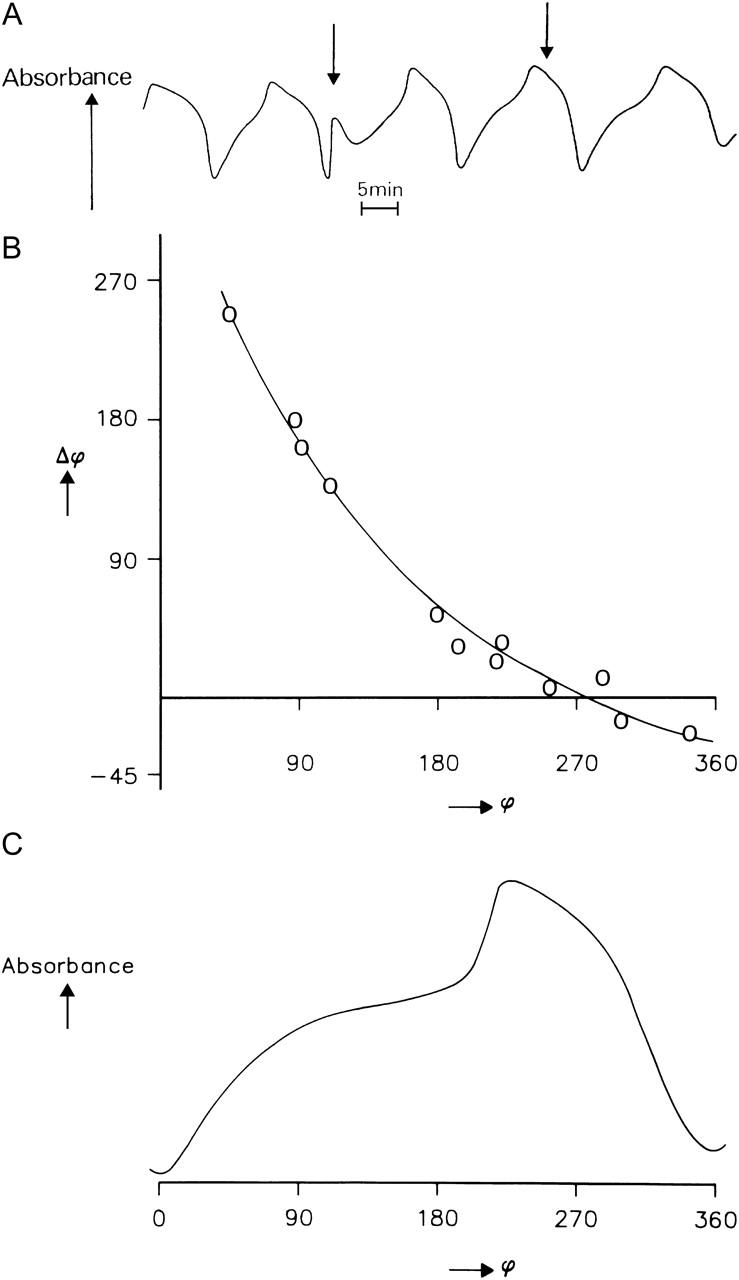
Phase response curve derived by application of temperature pulses at a ground temperature of 20°C. (A) Typical example of the effect of a temperature pulse (ΔT = 20°C) on the oscillation. The arrows show the time when the temperature pulse was applied. The ground temperature was 20°C. (B) Phase advance (+Δϕ) and phase delay (−Δϕ) at different phases (ϕ) of the glycolytic oscillations. (C) Attribution of the different phases ϕ to a glycolytic cycle.
The phase response curve derived from such experiments is displayed in Fig. 4 B along with a typical cycle of the oscillation (Fig. 4 C). The cycle immediately before the applied pulse was taken as the reference period to calculate the phase shift. It was determined for any given phase of the oscillation by measuring the time interval between the absorbance minimum before and after the temperature pulse.
If the oscillation after the pulse reaches the minimum earlier than the control, it is defined as a positive phase shift (+Δϕ, phase advance), otherwise as a negative phase shift (−Δϕ, phase delay). During the time period of the whole experiments, which is about one hour, the drift of the period of the oscillations (at 20°C) is ∼1 min (i.e., not >24°) as determined in a control where no temperature pulse was applied.
Large phase advances (up to 230°, roughly regime I) are observed at small phase angles, compared with only rather small phase delays at large phase angles (280–360°, roughly regime II). The phase angle at which the phase shift changes its sign is ∼250–280°, depending on the preparation. As for the temperature dependence of the oscillation periods, we find an exponential relation for the temperature-pulse induced phase shifts.
Fig. 5 illustrates typical entrainment patterns of the glycolytic oscillations when subjected to periodic temperature changes. Fig. 5 A shows the autonomous oscillation with a period of 13 min at 24.3°C. With τ0 being the period of the autonomous oscillation, τ the period of the temperature cycle, and τ′ the period of the entrained glycolytic oscillation, we find the following entrainment patterns: 1/3-harmonic (Fig. 5 B) τ/τ0 = 0.30, τ = 4 min, τ′ = 3τ; 1/2-harmonic (Fig. 5 C) τ/τ0 = 0.46, τ = 6 min, τ′ = 2τ; and entrainment by fundamental frequency τ/τ0 = 0.62, τ = 8 min, τ′ = τ (Fig. 5 D) or τ/τ0 = 1.85, τ = 24 min, τ′ = τ (Fig. 5 E). The entrainment patterns are largely determined by the temperature sensitivity of the oscillatory cycle at small phase angles where rising temperature accelerates the reduction of NAD to NADH and falling temperature does just the contrary.
FIGURE 5.
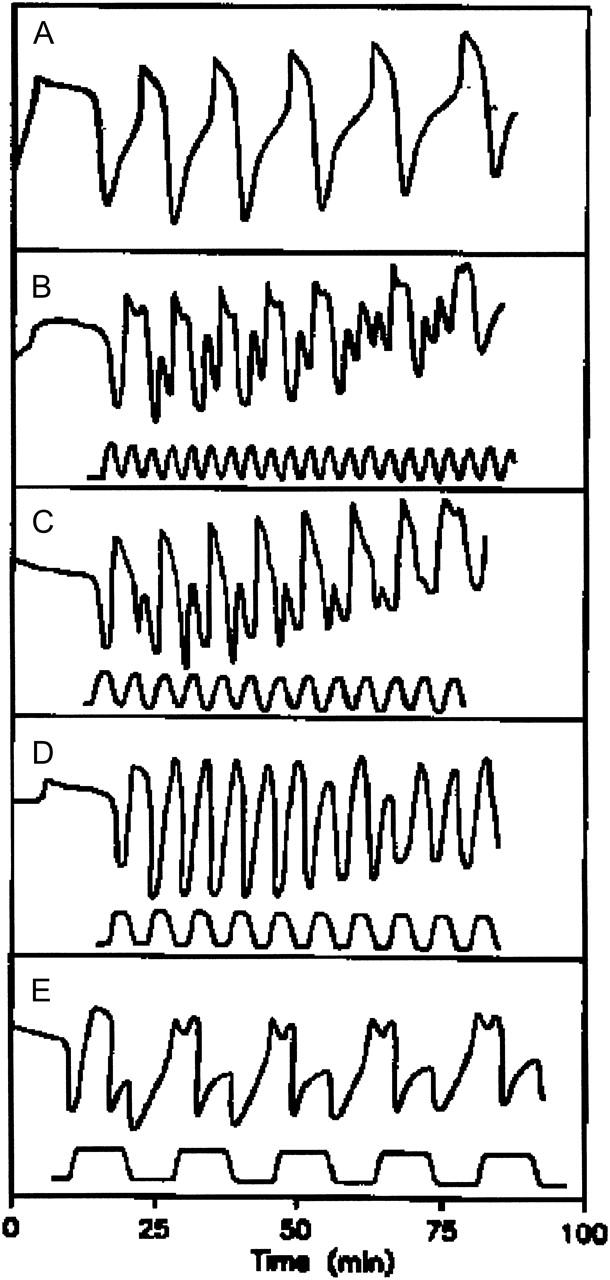
The entrainment pattern of the glycolytic oscillations under periodic temperature variation. The unperturbed, autonomous oscillations, as measured by the NADH absorbance, are shown in panel A. In panels B–E the top trace corresponds to the NADH oscillation and the bottom trace to the temperature cycle. The amplitude of the temperature cycle is 7.5 ± 0.5°C.
Fig. 6 displays a typical temperature dependence of the average concentration of several metabolites (FBP, G6P, F6P, GAP, and DAP). There are only slight concentration variations in G6P, F6P, and DAP from 10 to 35°C. On the contrary, the concentrations of FBP and GAP decrease strongly in this temperature range.
FIGURE 6.
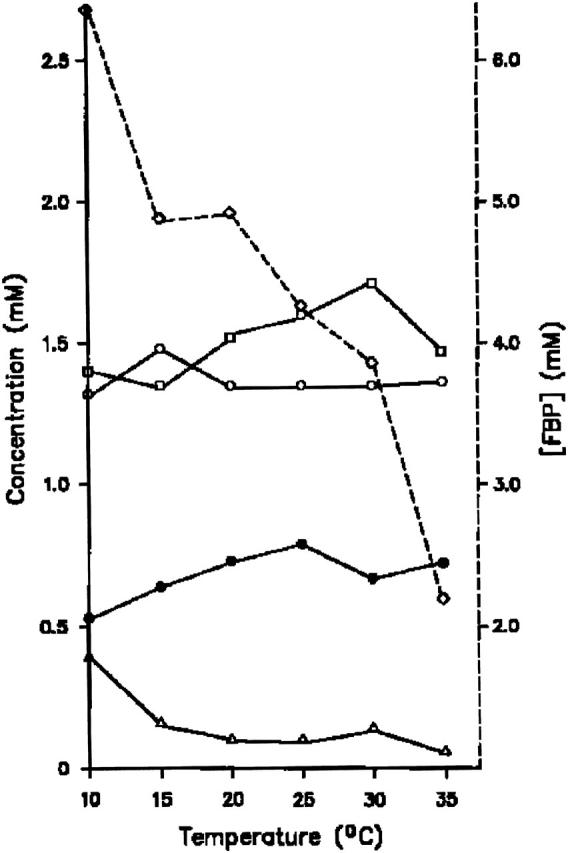
The temperature dependence of the average concentrations of: FBP (⋄), G6P (○), F6P (•), GAP (▵), and DAP (□) during the oscillations.
In Fig. 7 a the average concentrations of ATP, ADP, and AMP as a function of temperature are shown. An increase from 10 to 35°C leads to a doubling of the concentration of ATP, whereas that of AMP decreases by 50%. The concentration of ADP appears to pass through a maximum, but the net change is relatively small. The total amount of the adenosine nucleotides (∼1.4 mM) remains constant. One finds, in addition, that the energy charge ([ATP] + [ADP]/2)/([ATP] + [ADP] + [AMP]) calculated from the data in Fig. 7 A increases with rising temperature (Fig. 7 B).
FIGURE 7.
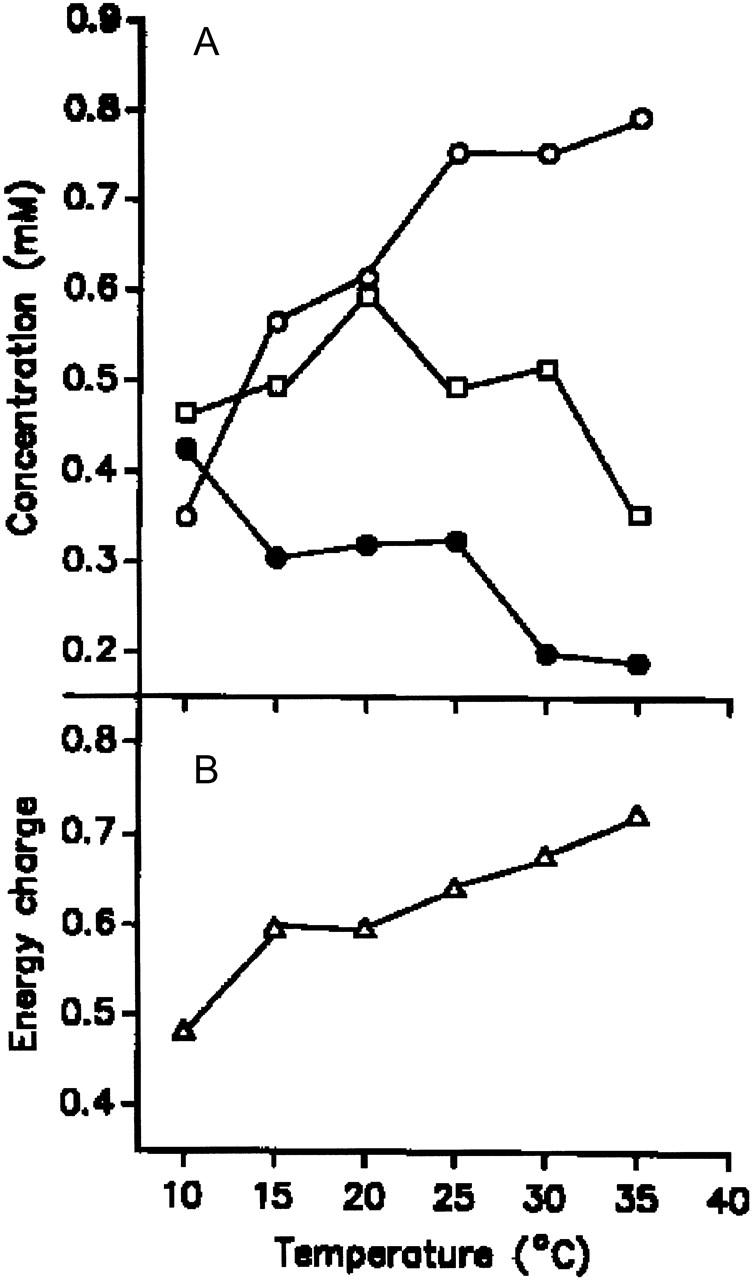
Temperature dependence of energy charge. (A) Average concentration of ATP (○), ADP (□), and AMP •). (B) Energy charge calculated from the data shown in panel A.
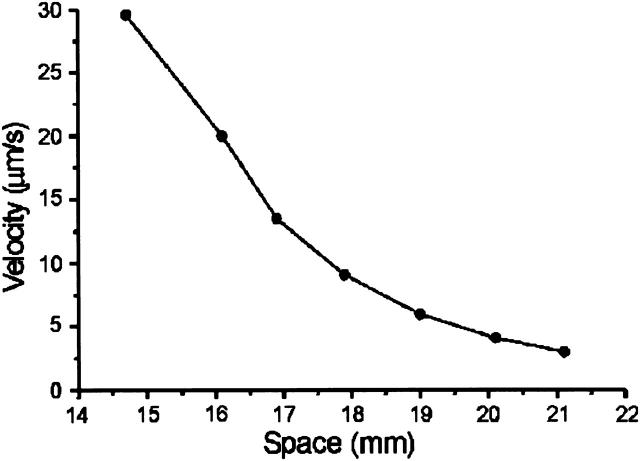
The coupling of a feedback-controlled reaction (i.e., an autocatalytic one) with transport often leads to the generation of reaction-diffusion waves. Our previous findings have also shown, that oscillatory glycolysis can lead to traveling NADH and proton waves, which exhibit the characteristic propagation dynamics of reaction-diffusion waves (Mair and Müller, 1996). Application of a temperature gradient to a gel-fixed yeast extract from S. carlsbergensis induces traveling NADH waves that start to propagate from the warm half of the gel (Fig. 8). The velocity of the waves decreases continuously (Fig. 9) as they reach the cold half of the gel. Interestingly, wave propagation stops at ∼10–12°C, whereas spatially homogeneous oscillations are still observable down to 3°C.
FIGURE 8.
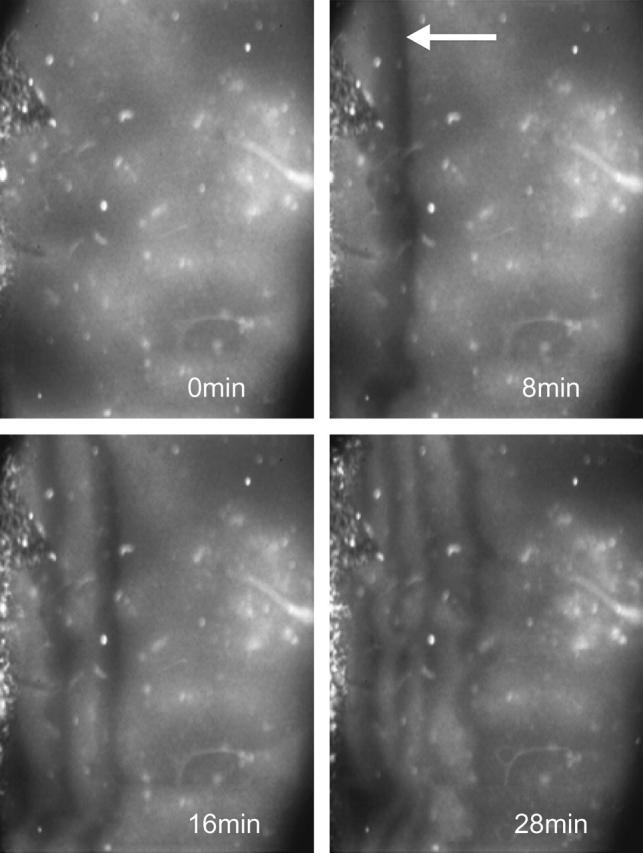
Induction of traveling NADH waves in a gel-fixed yeast extract from S. carlsbergensis. A temperature gradient was applied (see Methods) and the spatial NADH distribution monitored with a camera. The left side of the gel had a temperature of 23°C and the right side a temperature of 3°C. Time distance between each snapshot is indicated. The first appearance of dark NADH waves is marked by an arrow.
FIGURE 9.
Velocity of the NADH waves along a temperature gradient. Each space coordinate at the abscissa corresponds to a different temperature between 23 and 3°C, as has been measured with an infrared camera. The data have been taken from the experiment shown in Fig. 8.
DISCUSSION
The velocity of chemical and biochemical reactions is greatly affected by temperature. In general, there is an exponential temperature dependence, described by the Arrhenius equation, from which the activation energy of a particular reaction can be deduced. The glycolytic pathway consists of a sequence of enzymes, each of which exhibits temperature sensitivity. Therefore, an effect of temperature on the glycolytic flow cannot be directly attributed to a particular reaction. Nevertheless, it can be expected that temperature effects on the overall flow will be larger when rate-limiting steps of the pathway are involved.
There is a strong temperature sensitivity of the dynamics of glycolytic oscillations, which follows the well-known Arrhenius relation. This is valid for extracts from both strains, S. cerevisiae and S. carlsbergensis. The shift of the curve to lower temperatures for S. carlsbergensis demonstrates that biochemical reactions in the cytoplasm (the extract contains no organelles), e.g., glycolysis, are important for the decreased temperature optimum of growth. Although the pathway as a whole does not have an activation energy as defined in the Arrhenius equation, we can calculate an apparent activation energy from the slope of the Arrhenius plots (Fig. 2 B). We find energies of 75 kJ/mol and 85 kJ/mol for S. carlsbergensis and S. cerevisiae, respectively. This is in good agreement with data from Hess et al. (1966) who reported a value of 80 kJ/mol for extracts of S. carlsbergensis and from Grospietsch et al. (1995) who reported a value of 77 kJ/mol for extracts of S. cerevisiae.
A precise inspection of the oscillatory behavior shows that the temperature has a biphasic effect on the form of the oscillation. NADH oxidation is affected more strongly at lower temperatures, whereas >17°C, NAD reduction is more affected (Fig. 3). This points to at least two different controlling steps in the glycolytic pathway having different temperature sensitivities. This is in agreement with the results from the temperature-pulse experiments. The corresponding phase response curve (Fig. 4 B) shows different sensitivity of the oscillation toward a temperature pulse when it is applied at different phases of the cycle. In this case, NADH reduction is more sensitive to temperature changes than NAD oxidation. In addition, the fact that temperature itself induces phase shifts demonstrates that it interacts directly with the oscillatory reactions; i.e., it is an efficient means for external control of glycolytic oscillations.
To identify the reactions responsible for temperature sensitivity of glycolysis, we have determined the average concentrations of some of the metabolites (see Materials and Methods) during oscillatory glycolysis running at different temperatures. The results show that there are at least two reactions with large changes in the enzyme activity: the phosphofructokinase (PFK) and the glyceraldehyde-3-phosphate dehydrogenase (GAPDH), whose product/substrate decrease by >300% when the temperature is increased from 10 to 35°C (Fig. 6). The other measured metabolites exhibit much less temperature sensitivity.
The PFK shows a strong feedback regulation via adenine nucleotides as is also the case for the pyruvate kinase. One model to explain the generation of glycolytic oscillations is based on this feedback regulation of PFK (Hess et al., 1968; Goldbeter and Lefever; 1972). According to this model, one would expect that changes in the dynamics of glycolytic oscillations are mediated by changes in the PFK activity. The fact that this reaction shows the most pronounced sensitivity toward temperature is in line with this assumption. Further support for this view comes from the concomitant measurements of the adenine nucleotide concentrations. The inhibitor (ATP) and the activator (AMP) of PFK display the greatest concentration changes (Fig. 7 A). The increase of the inhibitor at higher temperatures (>100% at 35°C) together with a comparable decrease of the activator sufficiently explains the decrease of PFK activity in the upper temperature range. The corresponding changes of the energy charge (Fig. 7 B) demonstrate the tight coupling between the energetic status of the yeast extract and the regulation of glycolysis.
Interestingly, the GAPDH activity is similarly strongly affected by temperature. In this case, one should consider the GAPDH/PGK enzyme complex, which couples the phosphorylation cycle of the adenine nucleotides to the reduction/oxidation cycle of NADH. This coupling can be responsible for phase shifts between the upper and the lower part of glycolysis (Hess et al., 1968) and may be a good candidate responsible for the bisphasic temperature sensitivity (Figs. 3 and 4). Theoretical analysis of a glycolytic model also revealed an important role of this coupling property of the GAPDH/PGK complex for the dynamics of the oscillations (Wolf et al., 2000).
Recently, Ruoff et al. (2004) have modeled temperature dependency and temperature compensation of yeast glycolytic oscillations. Whereas there is no experimental finding for temperature compensation of glycolysis, their model can fit quite well the temperature dependency of experimentally observed NADH oscillations in yeast cell suspensions (Betz and Chance, 1965). Based on this model, the fitting of the experimental data allows one to attribute control coefficients to the different steps of glycolysis. Ruoff et al. (2004) find that glucose transport into the cell and the ATPase reaction exert the highest effect for the temperature sensitivity of the oscillatory period. The impact of glucose transport on temperature-based changes of glycolytic oscillations cannot be investigated with a yeast extract in a batch system. However, the relation between the energy charge and the period of the glycolytic oscillations as measured in this work (compare Figs. 2 and 7) agrees well with the result from Ruoff et al. (2004), who found that an increased ATPase activity (i.e., decrease of ATP) leads to an increased frequency of glycolytic oscillations. This relation is mediated by the feedback regulation of the PFK via ATP and ADP, as indicated by the strong temperature dependency of this enzyme (Fig. 6). Ruoff et al. (2004) could not investigate the impact of PFK activity on glycolytic temperature dependency in detail, because their model contains only a lumped rate equation for the degradation of glucose to GAP/DAP.
Entrainment of autonomous oscillating systems by external forces has been widely studied. Glycolysis in a yeast extract also has been investigated for its ability to become entrained. Infusion of glucose into a stirred solution of yeast extract has been used for entrainment. The results demonstrate that periodic entrainment, quasiperiodicity, as well as deterministic chaos can be induced (Markus et al., 1985; Boiteux et al., 1975). The data shown in Fig. 5 demonstrate that temperature is another powerful means for controlling glycolytic oscillations. Entrainment by the 1/2- and the 1/3-harmonic input frequency as well as the fundamental frequency is in good agreement with the results from the glucose-injection experiments.
We want to apply a noninvasive method for external control of glycolysis to allow for the generation of reaction-diffusion waves and to study entrainment of these spatiotemporal phenomena. Glucose infusion into stirred solutions of yeast extract cannot be used, because of the required reaction-diffusion coupling. In this case, temperature is the method of choice, as demonstrated by the results of this work.
Application of a temperature gradient to the gel-fixed yeast extract leads to the formation of traveling NADH waves that start to propagate from the warm side of the gel to the cold side (Fig. 8). The fact that the wave velocity drastically changes as a function of the temperature (Fig. 9), a result that has also been obtained for chemical systems (Foerster et al., 1990), makes temperature a good candidate for feedback control of glycolytic waves. Such control loops have been successfully applied to control the propagation dynamics of waves in other autocatalytic systems (Steinbock et al., 1993; Zykov et al., 1997). Feedback control is an established method to stabilize/destabilize the spatiotemporal dynamics of chemical and physical systems and hence may be also an efficient means to control biological systems. Experiments with heart cells (Engel et al., 1995) and frog eggs (Lechleiter and Clapham, 1992) to determine the temperature sensitivity of traveling calcium waves demonstrate that such control should also work in living cells. An impressive biomedical example is the fever-associated change of the NADPH kinetics in neutrophil cells. Increased body temperature augments the innate immune function. Rosenspire et al. (2002) have shown that such an increased immune function can be related to the temperature-induced increase of the frequency of the NADPH oscillations in neutrophil cells, which in turn stimulate the production of reactive oxygen and nitrogen intermediates in these cells.
Acknowledgments
We thank Z. Yuan, supported by a fellowship from the Max-Planck-Gesellschaft, for experimental assistance, and S. Bagyan for valuable help with the preparation of the manuscript. We are also grateful to Mrs. N. Wagner for manuscript typing and Mrs. C. Berse for preparing the figures.
We acknowledge financial support from the German Research Foundation (DFG) (SFB 555).
References
- Alcantara, F., and M. Monk. 1974. Signal propagation during aggregation in the slime mould Dictyostelium discoideum. J. Gen. Microbiol. 85:321–334. [DOI] [PubMed] [Google Scholar]
- Bergmeyer, H. U. 1974. Methods of Enzymatic Analysis, Vol. III. Verlag Chemie Weinheim/Academic Press, New York, NY and London, UK.
- Berridge, M. J., and P. E. Rapp. 1979. A comparative survey of the function, mechanism and control of cellular oscillations. J. Exp. Biol. 81:217–279. [DOI] [PubMed] [Google Scholar]
- Betz, A., and B. Chance. 1965. Influence of inhibitors and temperature on the oscillation of reduced pyridine nucleotides in yeast cells. Arch. Biochem. Biophys. 109:579–584. [DOI] [PubMed] [Google Scholar]
- Boiteux, A., A. Goldbeter, and B. Hess. 1975. Control of oscillating glycolysis of yeast by stochastic, periodic, and steady source of substrate: a model and experimental study. Proc. Natl. Acad. Sci. USA. 72:3829–3833. [DOI] [PMC free article] [PubMed] [Google Scholar]
- Castets, V., E. Dulos, J. Boissonade, and P. De Kepper. 1990. Experimental evidence of a sustained standing Turing-type nonequilibrium chemical pattern. Phys. Rev. Lett. 64:2953–2959. [DOI] [PubMed] [Google Scholar]
- De Koninck, P., and H. Schulman. 1998. Sensitivity of CaM kinase II to the frequency of Ca2+ oscillations. Science. 279:227–230. [DOI] [PubMed] [Google Scholar]
- Dupont, G., and A. Goldbeter. 1998. CaM kinase II as frequency decoder of Ca2+ oscillations. Bioessays. 20:607–610. [DOI] [PubMed] [Google Scholar]
- Dzeja, P., and A. Terzic. 2003. Phosphotransfer networks and cellular energetics. J. Exp. Biol. 206:2039–2047. [DOI] [PubMed] [Google Scholar]
- Engel, J., A. J. Sowerby, S. A. E. Finch, M. Fechner, and A. Stier. 1995. Temperature dependence of Ca2+ wave properties in cardiomyocytes: implications for the mechanism of autocatalytic Ca2+ release in wave propagation. Biophys. J. 68:40–45. [DOI] [PMC free article] [PubMed] [Google Scholar]
- Foerster, P., S. C. Müller, and B. Hess. 1990. Temperature dependence of curvature-velocity relationship in an excitable Belousov-Zhabotinskii reaction. J. Phys. Chem. 94:8859–8861. [Google Scholar]
- Goldbeter, A., and R. Lefever. 1972. Dissipative structures for an allosteric model. Application to glycolytic oscillations. Biophys. J. 12:1302–1315. [DOI] [PMC free article] [PubMed] [Google Scholar]
- Grospietsch, T., K. Drong, and I. Lamprecht. 1995. Experimental data on the energetic flux during glycolytic oscillations in yeast extracts. Experientia. 51:117–120. [Google Scholar]
- Hajnoczky, G., L. D. Robb-Gaspers, M. B. Seitz, and A. P. Thomas. 1995. Decoding of cytosolic calcium oscillations. Cell. 82:415–424. [DOI] [PubMed] [Google Scholar]
- Hess, B. 1997. Periodic patterns in biochemical reactions. Q. Rev. Biophys. 30:121–176. [DOI] [PubMed] [Google Scholar]
- Hess, B., and A. Boiteux. 1968. Mechanism of glycolytic oscillation in yeast. 1. Aerobic and anaerobic growth conditions for obtaining glycolytic oscillations. Hoppe-Seyleŕs Z. Physiol. Chem. 349:1567–1574. [DOI] [PubMed] [Google Scholar]
- Hess, B., A. Boiteux, and J. Krueger. 1968. Cooperation of glycolytic enzymes. Adv. Enzyme Regul. 7:149–167. [DOI] [PubMed] [Google Scholar]
- Hess, B., K. Brand, and K. Pye. 1966. Continuous oscillations in a cell-free extract of S. carlsbergensis. Biochem. Biophys. Res. Commun. 23:102–108. [DOI] [PubMed] [Google Scholar]
- Lechleiter, J. D., and D. E. Clapham. 1992. Molecular mechanisms of intracellular calcium excitability in X. laevis oocytes. Cell. 69:283–294. [DOI] [PubMed] [Google Scholar]
- Lechleiter, J. D., S. Girard, E. Peralta, and D. Clapham. 1991. Spiral calcium wave propagation and annihilation in Xenopus laevis oocytes. Science. 252:123–126. [DOI] [PubMed] [Google Scholar]
- Mair, T., and S. C. Müller. 1996. Traveling NADH and proton waves during oscillatory glycolysis in vitro. J. Biol. Chem. 271:627–630. [DOI] [PubMed] [Google Scholar]
- Mair, T., C. Warnke, and S. C. Müller. 2001. Spatio-temporal dynamics in glycolysis. Faraday Discuss. 120:249–259. [DOI] [PubMed] [Google Scholar]
- Markus, M., S. C. Mueller, and B. Hess. 1985. Observation of entrainment, quasiperiodicity and chaos in glycolysing yeast extract under periodic glucose input. Ber. Bunsenges. Phys. Chem. 89:651–654. [Google Scholar]
- Müller, S. C., T. Plesser, and B. Hess. 1985. The structure of the core of spiral wave in the Belousov-Zhabotinsky reagent. Science. 230:661–663. [DOI] [PubMed] [Google Scholar]
- Petty, H., and A. L. Kindzelskii. 2001. Dissipative metabolic patterns respond during neutrophil transmembrane signaling. Proc. Natl. Acad. Sci. USA. 98:3145–3149. [DOI] [PMC free article] [PubMed] [Google Scholar] [Retracted]
- Rosenspire, A. J., A. L. Kindzelskii, and H. R. Petty. 2002. Cutting edge: fever-associated temperatures enhance neutrophil responses to lipopolysaccharide: a potential mechanism involving cell metabolism. J. Immunol. 169:5396–5400. [DOI] [PubMed] [Google Scholar]
- Ruoff, P., M. K. Christensen, J. Wolf, and R. Heinrich. 2004. Temperature dependency and temperature compensation in a model of yeast glycolytic oscillations. Biophys. Chem. 106:179–192. [DOI] [PubMed] [Google Scholar]
- Steinbock, O., V. Zykov, and S. C. Müller. 1993. Control of spiral-wave dynamic in active media by periodic modulation of excitability. Nature. 366:322–324. [Google Scholar]
- Tang, Y., and H. G. Othmer. 1995. Frequency encoding in excitable systems with applications to calcium oscillations. Proc. Natl. Acad. Sci. USA. 92:7869–7873. [DOI] [PMC free article] [PubMed] [Google Scholar]
- Termonia, Y., and J. Ross. 1982. Entrainment and response in glycolysis. Proc. Natl. Acad. Sci. USA. 79:2878–2881. [DOI] [PMC free article] [PubMed] [Google Scholar]
- Wolf, J., J. Passarge, O. J. G. Somsen, J. L. Snoep, R. Heinrich, and H. V. Westerhoff. 2000. Transduction of intracellular and intercellular dynamics in yeast glycolytic oscillations. Biophys. J. 78:1145–1153. [DOI] [PMC free article] [PubMed] [Google Scholar]
- Zaikin, A. N., and A. M. Zabotinsky. 1970. Concentration wave propagation in two-dimensional liquid-phase self-oscillating systems. Nature. 225:535–537. [DOI] [PubMed] [Google Scholar]
- Zykov, V. S., A. S. Mikhailov, and S. C. Müller. 1997. Controlling spiral waves in confined geometries by global feedback. Phys. Rev. Lett. 78:3398–3401. [Google Scholar]


