

Abstract
To reveal heterogeneity of mitochondrial function on the single-mitochondrion level we have studied the spatiotemporal dynamics of the mitochondrial Ca2+ signaling and the mitochondrial membrane potential using wide-field fluorescence imaging and digital image processing techniques. Here we demonstrate first-time discrete sites—intramitochondrial hotspots—of Ca2+ uptake after Ca2+ release from intracellular stores, and spreading of Ca2+ rise within the mitochondria. The phenomenon was characterized by comparison of observations in intact cells stimulated by ATP and in plasma membrane permeabilized or in ionophore-treated cells exposed to elevated buffer [Ca2+]. The findings indicate that Ca2+ diffuses laterally within the mitochondria, and that the diffusion is limited for shorter segments of the mitochondrial network. These observations were supported by mathematical simulation of buffered diffusion. The mitochondrial membrane potential was investigated using the potentiometric dye TMRM. Irradiation-induced fluctuations (flickering) of TMRM fluorescence showed synchronicity over large regions of the mitochondrial network, indicating that certain parts of this network form electrical syncytia. The spatial extension of these syncytia was decreased by 2-aminoethoxydiphenyl borate (2-APB) or by propranolol (blockers of nonclassical mitochondrial permeabilities). Our data suggest that mitochondria form syncytia of electrical conductance whereas the passage of Ca2+ is restricted to the individual organelle.
INTRODUCTION
Mitochondria are not only the metabolic powerhouses of the cells, but could also be important in intracellular signaling (see Gunter et al., 2000; Rizzuto et al., 2004), apoptotic death cascades (Di Lisa and Bernardi, 1998), and sensoring nutrient supply (Kennedy et al., 1996) or oxygen level (Michelakis et al., 2002). The mitochondrial Ca2+ handling is crucial in each of these functions; Ca2+ is also an important regulator of metabolic energy output of mitochondria (see McCormack et al., 1990). Although the concept of mitochondrial Ca2+ transport was firmly established by in vitro studies on isolated mitochondria in the 1970s (see Nicholls and Akerman, 1982), the physiological involvement of mitochondria in intracellular Ca2+ signaling emerged to consensus only in the last decade. Rizzuto et al. (1992) uncovered mitochondrial Ca2+ uptake during physiological Ca2+ signaling using targeted aequorin, starting a new age of studies on in situ mitochondria.
The in situ approach gave way to the discovery of microdomains of high [Ca2+] between various Ca2+ sources, most notably the inositol trisphosphate receptor (IP3R) and mitochondria (Rizzuto et al., 1993). In situ studies of mitochondrial morphology showed filamentous networks in many cell types including endothelial cells (see Rutter and Rizzuto, 2000; or Skulachev, 2001); however, investigations on luminal continuity led to contradictory results (De Giorgi et al., 2000; Park et al., 2001; Collins et al., 2002; Jakobs et al., 2003). The existence of Ca2+ microdomains and mitochondrial networks raised the possibility of focal Ca2+ uptake and intramitochondrial lateral diffusion of Ca2+ (Hoth et al., 1997; Villalobos et al., 2002; Malli et al., 2003), but no direct evidence has been provided so far.
Recent advances on this field revealed subcellular heterogeneity and specialization of mitochondrial Ca2+ handling (Monteith and Blaustein, 1999; Park et al., 2001; Collins et al., 2002; Rizzuto et al., 2004). Mitochondrial Ca2+ uptake has, indeed, proven to be a fast process measured on isolated mitochondria (Gunter et al., 1998) and in intact cells (Babcock et al., 1997; Monteith and Blaustein, 1999; Drummond et al., 2000; Gerencser and Adam-Vizi, 2001). Therefore, understanding intrinsic properties of the mitochondrial Ca2+ handling or its relation to the cellular function requires a finer time- and space-resolution of the uptake dynamics (Rutter and Rizzuto, 2000; Rizzuto et al., 2004).
We introduced previously a new technique for high spatial and temporal resolution measurement of mitochondrial [Ca2+] ([Ca2+]m) based on imaging of the bright fluorescence of a conventional chelator Ca2+ probe (X-rhod-1). This dye accumulates in mitochondria during ester loading, while mitochondrial selectivity has been enhanced by digital (high-pass) filtering of acquired images (Gerencser and Adam-Vizi, 2001). In the present study we improved further the image processing technique to visualize the initial phase of Ca2+ signaling in mitochondria and in the cytosol during endoplasmic reticulum (ER)-dependent, IP3R-mediated Ca2+ signaling in intact rat brain capillary endothelial (RBCE) cells. The high spatiotemporal resolution enabled a refined analysis of the initiation of the mitochondrial Ca2+ uptake, which has been unavailable until now.
We hereby show a focal mitochondrial Ca2+ uptake and spreading of [Ca2+] rise within the mitochondria during purinergic stimulation of RBCE cells. Remarkably, we found that intramitochondrial diffusion of Ca2+ was spatially limited, therefore continuity of the mitochondrial network (MN) was also addressed by observation of synchronous fluctuations (flickering) of mitochondrial membrane potential (ΔΨm). It is proposed that barriers exist in the MN which limit the diffusion of Ca2+, but allow transmission of membrane potential.
MATERIALS AND METHODS
Materials
Ru360 and Bongkrekic acid (BKA) were obtained from Calbiochem-Novabiochem (La Jolla, CA). Fluorescent probes were purchased from Molecular Probes (Eugene, OR); all other reagents were obtained from Sigma or Fluka (St. Louis, MO).
Cell culture
Procedures for obtaining cell cultures were in accordance with Guidelines for the Use of Laboratory Animals at the Semmelweis University, Budapest, Hungary. Rat brain capillary endothelial cells (RBCE) from 3- to 5-month-old Wistar rats were prepared and settled on extracellular-matrix-coated glass coverslips, using a method described in detail in Dömötör et al. (1999). RBCE cells were kept in DMEM containing 17% plasma-derived bovine serum (First Link, Birmingham, UK), supplemented with 2 mM glutamine, 80 μg/ml heparin, 150 μg/ml endothelial cell growth supplement (Sigma), antibiotics, and trace factors (vitamin C, selenium, insulin, transferrin, and glutathione). After reaching confluence, experiments were performed on 6–10-days-old primary cultures.
Fluorescence imaging
X-rhod-1-AM (5 μM) was loaded into RBCE cells for 1 min, and hydrolyzed for 20 min in NaHCO3 containing superfusion medium at 37°C, in a CO2 incubator as described previously (Gerencser and Adam-Vizi, 2001). Coverslips were transferred into a perfusion chamber and superfused (0.5 ml/min) with a medium containing 150 mM NaCl, 5.4 mM KCl, 1.8 mM CaCl2, 1 mM MgCl2, 0.9 mM NaH2PO4, 20 mM HEPES, 5.6 mM glucose, and 1.5 mM Na-pyruvate, pH 7.4. To assay ΔΨm, loading with the potentiometric dye tetramethylrhodamine methyl ester (TMRM; at quenching condition 1 μM; or at nonquenching condition 0.25 μM) was carried out similarly, but for 5 min in the presence of 1 μM Cyclosporin A (CsA). The latter had beneficial effect on TMRM loading by inhibiting multidrug resistance proteins active in RBCE cells (Huai-Yun et al., 1998), and also by protection against opening of the permeability transition pore (PTP) during the loading procedure. CsA was washed out before starting experiments.
Single-cell wide-field fluorescence (for both X-rhod-1 and TMRM) was imaged by excitation at 535 nm (Polychrome II, Till, Munich, Germany), using an additional 535BP20 exciter, 560DRLP dichroic mirror, and OG570 (Omega Optical, Brattleboro, VT) emission filter to collect all emission above 570 nm. Image streams of 400 images of ∼150 × 40 × 12 bit (covering 1–2 cells; 2 × 2 binning; 0.3 μm/pixel; ∼20 and ∼12.5 frames/s) were acquired by a Micromax cooled digital charge-coupled device camera (Princeton Instruments, Trenton, NJ) mounted on a Nikon Diaphot 200 inverted microscope (Plan Fluor 100 × 1.3 NA, Nikon, Tokyo, Japan). Image acquisition was controlled by Metafluor 3.5 (Universal Imaging, West Chester, PA). All wide-field imaging were performed at 37°C.
Confocal laser scanning imaging was carried out on an LSM-510 microscope (Plan-Neofluar 40 × 1.3 NA; using the 543-nm line of a 5-mW HeNe laser at 10% power with an HFT 488/543 dichroic mirror and LP560 emission filter; Zeiss, Jena, Germany), in line-scan mode (16 ms/frame; 0.08 μm/pixel). Stimulation was applied locally with pressure ejection (FemtoJet; Eppendorf, Hamburg, Germany). Confocal imaging was performed at room temperature to decrease relocations of mitochondria.
Cell permeabilization
RBCE cells were superfused with Ca2+-free medium (containing 3 mM EGTA) supplemented with Cyclopiazonic acid (CPA; 10 μM) for 5 min to deplete Ca2+ stores. Plasma-membrane permeabilization was done with digitonin (Pacher et al., 2000; Brustovetsky et al., 2002), 7 μM, 3–6 min before measurement, in intracellular buffers (Palmer et al., 1977) containing 190 mM mannitol, 50 mM sucrose, 15 mM NaOH, 1 mM K2HPO4, 2 mM succinic acid, 2 mM Na-pyruvate, 15 mM HEPES, 20 mM TRIS, 10 mM EGTA (or nitrilotriacetic acid; NTA), and 3 mM ADP, pH 7.0. Free buffer [Ca2+] ([Ca2+]b) and [Mg2+]b were set on the basis of WinMAXC (Bers et al., 1994), considering an EGTA (or NTA)-ADP-Ca2+-Mg2+ buffer system to have 100 nM and 1 mM, respectively, for basal superfusion during permeabilization. [Ca2+]b was tested with Fura-FF (0.1 μM) in a Deltascan cuvette fluorimeter (PTI, New Brunswick, NJ), using a measured Kd = 2. 9 μM (37°C; pH 7.05; standard KCl buffers; Grynkiewicz et al., 1985), yielding 132 ± 6 nM for the basal buffer. Mitochondrial Ca2+ uptake was evoked by rapid switching of the superfusion to buffers with 8.3 ± 1 μM, 15.8 ± 0. 4 μM, 28.2 ± 1.26 μM, 43.6 ± 3.5 μM, or 72.2 ± 0.5 μM [Ca2+]b. The time-course of the complete change of the buffer around the cells was ∼1 s, a value similar to the time-course of rise of [Ca2+]c during purinergic signaling (Gerencser and Adam-Vizi, 2001). Digitonin and CPA were present throughout the experiments in each buffer.
To establish an optical control for the observed spreading of fluorescence rise, an even and synchronous rise of [Ca2+]m upon elevation of [Ca2+]b was obtained by permeabilization of all cellular membranes for Ca2+ by the Ca2+ ionophore 4-Br-A23187 (5 μM) plus the protonophore carbonyl cyanide 4-trifluoromethoxyphenylhidrazone (FCCP; 1 μM) and digitonin (7 μM). Before this, cells were fixed by superfusion with 4% paraformaldehyde for 3 min, to preserve filamentous morphology of mitochondria, and to block all physiological Ca2+ transport mechanisms. The fixation did not cause loss or quenching of mitochondrially localized dye, or damage to the ionophore.
Calibration of mitochondrial Ca2+ concentration
Fluorescence of X-rhod-1 (f) was calibrated according to the procedure described by Maravall et al. (2000). Briefly, high affinity single wavelength dyes can be accurately calibrated yielding [Ca2+] or Δ[Ca2+] = [Ca2+]–[Ca2+]rest, if saturated dye fluorescence intensities (fmax) are obtained during each measurement. This calibration method requires only the knowledge of Kd, and the dynamic range (Rf = fmax/fmin) of the dye. Relative change of [Ca2+] from the baseline and resting [Ca2+] were given by (defining δf ≡ (f–f0)/f0 ≡ Δf/f0; modified from Maravall et al., 2000),
 |
(1) |
 |
(2) |
With the combination of Eqs. 1 and 2 we obtained Eq. 3, describing Δ[Ca2+] without the knowledge of saturating relative fluorescence rise (δfmax), but of [Ca2+]rest (which was determined in separate experiments).
 |
(3) |
The value d[Ca2+]/dt was determined using the first derivative in time (t) of Eq. 3 after substitution of δf(t) for δf. The values Rf and Kd were determined both in vitro (Rf = 43 ± 5 and Kd = 814 ± 51 nM, n = 4, in standard KCl buffers, at 37°C, pH = 7.05, where [Ca2+] was calculated with WinMAXC), and in situ for mitochondria (Rf = 4.6 ± 0.2, n = 7 experiments, and Kd = 1.39 ± 0.05 μM, n = 3, in intact cells using the same buffers as above, but supplemented with 4-Br-A23187 10 μM, monensin 10 μM, nigericin 10 μM, and antimycin A3 2 μM). Rf was yielded by the ratio of fluorescence intensity in the presence of ∼200 μM and zero [Ca2+]. The value Kd was calculated according to the standard procedure (Molecular Probes). In addition we found that swollen or beads-on-a-stringlike mitochondria had a markedly increased Rf (7.25 ± 0.2; n = 7). The value Rf was separately determined in plasma-membrane permeabilized cells (6.3 ± 0.2; n = 5) and in fixed, ionophore-permeabilized cells (4.6 ± 0.1; n = 3). For comparison, the value of Rf was 3.1 ± 0.1 (n = 7) over the nucleus.
Processing of [Ca2+] rise velocity images
See a detailed description on image processing in the Supplementary Material available online.
Cytosolic and mitochondrial fluorescence were separated for analysis by image filtering in spatial frequency domain using low-pass and high-pass filters, respectively (Gerencser and Adam-Vizi, 2001). Briefly, the principle of this technique is that the wide-field fluorescent image of an X-rhod-1 loaded cell is composed of the sum of a bulky (low spatial frequency) feature (the cytosol), and a crisp (high frequency) feature (mitochondria). These features are separated in spatial frequency (Fourier) domain, and therefore can be measured separately as
 |
(4) |
where G and G′ are the original and filtered images, respectively, F{⋯} stands for two-dimensional Fourier transformation and  is the transfer (filter) function. Image processing was done in Metafluor Analyst (Universal Imaging) which holds the implementation of our previously described technique (Gerencser and Adam-Vizi, 2001).
Cytosolic Ca2+ waves were visualized first applying a spatial low-pass filter rejecting most of the fluorescence deriving from mitochondria. Then images were processed by pixelwise δf normalization and temporal differentiation using filtering with a Savitzky-Golay kernel (Savitzky and Golay, 1964) (SG; five element; first derivative; fourth polynomial order), which can be robustly used for differentiation of noisy signals due to its additional smoothing effect.
To selectively study mitochondrial Ca2+ dynamics, the analysis was started by applying a spatial high-pass filter, which transmits only mitochondria-derived fluorescence (see above). This was followed by spatial SG kernel (7 × 7 element; 0;2) smoothing; one cycle of grayscale dilation-erosion; pixelwise δf normalization; and finally, temporal differentiation with a wider SG kernel (9;1;2). The extensive spatiotemporal smoothing was required because the signal/noise ratio suffers physical limitations both at the detector side (photon shot noise) and the specimen side (excessive Ca2+ buffering or phototoxicity), whereas differentiation and δf normalization are essentially sensitive to noise. The smoothing was fine-tuned to establish noise suppression without distortion of the results.
The results of image processing were verified by 1), processing an image sequence in which a model mitochondrion (Loew et al., 1993) was created by drawing a steplike elevation (using a sigmoid function) of intensity propagating along a thin line with a given (20 μm/s) velocity. Photon shot noise was also included into the model considering typical intensities recorded in X-rhod-1 loaded cells, and the measured noise characteristics of the camera. It is indicated that processing did not result in distortions of constructed time-space diagrams (see below) or a temporal shift in the signal (not shown). It was also confirmed, 2), that the image processing did not result in any noticeable smudging of signal by comparing the results with simple (nonsmoothing) temporal differentiation of regional averaged signals (not shown), and by 3), comparing low- and high-pass filtered, i.e., cytosolic and mitochondrial signals also without differentiation (Fig. 1 D).
FIGURE 1.
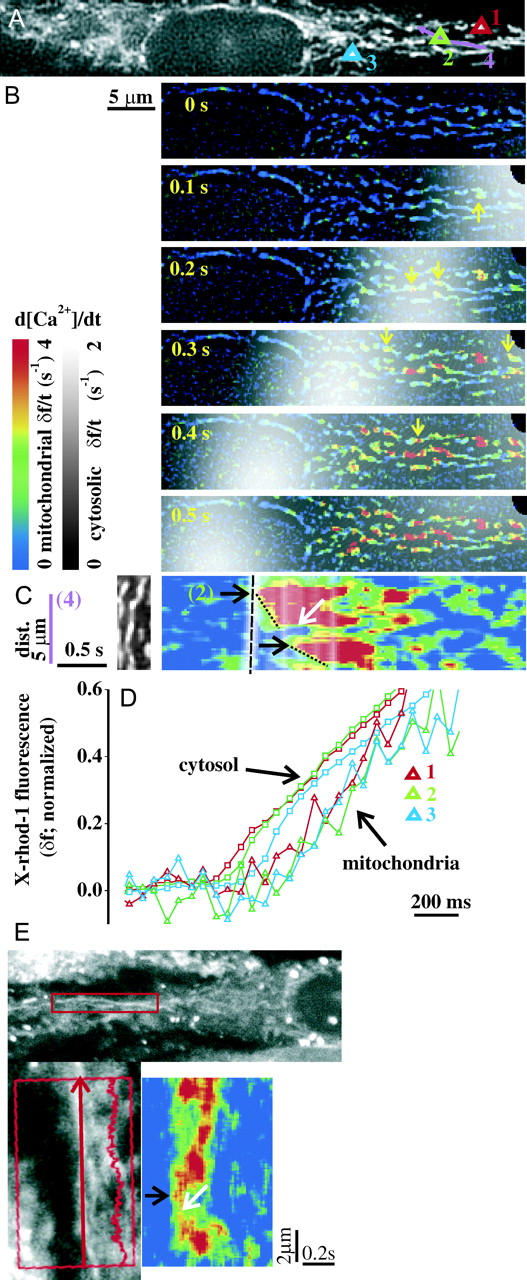
The initial phase of cytosolic and mitochondrial [Ca2+] rise in ATP-stimulated, intact RBCE cells. (A) Image of X-rhod-1 fluorescence at 3 s after application of ATP (100 μM). Regions 1–3 designate individual mitochondrial spots (corresponding traces are shown in D). Region 4 is a line over a single mitochondrion (see in C). (B) Overlay of d[Ca2+]c/dt in grayscale and d[Ca2+]m/dt in pseudocolor (shown as δf/t). The propagating white cloud indicates the front of the cytosolic Ca2+ wave. The rise of [Ca2+]m starts behind the cytosolic wavefront as hotspots in the mitochondrial network (arrows). (The full-length image series showing raw data and steps of image processing is available as Supplementary movie 1.) (C, Left) Fluorescence image of a selected mitochondrion (corresponding to region 4 in A; rotated). (C, Right) Time-space representation of d[Ca2+]c/dt and d[Ca2+]m/dt over region 4 which corresponds to the ordinate (dist. axis, μm). Black arrows indicate Ca2+ hotspots (the upper one is covered by region 2). The sloped profile of the onset of high d[Ca2+]m/dt (dotted lines) originating from the hotspots indicates the spreading of the [Ca2+]m rise. The dashed line indicates the cytosolic wavefront. The white arrow points to a barrier in the spreading of [Ca2+]m. (D) Plot of cytosolic (□) and mitochondrial (▵) δf (normalized to peak amplitude) over regions 1–3 (as indicated in A), calculated from the image series without smoothing and temporal differentiation. (E) (Top) Typical laser scanning confocal image of a resting, X-rhod-1-loaded RBCE cell. The rectangle indicates the mitochondrion selected for the line-scan acquisition, and this is also shown zoomed, rotated at the left. (Left) The arrow signifies the exact place of the line scan. (Right) Confocal line scan. Black arrow indicates a Ca2+ hotspot, and the white arrow a barrier (similarly as in C).
Time-space diagrams of [Ca2+] rise velocity were constructed from the data obtained from lines which were assigned on the images such as to follow the longitudinal axes of mitochondria (see Fig. 1, A and C). These diagrams were then evaluated as follows. First, hotspots were defined as the spots of earliest appearance of fluorescence rise above the baseline. Next, traveling velocities of the spreading fluorescence rise both directions away from the hotspots were measured from the slope of lines which were fit to the contours of the time-space diagrams where δf/t reaches 50% of its peak maximum (see slope in Fig. 3 B) (Haak et al., 2001). These fit lines were extended to 2.5 μm in space for mitochondria and to 10 μm for cytosol. To check the reliability of slope determination we used other contour definitions as well, such as the onset of the maximum (ridge) of the transient; these definitions yielded similar results (not shown). Traveling velocity was also determined on the model mitochondrion described above, and reproduced the original value. Data analysis was done in Mathematica 4.2 (Wolfram Research, Champaign, IL).
FIGURE 3.

Spatiotemporal inhomogeneity of [Ca2+]m rise in intact cells versus permeabilized or ionophore-treated cells. (A) Typical image triplets show raw X-rhod-1 fluorescence (raw), spatial inhomogeneity by color-coding the peak d[Ca2+]m/dt (δf/t Max; see text), or temporal inhomogeneity by color-coding the onset of peak d[Ca2+]m/dt (timing; see text); in ATP-stimulated (100 μM) intact cells (ATP; n = 20), in CPA-treated permeabilized cells exposed to [Ca2+]b = 28 μM (28p; n = 13), and in ionophore-treated fixed cells exposed to [Ca2+]b = 28 μM (28i; n = 9). White lines indicate barriers of Ca2+ diffusion found in time-space plots of δf/t in intact cells. N denotes the nucleus. (B) Assay of intramitochondrial Ca2+ diffusion by determination of the time-space slope of [Ca2+]m rise. Three typical diagrams (where δf/t over mitochondrial filaments was plotted on the distance axis; dist., μm versus time; s; similarly to Fig. 1 C) are shown for each condition indicated in A. The hotspot (defined by the early onset) was positioned to the origin indicated by red arrows. Lines were fit on the contour (half of maximum value) of δf/t profiles to measure the reciprocal traveling velocity (time-space slope; slope) of the Ca2+ transient along a 2.5-μm length from the hotspot. Close to zero slope value (where fit line is parallel to the ordinate) indicates that [Ca2+] rises evenly throughout the mitochondrial filament, i.e., there is no traveling signal (traveling velocity cannot be interpreted; → ∞). Large values correspond to clearly visible traveling Ca2+ rise (the fit line angles to the ordinate). (C) Statistical analysis of inhomogeneity of peak d[Ca2+]m/dt found at A (δf/t Max) using punctate/diffuse index (denoting SD/mean) calculated over mitochondrial filaments. (D) Slope values, of which typical ones are shown in B. The sensitivity of the method is indicated by the red line at 0.02 s/μm (given by the ratio of image acquisition timelapse and the fit length). (E) Distance available for diffusion of intramitochondrial Ca2+ (or distance between barriers; black) and length of mitochondrial filaments visually selected for analysis (gray). (F) Delay of the peak d[Ca2+]m/dt between the two sides of a barrier. The sensitivity of the method is indicated by the red line at 50 ms (given by the reciprocal of the frame rate). (C–F) Bars show mean ± SE; ***, significance at p < 0. 001 by Mann-Whitney Rank Sum Test; **, significance at p < 0. 01 by ANOVA on ranks; n = 173; 122; 197 mitochondrial filaments for conditions ATP, 28p, and 28i, respectively.
For visualization of spatiotemporal heterogeneities of [Ca2+]m rise (Fig. 3 A) we used either δf/t Max images which were calculated by maximum projection of the δf/t image series in time, or timing images which were obtained by replacing each pixel value with the timepoint where δf/t reached its maximum.
Evaluation of ΔΨm fluctuations
Fluctuations of ΔΨm were detected by the Nernstian potentiometric dye TMRM (Farkas et al., 1989) for determination of the spatial extension of the electrical connectivity within the MN. At low TMRM loading concentrations (nonquenching condition) the fluorescence of mitochondrially accumulated dye is proportional to its concentration which increases monotonically with the ΔΨm. At higher TMRM concentrations (quenching condition) this proportionality fails due to autoquenching of the fluorescence of intramitochondrial dye, whereas the observed bulk intensity (in the cytosol) is inversely correlated to the ΔΨm. In our experiments TMRM fluorescence was used as a qualitative measure of ΔΨm fluctuations.
To express sudden decreases of ΔΨm the temporally differentiated intensity of TMRM fluorescence was used (see Supplementary Material). At quenching TMRM loading condition sizes of synchronously flickering areas (syncytia) were evaluated by obtaining the greatest diameter of the area where a sudden fluorescence increase occurred. For this, temporally differentiated image series were smoothed, thresholded, and segmented. At nonquenching TMRM loading condition temporal cross-correlation images  illustrating pixels exhibiting correlated fluctuations to a given pixel (x0, y0) were calculated for all pixels corresponding to flickering mitochondria. For this, image series were high-pass filtered, and corrected for photobleaching by normalization to a monoexponential decay that was fit to the average intensities of images for the whole experiment. Filtered image series were then temporally differentiated, and normalized to yield G(x,y,t).
  was zero because of the temporal differentiation; therefore, correlation images were calculated simply as
 |
(5) |
This resulted in a correlation image for each chosen (x0, y0) where the area exhibiting synchronized fluctuations with (x0, y0) appeared as a pattern of high correlation values. A selection of these patterns was color-coded (using a different color for each syncytium) and plotted superimposed for visualization of the electrically continuous mitochondrial networks present in a cell. Syncytium size was expressed as the greatest diameter of each pattern.
Statistical analysis and simulation
Statistical calculations were done in SigmaStat 2.03 (SPSS, Chicago, IL). For multiple comparisons Kruskal-Wallis one-way analysis of variance (ANOVA) on ranks was used followed by Dunn's post-hoc test. Ca2+ diffusion was simulated by the numeric solution of the partial differential equation system of buffered diffusion using the standard function NDSolve in Mathematica 4.2.
RESULTS
Visualization of cytosolic and mitochondrial [Ca2+] using X-rhod-1
For studying the dynamics of mitochondrial Ca2+ uptake we followed the purinergic receptor-evoked (100 μM ATP) Ca2+ signaling in RBCE cells by acquiring a high spatiotemporal resolution image series of X-rhod-1 wide-field fluorescence (Fig. 1 A). X-rhod-1, like Rhod-2, is capable of measuring [Ca2+]m because the positively charged ester form accumulates in the inside-negative mitochondria. Still, mitochondrial selectivity of these dyes is incomplete, and a substantial amount of the dye remains in the cytosol. Therefore we applied spatial high- and low-pass filtering on the recorded fluorescence images, and this allowed the separation of the signals having mitochondrial (indicative of [Ca2+]m) and cytosolic (indicative of [Ca2+]c) origin, respectively (Gerencser and Adam-Vizi, 2001).
To study Ca2+ wavefronts evolving at the onset of the purinergic response we obtained an enhanced visualization of Ca2+ waves by temporal differentiation of the image series (Jahne, 1997; Boitier et al., 1999) yielding [Ca2+] rise velocity images (d[Ca2+]/dt; shown as δf/t where δf denotes Δf/f0 normalized fluorescence intensity). Frames from a processed image series are shown in Fig. 1 B visualizing d[Ca2+]m/dt by pseudocolor coding, overlaid by d[Ca2+]c/dt in grayscale (see also Supplementary movie 1).
The appearance of intramitochondrial Ca2+ hotspots lags behind the cytosolic Ca2+ wave
Upon stimulation with ATP (100 μM) cytosolic Ca2+ (tide) waves were initiated at both ends of spindle-shaped endothelial cells (shown as a propagating white cloud in grayscale overlay of Fig. 1, B and C), and moved toward the nucleus, where they collided and died out. Similar cytosolic Ca2+ waves were observed when [Ca2+]c was measured using Fura-2 (not shown). The first event indicating a rise in [Ca2+]m was the appearance of Ca2+ hotspots in the mitochondrial network (MN) (defined as initiation of [Ca2+]m rise Fig. 1, B and C; arrows). The gross increase of [Ca2+]m (see red pseudocolor) occurred with a delay of ∼300 ms after the cytosolic Ca2+ wave had passed over the corresponding region. The plots from images without smoothing and differentiation shown in Fig. 1 D confirm that appearance of mitochondrial Ca2+ hotspots lags behind the bulk cytosolic signal. The average distance between hotspots was 7.3 ± 0.7 μm (the closest ones were separated by 3.1 ± 0.3 μm; n = 20 cells).
Intramitochondrial Ca2+ signal spread from hotspots
The [Ca2+]m rise observed in image series of fluorescence rise velocity (shown as δf/t; Fig. 1 B) suggested that the rise was spreading from the initial Ca2+ hotspots within the MN. Time-space (or line-scan) diagrams are commonly used for visualization of movement or spreading along a space coordinate in time (Jahne, 1997; Boitier et al., 1999; Haak et al., 2001). Therefore, pixel values of δf/t image series along a line following the shape of the mitochondrion were plotted as a function of time (see a representative time-space diagram in Fig. 1 C, corresponding to region 4 in Fig. 1 A). The diagrams showed sloped or v-shaped onset of signals in a time-space plane indicating the presence of an initiation point of [Ca2+]m rise (hotspot; black arrows in Fig. 1 C), followed by bilateral spreading of the signal. This phenomenon was also studied using confocal laser scanning microscopy of X-rhod-1 fluorescence to directly acquire line-scan diagrams over single mitochondrial filaments (Fig. 1 E). This alternative method provided essentially similar results.
[Ca2+]m rises fast at intramitochondrial hotspots upon purinergic stimulation of intact RBCE cells
To evaluate d[Ca2+]/dt from fluorescent signals a calibration based on the dynamic range and the saturating fluorescence of the dye was performed (Maravall et al., 2000). Resting [Ca2+]m was determined by the measurement of δfmax in the presence of ionophores in intact, naïve cells, and proved to be 310 ± 30 nM (n = 50 mitochondrial filaments). Traces of δf, δf/t (s−1), and d[Ca2+]m/dt (μM/s) for a typical hotspot are shown in Fig. 2 A. We observed a peak d[Ca2+]m/dt of 4.7 ± 0.8 μM/s for mitochondrial filaments (Fig. 2 B; solid diamond; n = 173 mitochondrial filaments).
FIGURE 2.
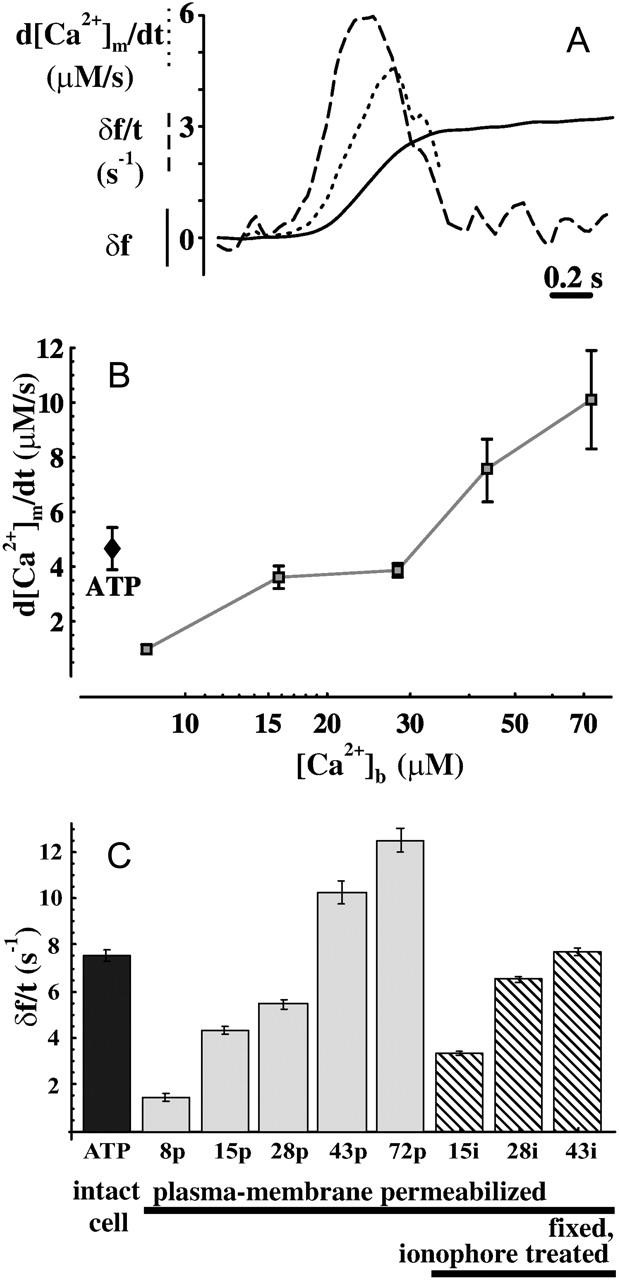
The kinetics of [Ca2+]m rise. (A) Typical plot of calibration of X-Rhod-1 fluorescence over a single mitochondrial pixel in ATP-stimulated intact cells. (Solid line) Normalized fluorescence (δf); (dashed) normalized fluorescence differentiated in time (δf/t as s−1); and (dotted) calibrated d[Ca2+]m/dt (as μM/s). Traces share the same ordinate scaling. The calibrated trace was truncated where the estimated error of the calibration becomes large. (B) Comparison of peak d[Ca2+]m/dt values (mean ± SE in μM/s) for ATP-stimulated intact cells (ATP, solid diamond) and CPA-treated, plasma membrane-permeabilized cells at different [Ca2+]b (8–72 μM; shaded). (C) Comparison of mean δf/t values without calibration (as s−1) for ATP-stimulated intact cells (ATP, solid; n = 173 mitochondrial filaments) and CPA-treated permeabilized cells at different [Ca2+]b (p, 8–72 μM; shaded bars; n = 5, 68, 122, 63, and 57, respectively), or fixed, ionophore-treated cells (i, 15–43 μM [Ca2+]b; striped bars, n = 95, 197, and 174, respectively).
Mitochondrial Ca2+ uptake must sense local cytosolic [Ca2+] in tens of micromolar range in intact stimulated cells
Three issues were considered based on our initial observations:
As a working hypothesis we proposed that intramitochondrial Ca2+ signal spreading was due to diffusion of Ca2+ from focal sources observed as hotspots. We expected to detect a spreading Ca2+ rise regardless of the rate of influx, if the uptake of Ca2+ was focal, but no spreading if Ca2+ was taken up evenly.
It was also considered whether the observed phenomena could be due to optical or dye distribution artifacts.
In addition, it was addressed whether mitochondrial Ca2+ hotspots reflected an intrinsic property of a clustered uptake mechanism or, instead, a focal availability of Ca2+ due to cytosolic microdomains.
To approach these three issues, [Ca2+]m measurements were performed under three basic conditions:
In intact cells stimulated with ATP, where mitochondria and microdomains were intact.
In plasma-membrane permeabilized cells, where ER was depleted of Ca2+ and mitochondria were evenly exposed to different buffer [Ca2+] ([Ca2+]b; 5–72 μM); in which case, microdomains could not be present.
In completely permeabilized cells which were treated with the Ca2+ ionophore 4-Br-A23187 (5 μM) plus the protonophore FCCP (1 μM) to ensure an even exchange of Ca2+ between all cellular compartments.
Because such treatment results in fragmentation of MN (even in the absence of Ca2+), to preserve filamentous morphology of mitochondria cells had been fixed with paraformaldehyde (4%) before permeabilization. Fixation also blocked all physiological Ca2+ transport mechanisms while preserving intact morphology. In this case mitochondria were predicted to show an artificially even [Ca2+] rise, providing a control for possible optical, dye, and image processing artifacts. For conditions 2 and 3, the ER was emptied of Ca2+ before permeabilization by the blockage of the Ca2+-ATPase using Cyclopiazonic acid (CPA; 10 μM); therefore, ER-dependent processes did not contribute to Ca2+ signaling.
In plasma-membrane permeabilized cells Ca2+ uptake at a mitochondrial location was characterized by the maximum of d[Ca2+]m/dt, evoked upon step elevation of [Ca2+]b from resting 132 nM to 8–72 μM (Fig. 2 B, open symbols). Mitochondrial Ca2+ uptake was greatly reduced by FCCP (1 μM) and abolished by Ru360 (a blocker of Ca2+ uniporter; 5 μM), indicating that the Ca2+ uniporter was the pathway for Ca2+ uptake (not shown). To achieve a maximal d[Ca2+]m/dt similar to that induced by stimulating intact cells with ATP (Fig. 2 B; solid diamond), [Ca2+]b had to be elevated to 28 μM for permeabilized cells, in which [Ca2+]c is presumably ≈[Ca2+]b. A comparison of noncalibrated [Ca2+]m transients (δf/dt) for all the three conditions is also given yielding similar results (Fig. 2 C). Perimitochondrial [Ca2+] was expected to quickly equilibrate with [Ca2+]b. If access of buffer Ca2+ to mitochondria in plasma membrane-permeabilized cells were restricted, a faster and more homogenous rise of [Ca2+]m would be expected in ionophore treated (permeabilized) cells, which was not the case (Fig. 2 C and Fig. 3, see below).
Data shown in Fig. 2, B and C, suggest that mitochondrial Ca2+ uptake sites experience [Ca2+] of ≈30 μM when intact cells are challenged with ATP. Therefore, this [Ca2+]b was chosen for further study on mitochondrial Ca2+ uptake. The established bulk [Ca2+]c of ≤1 μM measured during ATP-evoked signaling in RBCE cells (Dömötör et al., 1999), suggests that the uniporters must sense local cytosolic [Ca2+] between the ER and mitochondria during ATP-evoked signaling.
It should also be noted here that we found an altered behavior of the Ca2+ dye (increased dynamic range; see Methods) upon plasma membrane permeabilization in ADP-containing intracellular buffer. This alteration possibly reflects the conformation change from the resting orthodox to the ADP-induced condensed state of mitochondria (Hackenbrock, 1966). The differing dynamic range was taken into account in the calibration procedure for Fig. 2 B.
Ca2+ hotspots are due to cytosolic microdomains between ER and mitochondria, not to a clustered uptake machinery
The spatiotemporal characteristics of [Ca2+]m rise was evaluated in ATP-stimulated intact cells, and in CPA-treated plasma-membrane permeabilized or ionophore-treated fixed cells exposed to [Ca2+]b = 28 μM. Because it was not possible to accurately calibrate each pixel along the mitochondria, [Ca2+]m transients were evaluated using noncalibrated fluorescence signals (δf/t; Fig. 2 C, above). Spatial inhomogeneity of mitochondrial [Ca2+] rise was visualized by the punctate pattern of maximal d[Ca2+]m/dt. Fig. 3 A, δf/t Max, shows the maximal d[Ca2+]m/dt (as δf/t) for each pixel that occurred during the experiment. Discrete spots with distinctly higher maximal δf/t values were present only in ATP-stimulated intact cells, but not in permeabilized or ionophore-treated fixed cells. This spatial heterogeneity was statistically confirmed by calculation of punctate/diffuse index (denoting mean ± SD) of maximal δf/t values over mitochondrial filaments (Fig. 3 C).
The temporal inhomogeneity of [Ca2+]m rise was illustrated by color-coding the images according to the following rule: pixels reaching maximal δf/t value first are in red, with those coming later shown in cooler colors (the full range was 0.5 s; Fig. 3 A, timing). These images show marked intra- and intermitochondrial differences in time points when δf/t reaches its maximal value in ATP-stimulated intact cells, but not in permeabilized or fixed ones. The temporally even rise of [Ca2+]m in permeabilized cells suggests that there are no diffusional barriers between the buffer and the perimitochondrial space, and mitochondria are evenly exposed to [Ca2+]b.
The spreading of [Ca2+]m rise from the hotspots, indicating the presence of intramitochondrial Ca2+ diffusion was determined from the sloped characteristics of δf/t time-space diagrams (Fig. 3 B), and was expressed mathematically as reciprocal of Ca2+ signal traveling velocity (slope value). Thus, a traveling of the [Ca2+]m rise is indicated by high values, whereas an even rise of [Ca2+]m is represented by slope values close to zero (Fig. 3 D). Slope values above the sensitivity of the method (red line; see details in Fig. 3 legend) were found in ATP-stimulated intact cells, but not in permeabilized or ionophore-treated fixed cells. The traveling velocity of the intramitochondrial Ca2+ signal was 22.7 ± 2 μm/s in intact cells. For comparison, the traveling velocity of the cytosolic Ca2+ wavefront calculated from low-pass filtered images was 75 ± 8 μm/s (n = 35).
The clearly different traveling velocities indicate that the spreading of the mitochondrial Ca2+ signal is not simply a reflection of the cytosolic Ca2+ wave. Moreover, [Ca2+]m rise often traveled in the opposite direction compared to the cytosolic Ca2+ wave (Fig. 1 C; see the slopes indicated). We conclude that the uneven and spreading rise of fluorescence is first of all not an optical artifact, since it was distinctly present in intact cells where mitochondria took up Ca2+ that was released by IP3Rs. Furthermore, the abolished directionality of [Ca2+]m rise in plasma-membrane permeabilized cells together with the requirement of high [Ca2+] for mitochondrial uptake (see above) suggests that the focal mitochondrial Ca2+ uptake (hotspots, see Figs. 1 and 3, A–B, left) observed in ATP-stimulated intact cells is a consequence of focally released ER-Ca2+ taken up by the uniporters which are evenly distributed in the mitochondrial membrane as opposed to the uptake of bulk cytosolic Ca2+ through clustered uniporters.
Barriers in the passage of intramitochondrial Ca2+
Spreading of [Ca2+]m rise elicited by ATP-stimulation of intact cells was often stopped by barriers (white arrow in Fig. 1, C and E) in mitochondrial filaments, which appeared visually to be continuous (see left part of Fig. 1 C). Barriers found during ATP stimulation of a cell are also shown as white lines in Fig. 3 A (leftmost images). Note that these barriers often divide differently colored parts of mitochondria in Fig. 3 A (timing), signifying a temporally distinct rise of [Ca2+] on the two sides of the barrier. There were also segments of the MN with distinctly lower peak d[Ca2+]m/dt values present between certain barriers in Fig. 3 A (δf/t Max).
We assumed that the presence of barriers could be an inherent property of mitochondrial Ca2+ handling. An optical effect of out-of-focus loops of mitochondrial filaments was excluded, because the majority of mitochondria of the flat RBCE cells could be set into the focal plane of the used wide-field microscope.
Barriers were evaluated by counting the gaplike sudden drops of δf/t values along the ordinate of time-space profiles of d[Ca2+]m/dt. We found that barriers occurred in the vicinity of 65% of hotspots. The effective average length of mitochondria available for spreading of [Ca2+]m rise (the distance between gaps, measured at n = 173 hotspots; Fig. 3 E, left, solid bar) was 5.2 ± 0.4 μm, significantly smaller than the length of selected, visually continuous mitochondria (10.6 ± 0.3 μm; Fig. 3 E, left, shaded bar). The rise of [Ca2+]m on the two sides of the barriers was often separated in time with a mean delay of 125 ± 10 ms (Fig. 3 F). Gaplike drops of δf/t were present not only in intact, but also in plasma-membrane permeabilized cells (illustrated in Fig. 3 E, center, right) indicating the presence of mitochondrial segments less accessible for Ca2+. However, a delay of [Ca2+]m rise across these barriers was not detected, indicating a synchronous rise of [Ca2+]m in all mitochondrial compartments of plasma-membrane permeabilized or ionophore-treated cells (Fig. 3 F, red line, indicates secure threshold of detection).
Simulations support that a spreading fluorescence rise is a reliable indicator of focal Ca2+ uptake
To reinforce that the observed spreading of intramitochondrial fluorescence rise in ATP-stimulated intact cells reflects Ca2+ diffusion, the latter was simulated mathematically using a buffered diffusion model (see Appendix). To this end, mitochondria were modeled as a closed tube with Ca2+ injected at one end, while Ca2+ is being reversibly buffered and allowed to diffuse along the tube. For the mitochondrial Ca2+ buffering a single, fast buffer with a large buffering capacity (Babcock et al., 1997; Kaftan et al., 2000) was considered (κ = BT/Kd = 1000; see Fig. 4 legend or Appendix), similar to that used in a mitochondrial model by David (1999). The buffer was taken to be of slow mobility, similar to that of endogenous buffers (Naraghi and Neher, 1997). The simulated Ca2+ signal was converted to fluorescence units using the known Kd and Rf of X-rhod-1. The results of the simulation, in particular [Ca2+]m, fluorescence of X-rhod-1 (f), and δf/t (calculated and plotted as in Fig. 3 B) are shown in Fig. 4 A. The apparent traveling velocity was then determined by straight-line fits to the half-maximal contours of the time-space diagrams (as for Fig. 3 B). Based on the simulation it can be concluded that the traveling velocity of the Ca2+ signal observed as the spreading of the fluorescence rise is largely invariant to the rate of Ca2+ influx into the mitochondria (Fig. 4 B) or to the buffering parameters (BT, koff; Fig. 4, C and D) as long as the buffer is not saturated. In contrast, the traveling velocity is strongly dependent on the diffusion coefficient of the buffer (DCaB; Fig. 4 E). The high affinity of X-rhod-1 ensures that the observed rise of fluorescence intensity reports events happening while [Ca2+]m is still low, therefore saturation of mitochondrial Ca2+ buffering, and concomitant alteration of Ca2+ diffusion, can be ignored. Thus using X-rhod-1 similar traveling velocities are measured at different Ca2+ uptake rates if a focal source is present.
FIGURE 4.

Simulation of spreading of Ca2+ rise from a point source in a buffered diffusion system. Mitochondria were considered as a closed tube represented by a single spatial coordinate (x). Ca2+ entered at one end of the tube (hotspot) upon a steplike elevation of Ca2+ influx gradient (J/DCa) from 0 to 10, 50, or 100 μM/μm as indicated. Corresponding Ca2+ currents (I) calculated in the hotspot are indicated below. Ca(x,t) was simulated by considering the diffusion of free Ca2+, reversible binding of Ca2+ to a buffer B, and diffusion of the buffer-bound Ca2+ (CaB; see Appendix). The parameters of the simulation were chosen to represent the high buffering capacity of mitochondria (total buffer concentration and kinetic properties: BT = 5000 μM, Kd = koff/kon = 5 μM, kon = 100 μM−2 s−1) and low mobility of the buffer (diffusion coefficient: DCaB = 8 μm−2 s−1). (A) The solution for Ca(x,t) was plotted as time-space diagrams (similarly to Fig. 3 B) for the three different Ca2+ influx rate ([Ca2+]m; upper panels). Each solution was plotted also as X-rhod-1 fluorescence (f; middle panels), and as temporally differentiated, δf normalized fluorescence (δf/t; bottom panels). Each of the nine diagrams were scaled individually, between minimum and maximum values. δf/t diagrams were thresholded at 50%. The following simulated values are shown for each influx gradient: [Ca2+]m 1 s after start of the uptake at the hotspot (x = 0) and farther (x = 3 μm); the maximal rise velocity of fluorescence (peak δf/t); and the apparent traveling velocity (ATV); dashed lines indicate the result of fit performed in a similar way to Fig. 3 B. The dependence of ATV on the simulation parameters is shown below: (B) ATV as a function of influx gradient, where the rest of the parameters were set as indicated above; (C–E) ATV as a function of BT, kon, koff, and DCaB, where the influx gradient was set to 50 μM/μm and the nonvaried parameters as indicated above. (F) Relationship between the current of Ca2+ influx, and the simulated peak δf/t of X-rhod-1 fluorescence rise (solid trace). Dotted and dashed traces indicate the effect of a double or half buffer capacity, respectively (achieved by changing the parameter indicated).
It is intriguing to calculate the magnitude of Ca2+ currents flowing in the hotspots. Fig. 4 F gives estimates for the peak δf/t of X-rhod-1 fluorescence as a function of the Ca2+ current, considering that the uptake happens at the end of a 230-nm (Loew et al., 1993) diameter tube. The dotted and dashed traces in Fig. 4 F indicate that the peak δf/t-current relation strongly depends on κ.
The comparison of simulated and measured data suggests a low mobility of intramitochondrial Ca2+ buffers. The presence of X-rhod-1 was neglected in the model, calculating with an overall apparent buffering. The Ca2+ dye being a mobile, high affinity buffer could cause an overestimation of κ or the apparent DCaB. It also has to be noted that the Ca2+ dye could bind to proteins, decreasing its apparent diffusion coefficient (Konishi et al., 1988), and therefore the buffering exerted by the dye could have less (overestimating) effect on DCaB or even could artificially slow down intramitochondrial Ca2+ diffusion. Nevertheless, we observed slow traveling velocities in our experiments, which enabled us to make a clear distinction between the presence or absence of a traveling [Ca2+] rise and focal uptake of Ca2+.
Irradiation induces transient depolarizations of ΔΨm
Intramitochondrial barriers of Ca2+ diffusion described above argue strongly against a luminally continuous MN. In contrast, mitochondria were found to form electrically continuous networks (syncytia) in several cell types, as indicated by synchronous changes of ΔΨm along these networks (Amchenkova et al., 1988; Fall and Bennett, 1999; De Giorgi et al., 2000; Diaz et al., 2000). The size of these electrical syncytia has not been quantitated before; therefore we addressed this question in comparison to our data on the limited passage of Ca2+.
Fluctuations of ΔΨm evoked by fluorescence excitation and phototoxicity (Oseroff et al., 1986) of mitochondrially accumulated positively charged, lipophilic rhodamines have been reported (De Giorgi et al., 2000; Collins et al., 2002), and attributed to the formation of reactive oxygen species (Huser et al., 1998; Zorov et al., 2000; Jacobson and Duchen, 2002). Irradiation-induced repetitive, sudden discharges of ΔΨm (flickering) were evoked and detected in our experiments by imaging RBCE cells loaded with TMRM (Fig. 5). Flickering was initially reversible and repetitive, but the phenomenon was self-limiting, leading to permanent depolarization within 20–30 s (Fig. 5, A and B). The timecourse (onset, frequency of events, cessation) depended on the dye concentration and on the illumination level (not shown), indicating the phototoxic effect.
FIGURE 5.
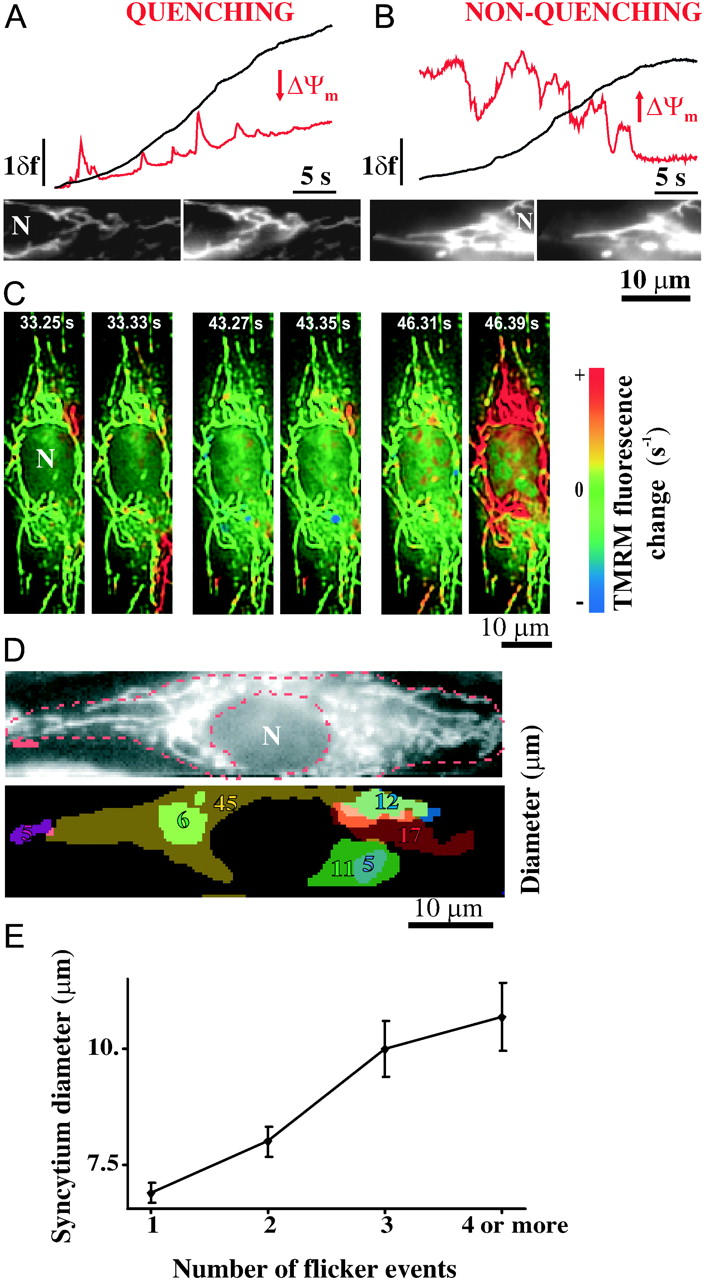
Electrical connectivity of mitochondria visualized by irradiation-induced fluctuations of ΔΨm. (A–B) Typical traces and raw images of TMRM fluorescence intensity (shown as δf) in quenching condition (A) over a selected mitochondrion (red) and the nucleus (black); or in nonquenching condition (B) showing high-pass filtered fluorescence over a selected mitochondrion (red), or raw fluorescence over the nucleus (black). The time elapsed between the shown frame pairs was 80 ms for A and 0. 5 s for B. N denotes the nucleus. (C) Pairs of consecutive images of temporally differentiated TMRM fluorescence image series showing an RBCE cell containing an MN which forms a large electrical syncytium and a few smaller, independently flickering mitochondria (quenching condition; from n = 51 cells). The red pseudocolor indicates sudden depolarization of ΔΨm. Full-length image series is available as Supplementary movie 2. (D) A typical TMRM-loaded RBCE cell (raw image on the top) and its silhouette filled with the shapes of the individually flickering syncytia. Values indicate the largest diameters of the syncytia in μm. (E) Relationship between the number of flicker events and the diameter of the flickering syncytia.
Mitochondria form multiple electrical syncytia
As first approach to quantitate the sizes of the flickering areas, TMRM was used in quenching condition, when ΔΨm depolarization was indicated by the rise of fluorescence over and nearby the depolarizing mitochondria (Fig. 5 A). To this end, short (32 s), continuous (streaming) image acquisition was used, therefore movement of mitochondria was minimal. Depolarizations are illustrated as consecutive frames of rate of fluorescence rise images in Fig. 5 C (or see Supplementary movie 2). During flickering, fluorescence rise was observed over smaller or larger, discrete regions of the cell within the lapse of a single frame (80 ms). Fig. 5 D shows the silhouette of an RBCE cell with each individually flickering cellular area indicated by a different color. Most of the observed cells (27 out of 51) had one or few large synchronously flickering regions (>20 μm; measuring the largest diameter), whereas the mean largest diameter was 8.5 ± 0.4 μm (or see histogram in Fig. 7 A).
FIGURE 7.
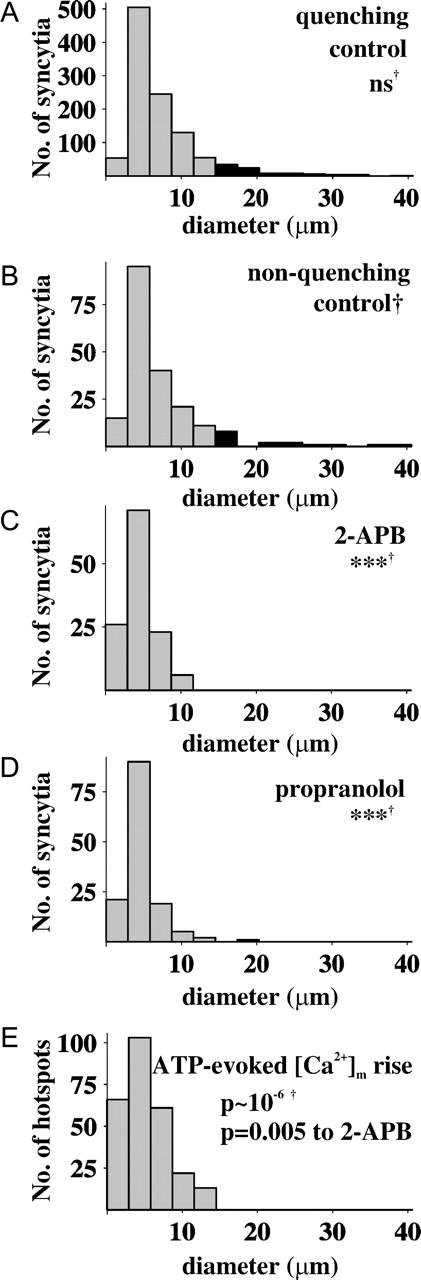
Histogram analysis of syncytium diameters and its comparison to the distance available for diffusion of [Ca2+]m. (A) Histogram of syncytium diameters estimated using quenching TMRM loading conditions (n = 1086 syncytia; ns, not significantly different from B compared by χ2-test; data corresponds to Fig. 5, C and D). (B) Histogram of syncytium diameters measured using nonquenching TMRM loading conditions (n = 198; Fig. 6 A); (C) effect of 2-APB (50 μM; nonquenching; ***, significance at p < 0.001 compared to B by χ2-test; n = 126; Fig. 6 C); (D) effect of propranolol (50 μM; nonquenching; n = 138; Fig. 6 D). (E) Histogram of distances available for intramitochondrial Ca2+ diffusion during ATP-stimulation of intact cells (or distance between barriers; n = 265 hotspots; Fig. 3).
Synchronized ΔΨm flickering is attributed to intramitochondrial electrical continuity, the discharge of ΔΨm being initiated by a focal permeability increase, developing in an irradiation-dependent, stochastic manner (De Giorgi et al., 2000; Collins et al., 2002; Zorov et al., 2000). Detection of TMRM released by the depolarized mitochondria does not resolve signals coming from individual mitochondria. It is nevertheless highly unlikely that synchronization was due to simultaneous permeability increases of independent mitochondria within the same cellular regions, since this stochastic phenomenon occurred with an order-of-magnitude smaller frequency than the image acquisition rate. More likely, synchronous cellular regions outline electrically continuous mitochondrial syncytia. In support of intramitochondrial conduction, larger synchronous areas of MN flickered more frequently than smaller ones (Fig. 5 E), as expected for larger MN values in which the occurrence of a focal permeability increase is more probable.
As a second approach to obtain more direct information on the spatial extension of mitochondrial syncytia we performed experiments using TMRM at nonquenching loading conditions. Under these conditions ΔΨm depolarization is detectable as a decrease of fluorescence directly over the mitochondria (Fig. 5 B). This allowed us to selectively analyze the flickering behavior of individual mitochondria, using the same high-pass filtering technique as for the [Ca2+]m measurements (see Supplementary movie 3). Individual syncytia were identified by a computer algorithm based on temporal cross-correlation of synchronously flickering pixels, and visualized by uniform coloring (Fig. 6). Using this, 6–12 syncytia per cell were located. These had a mean diameter of 7.4 ± 0.5 μm (n = 14 cells; 136 syncytia), but 5 out of 14 cells contained networks longer than 20 μm. Mitochondria appearing in conglomerates tended to form branched networks which overlapped spatially, but still flickered independently of each other (Fig. 5 D and Fig. 6 A). Nonquenching mode analysis of syncytium diameters yielded essentially similar results to that recorded in quenching mode, and the distributions of syncytium diameters were not statistically different (Fig. 7, A and B).
FIGURE 6.

ΔΨm flickering at nonquenching TMRM loading conditions in the presence of TFP, 2-APB, and propranolol. Image pairs show raw TMRM fluorescence (top) and electrical syncytia (bottom). Individual electrical syncytia where TMRM fluorescence fluctuating synchronously were assigned to different colors and visualized by uniform coloring of those areas within the shaded silhouette of mitochondria. Colored ellipses indicate the extension of a few selected syncytia. (A) Control (typical of n = 22 cells); (B) TFP (10 μM; n = 14); (C) 2-APB (50 μM; n = 15); (D) propranolol (50 μM; n = 14). Drugs were applied using a 20-min preincubation, and were continuously present during the experiment. The image series corresponding to A is available as Supplementary movie 3.
To test for the presence of electrical syncytia under the conditions used for the mitochondrial Ca2+ uptake measurements, syncytium diameter was assayed in cells co-loaded with both X-rhod-1 and TMRM or in TMRM-loaded cells stimulated with ATP (100 μM), and no significant differences were found from the values above (not shown). It is noted here that effect of ATP-stimulation on ΔΨm of intact cells was also investigated and only a minor depolarization (∼1% of that evoked by 1 μM FCCP; not shown) was found during mitochondrial Ca2+ uptake.
Fragmentation of syncytia by 2-aminoethoxydiphenyl borate (2-APB) and propranolol, but not by classical PTP inhibitors
The discrepancy between the limited passage of Ca2+ and the larger electrical syncytia could be due to junctions between individual mitochondria which are electrically conductive (Skulachev, 2001) but may not be permeable to Ca2+. Therefore we investigated the possibility that syncytia are coupled through PTP or the multiple conductance channel (MCC) involved in mitochondrial protein import. Flickering itself has been ascribed to PTP opening (Huser et al., 1998; Jacobson and Duchen, 2002); however, mechanisms independent of classical PTP were also considered (De Giorgi et al., 2000). Nevertheless, using both quenching and nonquenching TMRM loading conditions we observed large flickering syncytia with diameters similar to the control in the presence of BKA; 30–60 μM). Flickering and syncytium formation was not blocked by Cyclosporin A (CsA; 1μM; present at TMRM loading). It is noted here that flickering was more frequent with CsA present (possibly due to elevated in [Ca2+]m as measured by X-rhod-1; not shown). In the presence of trifluoperazine (TFP; 10 μM), a blocker of PTP (Broekemeier and Pfeiffer, 1989) and MCC (Pavlov and Glaser, 1998), flickering was observed only under nonquenching conditions at stronger illumination levels. TFP dose-dependently quenched TMRM fluorescence (not shown), which could account for the partial attenuation of flickering. In the presence of TFP mitochondria appeared to be more interconnected, and significantly larger syncytia were detected (Fig. 6 B; mean diameter of 9.3 ± 0.7 μm n = 93 syncytia; p < 0.01 by ANOVA on Ranks). Effects of TFP on its diverse pharmacological targets like calmodulin or phospholipase A2 (Broekemeier and Pfeiffer, 1989) were not investigated.
Conversely, synchronously flickering segments of the MN were significantly smaller in the presence of 2-aminoethoxydiphenyl borate (2-APB 50 μM; Fig. 6 C), a novel blocker of PTP (Chinopoulos et al., 2003) or in the presence of propranolol (50–200 μM; Fig. 6 D), a blocker of MCC (Pavlov and Glaser, 1998). Most importantly, aggregated mitochondria, which tend to form a syncytium in control condition, flickered as separate smaller, nonbranched segments in the presence of 2-APB or propranolol. The mean diameter of syncytia were 4.6 ± 0.2 μm (n = 126) for 2-APB and 4.8 ± 0.2 μm (n = 138) for propranolol (measured in nonquenching condition; p < 0.01 by ANOVA on Ranks for both treatments compared to untreated). However, 2-APB (50 μM) pretreatment induced the fragmentation of the MN, whereas propranolol treatment did not, unless higher concentrations (100–200 μM) were used. 2-APB has significant uncoupling properties (Chinopoulos et al., 2003), whereas propranolol does not uncouple below 200 μM (Polster et al., 2003). Therefore partial uncoupling was tested using FCCP (15 nM; this concentration achieves similar uncoupling to that evoked by 50 μM 2-APB; Chinopoulos et al., 2003), and proved not to decrease syncytium diameters (not shown).
Histograms of syncytium diameters for 2-APB- or propranolol-treated conditions were significantly different from control (Fig. 7). For comparison a histogram of distances available for intramitochondrial Ca2+ diffusion is shown in Fig. 7 E. The distribution of these distances resembled most closely that of syncytium diameters in the presence of 2-APB.
DISCUSSION
Functional imaging of mitochondria
In recent years there has been great progress in studying the morphology of in situ mitochondria with high-resolution fluorescence imaging techniques (Rutter and Rizzuto, 2000; Collins et al., 2002); however, similar resolution in functional studies, i.e., such as on Ca2+ homeostasis, is still lacking. In this study we combined our previously introduced technique for selective [Ca2+]m measurement (Gerencser and Adam-Vizi, 2001) with further image processing to gain a deeper insight into the dynamics of in situ mitochondrial Ca2+ uptake in RBCE cells. The observed spatiotemporal heterogeneity of [Ca2+]m rise revealed focal mitochondrial Ca2+ uptake in response to stimulation of intact cells, intramitochondrial Ca2+ diffusion, and barriers in the way of Ca2+ passage. We also demonstrated that electrically continuous mitochondrial networks extend in size beyond this diffusion limit, suggesting the presence of (ion) conductive junctions between mitochondria or matrix compartments, which restrict the (buffered) diffusion of Ca2+.
Focal mitochondrial Ca2+ uptake and intramitochondrial Ca2+ diffusion
The analysis of [Ca2+]m rise revealed Ca2+ hotspots, regions of mitochondria where the [Ca2+]m rise first appears, and intramitochondrial Ca2+ gradients indicating diffusion of Ca2+ (Fig. 1). This phenomenon was observed in ATP-stimulated intact cells, but not in permeabilized cells. The lack of the phenomenon in cells treated with ionophore (Fig. 3) excluded the possibility of optical, dye, or image processing artifacts; thus, we propose that hotspots indicate focal Ca2+ uptake in the mitochondria. The even Ca2+ uptake observed in permeabilized cells also argues that ER-mitochondria microdomains, rather than focal uptake mechanisms, are responsible for these hotspots. Consistent with this was the finding that IP3-dependent elementary Ca2+ release sites in non-excitable cells were found to exhibit clustered behavior with a similar spacing (∼6 μm; Bootman et al., 1997) to what we observed for mitochondrial hotspots (∼7 μm).
In our experiments [Ca2+]b had to be elevated to ∼30 μM for permeabilized cells to achieve similar fast rise of [Ca2+]m as it was observed in ATP-stimulated intact cells. Our data suggest that Ca2+ from the buffer could easily penetrate to the perimitochondrial space, but we could not experimentally test the kinetics and magnitude of the rise of the perimitochondrial [Ca2+] in intact cells, or upon switching the perfusion from low to high [Ca2+]. Nevertheless, similar Ca2+ concentrations were estimated around IP3Rs by simulation (Thul and Falcke, 2004), and [Ca2+] was suggested to reach similar concentrations (20–50 μM) in microdomains in RBL cells (Csordas et al., 1999) or in chromaffin cells (Montero et al., 2000) during physiological stimuli. Mitochondrial Ca2+ uptake from submicromolar concentrations of Ca2+ has also been reported (Pitter et al., 2002), but on the timescale of tens of seconds, thus at 1–2 orders-of-magnitude slower rate than in our experiments.
A Ca2+ current of ∼70 pA was simulated to evoke similar transients of X-rhod-1 fluorescence to the measured ones. This current was greatly dependent on the buffer capacity (κ), which was not known in our system. Recently 20–30 pA currents have been reported in mitoplasts (2–5-μm inner membrane vesicles) as measured in whole-mitoplast mode during Ca2+ uptake from a 100 μM [Ca2+] buffer (Kirichok et al., 2004). The current estimated for the Ca2+ release during Ca2+ puffs from IP3R clusters was estimated to be ∼2.5 pA in Xenopus oocytes (Sun et al., 1998) or was modeled to be <0.8 pA (Thul and Falcke, 2004). This suggests that mitochondrial Ca2+ hotspots could receive Ca2+ from multiple IP3R clusters in RBCE cells. We also have to consider the possibility that the (effective) mitochondrial κ is much smaller when [Ca2+]m is in the low μM range (∼Kd = 1.4 μM where X-rhod-1 is most sensitive for the changes of [Ca2+]), because phosphate complex formation is not initiated (at [Ca2+] <2–3 μM; Chalmers and Nicholls, 2003), and therefore Ca2+ currents in the hotspots could be smaller.
A substantial heterogeneity of mitochondrial function among various cell types (see Duchen, 2000) and within individual cells (Monteith and Blaustein, 1999; Park et al., 2001; Collins et al., 2002) has been indicated. [Ca2+]m values reported so far exhibit a large discrepancy between measurements in which different types of probes were used. Low-affinity aequorin mutants (Montero et al., 2000) or chameleons (Arnaudeau et al., 2001) revealed millimolar [Ca2+]m, whereas measurements using chelator probes showed concentrations in the low micromolar range (Simpson et al., 1998; Monteith and Blaustein, 1999; Drummond et al., 2000). Similar probe-specific differences exist for the estimation of d[Ca2+]m/dt. Values close to ours (2–10 μM/s) were determined using aequorin mutants in HeLa cells (Rapizzi et al., 2002), whereas one order-of-magnitude larger values were found in chromaffin cells (Xu et al., 1997; Montero et al., 2000). Results from studies using Rhod2 showed typically 1–2 orders-of-magnitude smaller uptake rates (Babcock et al., 1997; Collins et al., 2001). The discrepancy was argued to be due to higher artificial calcium buffering effect of chelator probes compared to photoproteins (Brini et al., 1995). We propose that the heterogeneity of responses obtained with photoproteins could arise also from intramitochondrial hotspots (besides the heterogeneity of mitochondrial populations), which are impossible to resolve spatially using the weak luminescence of aequorin (Brownlee, 2000). Our simulations suggest the focal uptake and buffered diffusion create a local transient high (millimolar) [Ca2+]m at the hotspots, and smaller concentrations further away (see Fig. 4).
We have previously reported that mitochondrial Ca2+ cycling (simultaneous uptake and extrusion) occurs during ATP-evoked Ca2+ transients in intact RBCE cells (Gerencser and Adam-Vizi, 2001). Our data show that Ca2+ enters the mitochondria focally at high-[Ca2+] microdomains, where the high local [Ca2+]c is unfavorable for the normal Ca2+-extrusion by the mitochondrial Na+/Ca2+ exchanger, therefore Ca2+ extrusion has to be preceded by lateral diffusion of Ca2+ farther away from the hotspots. Functional consequences of such Ca2+ transfer on store-operated Ca2+ entry were recently described (Malli et al., 2003).
Synchronized fluctuations of ΔΨm are due to electrical continuity
The synchronous flickering of TMRM fluorescence extending on larger distances (in our case up to 50 μm) is argued not to be an experimental artifact due to cytosolic diffusion of TMRM, or any chemical messenger, but is a phenomenon reflecting synchronous fluctuations of ΔΨm and synchronous release of mitochondrial dye over the area (Zorov et al., 2000). Considering a diffusional mechanism, H2O2, a quickly diffusible reactive oxygen species involved in flickering (Jacobson and Duchen, 2002; Huser and Blatter, 1999; Zorov et al., 2000) could, in theory, travel a comparable radius (r ≈ 16 μm) during the 80-ms time lapse of our image acquisition. (This radius was yielded by the two-dimensional (considering flat cells) Einstein-Smoluchowski equation:  where the diffusion coefficient
  was taken as ∼850 μm2 s−1 (from http://www.h2o2.com, with the additional assumptions of a cytosol twice as viscous as water and the absence of biological elimination). However, the repeated synchronous flickering of the same, definite mitochondrial formations (the short timescale of the experiment eliminated movement artifacts; see Supplementary movie 3), and the lack of synchronicity between distinct formations in spatial proximity to each other suggests wired networks, rather than the role of a diffusible messenger.
Ca2+-barriers could be reflections of intra- or intermitochondrial junctions
A growing body of evidence is available for both continuous and discontinuous MNs. Assays based on ΔΨm measurements indicated an electrical continuum in the MN (Amchenkova et al., 1988; De Giorgi et al., 2000; Diaz et al., 2000), whereas assays based on diffusion of fluorescent proteins in mammalian cells (Collins et al., 2002; Collins and Bootman, 2003), but not in yeast (Jakobs et al., 2003), revealed separated mitochondrial (matrix) compartments. Our results also reflect this dualism; data on ΔΨm flickering infer that large areas of MN exist in electrical continuum (with diameters up to 20–50 μm, 7–9 μm on average) in contrast to the compartmentalization suggested by the short length available for diffusion of Ca2+ (5.2 ± 0.4 μm). The smallest (and most frequently occurring) syncytia are similar in size to the mean Ca2+ diffusional length (compare histograms A and E in Fig. 7), whereas no diffusional length >15 μm was found. This peak of the syncytium diameter or diffusional length histograms could indicate the length of unitary mitochondria (3–6 μm), building blocks of mitochondrial networks.
The discrepancy between the limited diffusional distances and the large areas of synchronized ΔΨm transients could be explained by the presence of intermitochondrial junctions (Skulachev, 2001) or dynamically isolated matrix compartments within individual mitochondria (Huser and Blatter, 1999). Intermitochondrial junctions were described on the basis of electron microscopic observations (Bakeeva et al., 1978), and to our knowledge there has been no attempt of functional or pharmacological characterization.
We propose that the observed electrical syncytium could be built up from separate compartments or units, connected by intra- or intermitochondrial junctions that enable electrical continuity and also form barriers for Ca2+ diffusion. Alternatively, we suggest—based on our simulation results on the effect of DCaB on traveling velocity (Fig. 4 E)—that barriers indicate segments of mitochondria, where the mobility of the endogenous Ca2+ buffering molecules is lower. Thus spreading of mitochondrial Ca2+ signal can be also attenuated by a barrier for Ca2+ buffering molecules or by the local presence of less mobile—or fixed—Ca2+ binding molecules. Nevertheless, it has to be noted that during our measurements with X-rhod-1 it was not possible to make a distinction between endogenous and dye buffering. Therefore we cannot exclude the possibility that such barriers could build up from locally accumulated and immobile dye due to protein binding. However, we found no signs of inhomogeneous X-rhod-1 distribution in high Ca2+ plus ionophore-treated RBCE cells. To minimize the effect of dye on Ca2+ buffering, the loading concentration (and time) was kept as low as the signal/noise ratio of the image acquisition allowed.
The drugs TFP, propranolol, and 2-APB had a clear effect on the mitochondrial fusion/fission process, with fusion being promoted by TFP, and fission by the latter two. From these compounds, 2-APB (100 μM) was reported previously to induce mitochondrial swelling and fragmentation (Peppiatt et al., 2003). Thus the observed changes in syncytium diameters could at least partially be due to altered mitochondrial fusion/fission.
Our mitochondria were well polarized and exhibited flickering of large syncytia; thus junctions and flickering, unlike classical PTP (Zoratti and Szabo, 1995) are typically observed at high ΔΨm. The low-conductance mode PTP, being H+ selective (Novgorodov et al., 1992; Broekemeier et al., 1998) and insensitive to CsA and BKA (Brustovetsky and Dubinsky, 2000) but blocked by 2-APB (Chinopoulos et al., 2003) could be a possible candidate for the junction. Alternatively, ΔΨm-dependent, CsA-insensitive permeability increases blocked by propranolol (Sokolove and Kinnally, 1996) were reported in the presence of mitochondrial targeting signal peptides; however, our inconsistent findings with TFP and propranolol do not support the involvement of MCC in building up electrical syncytia.
Our study demonstrates submitochondrial heterogeneity of Ca2+ homeostasis, adding a new aspect to our knowledge of the cellular and subcellular heterogeneity of mitochondria. Our data also suggest that semi-autonomous units of mitochondria exist, forming electrical syncytia, but that movement of Ca2+ is restricted to the individual organelle.
SUPPLEMENTARY MATERIAL
An online supplement to this article can be found by visiting BJ Online at http://www.biophysj.org.
Acknowledgments
The authors are grateful to László Csanády and Michael Duchen for their valuable comments on the manuscript, to András Spät for helpful advice in the course of the experiments, and to Katalin Takács for excellent technical assistance.
The work was supported by grants from the Hungarian National Fund for Scientific Research, the Hungarian Medical Research Council, the Hungarian National Committee for Technological Development 02489/2000, and the Hungarian Academy of Sciences to V.A.-V.
APPENDIX
Simulation of buffered diffusion
Mitochondria were considered as a closed tube represented by a single spatial coordinate (x). Ca2+ entered at one end of the tube upon a steplike elevation of Ca2+ gradient at x = 0. The other end of the tube x = 1 was closed. The buffered diffusion system consisted of the diffusion of free Ca2+ (Ca), with its reversible binding to an apparent, mobile buffer (B) as
 |
(6) |
and the diffusion of buffer-bound Ca2+ (CaB). Because the matrix dye concentration during measurements was not known, X-rhod-1 as a mobile buffer was not considered as a separate entity, but as part of the apparent buffering. Ca2+ uptake kinetics of the uniporter, Ca2+-phosphate complex formation and Ca2+ efflux were not considered in this model. The simulation was performed by the numeric solution of the partial differential equation system of buffered diffusion (Naraghi and Neher, 1997),
 |
(7) |
Initial conditions were set as
 |
(8) |
where Ca0 was taken as 0.31 μM based on our measurements. Boundary conditions were set according to
 |
(9) |
For a steplike elevation of Ca2+ influx (at x = 0; t = 0.3 s), the
 |
(10) |
function was used (a steep sigmoid, where a is the maximal value of the flux of Ca2+ (J); a/DCa was 10, 50, or 100 μM/μm in Fig. 4). The arbitrarily chosen Ca2+ fluxes are given also as currents considering that Ca2+ enters into a 230-nm (Loew et al., 1993) diameter tube according to I = 2Fr2πJ, where F is the Faraday's constant and r is the radius of the tube. Parameters were chosen to represent the high buffering capacity of mitochondria (total [B]: BT = 5000 μM; Kd = koff/kon = 5 μM; kon = 100 μM−2 s−1) and low mobility of the buffer (diffusion coefficients: DCaB = 8 μm−2 s−1, whereas DCa = 220 μm−2 s−1; Naraghi and Neher, 1997; David, 1999). Equation 7 was solved for the (0 ≤ x ≤ l = 5 μm; 0 ≤ t ≤ 1.5 s) range with the NDSolve standard function of Mathematica 4.2 (using the MaxRelativeStepSize→0.001, StartingStepSize→0.1, and MaxSteps→10,000 options). The fluorescence of X-rhod-1 was calculated by the f =  equation from the resultant Ca(x,t) of Eq. 7 (
 and Rf = 4.6). Fluorescence values were handled similarly to the measured ones, by δf calculation and temporal differentiation. See Mathematica notebook of the simulation in the Supplementary Material available online.
References
- Amchenkova, A. A., L. E. Bakeeva, Y. S. Chentsov, V. P. Skulachev, and D. B. Zorov. 1988. Coupling membranes as energy-transmitting cables. I. Filamentous mitochondria in fibroblasts and mitochondrial clusters in cardiomyocytes. J. Cell Biol. 107:481–495. [DOI] [PMC free article] [PubMed] [Google Scholar]
- Arnaudeau, S., W. L. Kelley, J. V. Walsh, Jr., and N. Demaurex. 2001. Mitochondria recycle Ca2+ to the endoplasmic reticulum and prevent the depletion of neighboring endoplasmic reticulum regions. J. Biol. Chem. 276:29430–29439. [DOI] [PubMed] [Google Scholar]
- Babcock, D. F., J. Herrington, P. C. Goodwin, Y. B. Park, and B. Hille. 1997. Mitochondrial participation in the intracellular Ca2+ network. J. Cell Biol. 136:833–844. [DOI] [PMC free article] [PubMed] [Google Scholar]
- Bakeeva, L. E., Y. Chentsov, and V. P. Skulachev. 1978. Mitochondrial framework (Reticulum mitochondriale) in rat diaphragm muscle. Biochim. Biophys. Acta. 501:349–369. [DOI] [PubMed] [Google Scholar]
- Bers, D. M., C. W. Patton, and R. Nuccitelli. 1994. A practical guide to the preparation of Ca2+ buffers. Methods Cell Biol. 40:3–29. [DOI] [PubMed] [Google Scholar]
- Boitier, E., R. Rea, and M. R. Duchen. 1999. Mitochondria exert a negative feedback on the propagation of intracellular Ca2+ waves in rat cortical astrocytes. J. Cell Biol. 145:795–808. [DOI] [PMC free article] [PubMed] [Google Scholar]
- Bootman, M. D., E. Niggli, M. J. Berridge, and P. Lipp. 1997. Imaging the hierarchical Ca2+ signalling system in HeLa cells. J. Physiol. 499:307–314. [DOI] [PMC free article] [PubMed] [Google Scholar]
- Brini, M., R. Marsault, C. Bastianutto, J. Alvarez, T. Pozzan, and R. Rizzuto. 1995. Transfected aequorin in the measurement of cytosolic Ca2+ concentration ([Ca2+]c). A critical evaluation. J. Biol. Chem. 270:9896–9903. [DOI] [PubMed] [Google Scholar]
- Broekemeier, K. M., C. K. Klocek, and D. R. Pfeiffer. 1998. Proton selective substate of the mitochondrial permeability transition pore: regulation by the redox state of the electron transport chain. Biochemistry. 37:13059–13065. [DOI] [PubMed] [Google Scholar]
- Broekemeier, K. M., and D. R. Pfeiffer. 1989. Cyclosporin A-sensitive and insensitive mechanisms produce the permeability transition in mitochondria. Biochem. Biophys. Res. Commun. 163:561–566. [DOI] [PubMed] [Google Scholar]
- Brownlee, C. 2000. Cellular calcium imaging: so, what's new? Trends Cell Biol. 10:451–457. [DOI] [PubMed] [Google Scholar]
- Brustovetsky, N., and J. M. Dubinsky. 2000. Dual responses of CNS mitochondria to elevated calcium. J. Neurosci. 20:103–113. [DOI] [PMC free article] [PubMed] [Google Scholar]
- Brustovetsky, N., R. Jemmerson, and J. M. Dubinsky. 2002. Calcium-induced cytochrome-c release from rat brain mitochondria is altered by digitonin. Neurosci. Lett. 332:91–94. [DOI] [PubMed] [Google Scholar]
- Chalmers, S., and D. G. Nicholls. 2003. The relationship between free and total calcium concentrations in the matrix of liver and brain mitochondria. J. Biol. Chem. 278:19062–19070. [DOI] [PubMed] [Google Scholar]
- Chinopoulos, C., A. A. Starkov, and G. Fiskum. 2003. Cyclosporin A-insensitive permeability transition in brain mitochondria: inhibition by 2-aminoethoxydiphenyl borate. J. Biol. Chem. 278:27382–27389. [DOI] [PubMed] [Google Scholar]
- Collins, T. J., M. J. Berridge, P. Lipp, and M. D. Bootman. 2002. Mitochondria are morphologically and functionally heterogeneous within cells. EMBO J. 21:1616–1627. [DOI] [PMC free article] [PubMed] [Google Scholar]
- Collins, T. J., and M. D. Bootman. 2003. Mitochondria are morphologically heterogeneous within cells. J. Exp. Biol. 206:1993–2000. [DOI] [PubMed] [Google Scholar]
- Collins, T. J., P. Lipp, M. J. Berridge, and M. D. Bootman. 2001. Mitochondrial Ca2+ uptake depends on the spatial and temporal profile of cytosolic Ca2+ signals. J. Biol. Chem. 276:26411–26420. [DOI] [PubMed] [Google Scholar]
- Csordas, G., A. P. Thomas, and G. Hajnoczky. 1999. Quasi-synaptic calcium signal transmission between endoplasmic reticulum and mitochondria. EMBO J. 18:96–108. [DOI] [PMC free article] [PubMed] [Google Scholar]
- David, G. 1999. Mitochondrial clearance of cytosolic Ca2+ in stimulated lizard motor nerve terminals proceeds without progressive elevation of mitochondrial matrix. J. Neurosci. 19:7495–7506 [Ca2+]. [DOI] [PMC free article] [PubMed] [Google Scholar]
- De Giorgi, F., L. Lartigue, and F. Ichas. 2000. Electrical coupling and plasticity of the mitochondrial network. Cell Calcium. 28:365–370. [DOI] [PubMed] [Google Scholar]
- Di Lisa, F., and P. Bernardi. 1998. Mitochondrial function as a determinant of recovery or death in cell response to injury. Mol. Cell. Biochem. 184:379–391. [PubMed] [Google Scholar]
- Diaz, G., A. M. Falchi, F. Gremo, R. Isola, and A. Diana. 2000. Homogeneous longitudinal profiles and synchronous fluctuations of mitochondrial transmembrane potential. FEBS Lett. 475:218–224. [DOI] [PubMed] [Google Scholar]
- Dömötör, E., N. J. Abbott, and V. Adam-Vizi. 1999. Na+-Ca2+ exchange and its implications for calcium homeostasis in primary cultured rat brain microvascular endothelial cells. J. Physiol. 515:147–155. [DOI] [PMC free article] [PubMed] [Google Scholar]
- Drummond, R. M., T. C. Mix, R. A. Tuft, J. V. Walsh, Jr., and F. S. Fay. 2000. Mitochondrial Ca2+ homeostasis during Ca2+ influx and Ca2+ release in gastric myocytes from Bufo marinus. J. Physiol. 522:375–390. [DOI] [PMC free article] [PubMed] [Google Scholar]
- Duchen, M. R. 2000. Mitochondria and calcium: from cell signalling to cell death. J. Physiol. 529:57–68. [DOI] [PMC free article] [PubMed] [Google Scholar]
- Fall, C. P., and J. P. Bennett, Jr. 1999. Visualization of cyclosporin A and Ca2+-sensitive cyclical mitochondrial depolarizations in cell culture. Biochim. Biophys. Acta. 1410:77–84. [DOI] [PubMed] [Google Scholar]
- Farkas, D. L., M. D. Wei, P. Febbroriello, J. H. Carson, and L. M. Loew. 1989. Simultaneous imaging of cell and mitochondrial membrane potentials. Biophys. J. 56:1053–1069. [DOI] [PMC free article] [PubMed] [Google Scholar]
- Gerencser, A. A., and V. Adam-Vizi. 2001. Selective, high-resolution fluorescence imaging of mitochondrial Ca2+ concentration. Cell Calcium. 30:311–321. [DOI] [PubMed] [Google Scholar]
- Grynkiewicz, G., M. Poenie, and R. Y. Tsien. 1985. A new generation of Ca2+ indicators with greatly improved fluorescence properties. J. Biol. Chem. 260:3440–3450. [PubMed] [Google Scholar]
- Gunter, T. E., L. Buntinas, G. Sparagna, R. Eliseev, and K. Gunter. 2000. Mitochondrial calcium transport: mechanisms and functions. Cell Calcium. 28:285–296. [DOI] [PubMed] [Google Scholar]
- Gunter, T. E., L. Buntinas, G. C. Sparagna, and K. K. Gunter. 1998. The Ca2+ transport mechanisms of mitochondria and Ca2+ uptake from physiological-type Ca2+ transients. Biochim. Biophys. Acta. 1366:5–15. [DOI] [PubMed] [Google Scholar]
- Haak, L. L., L. S. Song, T. F. Molinski, I. N. Pessah, H. Cheng, and J. T. Russell. 2001. Sparks and puffs in oligodendricyte progenitors: cross talk between ryanodine receptors and inositol trisphosphate receptors. J. Neurosci. 21:3860–3870. [DOI] [PMC free article] [PubMed] [Google Scholar]
- Hackenbrock, C. R. 1966. Ultrastructural bases for metabolically linked mechanical activity in mitochondria. I. Reversible ultrastructural changes with change in metabolic steady state in isolated liver mitochondria. J. Cell Biol. 30:269–297. [DOI] [PMC free article] [PubMed] [Google Scholar]
- Hoth, M., C. M. Fanger, and R. S. Lewis. 1997. Mitochondrial regulation of store-operated calcium signaling in T lymphocytes. J. Cell Biol. 137:633–648. [DOI] [PMC free article] [PubMed] [Google Scholar]
- Huai-Yun, H., D. T. Secrest, K. S. Mark, D. Carney, C. Brandquist, W. F. Elmquist, and D. W. Miller. 1998. Expression of multidrug resistance-associated protein (MRP) in brain microvessel endothelial cells. Biochem. Biophys. Res. Commun. 243:816–820. [DOI] [PubMed] [Google Scholar]
- Huser, J., and L. A. Blatter. 1999. Fluctuations in mitochondrial membrane potential caused by repetitive gating of the permeability transition pore. Biochem. J. 343:311–317. [PMC free article] [PubMed] [Google Scholar]
- Huser, J., C. E. Rechenmacher, and L. A. Blatter. 1998. Imaging the permeability pore transition in single mitochondria. Biophys. J. 74:2129–2137. [DOI] [PMC free article] [PubMed] [Google Scholar]
- Jacobson, J., and M. R. Duchen. 2002. Mitochondrial oxidative stress and cell death in astrocytes–requirement for stored Ca2+ and sustained opening of the permeability transition pore. J. Cell Sci. 115:1175–1188. [DOI] [PubMed] [Google Scholar]
- Jahne, B. 1997. Spatio-Temporal Image Processing. Springer-Verlag, New York.
- Jakobs, S., A. C. Schauss, and S. W. Hell. 2003. Photoconversion of matrix targeted GFP enables analysis of continuity and intermixing of the mitochondrial lumen. FEBS Lett. 554:194–200. [DOI] [PubMed] [Google Scholar]
- Kaftan, E. J., T. Xu, R. F. Abercrombie, and B. Hille. 2000. Mitochondria shape hormonally induced cytoplasmic calcium oscillations and modulate exocytosis. J. Biol. Chem. 275:25465–25470. [DOI] [PubMed] [Google Scholar]
- Kennedy, E. D., R. Rizzuto, J. M. Theler, W. F. Pralong, C. Bastianutto, T. Pozzan, and C. B. Wollheim. 1996. Glucose-stimulated insulin secretion correlates with changes in mitochondrial and cytosolic Ca2+ in aequorin-expressing INS-1 cells. J. Clin. Invest. 98:2524–2538. [DOI] [PMC free article] [PubMed] [Google Scholar]
- Kirichok, Y., G. Krapivinsky, and D. E. Clapham. 2004. The mitochondrial calcium uniporter is a highly selective ion channel. Nature. 427:360–364. [DOI] [PubMed] [Google Scholar]
- Konishi, M., A. Olson, S. Hollingworth, and S. M. Baylor. 1988. Myoplasmic binding of Fura-2 investigated by steady-state fluorescence and absorbance measurements. Biophys. J. 54:1089–1104. [DOI] [PMC free article] [PubMed] [Google Scholar]
- Loew, L. M., R. A. Tuft, W. Carrington, and F. S. Fay. 1993. Imaging in five dimensions: time-dependent membrane potentials in individual mitochondria. Biophys. J. 65:2396–2407. [DOI] [PMC free article] [PubMed] [Google Scholar]
- Malli, R., M. Frieden, K. Osibow, C. Zoratti, M. Mayer, N. Demaurex, and W. F. Graier. 2003. Sustained Ca2+ transfer across mitochondria is essential for mitochondrial Ca2+ buffering, sore-operated Ca2+ entry, and Ca2+ store refilling. J. Biol. Chem. 278:44769–44779. [DOI] [PubMed] [Google Scholar]
- Maravall, M., Z. F. Mainen, B. L. Sabatini, and K. Svoboda. 2000. Estimating intracellular calcium concentrations and buffering without wavelength ratioing. Biophys. J. 78:2655–2667. [DOI] [PMC free article] [PubMed] [Google Scholar]
- McCormack, J. G., A. P. Halestrap, and R. M. Denton. 1990. Role of calcium ions in regulation of mammalian intramitochondrial metabolism. Physiol. Rev. 70:391–425. [DOI] [PubMed] [Google Scholar]
- Michelakis, E. D., V. Hampl, A. Nsair, X. Wu, G. Harry, A. Haromy, R. Gurtu, and S. L. Archer. 2002. Diversity in mitochondrial function explains differences in vascular oxygen sensing. Circ. Res. 90:1307–1315. [DOI] [PubMed] [Google Scholar]
- Monteith, G. R., and M. P. Blaustein. 1999. Heterogeneity of mitochondrial matrix free Ca2+: resolution of Ca2+ dynamics in individual mitochondria in situ. Am. J. Physiol. 276:C1193–C1204. [DOI] [PubMed] [Google Scholar]
- Montero, M., M. T. Alonso, E. Carnicero, I. Cuchillo-Ibanez, A. Albillos, A. G. Garcia, J. Garcia-Sancho, and J. Alvarez. 2000. Chromaffin-cell stimulation triggers fast millimolar mitochondrial Ca2+ transients that modulate secretion. Nat. Cell Biol. 2:57–61. [DOI] [PubMed] [Google Scholar]
- Naraghi, M., and E. Neher. 1997. Linearized buffered Ca2+ diffusion in microdomains and its implications for calculation of [Ca2+] at the mouth of a calcium channel. J. Neurosci. 17:6961–6973. [DOI] [PMC free article] [PubMed] [Google Scholar]
- Nicholls, D., and K. Akerman. 1982. Mitochondrial calcium transport. Biochim. Biophys. Acta. 683:57–88. [DOI] [PubMed] [Google Scholar]
- Novgorodov, S. A., T. I. Gudz, Y. M. Milgrom, and G. P. Brierley. 1992. The permeability transition in heart mitochondria is regulated synergistically by ADP and cyclosporin A. J. Biol. Chem. 267:16274–16282. [PubMed] [Google Scholar]
- Oseroff, A. R., D. Ohuoha, G. Ara, D. McAuliffe, J. Foley, and L. Cincotta. 1986. Intramitochondrial dyes allow selective in vitro photolysis of carcinoma cells. Proc. Natl. Acad. Sci. USA. 83:9729–9733. [DOI] [PMC free article] [PubMed] [Google Scholar]
- Pacher, P., P. Csordas, T. Schneider, and G. Hajnoczky. 2000. Quantification of calcium signal transmission from sarco-endoplasmic reticulum to the mitochondria. J. Physiol. 529:553–564. [DOI] [PMC free article] [PubMed] [Google Scholar]
- Palmer, J. W., B. Tandler, and C. L. Hoppel. 1977. Biochemical properties of subsarcolemmal and interfibrillar mitochondria isolated from rat cardiac muscle. J. Biol. Chem. 252:8731–8739. [PubMed] [Google Scholar]
- Park, M. K., M. C. Ashby, G. Erdemli, O. H. Petersen, and A. V. Tepikin. 2001. Perinuclear, perigranular and sub-plasmalemmal mitochondria have distinct functions in the regulation of cellular calcium transport. EMBO J. 20:1863–1874. [DOI] [PMC free article] [PubMed] [Google Scholar]
- Pavlov, P. F., and E. Glaser. 1998. Inhibition of protein import into mitochondria by amphiphilic cations: potential targets and mechanism of action. Biochem. Biophys. Res. Commun. 252:84–91. [DOI] [PubMed] [Google Scholar]
- Peppiatt, C. M., T. J. Collins, L. Mackenzie, S. J. Conway, A. B. Holmes, M. D. Bootman, M. J. Berridge, J. T. Seo, and H. L. Roderick. 2003. 2-Aminoethoxydiphenyl borate (2-APB) antagonises inositol 1,4,5-trisphosphate-induced calcium release, inhibits calcium pumps and has a use-dependent and slowly reversible action on store-operated calcium entry channels. Cell Calcium. 34:97–108. [DOI] [PubMed] [Google Scholar]
- Pitter, J. G., P. Maechler, C. B. Wollheim, and A. Spat. 2002. Mitochondria respond to Ca2+ already in the submicromolar range: correlation with redox state. Cell Calcium. 31:97–104. [DOI] [PubMed] [Google Scholar]
- Polster, B. M., G. Basanez, M. Young, M. Suzuki, and G. Fiskum. 2003. Inhibition of Bax-induced cytochrome-c release from neural cell and brain mitochondria by dibucaine and propranolol. J. Neurosci. 23:2735–2743. [DOI] [PMC free article] [PubMed] [Google Scholar]
- Rapizzi, E., P. Pinton, G. Szabadkai, M. R. Wieckowski, G. Vandecasteele, G. Baird, R. A. Tuft, K. E. Fogarty, and R. Rizzuto. 2002. Recombinant expression of the voltage-dependent anion channel enhances the transfer of Ca2+ microdomains to mitochondria. J. Cell Biol. 159:613–624. [DOI] [PMC free article] [PubMed] [Google Scholar]
- Rizzuto, R., M. Brini, M. Murgia, and T. Pozzan. 1993. Microdomains with high Ca2+ close to IP3-sensitive channels that are sensed by neighboring mitochondria. Science. 262:744–747. [DOI] [PubMed] [Google Scholar]
- Rizzuto, R., M. R. Duchen, and T. Pozzan. 2004. Flirting in little space: the ER/mitochondria Ca2+ liaison. Sci. STKE. 215:re1. (Review.) [DOI] [PubMed]
- Rizzuto, R., A. W. Simpson, M. Brini, and T. Pozzan. 1992. Rapid changes of mitochondrial Ca2+ revealed by specifically targeted recombinant aequorin. Nature. 358:325–327. [DOI] [PubMed] [Google Scholar]
- Rutter, G. A., and R. Rizzuto. 2000. Regulation of mitochondrial metabolism by ER Ca2+ release: an intimate connection. Trends Biochem. Sci. 25:215–221. [DOI] [PubMed] [Google Scholar]
- Savitzky, A., and M. Golay. 1964. Smoothing and differentiation of data by simplified least-squares procedures. Anal. Chem. 36:1627–1639. [DOI] [PubMed] [Google Scholar]
- Simpson, P. B., S. Mehotra, D. Langley, C. A. Sheppard, and J. T. Russell. 1998. Specialized distributions of mitochondria and endoplasmic reticulum proteins define Ca2+ wave amplification sites in cultured astrocytes. J. Neurosci. Res. 52:672–683. [DOI] [PubMed] [Google Scholar]
- Skulachev, V. P. 2001. Mitochondrial filaments and clusters as intracellular power-transmitting cables. Trends Biochem. Sci. 26:23–29. [DOI] [PubMed] [Google Scholar]
- Sokolove, P. M., and K. W. Kinnally. 1996. A mitochondrial signal peptide from Neurospora crassa increases the permeability of isolated rat liver mitochondria. Arch. Biochem. Biophys. 336:69–76. [DOI] [PubMed] [Google Scholar]
- Sun, X. P., N. Callamaras, J. S. Marchant, and I. Parker. 1998. A continuum of InsP3-mediated elementary Ca2+ signalling events in Xenopus oocytes. J. Physiol. 509:67–80. [DOI] [PMC free article] [PubMed] [Google Scholar]
- Thul, R., and M. Falcke. 2004. Release currents of IP3 receptor channel clusters and concentration profiles. Biophys. J. 86:2660–2673. [DOI] [PMC free article] [PubMed] [Google Scholar]
- Villalobos, C., L. Nunez, M. Montero, A. G. Garcia, M. T. Alonso, P. Chamero, J. Alvarez, and J. Garcia-Sancho. 2002. Redistribution of Ca2+ among cytosol and organella during stimulation of bovine chromaffin cells. FASEB J. 16:343–353. [DOI] [PubMed] [Google Scholar]
- Xu, T., M. Naraghi, H. Kang, and E. Neher. 1997. Kinetic studies of Ca2+ binding and Ca2+ clearance in the cytosol of adrenal chromaffin cells. Biophys. J. 73:532–545. [DOI] [PMC free article] [PubMed] [Google Scholar]
- Zoratti, M., and I. Szabo. 1995. The mitochondrial permeability transition. Biochim. Biophys. Acta. 1241:139–176. [DOI] [PubMed] [Google Scholar]
- Zorov, D. B., C. R. Filburn, L. O. Klotz, J. L. Zweier, and S. J. Sollott. 2000. Reactive oxygen species (ROS)-induced ROS release: a new phenomenon accompanying induction of the mitochondrial permeability transition in cardiac myocytes. J. Exp. Med. 192:1001–1014. [DOI] [PMC free article] [PubMed] [Google Scholar]
Associated Data
This section collects any data citations, data availability statements, or supplementary materials included in this article.