

Abstract
We achieved photon count rates per molecule as high as with commonly used confocal fluorescence correlation spectroscopy instruments using a new total internal reflection fluorescence correlation spectroscopy system based on an epi-illumination configuration.
Fluorescence correlation spectroscopy (FCS) (1) requires a particularly high photon countrate per molecule (cpm) and low background when employed to investigate single molecule dynamics. To fulfill this requirement, it is crucial to restrain the observation volume to the close proximity of the system under study. In this respect, the standard confocal detection scheme suffers from drawbacks when used to investigate dynamical processes of biomolecules attached to a surface (for example, ligand-receptor kinetics on cell surfaces or model membranes (2) and conformational changes of biomolecules (3; 4)) since the axial confinement of the confocal volume element is in general large compared to the axial extent of the attached biomolecule. Additionally, excitation light reflected at the surface contributes substantially to the background.
These drawbacks are circumvented in total internal reflection fluorescence correlation spectroscopy (TIR-FCS) (5), where the sample is excited by an evanescent field, generated by total internal reflection of a laser beam. TIR is typically obtained on the interface between a prism serving as a substrate for the system under study and an aqueous solution. The field intensity decays exponentially within the solution with increasing distance from the interface and drops to 1/e of its value after typically < 200 nm. This axial extend of the detection volume is substantially smaller than in the case of confocal FCS, where it is generally on the order of 1.5 μm. Fluorescence is detected from above the prism by means of a microscope and a single photon avalanche diode (SPAD). An aperture or pinhole in the intermediate image plane of the microscope assures lateral confinement of the detection volume element.
TIR-FCS has been applied successfully to investigate a number of different phenomena as, for example, ligand-receptor binding on membranes (6) and surface binding of biomolecules to silica surfaces (7), but little work has been done to further improve sensitivity of TIR-FCS (8). Nonetheless, a high sensitivity, especially high cpm, are crucial for single molecule applications, and increasing them to values obtained in confocal FCS would considerably augment the number of possible applications (9).
We have developed a TIR-FCS system and obtained cpm values comparable to those achieved with a common confocal FCS system. In contrast to the above described prism-based TIR-FCS setup, we adapted an objective-based total internal reflection fluorescence (TIRF) system (10), which makes use of an epi-illumination configuration to excite and detect fluorescence (see Fig. 1). Here, the beam of an argon ion laser (model 2214-25ML, Cyonics, Sunnyvale, CA) is focused onto the back focal plane (bfp) of an oil-immersion objective (α-Plan-Fluar, 1.45 NA, 100×, Carl Zeiss Jena GmbH, Jena, Germany) residing in an inverted microscope (IX70, Olympus, Tokyo, Japan). The location of the focal spot within the bfp determines the inclination angle under which the collimated beam impinges on the upper surface of a microscope slide. By tilting the glass plate, the location of the spot is adjusted to satisfy the condition for total internal reflection. The fluorescence emission is collected by the same objective, focused to a multi-mode fiber with a 50 μm diameter core, serving as a pinhole and finally detected by a SPAD (SPCM-AQR-13-FC, PerkinElmer, Wellesley, MA).
FIGURE 1 .

Schematic of setup for objective type TIR-FCS. The laser beam is enlarged and collimated through the telescope formed by lenses L1 and L2. Lens L3 focuses the beam at the bfp of the objective. GP, glass plate; F1, F2, filter; D, dichroic mirror; Obj, microscope objective; L1–L4, lenses.
With respect to the classical prism-based TIR-FCS scheme, this approach has several advantages. Most important, as the sample of interest is situated directly on the microscope slide, all light that is emitted in the lower half space and not reflected is collected by the high NA objective. Therefore, we expect a significant higher value of counts per molecule compared to a prism-based setup. Further, once the setup is properly aligned, it is very stable and samples can be exchanged easily. Compared to confocal FCS, a smaller portion of the reflected laser light reaches the detector. This is because the back-reflected laser beam is collimated and therefore not focused onto the pinhole.
To show the described advantages, diffusion of carboxy fluorescein in aqueous solution was measured within the evanescent field. To fit the autocorrelation data, a mathematical model based on the theoretical description by Starr and Thompson (11) was adapted (Eq. 1). An approximation disregarding binding to the surface could be used since fluorescein is negatively charged and therefore almost not subject to unspecific binding to the glass surface. Whereas in Starr and Thompson the influence of transversal diffusion has been neglected, it is necessary to take this into account in our case, since the observation volume was laterally restricted by introducing a pinhole. We used a Gauss function to model the lateral intensity distribution and an exponential decay in axial direction. Furthermore, our model contains a term accounting for triplet state kinetics to meet the experimental conditions and to fit the data more accurately. With these modifications, the correlation function reads
 |
(1) |
N is the number of molecules in an effective volume defined by  where ωxy is the lateral extend of the Gaussian intensity distribution and d is the distance from the surface where the intensity decreases by a factor 1/e. The diffusion times are τz ≡ d2/(4D) and
  for the axial diffusion and diffusion parallel to the surface, respectively. D denotes the diffusion constant. The triplet state decay time is given by τt, and p is the average fraction of molecules in the effective volume that are in the triplet state. w is the complex generalization of the error function, w(x) ≡ exp(−x2)erfc(−ix). As in confocal FCS without regarding triplet state kinetics, the amplitude of the correlation function (after the subtraction of 1) is inversely proportional to the number of molecules in the detection volume element Veff:
 |
Measurements were performed on droplets containing carboxy fluorescein in TRIS buffer (pH 8) deposited on microscope coverslides. cpm values as high as 34 kHz could be achieved. Fig. 2 shows a typical example for an autocorrelation curve obtained with our setup. The overall background was ∼6.1 kHz for TIR-FCS. The axial diffusion time was on the order of 15 μs, for an evanescent field depth of ∼200 nm. This implies a diffusion constant of D = 7 × 10⁻⁶ cm2 s−1 for fluorescein, which is in agreement with values measured in previous work (12).
FIGURE 2 .
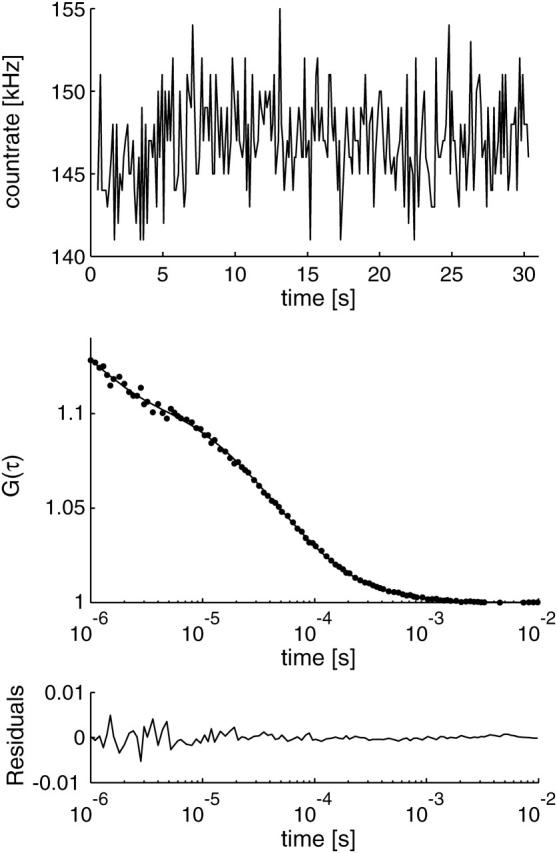
Time trace and correlation curve obtained with the proposed setup, curve fit according to Eq. 1. cpm = 33 kHz, N = 4.4, τz = 12.9 μs, p = 29%, τt = 1.1 μs, and d/ωxy = 0.4 (fixed parameter).
Similar values could be obtained with our TIR-FCS setup when working in confocal FCS mode. This is possible by removing the glass plate, the focusing lens L3, and using an appropriate water-immersion objective. In this configuration, we obtained for measurements on the surface comparable cpm values (maximum 38 kHz). The background, however, was >2 times higher (14 kHz) than obtained for TIR-FCS.
In conclusion, we presented an effective, stable, and practically simple TIR-FCS system, which allows measurements to be performed with surprisingly high cpm values. This work, thereby, opens the way for TIR-FCS to be used in applications where a high signal/noise ratio is crucial.
Acknowledgments
We thank Carl Zeiss Jena GmbH for providing us with the α-Plan-Fluar objective.
References
- (1).Rigler, R., and E. L. Elson. 2001. Fluorescence Correlation Spectroscopy: Theory and Applications. Berlin, Springer.
- (2).Auer, M., K. J. Moore, F. J. Meyer-Almes, R. Guenther, A. J. Pope, and K. A. Stoeckli. 1998. Fluorescence correlation spectroscopy: lead discovery by miniaturized HTS. Drug Discov. Today. 3:457–465. [Google Scholar]
- (3).Jia, Y. W., A. Sytnik, L. Q. Li, S. Vladimirov, B. S. Cooperman, and R. M. Hochstrasser. 1997. Nonexponential kinetics of a single tRNA(Phe) molecule under physiological conditions. Proc. Natl. Acad. Sci. USA. 94:7932–7936. [DOI] [PMC free article] [PubMed] [Google Scholar]
- (4).Edman, L., U. Mets, and R. Rigler. 1996. Conformational transitions monitored for single molecules in solution. Proc. Natl. Acad. Sci. USA. 93:6710–6715. [DOI] [PMC free article] [PubMed] [Google Scholar]
- (5).Thompson, N. L., T. P. Burghardt, and D. Axelrod. 1981. Measuring surface dynamics of biomolecules by total internal-reflection fluorescence with photobleaching recovery or correlation spectroscopy. Biophys. J. 33:435–454. [DOI] [PMC free article] [PubMed] [Google Scholar]
- (6).Lieto, A. M., R. C. Cush, and N. L. Thompson. 2003. Ligand-receptor kinetics measured by total internal reflection with fluorescence correlation spectroscopy. Biophys. J. 85:3294–3302. [DOI] [PMC free article] [PubMed] [Google Scholar]
- (7).Hansen, R. L., and J. M. Harris. 1998. Measuring reversible adsorption kinetics of small molecules at solid/liquid interfaces by total internal reflection fluorescence correlation spectroscopy. Anal. Chem. 70:4247–4256. [DOI] [PubMed] [Google Scholar]
- (8).Ruckstuhl, T., and S. Seeger. 2004. Attoliter detection volumes by confocal total-internal-reflection fluorescence microscopy. Opt. Lett. 29:569–571. [DOI] [PubMed] [Google Scholar]
- (9).Schwille, P. 2003. TIR-FCS: staying on the surface can sometimes be better. Biophys. J. 85:2783–2784. [DOI] [PMC free article] [PubMed] [Google Scholar]
- (10).Axelrod, D. 2001. Total internal reflection fluorescence microscopy in cell biology. Traffic. 2:764–774. [DOI] [PubMed] [Google Scholar]
- (11).Starr, T. E., and N. L. Thompson. 2001. Total internal reflection with fluorescence correlation spectroscopy: combined combined surface reaction and solution diffusion. Biophys. J. 80:1575–1584. [DOI] [PMC free article] [PubMed] [Google Scholar]
- (12).Culbertson, C. T., S. C. Jacobson, and J. M. Ramsey. 2002. Diffusion coefficient measurements in microfluidic devices. Talanta. 56:365–373. [DOI] [PubMed] [Google Scholar]