Abstract
In this work we show that ligand migration and active site conformational relaxation can occur independently of each other in hemoproteins. The complicated kinetics of carbon monoxide rebinding with cytochrome P450cam display up to five distinct processes between 77 K and 300 K. They were disentangled by using a combination of three approaches: 1), the competition of the ligand with xenon for the occupation of internal protein cavities; 2), the modulation of the amount of distal steric hindrance within the heme pocket by varying the nature of the substrate; and 3), molecular mechanics calculations to support the proposed heme-substrate relaxation mechanism and to seek internal cavities. In cytochrome P450cam, active site conformational relaxation results from the displacement of the substrate toward the heme center upon photodissociation of the ligand. It is responsible for the long, puzzling bimodal nature of the rebinding kinetics observed down to 77 K. The relaxation rate is strongly substrate-dependent. Ligand migration is slower and is observed only above 135 K. Migration and return rates are independent of the substrate.
INTRODUCTION
Photodissociation of heme-ligand complexes has long been recognized as the tool best-suited for probing the basic addition reaction of ligands to hemoproteins. Because the reactants are generated in situ, their geminate-rebinding reaction can be studied down to very low temperature when the protein is embedded in a solid hydro-organic glassy solvent in which external diffusion is impossible.
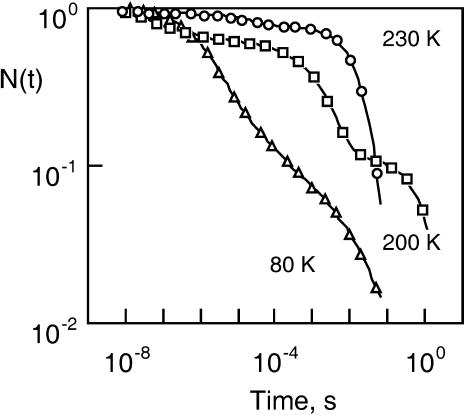
The first major breakthrough was the finding by Frauenfelder and co-workers (Austin et al., 1975) that the geminate-rebinding of myoglobin (Mb) and carbon monoxide (CO), although exponential at ordinary temperature, became highly nonexponential at low temperature (T < 100 K), providing evidence for the trapping of a large number of protein statistical conformational substates (CS). Conformational fluctuations are able to drive a protein structure toward rare, short-lived conformations reacting at widely different rates. Upon freezing the protein ensemble, the statistical heterogeneity of protein substates gives rise to polychromatic kinetics encompassing several orders-of-magnitude in time (see examples in Fig. 1). The general concept of statistical substates was subsequently confirmed with other, non-heme proteins such as hemerythrin (Lavalette and Tetreau, 1988) and azurin (Ehrenstein and Nienhaus, 1992).
FIGURE 1.
Example of the kinetic heterogeneity and of the so-called inverse temperature dependence as observed in ligand rebinding with many hemoproteins. The data refer to CO rebinding with cytochrome P450cam and camphane as a substrate. N(t) is the normalized survival fraction of un-rebound CO. The solvent was glycerol/water (64% w/w). For clarity, only a few points per time decade are shown. The lines are the fits obtained by using the maximum entropy method. The corresponding rate spectra are given in Fig. 11.
Another feature of the myoglobin-ligand system was the finding that the overall rebinding reaction seems to become slower when temperature is increased (Steinbach et al., 1991) (example also shown in Fig. 1). For more than two decades a number of structural and/or theoretical models were invoked to account for this puzzling inverse temperature dependence, but only recently did new experimental data provide a conclusive explanation. The kinetics do not actually slow down, but a new and slower kinetic process appears upon raising the temperature: the ligand migrates among protein cavities before rebinding.
To reach this conclusion, two further improvements were necessary. The first one consisted of working with the rate spectrum of the polychromatic kinetics rather than fitting the data to some arbitrarily predefined kinetic scheme. The rate spectrum is the distribution of all rate parameters present in the protein ensemble, assuming that the ensemble kinetics is the sum of single exponential reactions within individual statistical substates. Specific processes can be identified and quantified directly from the rate spectrum without the need for an a priori or ad hoc kinetic model (Lavalette et al., 1991; Steinbach et al., 1991).
The second improvement made was in the use of xenon gas as a soft, external perturbing agent (Brunori et al., 1999; Nienhaus et al., 2003a,b; Scott and Gibson, 1997; Scott et al., 2001; Tetreau et al., 2004). The idea that xenon might possibly compete with ligands for the occupation of protein cavities was first put forward by Scott and Gibson (1997), who showed that MbO2 rebinding kinetics were affected by xenon at room temperature. Recently, we have explored ligand migration in Mb in great detail, by investigating the rebinding kinetics of MbO2 and MbCO under a wide range of xenon pressures and temperatures (Tetreau et al., 2004). Above 200 K the ligand normally migrates to a secondary docking site situated on the proximal heme side (Xe1 site) before rebinding. When the latter is occupied by xenon a new kinetic process appears, because rebinding must now occur from transient docking sites (Xe4 and Xe2) located on the path between the primary and the secondary docking sites of the ligand. Similar conclusions have been reported using Fourier-transform infrared and temperature-derivative spectroscopies, together with kinetic infrared measurements on Mb and mutants (Nienhaus et al., 2003a,b). These two sets of experiments constitute kinetic counterparts of structural data obtained with trapped intermediates (Brunori, 2000; Chu et al., 2000; Hartmann et al., 1996; Ostermann et al., 2000; Schlichting et al., 1994; Teng et al., 1994, 1997) or with time-resolved x-ray crystallography (Bourgeois et al., 2003; Schotte et al., 2003; Srajer et al., 1996, 2001).
At the same time several groups were trying to map the ligand migration pathway by determining the rate of geminate rebinding of NO, CO, or O2 in Mb mutated at critical positions near the heme pocket or near the xenon-binding cavities (Brunori et al., 1999; Carlson et al., 1994, 1996; Dantsker et al., 2002; Draghi et al., 2002; Gibson et al., 1992; Ishikawa et al., 2001; Quillin et al., 1995; Scott and Gibson, 1997; Scott et al., 2001). Molecular dynamics simulations supported the experimental findings and predicted ligand trajectories which were later observed directly by time-resolved x-ray crystallography (Brunori et al., 1999; Carlson et al., 1994, 1996; Gibson et al., 1992; Li et al., 1993; Quillin et al., 1995; Scott and Gibson, 1997; Scott et al., 2001).
Thus, all approaches are converging toward a consistent description of ligand migration in myoglobin. The ligand does not diffuse randomly but moves along preferred pathways toward well-defined protein cavities. Myoglobin is, however, a simple protein whose only function is to bind and store oxygen. Other hemoproteins, performing catalytic functions, such as cytochromes P450, bind a substrate in the heme pocket in addition to the natural oxygen ligand. It is therefore not surprising that they were found to display even more complex kinetics than does myoglobin. An inverse temperature dependence was also observed with cytochrome P450cam (Tetreau et al., 2000), but it was tentatively attributed to a structural rearrangement of the substrate leading to a more crowded access to the heme. In addition, cytochrome P450cam as well as P450SCC, P450LM2 (Tetreau et al., 1997), and NO synthase (Tetreau et al., 1999), all display a bimodal rate spectrum and enthalpy distribution at very low temperature. This was attributed to the presence of two distinct populations of statistical substates in thiolate-coordinated hemoproteins. However, the structural origin of these subpopulations has remained elusive up to now.
Ligand migration on the one hand and heme pocket conformational relaxation on the other hand, were documented in myoglobin and cytochrome P450cam, respectively. Although the possibility that they may occur jointly within the same protein is real, it is in practice almost impossible to discriminate between ligand migration and conformational relaxation because their kinetic signature is virtually the same (see Tetreau et al., 2000 and Materials and Methods, below). Fortunately, kinetic experiments in the presence of xenon provide an adequate means to overcome the difficulty, because any kinetic change reveals a ligand migration process (Scott and Gibson, 1997).
In this work, we have revisited the kinetics of CO rebinding with cytochrome P450cam. We show that ligand migration and substrate relaxation indeed occur jointly, but as independent processes. They were sorted out by using a combination of three approaches:
The kinetic competition with xenon that proved so efficient with myoglobin.
The modulation of the amount of distal steric hindrance by varying the nature of the substrate.
Molecular mechanics (MM) calculations to address the issues of the relaxation mechanism and of the presence of internal cavities.
The new data lead to a confirmation of substrate relaxation and to a reassignment of the various kinetic processes to also include ligand migration.
MATERIALS AND METHODS
Sample preparation and data collection
Recombinant cytochrome P450cam (CYP101) was prepared as previously described (Unger et al., 1986). The substrate-free form of the protein was obtained by filtration through a Sephadex G-25 column (Amersham, Piscataway, NJ). The substrate was added to the substrate-free protein in a few microliters of an ethanolic stock solution (700 mM). A final substrate concentration of 10–30 mM was sufficient for complete saturation of the protein.
The required amount of cytochrome P450cam was diluted with glycerol, buffer, and water. The final protein concentration was 10–15 μM in 50 mM Tris buffer pH 7. The proportion of glycerol was 64% (w/w) (Tg ≈ 159 K) for cytochrome P450cam complexed with camphane, camphor-quinone, and norbornane; for the camphor, 1S-camphor, adamantane, adamantanone, and norcamphor complexes, measurements were performed in glycerol 64% (w/w) and 79% (Tg ≈ 173 K).
The ferrous (CO)-complexes were prepared by passing a stream of CO above the protein solution submitted to gentle stirring, and by adding a few microliters of a concentrated, de-aerated dithionite solution. The reduced complexes were obtained within a few minutes. Reduction and CO binding were controlled by following the absorption change of the solution.
The method for equilibrating the solution with the xenon pressure has been described in detail (Tetreau et al., 2004) and will be only briefly summarized here. Xenon was introduced over the protein solution placed in homebuilt cylindrical optical cells withstanding up to 20 atm pressure. The pressure system allowed for flushing with various gases to achieve the assigned partial pressure of xenon and gaseous ligands. The liquid phase was equilibrated with the gas mixtures at 20°C for at least 5 h under gentle stirring with a small magnetic bar. After equilibration the absorption spectrum was controlled, and the amount of cytochrome P420cam, which was initially ∼4–5%, remained <10%. Although the xenon pressure decreased approximately threefold upon cooling, re-equilibration of the dissolved gases due to pressure change or to change of solubility with temperature is not expected to occur over the duration of the experiments, owing to the very high viscosity of the cold glycerol/water solvent. The solubility of xenon at room temperature was taken as 4.4 mM/atm in water (Rubin et al., 2002), and 1.1 mM/atm in 79% glycerol, assuming a reduction factor of the solubility due to the presence of 79% glycerol similar to that measured for O2 (Lavalette and Tetreau, 1988).
Rebinding kinetics were recorded at 10–20 K intervals. The cooling rate was ∼2 K/min at T ≫ Tg and 0.5 K/mn at ∼Tg and below. The protein was allowed to equilibrate for an additional 15 min after the desired temperature was reached. Photodissociation was achieved by the 10-ns pulse of the second harmonic (532 nm) of a Q-switched Nd-YAG laser (Quantel, Les Ulis, France). Transient absorption changes were recorded over two decades in amplitude and 6–7 decades in time using our fast kinetic spectrometer setup (Tetreau et al., 1997). The kinetics were determined at low spectral resolution in the Soret absorption band of the de-liganded (penta-coordinated heme) species between 293 and 77 K (Tetreau et al., 2002).
Kinetic background
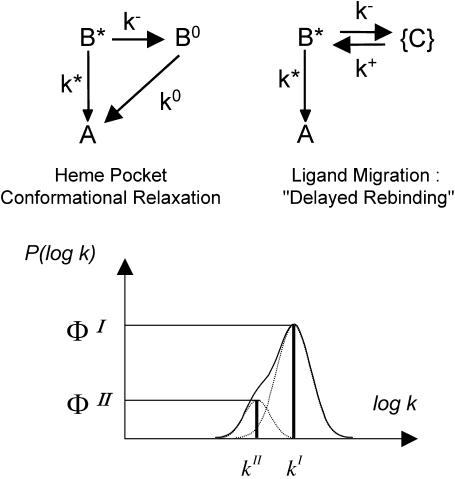
For purely geminate processes (i.e., when no ligand escapes the protein), relaxation and migration are described by a parallel and a sequential kinetic scheme, respectively (Fig. 2). For nondistributed systems (i.e., in the absence of statistical substates), both processes display very similar kinetics (Tetreau et al., 2000). The survival function, N(t), of ligands that have not re-bound is biexponential,
 |
(1) |
with amplitudes and rates given by
 |
(2) |
 |
(3) |
 |
(4) |
 |
(5) |
Only the expression for kII differs as
 |
(6) |
for relaxation, and
 |
(7) |
for migration.
FIGURE 2.
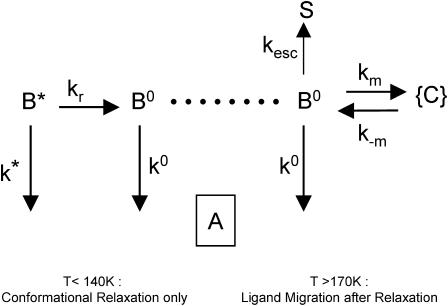
(Top) The elementary kinetic schemes for heme-substrate relaxation and ligand migration in the absence of ligand escape. Only kinetically distinguishable states are shown. (State A) Ligand bound to the heme, substrate in position 1. (State B*) Ligand in primary docking site, substrate still in position 1. (State B°) Ligand in primary docking site, substrate relaxed to position 2. (States {C}) Collection of secondary docking sites. (Bottom) The two-line rate spectrum obtained by analytically solving either system. The band envelopes show a possible spectrum when the system is distributed because of protein statistical conformational substates.
Equations 1–7 show that the only kinetic difference arises from the composite nature of kII in the migration process that might, in principle, lead to some curvature in the Arrhenius plot of this rate parameter. However, except perhaps for particularly favorable situations, the curvature may be quite difficult to assess from experiment, rendering conclusions ambiguous and uncertain. In contrast, the great advantage of kinetic experiments in the presence of xenon is to provide unambiguous evidence for the occurrence of ligand migration processes.
Below Tg, i.e., when the protein statistical substates (and therefore all associated rates) are distributed, the rate spectrum displays two broad bands instead of two lines (Fig. 2). Kinetic equations are meaningful only for kinetic states corresponding to the same CS, but there is unfortunately no way to identify particular CS substates in a broad distribution. We have previously shown that one unique CS maximizes all P(log k) distributions in which it is involved. As a consequence, kinetic equations (Eqs. 1–7) are valid for the peak values of each individual distribution (Tetreau et al., 2000).
For a kinetically heterogeneous and non-equilibrium ensemble the distribution of rebinding rates P(log k) reflects the distribution of statistical substates. This is because rebinding rates are connected with enthalpy by the Eyring relation
 |
(8) |
with T0 = 100 K and because activation enthalpy itself is sensitive to structural parameters. The enthalpy distribution P(H,Tg) of the frozen ensemble of substates is thus invariant at T < Tg. For an elementary process the change of the rate spectrum with temperature is entirely due to the Arrhenius dependence.
At T ≫ Tg, the ensemble remains thermodynamically heterogeneous and P(H,T) varies with temperature. But because of kinetic averaging a strong spectral narrowing occurs, meaning that the kinetic processes become simply exponential. However, the apparent rate parameter is the statistical average of the rate parameters of all CS substates implied in the process (for details, see Tetreau et al., 2004).
Distribution of rate parameters
Geminate rebinding is a first-order process. Bimolecular rebinding is a second-order process but, at the ligand concentrations used here, pseudo first-order conditions are fulfilled. Independently of the underlying physical processes, kinetically heterogeneous systems rebind according to the survival function
 |
(9) |
We obtain the rate spectrum, P(log k), from the observed kinetics N(t), by Laplace inversion of Eq. 9 using the maximum entropy method starting from a set of logarithmically spaced and equiprobable k-values (Lavalette et al., 1991; Steinbach et al., 1991). Methodological details can be found in Tetreau et al., 1997.
Analyzing rate spectra
The effect of xenon upon the various kinetic processes were quantified in the temperature range where it was possible to observe the fast and slow geminate rebinding bands simultaneously. To this end, the rate distributions PT(log k) at each temperature T were fitted with a sum of log-normal components,
 |
(10) |
assuming that only the relative amplitudes of the various rate processes change with xenon pressure. To increase accuracy, P(log k) was averaged by repeating at least 2–3 experiments at fixed xenon pressure and temperature. A global Gaussian fit of the series of the average rate spectra obtained at different xenon pressures and constant temperature was finally performed according to Eq. 10.
Molecular mechanics simulations
Energy-minimized structures
Energy minimization was performed for the penta-FeII and hexa-FeII(CO) forms of cytochrome P450cam complexed with either camphor or norcamphor. All calculations started using the coordinates of the FeII P450cam(cam)(CO) complex were taken from the Protein Data Bank (PDB entry 3CPP, Raag and Poulos, 1989). For the penta-coordinated species, CO was removed and for the norcamphor studies, camphor was replaced by norcamphor. The polypeptide chain consisted of residues 10–414 and did not contain coordinates for the first nine amino acids. An acetyl group was added to the residue 10 of the N-terminal part to avoid the artificial introduction of a positive charge on residue 10. Hydrogen atoms were added to the structures; only polar hydrogens were considered explicitly for the polypeptide chain using parameter set CHARMM/QUANTA No. 20, whereas all hydrogen atoms were introduced for the heme group for which we used parameter set 22 of CHARMM. For camphor and norcamphor the parameters were obtained from the XPLO-2D program (Kleywegt and Jones, 1997) and the partial charges of camphor were taken from Helms and Wade (1997). A switch function between 5 and 9 Å was used to truncate the electrostatic and van der Waals interactions. The dielectric constant was taken equal to the distance separating the charges.
The four structures were energy-minimized using the CHARMM program (Brooks et al., 1983); the method of steepest descent was applied for 1600 iterations; in the first 600 steps, mass-weighted harmonic constraints were applied to the system to prevent abrupt deviations from the crystal structure. The harmonic force constant was decreased every 100 steps taking the successive values of 250, 100, 50, 25, 10, and 5 kcal/mol/Å2. The structures were further energy-minimized without harmonic constraints using the conjugate gradients method for 10,000 steps followed by the adopted-basis Newton-Raphson method until it reached an energy gradient smaller than 10−4 kcal/mol/Å.
Calculations of protein cavities
The internal cavities of the minimized structure of the cytochrome P450cam(cam)(CO) complex were calculated using the software Alpha Shapes (Liang et al., 1998a,b). A homebuilt software was used to visualize the cavities. It consisted of filling the empty space of cavities with hydrogen atoms and drawing the surface contour of the H atoms.
RESULTS
Camphor complex of cytochrome P450CAM
CO rebinding
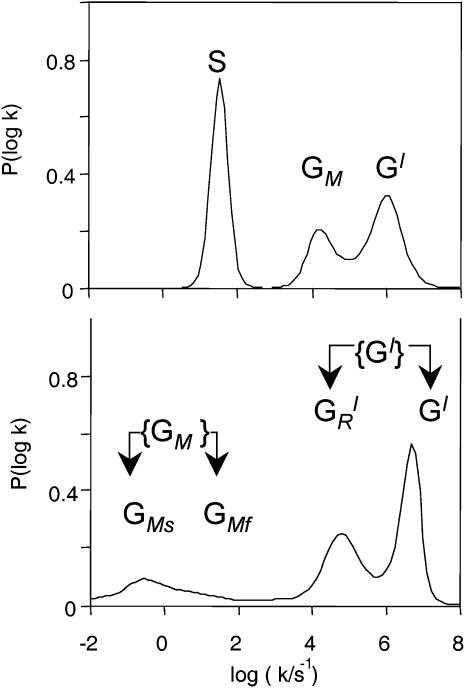
When they are displayed as rate spectra, the low temperature inhomogeneous kinetics exhibit a complex pattern, in which a total of five different processes can be identified (Tetreau et al., 2000). For practical purposes, the shorthand notation depicted in Fig. 3 will be used throughout. It is derived from the comparison of the P450cam(cam) (CO) rate spectra with those, previously established, of MbCO. The Mb rate spectrum consists of three bands: GI, GM, and S, respectively corresponding to direct geminate rebinding from the primary site, delayed geminate rebinding after ligand migration, and bimolecular rebinding from the solvent of ligands that have escaped the protein. In P450cam the geminate processes appear as two composite groups of bands: {GI} and {GM}. We shall show that group {GI} corresponds to rebinding from the primary site before (GI) and after  conformational relaxation of the camphor substrate, respectively. Similarly group {GM} will be shown to result from delayed rebinding after ligand migration; it consists of two components, denoted GMF (fast) and GMS (slow). These definitions will be justified in the sequel. Note that superscripts represent ligand sites (if known) and subscripts refer to processes.
FIGURE 3.
Denoting groups of bands in the rate spectrum. (Top) MbCO (250 K); (bottom) P450cam(CO)(cam) (150 K).
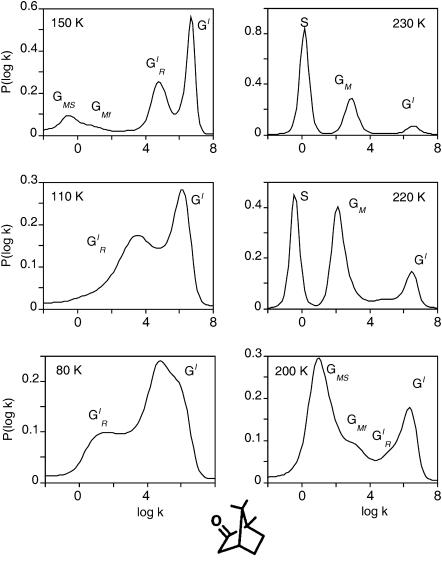
The temperature dependence of the kinetics is quite complex (Fig. 4):
Below 130 K the bimodal rate distribution {GI} consists of two large bands, GI and
 A Gaussian decomposition reveals that the relative proportions of the bands areas change from 2/1 to 1/2 between 80 and 110 K. This kinetic heterogeneity has been previously attributed to the re-equilibration of two different subsets of conformational substates of unknown origin (Tetreau et al., 1997). Because of the Arrhenius temperature-dependence the rate spectrum becomes progressively narrower and shifts to faster rates between 77 and 130–140 K.
Above 130–140 K, another group {GM} of slower rates appears and grows at the expense of {GI} upon increasing the temperature. {GM} is distributed and its shape also suggests the presence of two overlapping components GMF and GMS. Bands {GM} are responsible for the apparent slowing down and inverse temperature-dependence of the overall kinetics.
Above 200 K, the bimolecular process S appears, providing evidence that equilibrium fluctuations have set in and allow escape of CO into the solvent. Process S grows at the expense of the geminate processes upon raising the temperature. At room temperature S becomes predominant and the relative yield of CO escape becomes equal to unity. Because equilibrium fluctuations have set in above 200 K, kinetic averaging among CS is observed.
FIGURE 4.
Normalized rate spectra for CO rebinding with P450cam(cam). S denotes the solvent process. The (GI) bands are attributed to the fast geminate processes that occur before migration, either before (GI) or after ( ) substrate relaxation. The {GM} bands correspond to the slow geminate processes occurring after ligand migration toward one (GMF) or another (GMS) of the secondary docking sites, as discussed in the text. Temperature increases from bottom to top and from left to right.
The {GM} processes are due to ligand migration
CO rebinding in the presence of xenon.
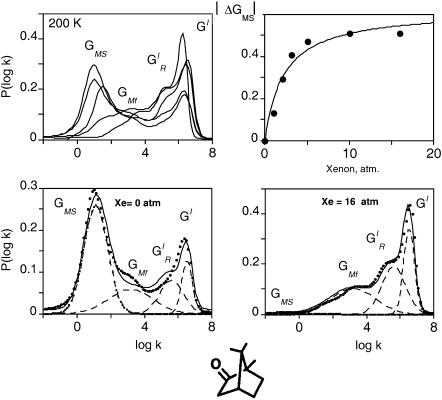
CO rebinding with cytochrome P450cam(cam) was recorded in the presence of xenon at pressures up to 16 atm and in a wide range of temperatures. Fig. 5 displays rate spectra obtained at a temperature at which the four geminate bands could be observed simultaneously with sufficient amplitude. The kinetic changes brought about by xenon are immediately apparent: the shape of the rate spectrum changes smoothly upon increasing Xe pressure, bands GI,  and GMF growing at the expense of the slower band GMS. Above 5 atm of xenon the proportion of band GMF also starts decreasing.
FIGURE 5.
(Top left) Normalized P(log k) rate spectra (200 K) for CO rebinding with cytochrome P450cam(cam) at pH 7.0 under xenon pressures: 0, 1, 2, 5, and 16 atm. (Bottom) Global Gaussian fits of the rate spectra in the absence (left) and in the presence (right) of 16 atm of xenon. The points correspond to the P(log k) distributions calculated from the kinetics using the maximum entropy method and the solid lines to the fits. (Top right) Titration curve of the decrease of the area of band GMS. Solvent was glycerol/water 79% (w/w).
The perturbation of the rebinding kinetics by xenon provides evidence that the {GM} rates correspond to rebinding of the CO ligand from at least one protein internal cavity whose access is forbidden when it becomes occupied by xenon. The xenon effect was quantified by fitting globally to a sum of Gaussians all rate spectra recorded at one given temperature under different xenon pressures. Assuming that xenon binding only affects the relative amplitude of the kinetic processes but not their peak position (Tetreau et al., 2004), the data were tentatively fitted with four or five Gaussians, but only the four-Gaussian hypothesis led to a good hyperbolic titration curve for the decrease of the area of band GMS (Fig. 5, top right).
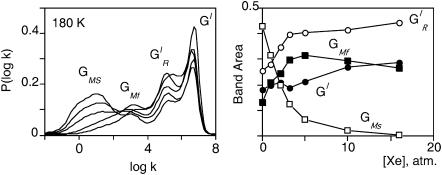
The continuous decrease of GMS upon increasing xenon pressure indicates that this band must be attributed to CO rebinding from a secondary docking site situated in a cavity that may be occupied by xenon. Saturating this site with xenon gas results in the progressive disappearance of the delayed rebinding band GMS and in a concomitant increase of the amplitude of all three other kinetic processes. The titration curve of the decrease of the GMS band area reflects xenon binding with an affinity constant Kxe = 455 M−1 at 180 K, which is of a comparable order of magnitude to that previously determined for the Xe1 binding site of Mb (K = 470 M−1 at 230 K) (Tetreau et al., 2004). Whereas the amplitude of  and GI continues to increase up to the highest Xe pressures, that of band GMF starts decreasing at pressures higher than 5 atm (Fig. 6). This suggests that this band must be assigned to rebinding from a further secondary docking site corresponding to another cavity with a smaller affinity for xenon. Since GMF does not decrease immediately upon adding xenon, access to the relevant cavity is independent of a prior access to the cavity responsible for GMS. Thus both docking sites must either lie on parallel pathways or, if situated on the same pathway, the one with the greater xenon affinity and responsible for GMS must be at the end of the sequence.
FIGURE 6.
(Left) Normalized P(log k) rate spectra (180 K) for CO rebinding with cytochrome P450cam(cam) at pH 7.0 under xenon pressures: 0, 1, 2, 5 and 16 atm. (Right) Proportions of the four geminate rebinding components according to xenon pressure calculated using a four-Gaussian global fit of all rate spectra. (GI, solid circles;  open circles; GMF, solid squares; and GMS, open squares.)
Cavities in cytochrome P450cam
Protein cavities can be permanent or transient, forming as a result of atomic fluctuations. Only the former can be characterized in the crystal or in the energy-minimized structure using algorithms in which a solvent molecule is rolled around the van der Waals surface defined by the space-filling diagram of the protein. For instance, the ligand docking and xenon binding sites in Mb correspond to permanent cavities (Tilton et al., 1984) with volume ranging from ∼50 A3 to 144 A3 (Liang et al., 1998b).
But contrary to myoglobin, nothing is known yet about xenon binding, or even about cavities in cytochrome P450cam. The kinetic data provide evidence for the presence of xenon-binding cavities located at a distance sufficiently close to the heme pocket to be efficiently populated by ligand migration after photodissociation. At least one of them is large enough to accommodate, with a relatively high affinity, a xenon atom with a van der Waals radius of 2.05 Å.
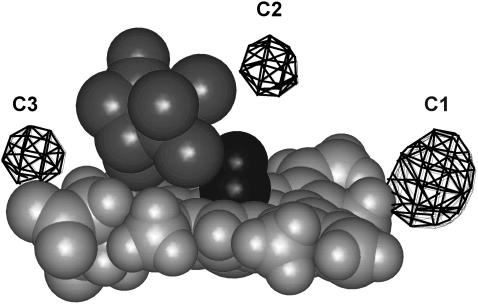
We have searched for cavities in the minimized structure of cytochrome P450cam(cam)(CO) using the Alpha Shapes software. A total of 13 cavities were identified. Five are too small to contain even a hydrogen atom. The remaining eight were visualized using a homebuilt software based on the filling of the voids by hydrogen atoms (Fig. 7). The largest cavity, C1 (volume ≈ 66.5 Å3), is located near the heme edge on the side of pyrrole C between the two vinyls, at a distance of 9.7 Å from the iron. Its surrounding residues are Pro159, Ile162, Phe163, Leu166, Gly249, Val253, Leu362, and Glu366. Although its size is sufficient for accommodating a xenon atom, C1 is occupied by three water molecules that have been found in the crystal structures of all P450cam forms investigated so far (Poulos et al., 1987; Raag and Poulos, 1989; Schlichting et al., 2000) and that are likely to be implied in the catalytic activity (Schlichting et al., 2000). Among the other cavities shown in Fig. 7, C2 or C3 are not too far away from the iron (7.7 for C2 and 9.1 Å for C3) but their volume, ∼40 Å3, is even smaller than that of Xe1 in Mb. All other cavities are located at a distance larger than 14 Å. Thus, in P450cam it might be relevant to investigate more closely the possibility of dynamic cavities. We are currently performing MD simulations to further address the question of cavity dynamics and to examine what could be the CO migration pathways toward the secondary docking site(s) in cytochrome P450cam.
FIGURE 7.
View of the three cavities closest to the heme calculated in the energy-minimized structure of (FeII) cytochrome P450cam (cam) (CO). Cavity C1 is much bigger than all others but is occupied by three water molecules. Except for C1–C3, all other cavities are located at a distance of 14–20 Å of the iron atom.
{GI} processes are bimodal because of substrate conformational relaxation
The use of xenon has thus provided a clear discrimination between {GI} and {GM} groups of bands. In the absence of this new and decisive information, the {GM} bands had been previously attributed tentatively to CO rebinding after the conformational relaxation of the active site of P450cam (Tetreau et al., 2000). This view must be revised, since the present data unambiguously show that GMS and GMF correspond to CO rebinding after migration inside the protein, toward cavities farther away from the active site.
The bimodal nature of the {GI} processes, also observed in cytochromes P450SCC, P450LM2 (Tetreau et al., 1997), and NO synthase (Tetreau et al., 1999) has remained a puzzle. We previously pointed out that it implies the presence of two subsets of conformers that must be closely related to permit thermal equilibration in a highly rigid medium at very low temperature. However, their structural origin has remained elusive until present.
Here we show that the previously hypothesized substrate conformational relaxation does indeed take place in addition to ligand migration and that it is actually the cause of the dual {GI} geminate processes. The arguments are based on modeling and on the observed rate. They are confirmed by the strong substrate dependence as reported in Complexes of Cytochrome P450cam with Substrate Analogs, below.
Group {GI} is the only one to be observed at the lowest temperature. It was found to be replenished when ligand migration was impeded by xenon. It must therefore be attributed to rebinding processes originating from the primary docking site of the ligand.
The relative proportions of the  and GI areas change from 2:1 at 80 K to 1:2 at 110 K. This feature rules out the possibility that the two sub-bands originate from different taxonomic substates. Such substates result from a local isomerism of strategic residues of the heme pocket. They are characterized by different CO stretch frequencies in the near IR spectrum of the bound ligand (Alben et al., 1982; Ansari et al., 1987). They may also give distinguishable contributions to the rate spectra recorded in the Soret (Tetreau et al., 2002). Taxonomic substates are documented for cytochrome P450cam (Jung and Marlow, 1987; Jung et al., 1992, 1996), but they do not equilibrate below Tg where their proportion remains constant.
The first suggestion for a structural rearrangement of the distal pocket after CO photodissociation was provided by comparing the x-ray structures of the FeIII P450cam(cam) (Poulos et al., 1987) and FeII P450cam(cam)(CO) (Raag and Poulos, 1989) forms; this comparison suggested that CO binding might be accompanied by a motion of the substrate relative to the heme shifting the substrate farther away from the binding axis.
Substrate relaxation was supported by MM calculations performed directly with the Fe(II) species. For this purpose, the structures of the penta-FeII and hexa-FeII (CO) species of cytochrome P450cam complexed with camphor were energy-minimized. The calculated structures are rather close to the x-ray structure as far as the protein backbone is concerned. The root mean-square deviations for their C-α atoms away from the crystal coordinates (after superimposing the C-α atoms of all residues) were 1.10–1.15 Å in the absence and the presence of CO, respectively.
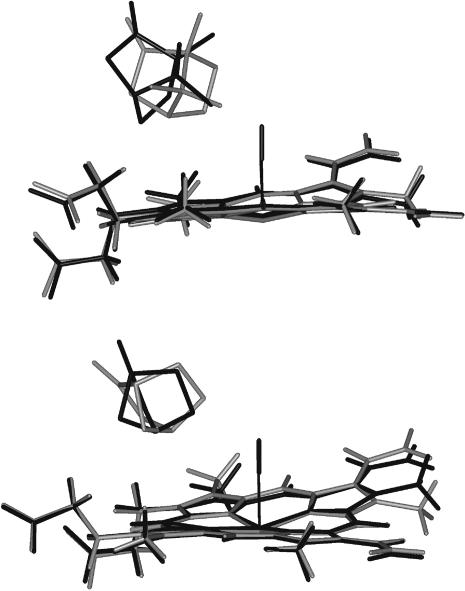
Compared to its position in the hexa-coordinated structure, the heme of the de-liganded species is not significantly displaced. In contrast the relative heme/substrate positions undergo significant modifications (Fig. 8). In the absence of CO, the substrate moves closer to the heme normal. The distance between the center of mass of camphor and the CO binding axis decreases from 3.53 to 2.86 Å (Table 1). This shift is accompanied by a rotation of the substrate. In both the penta- and hexa-coordinated species, the hydrogen bond between the substrate and Tyr96 is maintained with no significant change of the distance. As previously suggested from the mere examination of the crystal structures, the motion can be pictured as a pendulum motion around Tyr96 (Tetreau et al., 2000). Because such a mechanism is expected to be substrate-dependent, a similar MM calculation was performed with the substrate norcamphor. The amplitude of the displacement is less than with camphor since the distance between its center of mass and the CO binding axis decreases only from 3.75 to 3.58 Å (Table 1), a change that cannot be considered as significant.
FIGURE 8.
Energy-minimized structures of the heme pocket for the (camphor)-complexes (top) and (norcamphor)-complexes(bottom) of FeII P450cam (shaded) and FeII P450cam(CO) (solid). These views were obtained using the Insight II (MSI, San Diego, CA) software. Minimization was initialized with the crystal structure of FeIIP450cam(cam)(CO) (PDB entry 3CPP). The heme atoms of the penta- and hexa-coordinated species were superimposed to emphasize the motion of the substrate relative to the heme.
TABLE 1.
Distance of the center of mass and of the nearest atom from the CO binding axis in the CO-bound and CO-free P450cam complexes with camphor and norcamphor
| Substrate | CO | Center of mass (Å) | Nearest atom (Å) |
|---|---|---|---|
| Camphor | Bound | 3.53 | 1.51 (C10) |
| Absent | 2.86 | 1.19 (C6) | |
| Norcamphor
|
Bound | 3.75 | 2.90 (C5) |
| Absent | 3.58 | 1.89 (C5) |
The change of the camphor's nearest atom reflects clearly the rotation of the substrate.
To analyze the cause of the camphor displacement, energy interaction terms between camphor and the different parts of the protein were calculated for both the penta- and hexa- coordinated species; only the interaction with the heme showed a noticeable change (by ∼30%). In the hexa-coordinated species, the propionate group A is located at a small distance of the substrate; in the absence of CO, the heme is domed and the propionate group is closer to the substrate. This repulsive steric interaction is likely to push the substrate closer to the heme normal.
As a further test, we built a chimeric structure consisting of the energy-minimized penta-coordinated cytochrome to which the substrate was added in the position it occupies in the energy-minimized hexa-coordinated structure after superposition of C-α atoms of all residues. The substrate/heme interaction energy terms (Table 2) show that maintaining the camphor substrate in this position would have an energetic cost of ∼3.7 kcal/mole. The destabilization of the substrate/heme interaction results exclusively from the van der Waals steric term, essentially due to the increased steric repulsion between camphor and the propionate A, whereas the substrate/pyrrole interaction is only slightly modified.
TABLE 2.
Interaction energy (in kcal/mol) of the camphor substrate with its closest heme environment
| Group | Energy-minimized penta-coordinated species | Chimeric penta-coordinated species |
|---|---|---|
| Heme | −8.70 (−7.53) | −5.04 (−3.55) |
| Propionate A | −2.47 (−1.41) | 0.86 (1.57) |
| Pyrrole A | −2.32 (−2.09) | −1.96 (−1.75) |
Calculated in the energy-minimized penta-coordinated structure and in the chimeric species (in which the substrate was replaced by its CO-bound conformation, whereas the remaining part of the cytochrome was maintained in its penta-coordinated structure). Values given in parentheses are the van der Waals contributions.
Thus both x-ray data and MM simulations agree to predict a shift of the substrate toward a more crowding position upon CO photodissociation. We call this structural rearrangement of the heme pocket relaxation. The CO rebinding rate is expected to decrease according to whether the ligand rebinds from its primary docking site before or after the substrate has moved. Such a kinetic signature corresponds precisely to the, as yet unexplained, splitting of the two fast reacting subsets of {GI}. The substrate dependence of {GI} to be described in the next section further supports the assignment of (GI) and ( ) to rebinding in the unrelaxed and relaxed heme pockets, respectively.
Migration and relaxation rates
The kinetic scheme that must be solved when ligand migration and substrate relaxation processes occur simultaneously is too complex to permit a quantitative analysis in terms of elementary rate parameters. In addition, the number of unknown rate parameters exceeds the number of measurable independent quantities when ligand escape occurs. Fortunately within the wide temperature range covered by the experiments described here it is possible to consider separately temperature intervals in which either migration alone or relaxation alone is taking place. The temperature dependence then permits us to piece the processes together into one unique kinetic scheme.
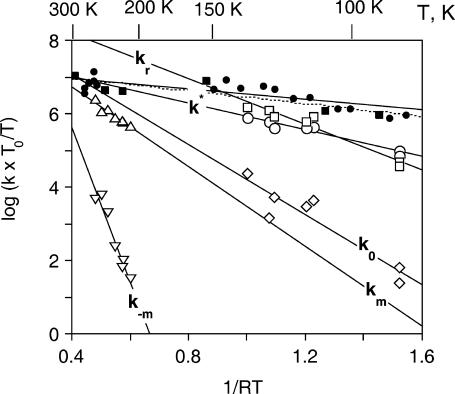
Between 77 K and 140 K ligand escape is prevented by the matrix rigidity, and the migration process is too slow to occur before rebinding as shown by the absence of bands S and GM. Therefore, the kinetic scheme is that of Fig. 9 (left). The decomposition of {GI} into two Gaussians gives consistent linear Arrhenius plots for the rates k*, k0, and kr obtained by applying Eqs. 1–7 to the peaks of the distribution (Tetreau et al., 2000) (Fig. 10).
FIGURE 9.
Explicit reaction schemes considered for extracting ligand migration rates after pocket relaxation (T > 170 K) and relaxation rates in the absence of migration (T < 140 K).
FIGURE 10.
Arrhenius/Eyring plots of the peak values of the rate parameters defined in Fig. 9. P450cam (cam): k* (open circles); kr (open squares); k0 (open diamonds); and km and k−m (open triangles). Substrate-free P450cam: k* (solid circles). P450cam (norcamphor): kI (solid squares and dotted line). The parameters were calculated either in the temperature range where no migration occurred or when relaxation was complete before migration (see text).
The activation enthalpies of k* and kr differ and the Arrhenius plots intersect near 100 K. Thus, in the high temperature range, relaxed rebinding becomes predominant (kr ≫ k*) and above ∼170 K relaxation is complete before direct rebinding can occur. {GI} consists only of the  band, and the kinetic scheme simplifies to that of Fig. 9 (right). The relevant kinetic equations have the same forms as Eqs. 1–7, with minor modifications for taking ligand escape into account because migration can be quantified only above 200 K:
 |
(11) |
 |
(12) |
 |
(13) |
 |
(14) |
 |
(15) |
In these expressions,  , Φ{M}, and S denote the integrated amplitude of the fast and slow geminate bands and of the bimolecular process, respectively.
In the absence of any information about the precise escape pathway(s), we assumed that escape occurs principally from state B. In fact, the changes brought about by assuming escape from state C (or from both states) are not very important and do not modify the orders of magnitude of the calculated values of the migration rates.
Complexes of cytochrome P450CAM with substrate analogs
The MM calculations described in Camphor Complex of Cytochrome P450CAM, above, indicate that substrate relaxation should be a spontaneous process driven by simple steric repulsion forces between substrate and heme. But MM calculations alone do not prove that relaxation is actually connected with the bimodal nature of {GI}. To address this issue, we now consider substrate analogs of camphor.
CO rebinding with cytochrome P450cam complexed with substrate analogs
The substrates fall into two broad classes depending on the aspect of the rate spectrum at the lowest temperature. This classification turns out to be close to that derived from the substrate mobility reported by others (Jung et al., 1992; Raag and Poulos, 1989, 1991; Schulze et al., 1997).
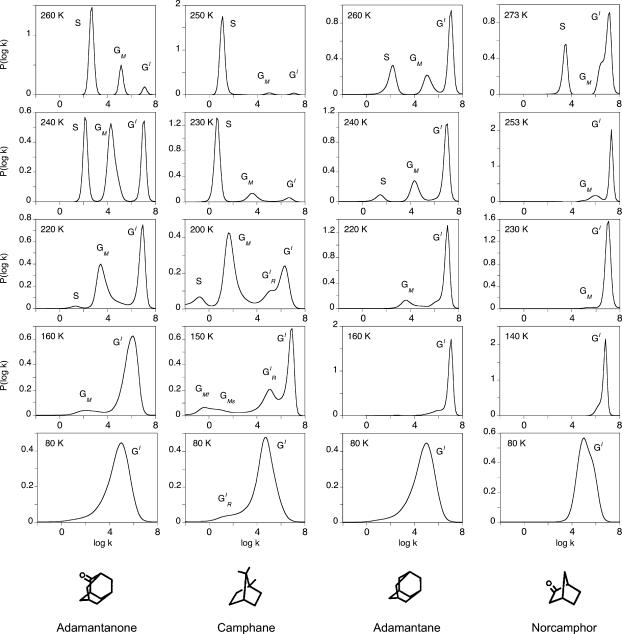
Rigidly maintained substrates such as camphor, 1S-camphor, adamantanone, camphane, and camphorquinone display a bimodal rate distribution {GI} below 130 K, as reported in Camphor Complex of Cytochrome P450CAM, above, for camphor. Within the same temperature range, the mobile substrates of adamantane, norcamphor, and norbornane display a very narrow rate distribution and the presence of two bands is not warranted by the data (see norcamphor, Fig. 11). They might actually exist but are too close to be clearly distinguished.
FIGURE 11.
Normalized rate spectra for CO rebinding with the adamantanone, camphane, adamantane, and norcamphor complexes of cytochrome P450cam. S denotes the solvent process. GI bands are attributed to the fast geminate processes that occur before migration and either before (GI) or after ( ) relaxation. GM bands correspond to the slow geminate processes occurring after ligand migration toward one (GMF) or another (GMS) of the secondary docking sites, as discussed in the text. The solvent was 64% glycerol/water (w/w) for norcamphor and camphane and 79% glycerol/water (w/w) for adamantane and adamantanone.
The temperature-dependence of the kinetic pattern differs markedly with the substrate class. With rigid substrates, {GM} processes appear and grow considerably at the expense of {GI} upon raising the temperature. At T > 220 K, process S becomes predominant and the relative yield of CO escape becomes close to unity at room temperature. With mobile substrates, {GM} always remains a minor process, detectable only at higher temperature, and the escape yield remains smaller than unity, even at room temperature.
The ligand migration rate is independent of substrate
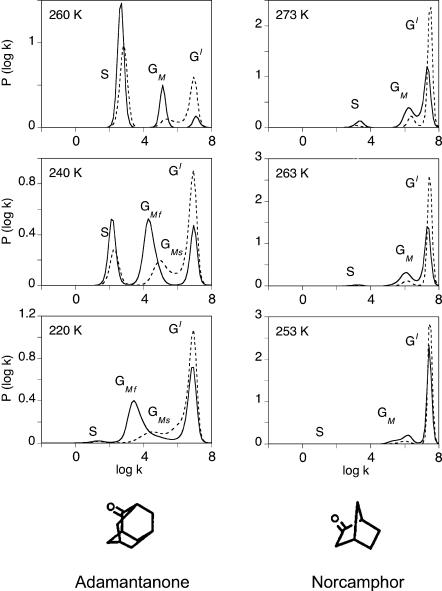
Fig. 12 shows examples of the kinetic competition with xenon observed with adamantanone- and norcamphor-complexes. Upon adding 16 atm of xenon, the fast geminate group {GI} increases at the expense of the slow component {GM}, indicating that the latter indeed corresponds to CO rebinding after migration toward a xenon-binding cavity. The intensity of {GM} is not sufficient to permit a precise quantification of xenon binding.
FIGURE 12.
Normalized P(log k) rate spectra for CO rebinding with the adamantanone and norcamphor complexes of cytochrome P450cam at pH7.0 in the absence (solid lines) or presence (dotted lines) of 16 atm of xenon. The solvent was 79% glycerol/water (w/w).
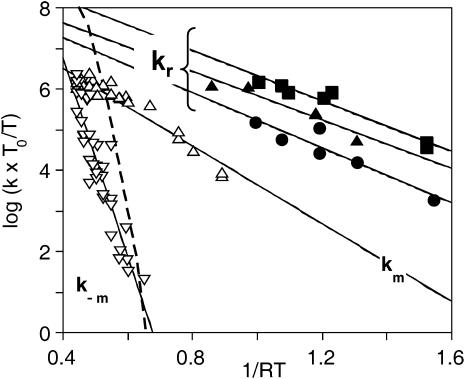
At 260–273 K, all bands are narrow, indicating kinetic averaging of the slow geminate components on the one hand, and of the fast geminate components on the other hand. For adamantanone, a shift of the peak position of the {GM} bands upon adding Xe is observed at 240–220 K, and the rate spectra at 220 K shows clear evidence for the presence of two bands GMS and GMF. These findings are in agreement with the presence of a second cavity of lesser xenon affinity already suggested for camphor (Camphor Complex of Cytochrome P450CAM, above). Applying Eqs. 11–15 to these data yields a unique Arrhenius plot (open triangles in Fig. 13) for km and k−m, irrespective of the nature of the substrate. Therefore migration and return rates are independent of the substrate.
FIGURE 13.
Arrhenius/Eyring plots of the peak values of the migration rates km and k−m (open triangles) and of the relaxation rates (solid symbols). For the readability of the figure, relaxation rates are only shown for 1R-camphor (squares), 1S-camphor (circles), and camphane (triangles).
The heme pocket relaxation rate is substrate-dependent
In contrast, the relaxation rate (kr) shown in Fig. 13 may differ by as much as 1–2 orders of magnitude among substrates. These rates were obtained by applying Eqs. 1–7 to the data recorded at lower temperature, when migration did not occur. For the readability of the figure, relaxation rates are only shown for 1R-, 1S-camphor, and for camphane, but all numerical pre-exponential factors and activation enthalpies parameters (Eq. 8) are given in Table 3.
TABLE 3.
Arrhenius parameters of the peak relaxation rate kr, peak
| Substrate | log Ar (s−1) | Hrp (kJ/Mol) |
|---|---|---|
| Camphor* | 9.5 (0.4) | 7.7 (0.7) |
| Camphor† | 9.4 (0.4) | 7.2 (0.8) |
| 1S-camphor* | 8.6 (0.8) | 7.8 (1.5) |
| 1S-camphor† | 8.1 (0.5) | 7.0 (0.8) |
| Adamantanone* | 8.4 (0.4) | 6.8 (0.8) |
| Camphorquinone* | 9.8 (0.9) | 8.6 (1.6) |
| Camphane* | 8.8 (0.6) | 6.9 (1.2) |
Italic values in parentheses are standard deviations of the least-square fit to Eq. 8.
In 64% glycerol/water solvent.
In 79% glycerol/water solvent.
In Camphor Complex of Cytochrome P450CAM, above, we addressed the question of the heme pocket relaxation mechanism at the origin of the dual nature of {GI} using MM calculations. Upon CO dissociation, the camphor substrate was found to move 0.67 Å closer to the heme normal. As a consequence, rebinding after substrate relaxation (k0) is slowed down because of increased steric repulsion. Camphor and all rigid substrates exhibit distinctly two {GI} bands but the relaxation rate is markedly substrate-dependent.
Such a displacement was also observed in MM calculations with norcamphor, a mobile substrate, but its amplitude is too small (only 0.17 Å, four times less than with camphor) to be considered as significant. According to the distance of the closest substrate atom from the CO binding axis (Table 1) one may expect the ligand rebinding rates to vary in the order of
 |
Mobile substrates show only one geminate band, a fact compatible with three possibilities:
Ultrafast relaxation; the band must be assigned to k°.
Very slow relaxation; the band must be assigned to k*.
The substrate exerts little hindrance in either conformation, and k° and k* are degenerate.
Actually, rate kI of norcamphor is not significantly different from the direct rebinding rate k* of the substrate-free protein (Fig. 10), meaning that it makes little sense to speak of relaxation in the case of mobile substrates. They do not seem to influence CO rebinding to any significant extent.
In the absence of substrate, only one fast geminate rebinding process is observed between 77 and 300 K (Tetreau et al., 2000). Obviously, no relaxation process is expected to occur here, but there is no reason why the absence of substrate should prevent ligand migration. A glance at Fig. 10 shows that rebinding is too fast to allow the ligand migration to occur (k* ≫ k*m).
CONCLUSIONS
Relaxation and migration in cytochrome P450cam and in myoglobin
The dynamics of cytochrome P450cam is dominated by two processes, substrate relaxation and ligand migration. They are kinetically distinguishable and occur independently of each other. Both lead to a reduction of the CO rebinding rate compared to k*, the former by 1–4 orders of magnitude depending on temperature and substrate, the latter by even more (up to five orders of magnitude). Relaxation is faster than migration and persists down to 77 K whereas ligand migration is observed only above 135 K.
For many substrates (adamantanone, adamantane, camphor, and 1S-camphor) experiments were duplicated in buffers containing various amounts of glycerol, either 64 or 79% (w/w). Although the viscosity of these solvents differs by at least one order of magnitude at a given temperature, the relaxation and migration rate did not show any significant dependence on the solvent composition and/or viscosity (data not shown). The most striking fact is that below 200 K both kr,peak and km,peak remain several orders-of-magnitude greater than the solvent relaxation rate determined by specific heat spectroscopy (Kleinert et al., 1998) (dashed line in Fig. 13). This clearly indicates that both relaxation and migration in P450cam are internal processes, decoupled from the bulk solvent and from the protein-solvent interface. Such processes can be termed as nonslaved (Fenimore et al., 2002), which is in contrast, for instance, to a dynamic process such as ligand escape, involving the protein-solvent interface and displaying viscosity dependence (Beece et al., 1980; Lavalette and Tetreau, 1988).
Conformational relaxation at the active site and opening of ligand migration pathways appear as general processes likely to occur in all proteins. Both require the motion of some part(s) of the protein matrix but the possibility to detect their kinetic signature depends on the nature and amplitude of the structural rearrangements involved as well as of their proximity to the solvent interface.
When only local displacements of an internal group or of a side chain residue are implied one may expect to observe essentially nonslaved processes. Depending on the branching ratio of the rate parameters, they may appear in distinct temperature ranges, but remain always detectable much below Tg. This is the situation found in cytochrome P450cam.
On the contrary, partially or fully slaved processes seem to be associated with collective motions of larger parts of the protein (e.g., a helix) that are more likely to be exposed at least partially to the solvent. In this respect a comparison of cytochrome P450cam and myoglobin is illuminating.
The crystal structures of the deoxy- and CO-bound forms of Mb and of several mutants reveal that CO binding should be accompanied by a displacement of the distal histidine (His64) farther away from the binding axis and by the disruption of a hydrogen bond with a water molecule that is expelled from the distal pocket (Kachalova et al., 1999; Kuryan et al., 1986; Quillin et al., 1995; Vojtechovsky et al., 1999) Conversely time-resolved crystallography of photodissociated sw-MbCO (Srajer et al., 2001) and of the YQR-MbCO mutant (Bourgeois et al., 2003) showed, on a nanosecond timescale, a motion of the distal residue 64 toward the location formerly occupied by the CO ligand.
This motion of the distal histidine may be compared to that of the camphor substrate in cytochrome P450cam and proves that a genuine conformational relaxation occurs in myoglobin too. However, and contrary to the cytochrome P450cam case, the rebinding kinetics show no sign of this process between 77 K and 180 K, the temperature above which ligand migration starts (Tetreau et al., 2004)
In the time-resolved crystallography of the YQR-MbCO mutant (Bourgeois et al., 2003), the authors reported that the motion of residue 64 was synchronous with the occupation of the Xe1 proximal site by CO that involves large-scale motions of the CD-turn and of the E-helix. Therefore migration and relaxation in myoglobin both appear to be linked to the solvent-slaved motion of the E-helix, a fact that may well account for the absence of relaxation as long as the solvent matrix remains rigid.
Acknowledgments
The authors are greatly indebted to Prof. S. Sligar and Dr. M. McLean for the generous gift of the gene and expression vector used for preparing recombinant P450cam. They acknowledge the University of Illinois at Urbana-Champaign for permission to use these materials.
References
- Alben, J. O., D. Beece, S. F. Bowne, W. Doster, L. Eiseinstein, H. Frauenfelder, D. Good, J. D. McDonald, M. C. Marden, P. P. Moh, L. Reinisch, A. Reynolds, E. Shyamsunder, and K. T. Yue. 1982. Infrared spectroscopy of photodissociated carboxymyoglobin at low temperatures. Proc. Natl. Acad. Sci. USA. 79:3744–3748. [DOI] [PMC free article] [PubMed] [Google Scholar]
- Ansari, A., J. Berendzen, D. Braunstein, B. R. Cowen, H. Frauenfelder, M. K. Hong, I. E. T. Iben, J. B. Johnson, P. Ormos, T. B. Sauke, R. Scholl, A. Schulte, P. J. Steinbach, J. Vittitow, and R. D. Young. 1987. Rebinding and relaxation in the myoglobin pocket. Biophys. Chem. 26:337–355. [DOI] [PubMed] [Google Scholar]
- Austin, R. H., K. W. Beeson, L. Eisenstein, H. Frauenfelder, and I. C. Gunsalus. 1975. Dynamics of ligand binding to myoglobin. Biochemistry. 14:5355–5373. [DOI] [PubMed] [Google Scholar]
- Beece, D., L. Eisenstein, H. Frauenfelder, D. Good, M. C. Marden, L. Reinisch, A. H. Reynolds, L. B. Sorensen, and K. T. Yue. 1980. Solvent viscosity and protein dynamics. Biochemistry. 19:5147–5157. [DOI] [PubMed] [Google Scholar]
- Bourgeois, D., B. Vallone, F. Schotte, A. Arcovito, A. E. Miele, G. Sciara, M. Wulff, P. Anfinrud, and M. Brunori. 2003. Complex landscape of protein structural dynamics unveiled by nanosecond Laue crystallography. Proc. Natl. Acad. Sci. USA. 100:8704–8709. [DOI] [PMC free article] [PubMed] [Google Scholar]
- Brooks, B., R. Bruccoleri, B. Olafson, D. States, S. Swaminathan, and M. Karplus. 1983. CHARMM: a program for macromolecular energy, minimization and molecular dynamics calculations. J. Comp. Chem. 4:187–217. [Google Scholar]
- Brunori, M. 2000. Structural dynamics of myoglobin. Biophys. Chem. 86:221–230. [DOI] [PubMed] [Google Scholar]
- Brunori, M., F. Cutruzzola, C. Savino, C. Travaglini-Allocatelli, B. Vallone, and Q. H. Gibson. 1999. Structural dynamics of ligand diffusion in the protein matrix: a study on a new myoglobin mutant Y(B10) Q(E7) R(E10). Biophys. J. 76:1259–1269. [DOI] [PMC free article] [PubMed] [Google Scholar]
- Carlson, M. L., R. M. Regan, R. Elber, H. Li, G. N. Phillips, J. S. Olson, and Q. H. Gibson. 1994. Nitric oxide recombination to double mutants of myoglobin: role of ligand diffusion in a fluctuating heme pocket. Biochemistry. 33:10597–10606. [DOI] [PubMed] [Google Scholar]
- Carlson, M. L., R. M. Regan, and Q. H. Gibson. 1996. Distal cavity fluctuations in myoglobin: protein motion and ligand diffusion. Biochemistry. 35:1125–1136. [DOI] [PubMed] [Google Scholar]
- Chu, K., J. Vojtchovsky, B. H. McMahon, R. M. Sweet, J. Berendzen, and I. Schlichting. 2000. Structure of a ligand-binding intermediate in wild-type carbonmonoxymyoglobin. Nature. 403:921–923. [DOI] [PubMed] [Google Scholar]
- Dantsker, D., U. Samuni, A. J. Friedman, M. Y. A. Ray, and J. M. Friedman. 2002. Geminate rebinding in trehalose-glass embedded myoglobins reveals residue-specific control of intramolecular trajectories. J. Mol. Biol. 315:239–251. [DOI] [PubMed] [Google Scholar]
- Draghi, F., A. E. Miele, C. Travaglini-Allocatelli, B. Vallone, M. Brunori, Q. H. Gibson, and J. S. Olson. 2002. Controlling ligand binding in myoglobin by mutagenesis. J. Biol. Chem. 277:7509–7519. [DOI] [PubMed] [Google Scholar]
- Ehrenstein, D., and G. U. Nienhaus. 1992. Conformational substates in azurin. Proc. Natl. Acad. Sci. USA. 89:9681–9685. [DOI] [PMC free article] [PubMed] [Google Scholar]
- Fenimore, P. W., H. Frauenfelder, B. H. McMahon, and F. G. Parak. 2002. Slaving: solvent fluctuations dominate protein dynamic and functions. Proc. Natl. Acad. Sci. USA. 99:16047–16051. [DOI] [PMC free article] [PubMed] [Google Scholar]
- Gibson, Q. H., R. M. Regan, R. Elber, J. S. Olson, and T. E. Carver. 1992. Distal pocket residues affect picosecond ligand recombination in myoglobin. J. Biol. Chem. 267:22022–22034. [PubMed] [Google Scholar]
- Hartmann, H., S. Zinser, P. Komninos, R. T. Schneider, G. U. Nienhaus, and F. Parak. 1996. X-ray structure determination of a metastable state of carbonmonoxy myoglobin after photodissociation. Proc. Natl. Acad. Sci. USA. 93:7013–7016. [DOI] [PMC free article] [PubMed] [Google Scholar]
- Helms, V., and R. C. Wade. 1997. Free energies of hydration from thermodynamic integration: comparison of molecular mechanics force fields and evaluation of calculation accuracy. J. Comp. Chem. 18:449–462. [Google Scholar]
- Ishikawa, H., T. Uchida, S. Takahashi, K. Ishimori, and I. Morishima. 2001. Ligand migration in human myoglobin: steric effects of isoleucine 107(G8) on O2 and CO binding. Biophys. ET J. 80:1507–1517. [DOI] [PMC free article] [PubMed] [Google Scholar]
- Jung, C., G. Hui Bon Hoa, K.-L. Schröder, M. Simon, and J.-P. Doucet. 1992. Substrate analogue-induced changes of the CO-stretching mode in the cytochrome P450cam-carbon monoxide complex. Biochemistry. 31:12855–12862. [DOI] [PubMed] [Google Scholar]
- Jung, C., and F. Marlow. 1987. Dynamic behavior of the active site structure in bacterial cytochrome P-450. Stud. Biophys. 120:241–251. [Google Scholar]
- Jung, C., O. Ristau, H. Schulze, and S. G. Sligar. 1996. The CO stretching mode infrared spectrum of substrate-free cytochrome P-450cam-CO. The effect of solvent conditions, temperature and pressure. Eur. Biochem. J. 235:660–669. [DOI] [PubMed] [Google Scholar]
- Kachalova, G. S., A. N. Popov, and H. D. Bartunik. 1999. A steric mechanism for inhibition of CO binding to heme proteins. Science. 284:473–476. [DOI] [PubMed] [Google Scholar]
- Kleinert, T., W. Doster, H. Leyser, W. Petry, V. Schwarz, and M. Settles. 1998. Solvent composition and viscosity effects on the kinetics of CO binding to horse myoglobin. Biochemistry. 37:717–733. [DOI] [PubMed] [Google Scholar]
- Kleywegt, G. J., and T. A. Jones. 1997. Model-building and refinement practice. Methods Enzymol. 277:208–230. [DOI] [PubMed] [Google Scholar]
- Kuryan, J., S. Wilz, M. Karplus, and G. A. Petsko. 1986. X-ray structure and refinement of carbon-monoxy (FeII)-myoglobin at 1.5 Å resolution. Mol. Biol. 192:133–154. [DOI] [PubMed] [Google Scholar]
- Lavalette, D., and C. Tetreau. 1988. Viscosity-dependent energy barriers and equilibrium conformational fluctuations in oxygen recombination with hemerythrin. Eur. J. Biochem. 177:97–108. [DOI] [PubMed] [Google Scholar]
- Lavalette, D., C. Tetreau, J.-C. Brochon, and A. Livesey. 1991. Conformational fluctuations and protein reactivity. Eur. J. Biochem. 196:591–598. [DOI] [PubMed] [Google Scholar]
- Li, H., R. Elber, and J. E. Straub. 1993. Molecular dynamics simulation of NO recombination to myoglobin mutants. J. Biol. Chem. 268:17908–17916. [PubMed] [Google Scholar]
- Liang, J., H. Edelsbrunner, P. Fu, P. V. Sudhakar, and S. Subramaniam. 1998a. Analytical shape computation of macromolecules. I. Molecular area and volume through ALPHA SHAPE. Proteins Struct. Funct. Gen. 33:1–17. [PubMed] [Google Scholar]
- Liang, J., H. Edelsbrunner, P. Fu, P. V. Sudhakar, and S. Subramaniam. 1998b. Analytical shape computation of macromolecules. II. Inaccessible cavities in proteins. Proteins Struct. Funct. Gen. 33:18–29. [PubMed] [Google Scholar]
- Nienhaus, K., P. Deng, J. M. Kriegl, and G. U. Nienhaus. 2003a. Structural dynamics of myoglobin: effect of internal cavities on ligand migration and binding. Biochemistry. 42:9647–9658. [DOI] [PubMed] [Google Scholar]
- Nienhaus, K., P. Deng, J. M. Kriegl, and G. U. Nienhaus. 2003b. Structural dynamics of myoglobin: spectroscopic and structural characterization of ligand docking sites in myoglobin mutant L29W. Biochemistry. 42:9633–9646. [DOI] [PubMed] [Google Scholar]
- Ostermann, A., R. Waschipky, F. G. Parak, and G. U. Nienhaus. 2000. Ligand binding and conformational motions in myoglobin. Nature. 404:205–208. [DOI] [PubMed] [Google Scholar]
- Poulos, T. L., B. C. Finzel, and A. J. Howard. 1987. High-resolution crystal structure of cytochrome P450cam. J. Mol. Biol. 195:687–700. [DOI] [PubMed] [Google Scholar]
- Quillin, M. L., T. Li, J. S. Olson, G. N. Phillips, Jr., Y. Dou, M. Ikeda-Saito, R. Regan, M. Carlson, Q. H. Gibson, H. Li, and R. Elber. 1995. Structural and functional effects of apolar mutations of the distal valine in myoglobin. J. Mol. Biol. 245:416–436. [DOI] [PubMed] [Google Scholar]
- Raag, R., and T. L. Poulos. 1989. Crystal structure of the carbon-monoxide-substrate-cytochrome P450cam ternary complex. Biochemistry. 28:7586–7592. [DOI] [PubMed] [Google Scholar]
- Raag, R., and T. L. Poulos. 1991. Crystal structures of cytochrome P450cam complexed with camphane, thiocamphor, and adamantane: factors controlling P-450 substrate hydroxylation. Biochemistry. 30:2674–2684. [DOI] [PubMed] [Google Scholar]
- Rubin, S. M., S.-Y. Lee, E. J. Ruiz, A. Pines, and D. E. Wemmer. 2002. Detection and characterization of xenon-binding sites in proteins by 129Xe NMR spectroscopy. J. Mol. Biol. 322:425–440. [DOI] [PubMed] [Google Scholar]
- Schlichting, I., J. Berendzen, G. N. Phillips, Jr., and R. M. Sweet. 1994. Crystal structure of photolysed carbonmonoxy-myoglobin. Nature. 371:808–812. [DOI] [PubMed] [Google Scholar]
- Schlichting, I. 2000. Crystallographic structure determination of unstable species. Acc. Chem. Res. 33:532–538. [DOI] [PubMed] [Google Scholar]
- Schotte, F., M. Lim, T. A. Jackson, A. V. Smirnov, J. Soman, J. S. Olson, G. N. Phillips, Jr., M. Wulff, and P. A. Anfinrud. 2003. Watching a protein as it functions with 150-ps time-resolved x-ray crystallography. Science. 300:1944–1947. [DOI] [PubMed] [Google Scholar]
- Schulze, H., G. Hui Bon Hoa, and C. Jung. 1997. Mobility of norbornane-type substrates and water accessibility in cytochrome P-450cam. Bioch. Biophys. Chim. Acta. 1338:77–92. [DOI] [PubMed] [Google Scholar]
- Scott, E. E., and Q. H. Gibson. 1997. Ligand migration in sperm whale myoglobin. Biochemistry. 36:11909–11917. [DOI] [PubMed] [Google Scholar]
- Scott, E. E., Q. H. Gibson, and J. S. Olson. 2001. Mapping the pathways for O2 entry into and exit from myoglobin. J. Biol. Chem. 276:5177–5188. [DOI] [PubMed] [Google Scholar]
- Srajer, V., Z. Ren, T.-Y. Teng, M. Schmidt, T. Ursby, D. Bourgeois, C. Pradervand, W. Schildkamp, M. Wulff, and K. Moffat. 2001. Protein conformational relaxation and ligand migration in myoglobin: a nanosecond to millisecond movie from time-resolved Laue x-ray diffraction. Biochemistry. 40:13802–13815. [DOI] [PubMed] [Google Scholar]
- Srajer, V., T.-Y. Teng, T. Ursby, C. Praverdand, Z. Ren, S.-I. Adachi, W. Schildkamp, D. Bourgeois, M. Wulff, and K. Moffat. 1996. Photolysis of the carbon monoxide complex of myoglobin: nanosecond time-resolved crystallography. Science. 274:1726–1729. [DOI] [PubMed] [Google Scholar]
- Steinbach, P. J., A. Ansari, J. Berendzen, D. Braunstein, K. Chu, B. R. Cowen, D. Ehrenstein, H. Frauenfelder, J. B. Johnson, D. C. Lamb, S. Luck, J. R. Mourant, G. U. Nienhaus, P. Ormos, R. Philipp, A. Xie, and R. D. Young. 1991. Ligand binding to heme proteins: connection between dynamics and function. Biochemistry. 30:3988–4001. [DOI] [PubMed] [Google Scholar]
- Teng, T.-Y., V. Srajer, and K. Moffat. 1997. Initial trajectory of carbon monoxide after photodissociation from myoglobin at cryogenic temperatures. Biochemistry. 36:12087–12100. [DOI] [PubMed] [Google Scholar]
- Teng, T. Y., V. Srajer, and K. Moffat. 1994. Photolysis-induced structural changes in single crystals of carbonmonoxy myoglobin at 40 K. Nat. Struct. Biol. 1:701–705. [DOI] [PubMed] [Google Scholar]
- Tetreau, C., Y. Blouquit, E. Novikov, E. Quiniou, and D. Lavalette. 2004. Competition with xenon elicits ligand migration and escape pathways in myoglobin. Biophys. J. 86:435–447. [DOI] [PMC free article] [PubMed] [Google Scholar]
- Tetreau, C., C. Di Primo, R. Lange, H. Tourbez, and D. Lavalette. 1997. Dynamics of carbon monoxide binding with cytochromes P-450. Biochemistry. 36:10262–10275. [DOI] [PubMed] [Google Scholar]
- Tetreau, C., E. Novikov, M. Tourbez, and D. Lavalette. 2002. Kinetic evidence for three photolyzable taxonomic conformational substates in oxymyoglobin. Biophys. J. 82:2148–2155. [DOI] [PMC free article] [PubMed] [Google Scholar]
- Tetreau, C., M. Tourbez, A. Gorren, B. Mayer, and D. Lavalette. 1999. Dynamics of carbon monoxide binding with neuronal nitric oxide synthase. Biochemistry. 38:7210–7218. [DOI] [PubMed] [Google Scholar]
- Tetreau, C., M. Tourbez, and D. Lavalette. 2000. Conformational relaxation in hemoproteins: the cytochrome P450cam case. Biochemistry. 39:14219–14231. [DOI] [PubMed] [Google Scholar]
- Tilton, R. F., I. D. Kuntz, and G. A. Petsko. 1984. Cavities in proteins: structure of a metmyoglobin-xenon complex solved to 1.9 Å. Biochemistry. 23:2849–2857. [DOI] [PubMed] [Google Scholar]
- Unger, B. P., I. C. Gunsalus, and S. G. Sligar. 1986. Nucleotide sequence of the Pseudomonas putida cytochrome P450cam gene and its expression in Escherichia coli. J. Biol. Chem. 261:1158–1163. [PubMed] [Google Scholar]
- Vojtechovsky, J., K. Chu, J. Berendzen, R. M. Sweet, and I. Schlichting. 1999. Crystal structures of myoglobin-ligand complexes at near-atomic resolution. Biophys. J. 77:2153–2174. [DOI] [PMC free article] [PubMed] [Google Scholar]


