Abstract
An analysis is presented on how structural cores modify their shape across homologous proteins, and whether or not a relationship exists between these structural changes and the vibrational normal modes that proteins experience as a result of the topological constraints imposed by the fold. A set of 35 representative, well-populated protein families is studied. The evolutionary directions of deformation are obtained by using multiple structural alignments to superimpose the structures and extract a conserved core, together with principal components analysis to extract the main deformation modes from the three-dimensional superimposition. In parallel, a low-resolution normal mode analysis technique is employed to study the properties of the mechanical core plasticity of these same families. We show that the evolutionary deformations span a low dimensional space of 4–5 dimensions on average. A statistically significant correspondence exists between these principal deformations and the ∼20 slowest vibrational modes accessible to a particular topology. We conclude that, to a significant extent, the structural response of a protein topology to sequence changes takes place by means of collective deformations along combinations of a small number of low-frequency modes. The findings have implications in structure prediction by homology modeling.
INTRODUCTION
The realization that natural proteins probably cluster in a finite and relatively small set of structurally related families and superfamilies (Murzin et al., 1995) fueled the initiation of various structural genomics projects, now in different stages of development (O'Toole et al., 2004). These initiatives are aimed at mapping protein structural space, so that most proteins in sequenced genomes can eventually be found within a given so-called structural modeling distance (Baker and Sali, 2001). In principle, homology modeling tools (Fiser et al., 2002; Sanchez and Sali, 1997) could then be used to extrapolate the structure of a target protein from a template found within this distance. In practice, results from all CASP (critical assessment of techniques for protein structure prediction) competitions so far have shown that accuracy in homology models reflects, to a large extent, the quality of the underlying sequence alignment employed to build them (Tramontano and Morea, 2003). In most cases, the resulting models only modestly shift from the template to the target structure in the aligned regions, i.e., the maximum improvement is rarely >∼0.4 Å. By contrast, the average root mean-square deviation in the structural core among remote homologues (those below 40% sequence identity) is ∼2.0 Å (vide infra). These differences are relevant if the modeled structures are expected to be subsequently applied to problems such as drug design, where current docking force fields are known to be sensitive to small structural shifts in the binding sites (Ferrara et al., 2004). Although alignment errors remain the main source of inaccuracies in comparative modeling, there is also a need for a more accurate modeling of the distortions and rigid body shifts imposed by sequence changes among protein homologues (Marti-Renom et al., 2000). Clearly, a first step is to understand the natural process of structural adaptation in protein families during evolution and relate it to the various physical properties of protein topologies. Among these, the connection between evolutionary deformations and the intrinsic flexibility of the protein topology is particularly interesting. It has been clearly established in recent years that proteins utilize their intrinsic flexibility to facilitate function (Berendsen and Hayward, 2000; Karplus and McCammon, 2002; Kitao and Go, 1999). It can therefore be expected that proteins make use of these same principal directions of fluctuation during the process of adaptation to new or modified functions during evolution. It is the purpose of this article to investigate such a connection.
Here, we will apply principal components analysis (PCA; Johnson and Wichern, 1998) to the analysis of multiple structural alignments of a representative set of protein families. The goal is to determine the main evolutionary directions of structural change among the homologous proteins of a given superfamily. Upon characterizing this evolutionary space, we will compare it to be subspace spanned by the vibrational normal modes imposed by the protein topology (Atilgan et al., 2001). In normal mode analysis (NMA; Ma, 2004), the potential energy surface is assumed to be quadratic in the vicinity of a well-defined energy minimum, considered here to be the observed experimental conformation.
This assumption of harmonicity allows the motions of the protein to decompose easily into a set of independent harmonic vibrational modes, the normal modes, by solving an eigenvalue problem. To consider motions dictated only by the protein topology, regardless of the peculiarities of the protein sequence, we will employ a simplified form of NMA (normal mode analysis) based on elastic network models (Bahar et al., 1997; Hinsen, 1998; Tirion, 1996).
The normal modes computed by means of elastic network models can be regarded as a set of molecular deformational modes imposed by the protein topology and can then be directly compared with the components detected by PCA, describing the evolutionary directions of deformation. Previous work has already established a connection between normal modes and protein function. Considerable functional insight has been gained by applying NMA to tubulin (Keskin et al., 2002), adenylate kinase (Temiz et al., 2004), DNA-dependent polymerases (Delarue and Sanejouand, 2002), hemoglobin (Xu et al., 2003), or the mechanosensitive channel from Escherichia coli (Valadie et al., 2003), to name only a few. Gerstein and co-workers have generalized these findings by showing that one-half of 3800 known protein motions can be described well by perturbing the considered protein along the direction of at most two low-frequency modes (Krebs et al., 2002). However it is unclear whether or not amino acid sequences are selected during evolution so that proteins follow paths of structural adaptation along low-frequency modes. Here we will show that the comparison of PCA and NMA spaces can shed light on the mechanisms underlying the evolution of protein structures and can provide relevant hints to improve protein modeling as well as protein design algorithms.
METHODS
Data set
The data set (Table 1 of Supplementary Material) was selected from the ASTRAL40 database (Brenner et al., 2000). A sample of 35 large, diverse, and well-studied superfamilies, classified according to the SCOP (structural classification of proteins) (Murzin et al., 1995), was selected. The number of structures in each superfamily ranges from 11 to 46. The maximum percentage of identity between the members of a given superfamily is 40%, whereas the sequence identity in the core upon structural alignment is ∼25% on average. The number of families in each superfamily ranges from 1 to 8.
Multiple structural alignments
The structural set corresponding to each one of the 35 families was subjected to multiple structural alignment using MAMMOTH-mult (Lupyan et al., unpublished), a multiple alignment version of the structure alignment program MAMMOTH (Ortiz et al., 2002). From the alignment, the evolutionary core of the protein family is selected. This is defined as the set of gapless positions for which the Cα atoms of all members are within 4 Å from the family average. This way, a matrix Xnxp is obtained containing the Cartesian coordinates of the Cα core positions in the family, with n being the number of structures and p 3 times the number of core positions (each position is defined by its corresponding x, y, z Cartesian coordinates).
Evolutionary deformations: PCA
PCA (Johnson and Wichern, 1998) was used to extract the set of main modes of motion in the alignment that best describes the deformations experienced by the core. Starting from Xnxp, the covariance matrix Cpxp is computed, with elements cij = 〈(xi − 〈xi〉)(xj − 〈xj〉)〉, where averages <> are over the n structures. Then, C is subjected to spectral decomposition as  where V is an orthogonal matrix containing the set of eigenvectors and
  is a diagonal matrix containing the set of eigenvalues. The eigenvector matrix
  will then be used in the comparisons with anisotropic network model (ANM; vide infra).
Vibrational modes: the ANM
For the simulation of the vibrational modes we used ANM (Atilgan et al., 2001). ANM is a special type of NMA. It is a coarse-grained model, which assumes that the protein in the folded state is equivalent to a three-dimensional elastic network. The junctions of the network, considered here the Cα atoms, undergo Gaussian-distributed fluctuations under the potentials of their near neighbors, modeled by linear springs. A generic force constant is adopted for the interaction potential between all pairs of residues sufficiently close. The potential energy of the protein (V) as a function of the displacement vector ( ) from the native conformation (in Cartesian coordinates) is thus:
  where H is the Hessian matrix containing the second derivatives of the energy function, which is assumed to be harmonic. H is computed from the atomic coordinates of the Cα atoms in the native structure. Factorization of H as
  yields 3N-6 intrinsic normal modes (N being the number of residues), contained in the eigenvector matrix U, with frequencies contained in the diagonal matrix
  .The U matrix will be compared with the PCA directions, contained in matrix V, using the core positions selected from the multiple structural alignment.
Relating both spaces: the root mean-square inner product calculation
We compared the vibrational modes obtained by ANM with the structural fluctuations detected by PCA. To simplify the comparisons, the normal mode space is restricted to its 50 lowest frequency modes. Similarly, the evolutionary space is restricted to the number of components required to explain 70% of the variance, five components on average (see below). The overlap between both spaces is calculated from the root mean-square inner product (root mean-square inner product) (Amadei et al., 1999) of the PCA eigenvectors with the vibrational ones:
 |
(1) |
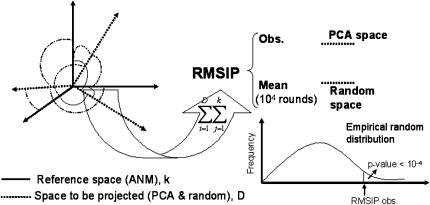
Here, ηi and υj are, respectively, the set of eigenvectors of the evolutionary and ANM spaces, with dimensionality equal to three times the number of core residues defined by MAMMOTH-mult (Table 1). D is the dimensionality of the evolutionary space (five dimensions were used on average), and k is the dimensionality of the ANM space (the slowest 50 modes were employed). The statistical significance of the observed RMSIP value was tested by simulating an empirical distribution of RMSIP data under the null hypothesis of no relationship between both spaces (Fig. 1). For each family, the empirical distribution of RMSIP values was obtained by projecting the evolutionary space onto k-dimensional orthogonal spaces, obtained from random orthogonal Q matrices following the Stewart algorithm (Stewart, 1980). Ten thousand orthogonal matrices were generated to generate this distribution, which allows computing the Z-score of the observed RMSIP value, as follows:
 |
(2) |
TABLE 1.
Summary of results for the data set of superfamilies (see Table 1 of Supplementary Material for a description of the different sets)
| Protein superfamily | No. structures | No. core residues | % Core | 〈rms〉 ± σ | No. PCs (70% var.) |
|---|---|---|---|---|---|
| Globins | 23 | 75 | 68 | 1.89 ± 0.63 | 5 |
| kinases | 22 | 166 | 64 | 2.03 ± 0.47 | 6 |
| Immunoglobulins | 23 | 51 | 59 | 1.92 ± 0.54 | 6 |
| Glutation S-transferases | 22 | 67 | 59 | 1.90 ± 0.51 | 6 |
| Interleukin 8-like chemokines | 11 | 51 | 83 | 1.63 ± 0.71 | 4 |
| RNA-binding domain | 21 | 51 | 68 | 2.70 ± 0.59 | 5 |
| Fibronectin | 46 | 38 | 45 | 2.34 ± 0.89 | 9 |
| Cytochrome c | 16 | 36 | 46 | 1.64 ± 0.43 | 3 |
| Thioredoxinlike | 35 | 39 | 53 | 2.08 ± 0.84 | 3 |
| SH3 | 24 | 34 | 60 | 1.87 ± 0.55 | 5 |
| Cupredoxins | 22 | 48 | 49 | 2.00 ± 0.56 | 4 |
| Snake toxinlike | 11 | 36 | 60 | 1.49 ± 0.41 | 4 |
| Aldolases | 19 | 84 | 40 | 2.07 ± 0.45 | 5 |
| Ferritinlike | 15 | 103 | 72 | 1.97 ± 0.56 | 4 |
| Death domain | 12 | 59 | 71 | 2.61 ± 0.62 | 4 |
| Nuclear receptor ligand-binding domain | 14 | 175 | 79 | 1.92 ± 0.35 | 6 |
| Pectin lyaselike | 15 | 111 | 56 | 2.08 ± 0.49 | 4 |
| Riboflavin synthase | 16 | 71 | 78 | 1.90 ± 0.38 | 6 |
| Lipocalins | 23 | 62 | 50 | 2.18 ± 0.76 | 4 |
| PDZ domainlike | 20 | 56 | 68 | 1.94 ± 0.70 | 6 |
| γ-crystallinlike | 11 | 51 | 67 | 2.34 ± 0.97 | 3 |
| LDH C-terminal domainlike | 12 | 114 | 72 | 2.04 ± 0.70 | 3 |
| NTF2-like | 13 | 83 | 74 | 2.35 ± 0.51 | 4 |
| DNA clamp | 13 | 74 | 67 | 2.35 ± 0.93 | 3 |
| ATPASE domain of HSP90 chaperone | 11 | 69 | 49 | 1.82 ± 0.50 | 4 |
| acyl-CoA-N-acyltransferases | 18 | 64 | 47 | 2.17 ± 0.50 | 6 |
| Ribulose-phosphate-binding barrel | 14 | 125 | 63 | 2.32 ± 0.43 | 5 |
| Zn-dependent exopeptidases | 11 | 119 | 44 | 2.67 ± 0.80 | 3 |
| Periplasmic-binding proteinlike I | 13 | 103 | 40 | 2.42 ± 0.60 | 4 |
| Phosphatases II | 14 | 92 | 64 | 1.89 ± 0.61 | 4 |
| Ferredoxin reductaselike | 12 | 87 | 73 | 2.08 ± 0.40 | 4 |
| SCR-domain | 21 | 34 | 59 | 2.24 ± 0.88 | 5 |
| Defensinlike | 12 | 22 | 73 | 2.33 ± 0.56 | 4 |
| C2H2 AND C2HC zinc fingers | 21 | 20 | 77 | 1.57 ± 0.51 | 4 |
| Scorpion toxinlike | 22 | 20 | 87 | 1.77 ± 0.74 | 4 |
FIGURE 1.
A graphical summary of the RMSIP calculation (Eq. 1). See Methods for details.
Relating both spaces: mean-square fluctuations
For the case of evolutionary deformations computed from structural alignments, the mean-square fluctuation for position k over the set of the n proteins in the structural alignment is obtained as follows:
 |
(3) |
In the case of NMA, the mean-square fluctuation for each residue in the vibrational space can be obtained from a sum over the inner products of the residue entries of the 3N-6 vectors of the eigenvector matrix, scaled by the corresponding eigenvalue, as follows (Atilgan et al., 2001):
 |
(4) |
We assigned a value of 1.8 to the prefactor. The fluctuations obtained by both methods are compared. First, we computed, for each family, the Spearman correlation coefficient (Rs; Langley, 1970) between the list of fluctuations per residue calculated with both approaches. The sampling distribution of Rs under the null hypothesis of no correlation can be closely approximated by a normal distribution having E(Rs) = 0 and  where n is the number of residues. Hence, we computed the Z-score of Rs as
RESULTS
PCA
Each one of the 35 superfamilies (Table 1, Supplementary Material) was multiply aligned with MAMMOTH-mult. A summary of the results is found in Table 1. The structural core detected from the alignments and later used in the PCA studies comprises 62.4 ± 12.5% of the total structure (percentage taken with respect to the shortest member of the superfamily). On the other hand, the average root mean-square deviation in the structural core is 2.07 Å, with an average standard deviation of 0.60 Å. Both the number of structures used and the core size detected seem to be large enough to ensure that the deformations detected using PCA will approximate the true deformations experienced by the protein family.
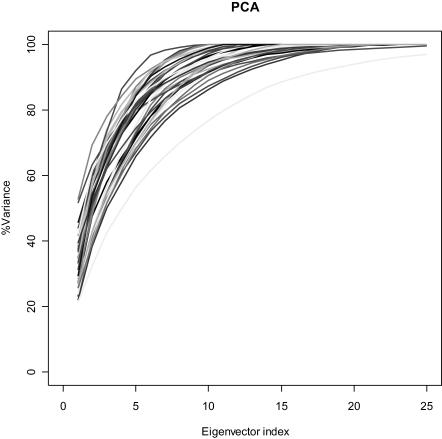
A summary of the PCA results can be found in Fig. 2 and Table 1. The structural deformations span a space of low dimensionality; 70% of the total variance in the core fluctuations can be explained with an average of 4.5 ± 1.2 components. Thus, the behavior of all superfamilies in PCA is rather similar, independent of the structural class, size, or number of structures. Although structural sampling is key to the definition of the PCA subspace, and we cannot be confident that a complete coverage of the structural space available to a given superfamily is achieved, the similarity of the results in all cases suggests that our conclusion is robust.
FIGURE 2.
Percentage of explained variance as a function of the number of eigenvectors for PCA.
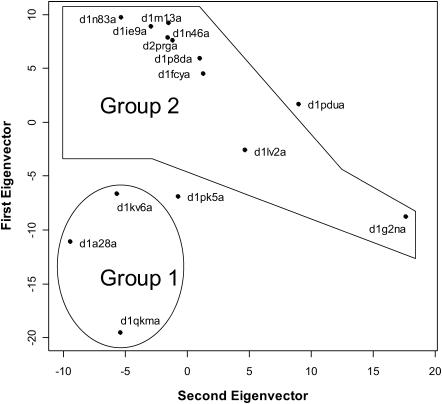
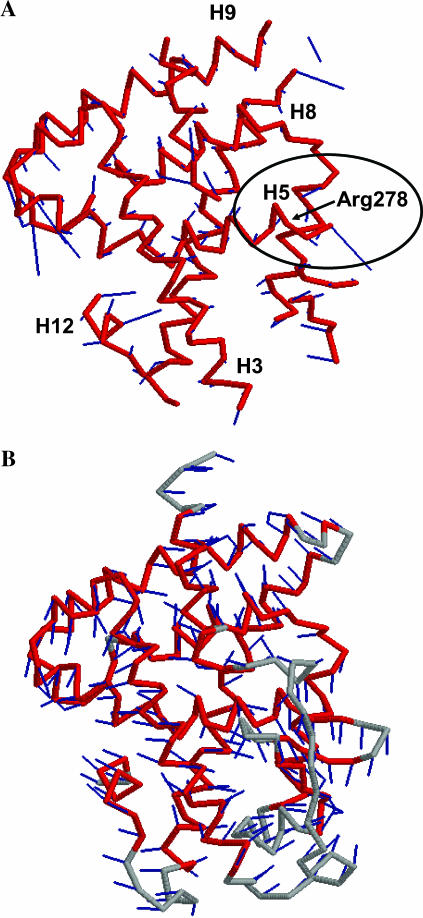
PCA summarizes the evolutionary deformations of a superfamily in directions mostly reflecting functional adaptations. An example is shown in Fig. 3, which depicts the distribution of the structures belonging to the nuclear receptor ligand-binding superfamily (48508) on the first two principal components. A clear functional separation is apparent along the first component, which differentiates the group of steroid-binding domains (group 1 in the figure) from the group of retinoic acid- and analogs-binding domains (group 2). When the eigenvector is analyzed (Fig. 4 A), it becomes apparent that one of the regions in the protein strongly contributing to that eigenvector is the end of helix 5. This region includes Arg-278, whose position in the ligand-binding site is known to be involved in determining ligand selectivity (Steinmetz et al., 2001).
FIGURE 3.
PCA of the 48508 (nuclear receptor ligand-binding domain) superfamily. The distribution of the structures onto the plane formed by the first two eigenvectors is shown. Group 1 corresponds to structures recognizing steroidlike ligands, whereas group 2 corresponds to domains recognizing retinoic acid and its analogs. Structures not forming part of any group correspond to orphan receptors.
FIGURE 4.
(A) Average core (magenta trace) detected by MAMMOTH-mult for the 48508 (nuclear receptor ligand-binding domain) superfamily and first eigenvector (sticks attached to the residues of the trace). The different helices in the structure are labeled. Relative contribution of each residue to the eigenvector is given for the length of the stick attached to the residue. End of helix 5 (H5) is highlighted. It contains Arg-278, implicated in ligand selectivity. (B) The first ANM eigenvector is shown. Modes computed using the closest structure to the superfamily average (shown in the figure).
PCA and ANM comparisons
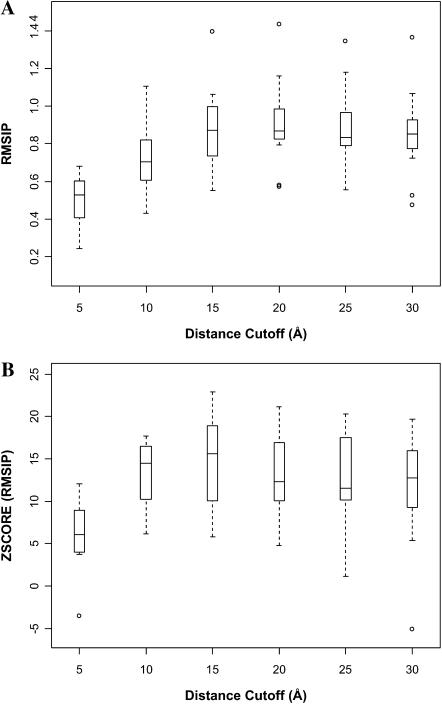
ANM computations were carried out for the structure in the superfamily closest to the average structure determined by MAMMOTH-mult. Consistent with previous results (Keskin et al., 2000), tests indicated that normal modes are not significantly affected by the specific structure in the superfamily used in the calculation (not shown). An example of an ANM normal mode is shown in Fig. 4 B, where the lowest frequency mode computed for a representative member of the nuclear receptor ligand-binding superfamily (48508) is displayed, together with the structure employed in the computation. The orientation of the structure is the same used in Fig. 4 A. A simple visual inspection of Fig. 4, A and B, indicates that the motions in both cases are considerably different. This is generally the case for most of pairwise comparisons between PCA and ANM eigenvectors (not shown). Yet, a given subspace of the complete ANM space may exist that can form a suitable basis set for the PCA eigenvectors, even with a poor correlation between the pairs of eigenvectors. This can be quantified by measuring the projection of the PCA eigenvectors onto the ANM subspace by means of the RMSIP metric (see Methods). We will restrict our comparisons to the lowest 50 ANM modes. Our results (vide infra) seem to indicate that this is a reasonable choice. We will use for each superfamily the number of PCA components shown in Table 1. We first determined the optimal cutoff distance for neighbor selection in ANM (see Methods). For different cutoffs, the Z-score of the RMSIP between PCA and ANM spaces (considering the slowest 50 modes) was computed (Fig. 5). The optimal cutoff distance, with a median RMSIP of 0.85, was found to be 15 Å, close to the optimal distance found by Bahar and co-workers when comparing the mean-square fluctuations computed from ANM and those deduced from the B-factors (Atilgan et al., 2001). The RMSIP value is highly significant, with a Z-score above 15 (Fig. 5 B).
FIGURE 5.
Box-plots of the overlap of the PCA and ANM spaces as a function of the cutoff distance employed in the ANM computation. The length of the wishers extends 1.5 times the interquantile range (shown as a box), leaving out the outliers. (A) RMSIP values. (B) Z-score of the RMSIP values.
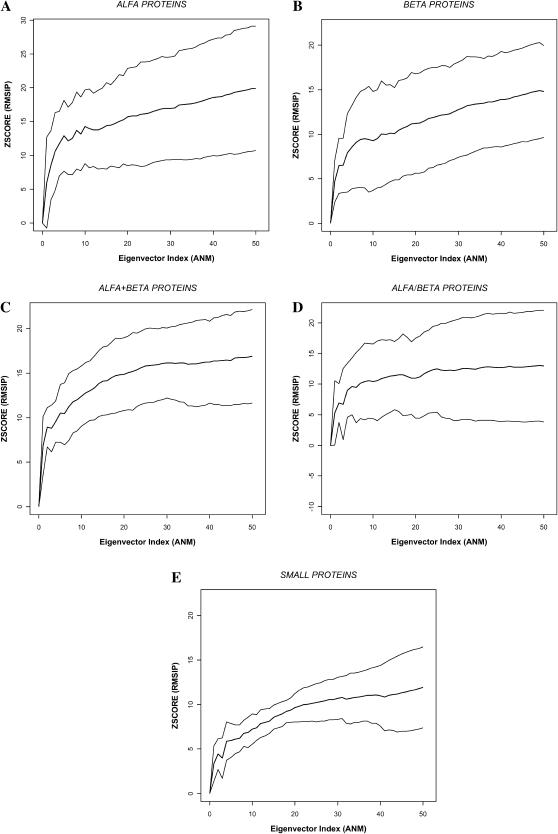
Next, we studied, at this optimal cutoff, how the overlap between both spaces depends on the number of low-frequency normal modes considered, including up to 50 modes. The results are found in Fig. 6, which shows the overlap in terms of the average Z-score separated over different structural classes. A significant overlap quickly builds up within the first ∼20 modes and then tends to plateau. Small and α/β-proteins show significantly smaller overlaps, whereas α and α + β-proteins show the largest ones. Small proteins have a larger number of disulfide bridges, not considered in the ANM, and this could be an explanation for the lower overlap observed. In summary, there is a statistically significant overlap between the deformations observed in the core of homologous proteins and the lowest ∼20 frequency modes imposed by the protein topology. Thus, the protein core in evolutionary related proteins responds structurally to sequence changes by deformations along combinations of normal modes imposed by the protein topology.
FIGURE 6.
Z-score of the RMSIP (overlap of PCA and ANM spaces; see Eq. 2) at the optimal cutoff distance as a function of the number of ANM modes employed. The lowest 50 modes have been considered. (A) α-proteins; (B) β-proteins; (C) α + β-proteins; (D) α/β-proteins; and (E) small proteins.
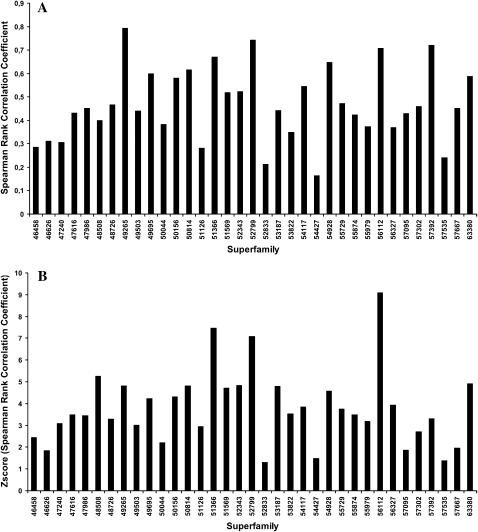
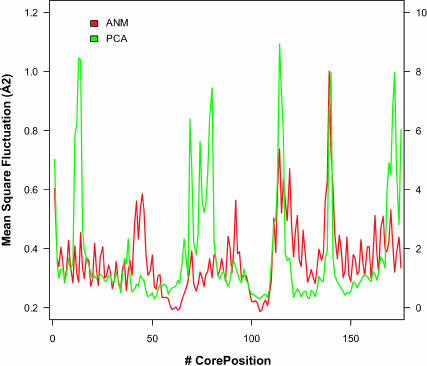
Finally, we also studied whether or not the observed residue fluctuations in the core are correlated with those predicted by the normal modes, i.e., whether or not regions that have larger evolutionary fluctuations correspond to those that ANM predicts as the ones with higher fluctuations. Results can be found in Fig. 7. For most superfamilies there is a moderate degree of correlation between the root mean-squared fluctuations observed in the core, as computed from the alignments, and the fluctuations predicted by ANM, with correlations in the range of 0.3–0.8 (Fig. 7 A). An example of the correspondence of mean-squared fluctuations for the core in one of the superfamilies is shown in Fig. 8. A similar profile can be observed, although the scales are different. In general, Spearman correlations are statistically significant (Fig. 7 B). Exceptions are cytochrome c (46626), NTF2-like (54427), thioredoxinelike (52833), SCR-domain (57535), scorpion toxinlike (57095), and zinc fingers (57667), all of them with Z-scores below 2. In some cases, there are reasons that could explain these deviations. For example, in the case of the cytochrome c, the heme group is not included in the calculation of the ANM normal modes. A similar explanation can be found for SCR-domains and scorpion toxinlike, rich in disulfide bridges, and zinc fingers, whose structure is maintained by a Zn atom chelating cystine and histidine residues.
FIGURE 7.
(A) Spearman rank correlation coefficient between the observed mean-square fluctuations (from the multiple structural alignments) and those computed from ANM for each of the superfamilies studied. (B) The corresponding Z-score of the Spearman rank.
FIGURE 8.
Mean-square fluctuation per residue in the core corresponding to 48508 (nuclear receptor ligand-binding domain) superfamily.
DISCUSSION
In a structure prediction project by comparative modeling, the probability that the query sequence shares <30% of identity to a known structure of the same fold is at least 50% (Marti-Renom et al., 2000). Detection of sequence-structure compatibility in these cases has shown considerable improvements in recent years (Kelley et al., 2000; Koh et al., 2003; Shi et al., 2001). The quality of the corresponding sequence alignments also shows significant progress (Marti-Renom et al., 2004). Refinement of the initial model, however, remains a formidable task. It has been proposed that the simultaneous use of several templates can minimize this kind of error. However, it has been found that model refinement, with or without the use of multiple templates, only rarely shifts the core structure of the model from the template to the target (Tramontano and Morea, 2003). This difficulty is thought to be due to both the large size of conformational space and the delicate balance of forces in the native structure. Progress on this challenging problem may be facilitated by focusing on more constrained and thus more tractable refinement problems. Characterizing the process of structural adaptation in homologous proteins can be useful in this regard, as it can allow the definition of collective variables to reduce the dimensionality of the search space. Comparisons of dynamic models with knowledge-based information from the database have been attempted in the past. Berendsen and co-workers (de Groot et al., 1998; van Aalten et al., 1997), for example, compared the “essential dynamics” derived from a collection of crystal structures with the results of “essential dynamics” as applied to molecular dynamics simulations of these proteins, finding good agreement between both sets of data. However, to our knowledge, we report here the first comparison between mechanical deformational modes and evolutionary deformations in proteins.
Not surprisingly, we find that the regions experiencing the highest evolutionary fluctuations in the protein core tend to correspond to topologically unconstrained regions. More interesting is the finding that the adaptive movements responsible for these fluctuations are highly cooperative, taking place in a space of low dimensionality, of only 4–5 dimensions, and similar in all superfamilies. Because side chain degrees of freedom in the protein core are basically dictated by the backbone conformation (Levitt et al., 1997), this finding suggests that in fact, and as far as the core region is concerned, the conformational space to sample in model refinement is fairly small. The use of PCA directions thus appears as a promising technique to model the structural plasticity among homologous proteins, affording a very efficient sampling of the conformational space accessible to the protein core, and preliminary results indicate that PCA sampling is indeed very efficient (Qian et al., 2004). The physical origin of this low dimensionality in the evolutionary space seems to rest in the fact that motions allowing a degree of deformability in the structure that can accommodate different homologous sequences are those with sufficiently shallow energy increase when a distortion is imposed. We found these to be on the order of the ∼20 lowest frequency modes. That is, the fact that the evolutionary subspace overlaps significantly with the subspace spanned by the ∼20 lowest frequency modes imposed by the protein topology suggests that the evolutionary pathways of structural adaptation make use, to some extent, of combinations of a small number of low-frequency modes imposed by the topology. A corollary is that the protein topology could be an important factor determining the evolutionary history of proteins at the structural level. It remains to be seen whether or not the ANM normal modes, or similar approximations, are accurate enough to be used as surrogates of the PCA eigenvectors in protein modeling problems in those cases where the structural sampling of the family does not allow the derivation of reliable PCA directions. Nevertheless, our results lend support to recent proposals about the use of normal modes for solving difficult molecular replacement problems (Suhre and Sanejouand, 2004).
SUPPLEMENTARY MATERIAL
An online supplement to this article can be found by visiting BJ Online at http://www.biophysj.org.
Supplementary Material
Acknowledgments
This work was funded by grant BIO2001–3745 from the Spanish MCYT. A.L.M. is an FPI predoctoral fellow. D.L. is a predoctoral fellow of the PhD program of the Mount Sinai School of Medicine, New York. D.Z. is the recipient of a visiting fellowship from the Ecole Polytechnique (France). Research at Centro de Biología Molecular “Severo Ochoa” is facilitated by an institutional grant from Fundación Ramón Areces.
References
- Amadei, A., M. A. Ceruso, and A. Di Nola. 1999. On the convergence of the conformational coordinates basis set obtained by the essential dynamics analysis of proteins' molecular dynamics simulations. Proteins. 36:419–424. [PubMed] [Google Scholar]
- Atilgan, A. R., S. R. Durell, R. L. Jernigan, M. C. Demirel, O. Keskin, and I. Bahar. 2001. Anisotropy of fluctuation dynamics of proteins with an elastic network model. Biophys. J. 80:505–515. [DOI] [PMC free article] [PubMed] [Google Scholar]
- Bahar, I., A. R. Atilgan, and B. Erman. 1997. Direct evaluation of thermal fluctuations in proteins using a single-parameter harmonic potential. Fold. Des. 2:173–181. [DOI] [PubMed] [Google Scholar]
- Baker, D., and A. Sali. 2001. Protein structure prediction and structural genomics. Science. 294:93–96. [DOI] [PubMed] [Google Scholar]
- Berendsen, H. J., and S. Hayward. 2000. Collective protein dynamics in relation to function. Curr. Opin. Struct. Biol. 10:165–169. [DOI] [PubMed] [Google Scholar]
- Brenner, S. E., P. Koehl, and M. Levitt. 2000. The ASTRAL compendium for protein structure and sequence analysis. Nucleic Acids Res. 28:254–256. [DOI] [PMC free article] [PubMed] [Google Scholar]
- de Groot, B. L., S. Hayward, D. M. van Aalten, A. Amadei, and H. J. Berendsen. 1998. Domain motions in bacteriophage T4 lysozyme: a comparison between molecular dynamics and crystallographic data. Proteins. 31:116–127. [DOI] [PubMed] [Google Scholar]
- Delarue, M., and Y. H. Sanejouand. 2002. Simplified normal mode analysis of conformational transitions in DNA-dependent polymerases: the elastic network model. J. Mol. Biol. 320:1011–1024. [DOI] [PubMed] [Google Scholar]
- Ferrara, P., H. Gohlke, D. J. Price, G. Klebe, and C. L. Brooks 3rd. 2004. Assessing scoring functions for protein-ligand interactions. J. Med. Chem. 47:3032–3047. [DOI] [PubMed] [Google Scholar]
- Fiser, A., M. Feig, C. L. Brooks 3rd, and A. Sali. 2002. Evolution and physics in comparative protein structure modeling. Acc. Chem. Res. 35:413–421. [DOI] [PubMed] [Google Scholar]
- Hinsen, K. 1998. Analysis of domain motions by approximate normal mode calculations. Proteins. 33:417–429. [DOI] [PubMed] [Google Scholar]
- Johnson, R., and D. Wichern. 1998. Applied Multivariate Statistical Analysis. Prentice Hall, Upper Saddle City, NJ.
- Karplus, M., and J. A. McCammon. 2002. Molecular dynamics simulations of biomolecules. Nat. Struct. Biol. 9:646–652. [DOI] [PubMed] [Google Scholar]
- Kelley, L. A., R. M. MacCallum, and M. J. Sternberg. 2000. Enhanced genome annotation using structural profiles in the program 3D-PSSM. J. Mol. Biol. 299:499–520. [DOI] [PubMed] [Google Scholar]
- Keskin, O., S. R. Durell, I. Bahar, R. L. Jernigan, and D. G. Covell. 2002. Relating molecular flexibility to function: a case study of tubulin. Biophys. J. 83:663–680. [DOI] [PMC free article] [PubMed] [Google Scholar]
- Keskin, O., R. L. Jernigan, and I. Bahar. 2000. Proteins with similar architecture exhibit similar large-scale dynamic behavior. Biophys. J. 78:2093–2106. [DOI] [PMC free article] [PubMed] [Google Scholar]
- Kitao, A., and N. Go. 1999. Investigating protein dynamics in collective coordinate space. Curr. Opin. Struct. Biol. 9:164–169. [DOI] [PubMed] [Google Scholar]
- Koh I. Y., V. A. Eyrich, M. A. Marti-Renom, D. Przybylski, M. S. Madhusudhan, N. Eswar, O. Grana, F. Pazos, A. Valencia, A. Sali, and B. Rost. 2003. EVA: evaluation of protein structure prediction servers. Nucleic Acids Res. 31:3311–3315. [DOI] [PMC free article] [PubMed] [Google Scholar]
- Krebs, W. G., V. Alexandrov, C. A. Wilson, N. Echols, H. Yu, and M. Gerstein. 2002. Normal mode analysis of macromolecular motions in a database framework: developing mode concentration as a useful classifying statistic. Proteins. 48:682–695. [DOI] [PubMed] [Google Scholar]
- Langley, R. 1970. Practical Statistics. Simply Explained. Dover, New York.
- Levitt, M., M. Gerstein, E. Huang, S. Subbiah, and J. Tsai. 1997. Protein folding: the endgame. Annu. Rev. Biochem. 66:549–579. [DOI] [PubMed] [Google Scholar]
- Ma, J. 2004. New advances in normal mode analysis of supermolecular complexes and applications to structural refinement. Curr. Protein Pept. Sci. 5:119–123. [DOI] [PMC free article] [PubMed] [Google Scholar]
- Marti-Renom, M. A., M. S. Madhusudhan, and A. Sali. 2004. Alignment of protein sequences by their profiles. Protein Sci. 13:1071–1087. [DOI] [PMC free article] [PubMed] [Google Scholar]
- Marti-Renom, M. A., A. C. Stuart, A. Fiser, R. Sanchez, F. Melo, and A. Sali. 2000. Comparative protein structure modeling of genes and genomes. Annu. Rev. Biophys. Biomol. Struct. 29:291–325. [DOI] [PubMed] [Google Scholar]
- Murzin, A. G., S. E. Brenner, T. Hubbard, and C. Chothia. 1995. SCOP: a structural classification of proteins database for the investigation of sequences and structures. J. Mol. Biol. 247:536–540. [DOI] [PubMed] [Google Scholar]
- Ortiz, A. R., C. E. Strauss, and O. Olmea. 2002. MAMMOTH (matching molecular models obtained from theory): an automated method for model comparison. Protein Sci. 11:2606–2621. [DOI] [PMC free article] [PubMed] [Google Scholar]
- O'Toole, N., M. Grabowski, Z. Otwinowski, W. Minor, and M. Cygler. 2004. The structural genomics experimental pipeline: insights from global target lists. Proteins. 56:201–210. [DOI] [PubMed] [Google Scholar]
- Qian, B., A. R. Ortiz, and D. Baker. 2004. Improvement of comparative model accuracy by free-energy optimization along principal components of natural structural variation. Proc. Natl. Acad. Sci. USA. 101:15346–15351. [DOI] [PMC free article] [PubMed] [Google Scholar]
- Sanchez, R., and A. Sali. 1997. Advances in comparative protein-structure modelling. Curr. Opin. Struct. Biol. 7:206–214. [DOI] [PubMed] [Google Scholar]
- Shi, J., T. L. Blundell, and K. Mizuguchi. 2001. FUGUE: sequence-structure homology recognition using environment-specific substitution tables and structure-dependent gap penalties. J. Mol. Biol. 310:243–257. [DOI] [PubMed] [Google Scholar]
- Steinmetz, A. C., J. P. Renaud, and D. Moras. 2001. Binding of ligands and activation of transcription by nuclear receptors. Annu. Rev. Biophys. Biomol. Struct. 30:329–359. [DOI] [PubMed] [Google Scholar]
- Stewart, G. W. 1980. The efficient generation of random orthogonal matrices with an application to condition estimation. SIAM J. Numer. Anal. 17:403–409. [Google Scholar]
- Suhre, K., and Y. H. Sanejouand. 2004. On the potential of normal-mode analysis for solving difficult molecular-replacement problems. Acta Crystallogr. D Biol. Crystallogr. 60:796–799. [DOI] [PubMed] [Google Scholar]
- Temiz, N. A., E. Meirovitch, and I. Bahar. 2004. Escherichia coli adenylate kinase dynamics: comparison of elastic network model modes with mode-coupling (15)N-NMR relaxation data. Proteins. 57:468–480. [DOI] [PMC free article] [PubMed] [Google Scholar]
- Tirion, M. M. 1996. Large amplitude elastic motions in proteins from a single-parameter, atomic analysis. Phys. Rev. Lett. 77:1905–1908. [DOI] [PubMed] [Google Scholar]
- Tramontano, A., and V. Morea. 2003. Assessment of homology-based predictions in CASP5. Proteins. 53(Suppl. 6):352–368. [DOI] [PubMed] [Google Scholar]
- Valadie, H., J. J. Lacapcre, Y. H. Sanejouand, and C. Etchebest. 2003. Dynamical properties of the MscL of Escherichia coli: a normal mode analysis. J. Mol. Biol. 332:657–674. [DOI] [PubMed] [Google Scholar]
- van Aalten, D. M., D. A. Conn, B. L. de Groot, H. J. Berendsen, J. B. Findlay, and A. Amadei. 1997. Protein dynamics derived from clusters of crystal structures. Biophys. J. 73:2891–2896. [DOI] [PMC free article] [PubMed] [Google Scholar]
- Xu, C., D. Tobi, and I. Bahar. 2003. Allosteric changes in protein structure computed by a simple mechanical model: hemoglobin T↔R2 transition. J. Mol. Biol. 333:153–168. [DOI] [PubMed] [Google Scholar]
Associated Data
This section collects any data citations, data availability statements, or supplementary materials included in this article.


