

Abstract
In this article, we examine the mechanical role of the lipid bilayer in ion channel conformation and function with specific reference to the case of the mechanosensitive channel of large conductance (MscL). In a recent article we argued that mechanotransduction very naturally arises from lipid-protein interactions by invoking a simple analytic model of the MscL channel and the surrounding lipid bilayer. In this article, we focus on improving and expanding this analytic framework for studying lipid-protein interactions with special attention to MscL. Our goal is to generate simple scaling relations which can be used to provide qualitative understanding of the role of membrane mechanics in protein function and to quantitatively interpret experimental results. For the MscL channel, we find that the free energies induced by lipid-protein interaction are of the same order as the measured free energy differences between conductance states. We therefore conclude that the mechanics of the bilayer plays an essential role in determining the conformation and function of the channel. Finally, we compare the predictions of our model to experimental results from the recent investigations of the MscL channel by a variety of investigators and suggest a suite of new experiments.
INTRODUCTION
The mechanosensitive channel of large conductance (MscL) is a compelling example of the interaction of a membrane protein and the surrounding lipid bilayer membrane. MscL is gated mechanically (Blount and Moe, 1999) and belongs to a growing class of proteins which have been determined to be mechanosensitive (Gillespie and Walker, 2001; Hamill and Martinac, 2001). In a recent short article (Wiggins and Phillips, 2004), we have argued that the mechanics of the bilayer is an important partner in the phenomena of mechanotransduction and channel function. In particular, we considered a simplified model where only the radius of the channel changes in transitions between the open and closed states. In this article, we present our free energy calculations in more generality and detail. Specifically, we have calculated the free energy due to the bilayer deformation as a result of the presence of a membrane protein using an analytic model developed for the study of bilayer mechanics (Canham, 1970; Helfrich, 1973; Evans, 1974). Many of the theoretical techniques exploited here have already been used with success in describing the role of the bilayer in the mechanics of the Gramicidin channel (e.g., Huang, 1986). In this article, we have applied asymptotic approximations to the exact solutions of this model, permitting many of the important results to be expressed, estimated, and understood with simple scaling relations. These scaling relations are then applied to estimate the relative importance of each and every term in the bilayer free energy budget. We find that the bilayer deformation free energy can be of the same order as the free energy differences between conformational states of the MscL channel as measured by Sukharev et al. (1999). These results strongly suggest that bilayer deformation plays an important role in determining the protein conformation, and therefore function, of transmembrane proteins in general, and MscL in particular. Although we have explicitly estimated the size of the bilayer deformation energy exclusively for the geometry of MscL, the results can easily be re-evaluated and reinterpreted in the context of other transmembrane proteins and mechanosensitive channels, in particular: MscS (Bass et al., 2002), Alamethicin (Opsahl and Webb, 1994), etc.
We emphasize that our goal in this current work is not to attempt a quantitative understanding of all of the degrees of freedom of the channel and bilayer, but rather to build a tractable model for the role of bilayer mechanics in the function of the MscL channel, while developing the model in more detail than in our previous article (Wiggins and Phillips, 2004).
The MscL channel is gated by membrane tension and has been studied extensively in patch-clamp experiments (Sukharev et al., 1999; Perozo et al., 2002a). Although several substates have been identified (Sukharev et al., 1999), the channel typically resides in one of two primary conductance states. At low tension the channel is almost exclusively closed (C). As the tension is increased the open state (O) becomes ever more prevalent, until it dominates at high tension. Rees and co-workers have solved the structure for one conformation using x-ray crystallography which appears to be the closed state (Chang et al., 1998). The open state has been modeled by a number of groups (Sukharev et al., 2001; Betanzos et al., 2002; Perozo et al., 2002b).
The outline of the article is as follows. In Free Energy of the Bilayer-Inclusion System, we briefly discuss the bilayer model, presenting a table of results showing the relative importance of different free energy penalties for bilayer deformation, and then define the generalized forces we use to discuss the effects of bilayer deformation induced by protein conformational change. In Free Energy Estimates and Physical Interpretation, we estimate the sizes of the bilayer deformation energy and forces for MscL, give a brief physical discussion of mechanisms that give rise to the bilayer deformation energy, and discuss the scaling of these bilayer deformation energies. In Application to MscL Gating, we compare our predictions for a two-state MscL model to experimental measurements made by Perozo et al. (2002a,b), Powl et al. (2003), Yoshimura et al. (2004), and others. In the Appendix, we provide a unit conversion table, bilayer parameters, the full names of the lipids, detailed derivations, and a discussion of the approximations used.
FREE ENERGY OF THE BILAYER-INCLUSION SYSTEM
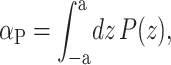
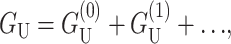
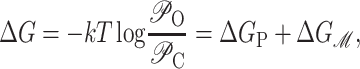
We begin by considering the free energy of the system as a whole: protein and bilayer. We assume that the system is in thermal equilibrium and define the free energy differences between states in the standard way as
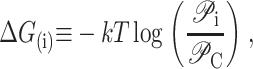 |
(1) |
where 𝒫i is the probability of state i and the free energy differences are defined with respect to the closed state. We can divide each of these free energies into two parts,
 |
(2) |
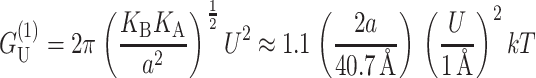
where GP is the free energy associated with the protein's conformation and Gℳ is the free energy induced in the bilayer by the protein inclusion and includes both a deformation free energy from the bulk of the bilayer and an interaction energy at the interface between the inclusion and bilayer. For the sake of brevity we will usually refer to both of these bilayer-related contributions to the free energy as the bilayer deformation energy. Although a complete understanding of channel gating and function must encompass knowledge of both components of the free energy, GP and Gℳ, our analysis in this article centers almost entirely on the bilayer deformation energy, Gℳ. Several groups have used molecular dynamics and related techniques to study GP or G in its entirety (Gullingsrud et al., 2001; Gullingsrud and Schulten, 2002, 2003; Bilston and Mylvaganam, 2002; Elmore and Dougherty, 2003) but as is often the case for biological systems, these studies have been handicapped by the size of the MscL system. It is too complex for direct simulation on biologically relevant timescales. From an experimental standpoint, Sukharev et al. (1999) have measured the free energy differences between different states in MscL and have found differences of order 10 kT. These results reveal the energy scale associated with MscL gating and provide a reference by which different contributions to the free energy will be judged for their importance.
Our first goal in what follows is to persuade the reader that Gℳ is large enough to be of interest. That is, since it is clear that there are several distinct contributions to the overall free energy budget, we illustrate that the contribution due to the inclusion-induced bilayer deformation is comparable to the measured free energy differences between states. Since these contributions to Gℳ are of the same order of magnitude as ΔG, we conclude that the effects of bilayer deformation are potentially interesting. Perozo et al. (2002a) have already answered this question experimentally, demonstrating that bilayer characteristics such as lipid acyl-chain length significantly affect the free energy.
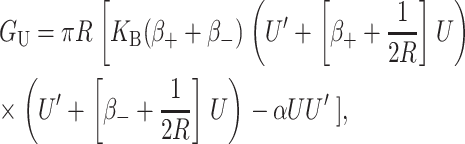
The calculation of the bilayer free energy
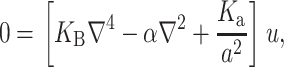
The elastic deformation of the bilayer surrounding the channel is approximated with a model developed by Canham (1970), Helfrich (1973), and Evans (1974). Huang (1986) has applied this model to calculate the deformation energies induced by inclusions. These calculations have been elaborated upon by others: notably by Andersen and co-workers (Nielsen et al., 1998; Lundbæk et al., 1996; Lundbæk and Andersen, 1994; Goulian et al., 1998) and Dan and co-workers (Dan et al., 1994, 1993; Dan and Safran, 1995, 1998). Specifically, Goulian et al. (1998) have studied a similar model including applied tension. The bilayer deformation energy in this model is given by
 |
(3) |
where
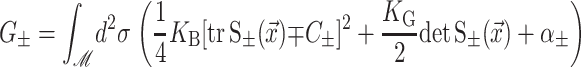 |
(4) |
and
 |
(5) |
G± are the free energies due to the curvature and the tension in the top and bottom surfaces of the bilayer and GI is the interaction free energy between these two surfaces. Locally, the curvature of the top (or bottom) surface of the bilayer is described by the shape operator,  , a rank-two tensor. The trace of this tensor is twice the mean curvature and its determinant is the Gaussian curvature. The energetic cost for increasing the mean curvature of the top (or bottom) surface of the bilayer is the bending modulus, KB/2. The energetic cost for increasing the Gaussian curvature of the top (or bottom) surface is the Gaussian bending modulus, KG/2. We have chosen this normalization so that the effective moduli for the bilayer as a whole are KB and KG.
The addition of certain surfactants and nonbilayer lipids results in the lowest energy conformation of a single layer of lipids being curved (Israelachvili, 1991; Gruner, 1989). This spontaneous curvature is introduced into the model through non-zero values of C±, the spontaneous curvatures of the upper and lower layers of the bilayer, respectively. We define the composite and the mean spontaneous curvatures for the bilayer as
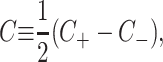 |
(6) |
 |
(7) |
respectively. The energetic penalty associated with changes in the area of the top and bottom surfaces of the bilayer are the tensions, α±, respectively. We assume that the tensions in the two layers are equal since, on long timescales, the lipids can switch between the two leaflets to equalize the tension. The total tension, α = 2α±, is an externally tunable parameter (see the Appendix for further discussion). The value 2u is the difference between the local thickness of the bilayer and the equilibrium thickness 2a. The energetic cost for changing the thickness of the bilayer is the compression-expansion modulus, KA. For further discussion of the model, the reader is invited to view the extensive discussions in the literature (Helfrich, 1973; Huang, 1986; Dan et al., 1994; Goulian et al., 1998; etc.)
The presence of the channel will perturb the bilayer locally. To calculate the perturbation to the free energy due to the channel, we will assume that the radius of curvature corresponding to the vesicle or cell in which the inclusion is embedded is very large in comparison to the length scale of the inclusion itself and that the perturbation due to the bilayer inclusion is small enough to allow the equations to be linearized. In this approximation scheme, the bilayer deformation energy is
 |
(8) |
where 𝒢 is the expanded effective free energy density (written out in its expanded form in the Appendix) and ℳ′ is a Cartesian plane minus a circular inclusion of radius R. We can safely integrate out to infinity since the perturbation to the free energy density is localized around the inclusion. To construct the effective free energy density we describe the out-of-plane displacements of the upper and lower surfaces of the bilayer with the functions  and
and  , respectively, on ℳ′, as shown in Fig. 1. It is more transparent to work with the linear combinations of these two functions (Fournier, 1999), namely,
 |
(9) |
 |
(10) |
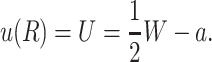
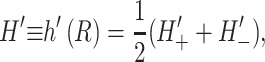
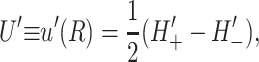
where h is the average position of the upper and lower surfaces of the bilayer which we will refer to as the midplane, and u is one-half the difference of the bilayer thickness and the equilibrium thickness. The overall structural picture is shown in Fig. 1 where the localized perturbation of the bilayer is depicted schematically.
FIGURE 1.

A schematic picture of the bilayer-inclusion model. The geometry of the inclusion is described by four parameters: the radius R, the thickness W, and the radial slopes H′± of the top and bottom surfaces of the bilayer, respectively. If the surfaces of the bilayer are locally normal to the interface of the inclusion, as depicted above, H′± = θ± in the small-angle approximation. The bilayer equilibrium thickness is 2a. The fields h ± (r) are the z displacements of the top and bottom surfaces of the bilayer, respectively. Their average is the midplane displacement, h(r), and half their difference is u(r) + a. The value u(r) is the local thickness deformation of a single leaflet of the bilayer. At the interface, twice this deformation, 2U, is the hydrophobic mismatch, W − 2a. The generalized forces on the inclusion induced by the bilayer are depicted for positive values. F is the expansion-compression force, α is the tension, τh is the midplane torque, and τu is the shape torque.
A minimization of the effective free energy (Huang, 1986) gives two decoupled differential equations (Fournier, 1999) for the equilibrium configuration in the fields  and
and  , namely,
 |
(11) |
 |
(12) |
which are again discussed at length in the literature (Huang, 1986; Nielsen et al., 1998; Fournier, 1999). The solution to these equations for the fields  and
and  can be written in terms of modified Bessel functions in cylindrical coordinates (Huang, 1986).
Due to the hydrophobic residues of the protein inclusion, we assume that the bilayer adheres to the external surface of the protein. As will be described in more detail below, the matching condition at this surface dictates half the boundary conditions for the bilayer (the remaining boundary conditions dictate that the bilayer is unperturbed at infinity). We consider proteins with azimuthal (cylindrical) symmetry. Although the MscL channel is not truly azimuthally symmetric, as a homo-pentamer, it is highly symmetric, at least in the closed state as the x-ray crystallography structure has demonstrated (Chang et al., 1998). To clearly distinguish values of the functions at the boundaries from the corresponding functions themselves, we will denote these parameters with capital letters. We fix the bilayer thickness, 2U + 2a, to match the hydrophobic thickness of the protein, W, at the interface, r = R,
 |
(13) |
2U is called the hydrophobic mismatch since it is the difference between the equilibrium thickness of the bilayer, 2a, and the thickness of the protein, W. For real proteins it is quite difficult to define exactly what one means by this region since real structures are not purely hydrophobic in the transmembrane region.
The closed state and a proposed model of the open state colored by hydrophobicity are depicted in Fig. 2.
FIGURE 2.

Models of the closed and open states colored by hydrophobicity (Sukharev et al., 2001). Although the general region spanned by the membrane is evident from the hydrophobic regions on the protein interface, it is difficult to precisely define the thickness of this region. A closed-state thickness has been inferred from the data of Powl et al. (2003) and this region is schematically marked on the model of the closed state. Additional confirmation of this estimate for the hydrophobic thickness comes from the simulation of Elmore and Dougherty (2003).
We also specify the radial derivatives of h± at the boundary as
 |
(14) |
or alternatively,
 |
(15) |
 |
(16) |
where ′ is the derivative with respect to r, the radial distance from the inclusion. A physical interpretation of these slopes might be to assume the bilayer's surfaces are normal to the protein's surface at the boundary, although this need not be the case (Nielsen et al., 1998). At infinity we assume that the bilayer is unperturbed which may be cast in mathematical terms as
 |
(17) |
 |
(18) |
Solving the equilibrium equations for a given set of boundary conditions and plugging these solutions into the surface integral for the bilayer deformation energy results in the bilayer deformation energy for a given configuration of the protein (Huang, 1986). Each protein configuration corresponds to a different outcome for the bilayer deformation energy. This energy has been divided into several contributions based on the physical mechanism giving rise to it. In Table 1, we present a summary of these results. Brief derivations may be found in the Appendix. Generally, the bilayer deformation energies lend themselves to simple scaling laws, except for two cases: thickness and midplane deformation. In these cases the exact results to the model are somewhat complicated and the results that appear in the table are limits which are derived and discussed in the Appendix.
TABLE 1.
Summary of results for inclusion-induced bilayer free energies
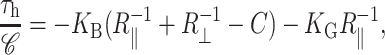
| Physical mechanism | Energy (GM) | For MscL |
|---|---|---|
| Areal deformation | GA = − α · A | 10 kT |
| Gaussian curvature | GG = −πKG(H′2 + U′2) | 1 kT |
| Spontaneous curvature |
GC = KB (CH′ +  ) · 𝒞 ) · 𝒞 |
10 kT |
| Bilayer interface | Gσ = σW · π | 10 kT |
| Midplane deformation* | 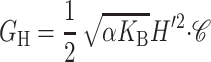 |
<kT |
| Thickness deformation* | 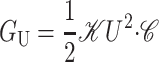 |
10 kT |
The free energies are written symbolically followed by an estimate of the size of the contribution to the nearest order of magnitude for a typical MscL system in patch-clamp experiments. In the following section more detailed estimates are made. The free energies have been factored to emphasize their radial dependence. Tension-like terms are proportional to the area, A ≡ πR2. Line-tension-like terms are proportional to the circumference, 𝒞 ≡ 2πR. 𝒦 is a composite elastic constant defined in Thickness Deformation. The value σ is an interface energy discussed in Bilayer Interface Energy.
Dominant scaling for asymptotic results.
Connection between H′± and channel geometry
Recall from the discussion above that the energetics of the composite system of the inclusion and the bilayer depends in part on the geometric parameters H′± that determine how the bilayer joins the protein at the interface. The appropriate bilayer slope boundary condition is still somewhat of an open question. Some authors have treated these conditions as free, minimizing the bilayer deformation energy with respect to them, whereas others have assumed that the bilayer surfaces are normal to the protein surface (see references in Nielsen et al., 1998). Most of our results will be expressed in terms of H′±, which is independent of any particular assumption about these boundary conditions, although we will assume the normal interface boundary conditions in our concrete physical discussions. We will also discuss the free boundaries briefly. If we assume that the midplane of the lipid bilayer interface is normal to the protein and that transmembrane domains M1 and M2 are rigid and aligned, this dictates that
 |
(19) |
 |
(20) |
This can be recast verbally as the statement that the top and bottom surfaces of the bilayer have the same slope at the boundary and there is no bend in the inclusion interface. In the small-angle limit, H′ can be replaced by the angle away from normal of the interface. If we do introduce a bend in the middle of the interface, the orientations of the upper and lower interfaces are independent. Assuming that the interface of the bilayer is normal to the protein surface, we can replace the slopes with the angles away from normal, θ± (Dan and Safran, 1998), in the small-angle limit, as pictured schematically in Fig. 1.
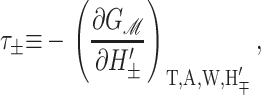
Forces, torques, and tensions
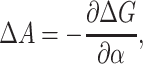
The physical effects of bilayer deformation on the inclusion conformation can be recast in a more intuitive form by appealing to forces, tensions, and torques rather than free energies. For example, most of the bilayer deformation energies will generate a tension on the interface due to their radial dependence. The applied tension, α, is not the whole story! The generalized forces are obtained by differentiating the bilayer deformation energy with respect to bilayer excursions. Implicitly, these generalized forces are defined through
 |
(21) |
where A ≡ πR2 is the area of the protein, H′± are the slopes of the bilayer surfaces at the interface, and W is the thickness of the hydrophobic region of the protein. Explicitly, these generalized forces may be written as
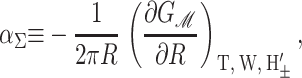 |
(22) |
 |
(23) |
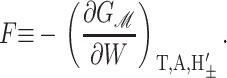 |
(24) |
Since we have already used α to denote the applied tension, we use αΣ to denote the net radial tension on the inclusion interface: the sum of the applied tensions and other bilayer deformation induced contributions. When the tension is positive, it is tensile. F is the compression-expansion force, normal to the plane of the bilayer, acting on the inclusion. When the compression-expansion force is positive, it acts to induce inclusion-thickness expansion. The values τ± are cylindrical torques acting on the top and bottom surfaces of the inclusion around the midplane. It will usually be more convenient to work with the torques complimentary to H′ and U′ rather than H′±. We define the midplane torque as the cylindrical torque on the interface as a whole:
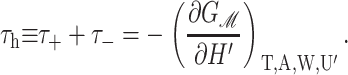 |
(25) |
When the midplane torque is positive, it acts to induce increases in the midplane slope. This cylindrical torque is generated by bending stresses alone and is therefore related to the principal curvatures at the boundary (Landau and Lifshitz, 1986) through the relation
 |
(26) |
where 𝒞 is the circumference of the inclusion, and  and
and  are the principal curvatures at the boundary of the midplane, in the directions parallel and perpendicular to the boundary, respectively. (For azimuthally symmetric surfaces the principal curvatures are always radial and azimuthal, and furthermore the azimuthal curvature is
  where r is the cylindrical radius, and θN is the angle of the upward surface normal away from vertical. For example, see Boal, 2002.) We can define the shape torque as the cylindrical torque complimentary to U′,
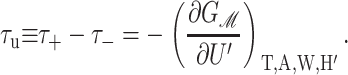 |
(27) |
When the shape torque is positive, it induces radial expansion at the midplane and radial compression at the outer surfaces of the bilayer. When the shape torque is negative, it induces radial compression at the midplane and radial expansion at the outer surfaces of the bilayer. The bending stress picture of the shape torque is somewhat more complicated than for the midplane torque due to the interaction between the two layers. The generalized forces are depicted in Fig. 1 for positive values and their physical interpretation and size are discussed in Free Energy Estimates and Physical Interpretation.
Relation between pressure gradients and generalized forces
Another way to recast the interaction between the membrane protein and the surrounding bilayer is by introducing the notion of pressure gradients. Cantor (1997, 1999) has made calculations of the out-of-plane pressure gradients in the bilayer. He has shown that the pressure is compressive in the middle of the bilayer and expansive near the surface. Cantor (1997) and de Kruijff (1997) have discussed the effects of this gradient on protein conformation. If the α-helices (MscL's transmembrane domains M1 and M2) can be interpreted (to a first approximation) as rigid, the effects of this pressure gradient are to produce a tension and cylindrical torques. The tension on the interface is the integrated bilayer pressure,
 |
(28) |
where z is the position in the bilayer, running from −a to a. This integrated tension must be the net tension αΣ. If we allow the inclusion to have a hinge at z = 0, cylindrical torques about this circumference are induced on each section of the inclusion (see Fig. 1). In the small-angle limit, these cylindrical torques are
 |
(29) |
 |
(30) |
where the torques have been defined to match our previous definitions in Forces, Torques, and Tensions, when the angles made by two surfaces of the interface, θ±, are defined such that
 |
(31) |
The τ±P must correspond to our τ±. The effects of the pressure gradient on our constrained system are neatly reduced to three of the generalized forces we have already discussed. The fourth force, F, is just the integrated shear stress.
FREE ENERGY ESTIMATES AND PHYSICAL INTERPRETATION
In Free Energy of the Bilayer-Inclusion System, we summarized the bilayer model and presented the lowest order contributions to the bilayer deformation energy in Table 1. The aim of the present section is to revisit each of these individual contributions to the overall free energy, estimate its magnitude for MscL, and discuss the scaling and physical mechanism giving rise to the bilayer deformation energy. To estimate the bilayer deformation energies, we need structural information for MscL. From x-ray crystallography data (Chang et al., 1998), in the closed state, MscL appears to have an external radius of ∼23 Å. Sukharev et al. (2001) have speculated that the open state's external radius is ∼35 Å. We use typical bilayer elastic parameters as summarized in the Appendix. In addition, the Appendix contains a brief discussion of the scaling of these parameters with bilayer thickness. Numerical results are multiplied by scaling relations to remind the reader what values have been used in their computation and how the free energies scale with changes in inclusion geometry, tension, etc.
Areal deformation
The areal deformation free energy is the dominant tension-dependent term and typically provides the mechanism for opening the MscL channel. The physical interpretation of this term is shown schematically in Fig. 3. The form of this contribution is well understood (for example, see Hamill and Martinac, 2001) and is analogous to the −PdV term for an ideal gas in three dimensions. For areal deformations, the bilayer lipids act like a two-dimensional gas with a free energy change given by
 |
(32) |
where α is the tension. At high tension, the open state is favored due to its larger area. Sukharev et al. (1999) have measured the opening tension to be α* = 1.2 pN Å−1. (The value α* is the tension at which the channel is open half the time. This tension will depend on the bilayer in which the channel is reconstituted but we use this number as the typical size of the opening tension.) The areal deformation energy is
 |
(33) |
and is plotted as a function of applied tension in Fig. 4. The way in which this free energy is expressed is to normalize the tension in units of the opening tension, α*, and the area in terms of the closed-state area, AC. As we expect, the typical free energies generated by radial changes are large. This is no surprise since the tension acts as the switch between the closed state and the larger open state. The most striking feature of this energy in comparison with those we will discuss below is its areal dependence. This free energy scales as the square of the channel radius, whereas almost all other contributions will approximately scale as the circumference. This scaling difference has important consequences for the stability of the conductance states and will give rise to a picture of the tension-induced opening of the channel much like the picture used to discuss nucleation of second phases. We have gone to some length to develop the importance of this scaling difference in our previous article (Wiggins and Phillips, 2004).
FIGURE 3.

A cartoon of areal deformation. Tension, represented by the arrows, is transmitted through the bilayer to the inclusion. For positive biaxial tension, radial expansion of the inclusion reduces the free energy of the bilayer. The vesicle or cell can be viewed as a bilayer reservoir where tension is the energetic cost per unit area of bilayer in the local system.
FIGURE 4.

The theoretical areal deformation free energies for the open (dashed line) and closed state (solid line) as a function of applied tension.
Experimental measurements have approximately confirmed the linear dependence of the free energy difference on tension (Sukharev et al., 1999). This would suggest that the open and closed states are relatively well defined, at least with respect to the channel radius. If the closed state, for example, actually consisted of a heterogeneous mix of states, this would lead the dependence of the free energy on tension to deviate from the linear relation predicted above. The fact that this has not been seen, indicates that well-defined states are compatible with experiment.
Gaussian curvature
Gaussian curvature normally contributes to the free energy topologically (independent of the local shape of the bilayer). However, at the inclusion, the bilayer has a boundary which will allow non-topological contributions to the free energy (E. Evans, personal communication). In the small-angle limit, the Gaussian curvature free energy is
 |
(34) |
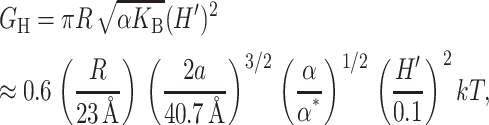
as demonstrated in the Appendix. Measurements of the Gaussian curvature modulus are compatible with a wide range of values: KG <− KB/2 (see references in Boal, 2002). We estimate that for MscL, the free energy contribution from the midplane slope is
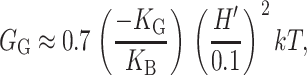 |
(35) |
where the deformation energy has been written in a dimensionless form in terms of the bending modulus, KB, the closed-state radius, and a modest interface angle of 0.1. (We expect the contribution from U′ to be of the same order.) We have chosen this small angle since a large tilt angle for the interface is not evident from the closed-state structure or the modeled open state (see Fig. 2).
As indicated above, the free energy is typically fairly small unless H′ or U′ are large. Since GG is radially independent, it induces no tension. On the other hand, Gaussian curvature does induce a torque of the form
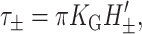 |
(36) |
which points toward H′± = 0 if KG < 0. The induced midplane torque is exactly what is expected from the bending stresses in Eq. 26.
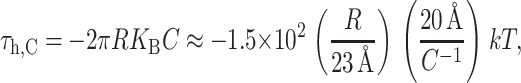
Spontaneous curvature
Spontaneous curvature arises from the addition of detergents and non-bilayer-forming lipids to the bilayer. These molecular additions cause the lowest energy configuration of a single layer of lipids to be curved. The general phenomenon of spontaneous curvature in lipid structures is reviewed by Gruner (1989). In general, measurements of the spontaneous curvature, C, have been for HII-phase-forming molecules where the positive spontaneous curvature can be deduced from the lattice structure (Gruner, 1989; Chen and Rand, 1997; Keller et al., 1993). Values of C−1 = 20 Å−1 (DOPE) are experimentally attainable (Keller et al., 1993). Less is known about negative spontaneous curvature, induced by micelle-inducing detergents and lysophospholipids. See Fig. 5 for a brief discussion of molecular shape and spontaneous curvature. To induce a composite bending modulus for the bilayer, the layers must be asymmetrically doped, although the molecules can exchange between the leaflets and move within a leaflet to energetically favorable locations caused by localized regions of high complementary curvature (de Kruijff et al., 1977; Kumar et al., 1989). For the sake of making an explicit estimate, we ignore these complications.
FIGURE 5.

A schematic depiction of molecular shapes which influence spontaneous curvature (Israelachvili, 1991). Molecules with a cylindrical shape, such as phospholipids, will assemble into bilayers. Cone shaped molecules, such as lysophospholipids will assemble into micelles, the lowest energy configurations. For our sign conventions, these cone-shaped molecules induce negative spontaneous curvature. Inverted cone-shaped molecules, such as cholesterol, DOPC, and DOPE assemble into HII phases (Gruner, 1989) and induce positive spontaneous curvatures. The size of the spontaneous curvature is thought to be related to the difference in size between the polar headgroup and the acyl tails. Figure adapted from Lundbæk and Andersen (1994).
In the linearized theory, the spontaneous curvature contributes an interface term to the free energy. In Fig. 6 an energetically favorable curvature is depicted. The free energy arising from spontaneous curvature is
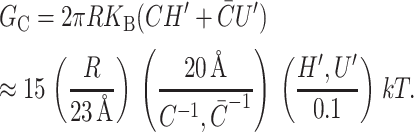 |
(37) |
These symbolic results are equivalent to those in Dan and Safran (1998) and are plotted in Fig. 7. To estimate the size of this contribution for MscL, we have written the free energy in a dimensionless form using the large positive spontaneous curvature of a DOPE monolayer (C−1 = 20 Å) (Keller et al., 1993), a relatively modest tilt angle (H′ = 0.1), and the closed-state radius. The prime notation is meant to denote that this estimate is for either these values of C and H′ or  and U′. The resulting free energy can be the same order of magnitude as the areal deformation energy, implying it may play an important role in channel function.
FIGURE 6.

A schematic depiction of spontaneous curvature induced by several species of lipids in the bilayer. The shaded lipids depict a nonbilayer lipid which induces positive spontaneous curvature. A tilted inclusion interface can lead to a reduction in the stress caused by the nonbilayer lipids as depicted above. Spontaneous curvature induces both torques and tension at the interface. For energetically favorable tilt, the tension acts to open the channel. The torque on the inclusion from a bilayer leaflet with positive spontaneous curvature acts to increase tilt by expansive pressure at the surface and compressive pressure at the midplane. When only one leaflet of the bilayer is doped, both a midplane and a shape torque are induced but they cancel for the undoped leaflet.
FIGURE 7.

The spontaneous curvature free energy as a function of the composite spontaneous curvature C for various midplane slopes. At the top we have shown the corresponding concentration ratio for the DOPE/DOPC system of Keller et al. (1993). For positive C, the bottom leaflet consists of pure DOPC and the top leaflet is a DOPE/DOPC mix with mole fraction x of DOPE. For negative C, the top leaflet consists of pure DOPC and the bottom leaflet is a DOPE/DOPC mix with mole fraction x′ of DOPE. We have plotted the free energy for a range of spontaneous curvatures that are larger than those that can be realized for DOPC/DOPE bilayers, since they may be relevant for other lipids or detergent-lipid bilayers.
Physically, the scaling can be easily understood with the example schematically illustrated in Fig. 6. A protein that has a conical shape, which increases toward the periplasm, induces membrane stress that may be relieved by complementary shaped lipids (which give rise to a positive composite spontaneous curvature) as illustrated in the figure. The bilayer illustrated in the figure also has positive mean spontaneous curvature ( ), which relieves the stress induced by the hourglass-shaped inclusion. This deformation energy is our first example of a line tension (a free energy with a linear radial dependence). This deformation energy is caused by interaction at the protein interface whose size is proportional to the interface area and therefore proportional to the radius of the inclusion. We have described in detail the significance of this linear dependence for mechanotransduction elsewhere (Wiggins and Phillips, 2004).
Spontaneous curvature gives rise to both a tension, due to the radial dependence of the free energy, and torques, due to the dependence of the free energy on H′ and U′. The tension on the boundary of the protein is
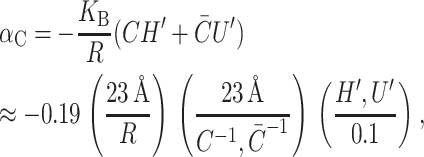 |
(38) |
where we have estimated the size of the induced tension by writing it in a dimensionless form using the same parameters as the deformation energy described above. This induced tension can have either sign, resulting in contributions that are either tensile or compressive. If curvature stress is relieved by spontaneous curvature, it is energetically favorable to increase the radius and the tension tends to open the channel, whereas if the curvature stress is increased by the spontaneous curvature, the tension will be compressive. The midplane torque is
 |
(39) |
which is again written in a dimensionless form as described above. The torque induces inclusion conformations that would allow energetically favorable bending as explained above and depicted in Fig. 6. The midplane torque is non-zero only for asymmetrically doped bilayers and its symbolic form matches the spontaneous curvature term deduced from bending stress in Eq. 26. The shape torque is
 |
(40) |
which, for positive mean spontaneous curvature, acts to compress the midplane and expand the outer surface region of the inclusion. (Again, we have written the torque in a dimensionless form, as described above.)
Keller et al. (1993) have studied the Alamethicin channel reconstituted into DOPC/DOPE bilayers. This is a particularly beautiful system since the spontaneous curvature of the mixed bilayer interpolates linearly with the relative concentration of the components, allowing a continuous range of spontaneous curvatures. The bilayers of Keller et al. (1993) are symmetric, implying that C = 0. In this case, the spontaneous curvature free energy is
 |
(41) |
(Dan and Safran, 1998), which would predict free energy differences between states to be linear in  , which Keller et al. (1993) have shown experimentally.
Bilayer interface energy
The bilayer and protein are glued together by hydrophobic-hydrophilic interaction forces which are strong enough to hold the protein in the bilayer at a typical cytoplasmic pressure of several atmospheres. It is natural to assume that in addition to the internal protein and bulk bilayer energies there will be an interaction term from the interface. There are many complicated scenarios which might be dreamed up, but the simplest is to assume that there is free energy proportional to the area of protein and bilayer in contact, resulting in a free energy
 |
(42) |
where W is the thickness of the hydrophobic region. The constant of proportionality, σ, is the interface energy and has units of energy/area. Thus far, we have concentrated exclusively on the bilayer bulk for two reasons: 1), the continuum model is almost certainly a reasonable approximate model for the processes of interest; and 2), the material parameters for the bilayer are known from earlier experiments (Rawicz et al., 2000). In contrast, little is known about the validity of this model for the interface nor is there any estimate for the size of σ, the interface energy. This class of interface terms gives rise to a tension and a compressive-expansive force:
 |
(43) |
 |
(44) |
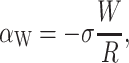
The effects of the tension and compressive force depend on the sign σ, the interface energy density. When σ is positive, the interface is minimized, leading to compressive forces. When σ is negative (the affinity of lipid and protein are high), the interface is maximized and the forces are expansive.
We have introduced this energy as a sanity check for our boundary conditions. We have somewhat naively assumed that the membrane adapts to an arbitrary protein shape. This assumption certainly fails when the adhesive forces attaching the membrane to the protein are not large enough to sustain the strain in the membrane. It is therefore useful to develop an approximate expression for these adhesive forces. We know the interface energy for a typical hydrophobic-hydrophilic mismatch (Hamill and Martinac, 2001) is
 |
(45) |
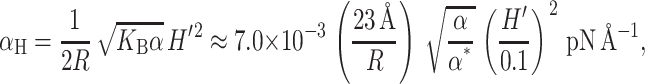
which is large compared to the other tensions in the problem. The compressive force countering the creation of this interface is
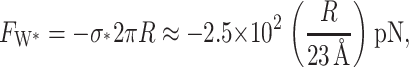 |
(46) |
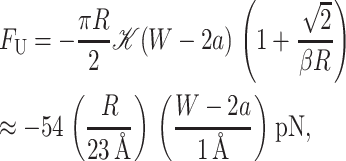
where we have used the closed-state radius to write the force in a dimensionless form. This force can be interpreted as the critical force required to strip the protein from the bilayer. As we have reasoned above, this force will be important when we consider the large deformation limit on forces and energies due to thickness deformation.
Midplane deformation
The free energy associated with the deformation of the midplane of the bilayer is another contribution in the overall free energy budget. These constant thickness deformations like those pictured in Fig. 8, are induced by conically shaped proteins. Midplane deformation contributes to the bilayer deformation energy through both bending of the bilayer and from a corresponding increase in bilayer area. The exact result to the linearized model is derived in the Appendix, but the dominant contribution at high applied tension is given by
 |
(47) |
where the parameters used to write the deformation energy in a dimensionless form are the closed-state radius, the opening tension, and a modest interface tilt angle (H′ = 0.1). The H′2 dependence of the midplane deformation energy is as one would expect since no bending corresponds to H′ = 0 and results in the minimum energy (in the absence of spontaneous curvature). Dan and Safran (1998) have discussed deformation energies with a similar dependence on H′, but with a different size and physical origin. Note that midplane deformation scales differently with the applied tension (α1/2) from the other contributions and can therefore be distinguished from the other bilayer deformation energies by measuring the tension dependence of the free energy.
FIGURE 8.

A conically shaped protein induces bilayer bending. To match a conical inclusion interface, the bilayer must deform. The deformation leads to energetic contributions both from an increase in bilayer area and from bilayer bending. Midplane deformation induces both a midplane torque and a tension. The tension is always compressive. The midplane torque acts to reduce interface tilt and restore the bilayer to its undeformed configuration. We estimate that the midplane deformation energy is probably not important for MscL gating.
The approximation we have used is not really valid for MscL at experimentally realizable tensions since the elastic decay length is given by
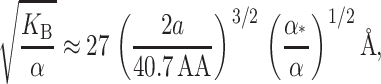 |
(48) |
where we have estimated the typical size of the decay length by writing it in a dimensionless form using the opening tension. (The size and scaling of the bending moduli are described in the Appendix.) This decay length is approximately the same size as the channel radius. At high tension this length scale is reduced thus improving the asymptotic result and also increasing the size of the energy. For MscL, unless the bending modulus is significantly softened, we are unlikely to be able to access this regime since the lysis tension for bilayers is typically not much more than α* (Olbrich et al., 2000). The scaling result we have derived overestimates the bilayer deformation energy. (See the Appendix for further discussion.) Both the exact result and asymptotic result are plotted as a function of applied tension in Fig. 9. Despite this overestimate, the energy is still small compared with the areal deformation, so we conclude that midplane deformation is probably not a key player in the free energy budget for MscL. This effect has also been explored in a recent article by Turner and Sens (2004).
FIGURE 9.

The midplane deformation energy is illustrated above as a function of tension. We have plotted the approximate scaling result (dashed line) discussed below, the exact result to the model (solid line) discussed in Calculation of Free Energy (see Appendix), as well as the areal deformation energy for the closed state, the opening tension α* (dotted line). All the energies are computed for the closed state using an unrealistically large midplane slope (H = 0.5) to exaggerate the effect. Although the scaling result is several kT larger than the exact result, it accurately reflects the scaling at high tension, and provides a limit for the exact result. The α1/2 dependence of the midplane deformation energy has not been observed experimentally.
The dominant term in the midplane deformation energy scales linearly with R since the area of the bilayer deformation is approximately proportional to the circumference. This radial dependence gives rise to a tension,
 |
(49) |
which acts to inhibit channel opening. For the typical constants chosen here, αH is about a hundredth of the opening tension, again confirming that the midplane deformation is probably not important for MscL conformation or function. Like the spontaneous and Gaussian curvature contributions, the midplane deformation also places a torque on the protein,
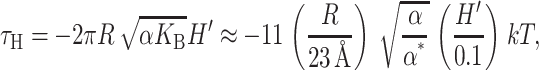 |
(50) |
which we have written in a dimensionless form as described above. This is a restoring torque toward the lowest energy configuration H′ = 0 (in the absence of spontaneous curvature).
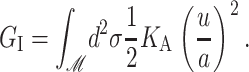
Thickness deformation
The free energy contribution from thickness deformation results from changes in the separation between the upper and lower surfaces of the bilayer induced by the hydrophobic mismatch between the inclusion and the bilayer. This effect is depicted schematically in Fig. 10. The energetic contribution from this mismatch can be quite significant. Bilayer thickness deformation has been studied by many authors: e.g., Mouritsen and Bloom (1984) and Huang (1986), and more recently by Nielsen et al. (1998) and Goulian et al. (1998). These authors have all solved the model exactly, but we introduce a large radius asymptotic expansion to significantly simplify our results. Expanding the exact solution of the model in powers of the radius gives
 |
(51) |
where  For MscL, the only important terms are the first two. In the Appendix we have plotted both the approximate and exact solutions to demonstrate that the interesting physics is captured by our approximations. Ignoring higher order terms, the resulting contribution is
 |
(52) |
where
 |
(53) |
FIGURE 10.

Bilayer thickness deformation due to a hydrophobic mismatch. To match the inclusion's hydrophobic boundary, the bilayer thickness must be deformed. Microscopically, the lipid tails are deformed as illustrated schematically above. The modulus for these deformations is KA. For large mismatches, the energy contribution from thickness deformation can be quite significant. We estimate that this energy is important for MscL gating. Thickness deformation induces a compression-expansion force, a tension, and a shape torque, which are also depicted above. The compression-expansion force acts to reduce the mismatch. The shape torque acts to induce interface tilt to reduce the bilayer bending. The tension generated by a mismatch is always compressive.
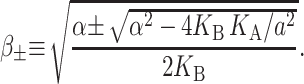
We can simplify this expression further by defining a low tension limit (Goulian et al., 1998),
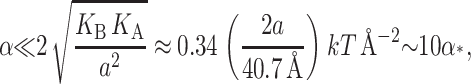 |
(54) |
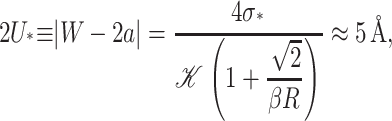
which is approximately satisfied for the critical tension measured by Sukharev et al. (1999). (See the Appendix for details about the scaling and size of the elastic moduli. The tension above has been put into a dimensionless form using the parameters for a PC lipid of acyl length 18.) One might worry that for small bilayer thickness the small tension limit would no longer be satisfied, but we will show that the opening tension is also reduced in this case. In the low tension limit, β± is
 |
(55) |
We will refer to β as the inverse decay length since it defines the length scale over which the thickness deformation perturbation decays. This length scale is given by
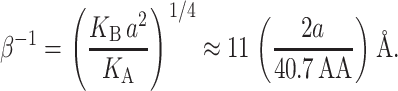 |
(56) |
This decay length defines the large radius limit, which is satisfied even for the closed state of MscL since RC > β−1.
The dominant contribution at large radius is  which corresponds to ignoring the curvature of the interface entirely (Dan et al., 1993). To estimate the typical size of this contribution, we set U′ = 0,
 |
(57) |
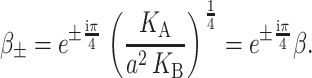
where we have written the deformation energy in a dimensionless form using the closed-state radius, a small mismatch (U = 1 Å), and the effective elastic modulus 𝒦, defined
 |
(58) |
This is the result listed in Table 1. Since large mismatches are possible and the deformation energy grows as the square of the mismatch, this contribution can be very significant. This U2 dependence, analogous to a linear spring, is exactly what we expect since the minimum energy occurs for a perfect thickness match between the protein and bilayer (U = 0). Mouritsen and Bloom (1984, 1993) were the first to discuss this dependence. Its phenomenological significance has been stressed by Lundbæk et al. (1996). The thickness deformation energy is a function of both KA, the local thickness deformation modulus, and the bending modulus, KB. Physically, KB provides a compatibility condition for adjacent lipids which sets the size of the deformed region. The thickness deformation energy is also approximately linear in R since the area of the bilayer deformed is approximately proportional to the channel circumference. The size of thickness deformation energy and its radial dependence imply that  is almost certainly important in the energetics of MscL. Unless both U′ and U are zero or cancel, this term will contribute due to the radial expansion of the channel between the closed and open states. Even if the height of the hydrophobic region were to remain unchanged, this contribution would still be very significant (see Wiggins and Phillips, 2004). Let us mention, as a brief aside, that the functional form of
  is a very pleasing result since, although the prefactor 𝒦 appears to depend on the bilayer width, a, it is approximately independent of a! Please see the Appendix for a brief argument. Because this scaling is not obvious and we will often use scaling arguments, we write the result in terms of 𝒦 to alleviate the temptation of thinking 𝒦 ∝ a−3/2.
One of the difficulties in implementing this model is the uncertainty concerning boundary conditions and in particular what slopes should be assigned for the bilayer-inclusion interface. One of the possibilities studied by other authors (Helfrich and Jakobsson, 1990), is to treat U′ as a free parameter and minimize the free energy with respect to it. In the asymptotic limit this calculation becomes very simple. Taking the low tension limit (α = 0), and choosing U′ to minimize  gives a free energy one-half that which is obtained by naively assuming U′ = 0, namely,
 |
(59) |
As a result, we argue that the qualitative conclusions—the importance of this correction—are indifferent to the particular choice made for this boundary condition, but quantitatively the choice of boundary conditions can have a significant effect.
Although  dominates at large radius, for MscL-like geometries,
  is approximately as large.
  which is radially independent, is
 |
(60) |
for U′ = 0, where the energy has been put in a dimensionless form using the closed-state radius, and a small mismatch (U = 1 Å). As can be seen above, for the closed state, this energy is almost as large as the dominant scaling term  and is also proportional to U2. In general, the effects of this term on channel gating are not as pronounced since it is radially independent and will not contribute a term to the free energy difference between the open and closed states proportional to ΔR. Likewise, it will not contribute to the tension. The asymptotic expressions for the thickness deformation energy are compared with the exact results to the linearized theory in Fig. 16 in the Appendix. We plot the thickness deformation energy for the closed state in Fig. 12, in the next section.
FIGURE 12.

Interface and thickness deformation energy of the closed state compared to experimental data from Powl et al. (2003) as a function of lipid bilayer thickness. The dot-dashed curve is the hydrophobic interface energy (GW) without thickness deformation (the limit is 𝒦 → ∞). The dotted curve is the exact thickness deformation energy (GU exact) without saturation. The dashed curve is the asymptotic thickness deformation energy (GU) without saturation (the limit is σ* → ∞). The solid curve is the saturating thickness deformation energy (GUW, see the Appendix for details). The o and + symbols are the experimental values measured by Powl and co-workers for TbMscL and EcoMscL, respectively. We have chosen the closed-state thickness of the channel (WC = 37.5 Å) to match the thickness of the bilayer at the minimum of the experimental bilayer deformation energy. This thickness is compatible with the known closed-state structure. For small mismatches there is a much better qualitative agreement between the thickness deformation energy than the hydrophobic interface theory. For large mismatch, the experimental data points are significantly smaller than the energy predicted by theory. We discuss this apparent discrepancy in the next section.
To develop physical intuition into how thickness deformation affects the channel conformation and function, we calculate the generalized forces induced on the inclusion. The tension is
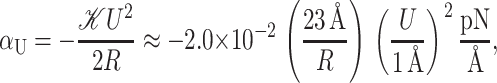 |
(61) |
which has been written in a dimensionless form as described above. The induced tension acts to close the channel. For a 1 Å mismatch, the tension is approximately a 60th of what Sukharev et al. (1999) measured for the opening tension, but for larger mismatches, the tensions can become comparable, significantly reducing the net tension or, at small enough applied tension, becoming the dominant contribution. Since tensions of this size are responsible for triggering the channel to switch from the closed to the open conformation, this calculation strongly suggests that the thickness deformation energy plays an important role in channel function and conformation. The thickness deformation also generates a shape torque,
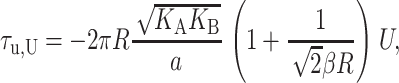 |
(62) |
when U′ = 0. We can estimate the dominant term at large radius,
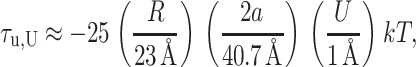 |
(63) |
which has been written in a dimensionless form as described above. The shape torque can be quite large for large mismatches. Its sign depends on the mismatch U.
Saturation of thickness deformation
Due to the quadratic dependence of the thickness deformation energy on mismatch, it is initially energetically favorable to deform the thickness of bilayer, rather than expose the hydrophobic region of the protein to the solvent. But, this quadratic dependence also implies that the energetic cost of further deformation will continue to grow, until, at a critical mismatch, it becomes more costly than exposing this added region to the solvent as depicted in Fig. 11. This critical mismatch is related to the compression force on the inclusion due to the thickness deformation. Recalling that U ≡ W/2 − a, the compressive force on the protein is
 |
(64) |
which has been written in a dimensionless form as described above. The change in the thickness deformation energy for increasing the hydrophobic region of the protein from W to W + dW is −FUdW, whereas to expose the added region to solvent results in an energy increase of −FW*dW. At the critical mismatch, these two forces are equal, as
 |
(65) |
Solving for 2U gives the critical mismatch of
 |
(66) |
which has been estimated for an acyl length 18 PC lipid bilayer and the closed-state radius. The details of the saturated thickness deformation energy are worked out in the Appendix. This saturated deformation energy is compared to the thickness deformation energy and experimental deformation energies measured by Powl et al. (2003) in Fig. 12. For large mismatch, there are discrepancies between the experimental data and all the theoretical models. It is unclear whether the lipid finds a more energetically efficient method for offsetting the mismatch. In principle, lipid packing calculations could answer these types of questions, but typically they are too constrained to capture this type of behavior. We shall return to this question in the next section.
FIGURE 11.

Bilayer thickness deformation saturates when the energy required to further deform the membrane is equal to the interface energy required to create a hydrophobic-hydrophilic interface. This failure of the bilayer to conform to the protein is depicted schematically above.
Over the course of this entire section, we have provided a term-by-term dissection of the various contributions to the free energy of deformation associated with channel gating. The main point of this exercise has been to provide a framework for thinking about the connection between ion channel gating and the corresponding perturbations induced in the surrounding lipid bilayer membrane.
APPLICATION TO MscL GATING
The conformational landscape of the MscL protein is certainly extremely complex, depending on a large number of microscopic degrees of freedom which are analytically intractable. Even from the standpoint of numerical calculations, this number is still very large (Gullingsrud et al., 2001). What is the point of examining what is presumably only half the story by treating the bilayer analytically? The purpose of this model is to pose a theoretical problem simple enough to be completely soluble, yet not so simple that it bears too little resemblance to the complex system it represents. By understanding the consequences of the simplest models, we develop a framework in which to understand the richer dynamics of the real system, whether approximated by molecular dynamics simulations or studied in experiments. There is a wealth of useful, physical intuition to be gleaned from this model relating to both the function of the mechanosensitive channel (MscL) and that of mechanosensitive transmembrane proteins in general.
As we have argued in the previous section, the bilayer deformation energy is comparable to the measured free energy differences between states for the MscL channel. Therefore the bilayer must play an important role in determining the free energy balance between states, altering the channel function. It is also likely that the forces generated by bilayer deformation can significantly perturb the conformation of the states themselves. Indeed, to the extent that membrane deformations induce conformational changes in the protein itself, the structure of the protein itself becomes lipid-context-dependent, complicating predictions. At present, we treat the protein as a black box which gives us a fixed geometry for state i described by the state vector Xi, and a protein conformational free energy, GP,i. As we have discussed above, the geometry of the channel in the ith conformational state is described by the radius (Ri), the hydrophobic thickness (Wi), and the two angular parameters that we usually interpret as the shape of the protein's interface ( Please see Fig. 1 and Connection Between H′± and Channel Geometry. These protein parameters are combined, for economy of notation, into the state vector Xi,
 |
(67) |
We assume these protein parameters are fixed by internal conformation and do not depend on the parameters of the bilayer membrane such as the lengths of the lipid tails or the concentration of spontaneous curvature inducing lipids, nor on the applied tension, α. We will call this simplified picture the static conformation approximation. Explicitly, we assume the free energy takes the form
 |
(68) |
for state i where GP,i and Xi are independent of the bilayer parameters and the applied tension.
In principle, we can try to determine the unknown state vectors, Xi, by varying the membrane parameters and the applied tension. Of course the primary advantage of the static conformation approximation is that it allows simple predictions to be made relating to the channel gating. This model is probably reasonable for relatively modest changes to the bilayer parameters provided that the free energy wells corresponding to the conductance states are relatively sharp and well defined with respect to changes in the state vector Xi.
Opening probabilities for two-state system
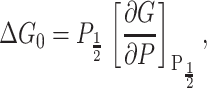
The difference in free energy between the open and closed states is defined as
 |
(69) |
where 𝒫i is the probability of state i, and Δ here is the difference between open and closed. Notice that this expression is independent of the free energies of the other states as a result of working with the ratio of the open and closed probabilities. For ease of interpretation, it is convenient to further subdivide the free energy by subtracting off the areal deformation contribution such that
 |
(70) |
where the  is the bilayer deformation energy less the areal contribution. Since we expect the only tension dependence to come from the linear areal deformation term, the measured ΔG should be linear in tension. What would a nonlinear behavior tell us? It would signal that there is additional tension dependence in the terms above. Provided that we are convinced the bilayer terms are correct, it would signal that the static conformation approximation is failing: the conformation of the state is tension-dependent! Data from Sukharev et al. (1999) have shown that ΔG is at least fairly linear in tension. Assuming that the linear dependence discussed above is correct, the slope with respect to tension of the free energy gives us the area change,
 |
(71) |
and the free energy can be written in a convenient form (Hamill and Martinac, 2001) as
 |
(72) |
where α1/2 is the opening tension (where the probability of being open or closed is equal) and is given by
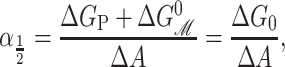 |
(73) |
where ΔG0 is the free energy change with the areal deformation contribution removed or alternatively the free energy difference at zero tension. When the free energy is written in terms of the opening tension (Eq. 72), it is clear that changes in the lipid parameters, such as the equilibrium thickness for example, lead to a simple offset of the opening tension, leaving the dependence of the ratio of open to closed probabilities versus applied tension otherwise unchanged, as Perozo et al. (2002a) have observed. This observed offset behavior is indirect evidence that the change in the area between the closed and open states is approximately independent of the bilayer parameters, implying that the open and closed states are fairly well defined, at least radially. In the rest of the article we will refer to ΔG0 as the free energy difference, dispensing with the subscript.
In patch-clamp experiments, the tension is controlled indirectly via the pipette pressure. The pressure and tension are related using Laplace's law,
 |
(74) |
where ℛ is the radius of curvature of the membrane patch. Typically it is assumed that this curvature is approximately constant during the experiment (e.g., Hamill and Martinac, 2001) which implies that opening pressure is proportional to the opening free energy,
 |
(75) |
where the derivative of G is expected to be constant since it is ΔAℛ/2.
Mismatch and gating
Before we begin our analysis in earnest, we wish to quickly remind the reader of the differences in the current model from that in our recent short article (Wiggins and Phillips, 2004). In our previous article we developed a simplified version of the model described above. The only geometrical change between the open and closed states was in the channel radius. In that model, the energetics of the bilayer deformation energy is one-dimensional and can be analyzed as a competition between the bilayer line tension and the applied tension (Wiggins and Phillips, 2004),
 |
(76) |
where f is the line tension and where the only free parameter is the effective thickness of the protein which we fit using the data of Perozo et al. (2002a). On the other hand, the simplifications associated with this model (i.e., we did not differentiate between the thickness of the open and closed states) leave it unable to reproduce the data of Powl et al. (2003) which essentially measures the bilayer deformation of the closed state. Despite this limitation, this simplest theory based upon the competition between the line tension and applied tension reveals that 1), the acyl-chain length dependence of the opening free energy as measured by Perozo et al. (2002a,b) is very naturally explained by the thickness deformation energy and can qualitatively explain that 2), spontaneous curvature could lead to open-state stabilization and that 3), the substates of the channel should be short-lived. In this section, we undertake a more quantitative analysis in which we allow the open and closed states to have different hydrophobic thicknesses.
In particular, we analyze the experimental data from three different classes of experiments in detail. First, we focus on the opening free energy measurements by Perozo et al. (2002a). Next, we analyze the lipid-MscL interaction data from Powl et al. (2003) and finally, we consider the recent mutation studies by Yoshimura et al. (2004), who altered amino acids in the transmembrane region of MscL. Note that we argue that our model should be viewed more as serving as an interpretive tool than as a scheme for fitting experimental data. As will be seen in the discussion to follow, the act of interpreting the data from these various experiments consistently suggests that the usual view of static protein structures that are lipid-independent may have to be amended.
Perozo et al. (2002a) have measured the opening free energy of the channel for three bilayers with acyl-chain lengths 16, 18, and 20. We will fix the thickness of the closed state (WC = 37.5 Å) based on experimental data from Powl et al. (2003) and corroborating computational evidence from Elmore and Dougherty (2003). This assignment seems reasonable based on the distribution of the hydrophobic residues in the closed-state crystal structure as illustrated in Fig. 2. We now vary the open-state thickness, WO, and compare the resulting opening free energy versus lipid acyl-chain length to the experimental data of Perozo et al. (2002a). Although Perozo and co-workers have measured the opening free energy for only three acyl-chain lengths, their electron paramagnetic resonance data suggests that even in acyl-chain length 10 lipid bilayers, the channel does not open spontaneously in the absence of applied tension. This qualitative information provides an additional constraint for the theory to satisfy (ΔG ≥ 0 for n ≥ 10). We find that for WO ∼36 Å, we have the best agreement with the experimental data. The comparison between the theoretical opening free energy and the measured values as a function of acyl-chain length is depicted in Fig. 13. Our fit with the experimental data is reasonable considering the complexity of the channel system and the naiveté of the static conformation model. The inability of the theory to fit the data exactly is to be expected from a model where the elastic constants have been fit to scaling laws and the subtle conformational changes of the protein are ignored. As noted earlier, we view our model as a framework for interpreting previous experiments and suggesting new ones, as well as for providing intuition, rather than as a fitting scheme. As is clear from the figure, it is quite difficult to satisfy both the large mismatch opening free energy for acyl length n = 20 and the constraint that the channel be closed (ΔG ≥ 0) for acyl length n ≥ 10. In light of the proposed structures for the open state (Sukharev et al., 2001; Betanzos et al., 2002; Perozo et al., 2002a,b), our predicted change in channel thickness is quite modest (see Fig. 2). An open state with a smaller thickness satisfies neither the large n- nor the small n-limits.
FIGURE 13.

The theoretical free energy difference compared to the experimental data of Perozo et al. (2002a) for different choices of the geometric parameters characterizing the open-state thickness. The thickness deformation energy is plotted for a closed-state thickness of WC = 37.5 Å and several different open-state thicknesses. Each curve is shifted to pass through the data point at an acyl-chain length of 16. An open-state thickness of WO ∼ 36 Å gave a reasonable fit to the experimental data. Perozo and co-workers also have electron paramagnetic resonance data for bilayers with acyl-chain lengths n ≥ 10, which suggest that the channel is closed (ΔG ≥ 0) in the absence of applied tension.
We must treat the predictions of the theory with care when the mismatch is large since the theoretically predicted bilayer deformation energies are probably large enough to lead to protein conformational changes, violating our static geometry approximation. That is to say, either or both the closed and open states of the protein deform significantly. This systematic uncertainty is not a peculiarity of our models but a quite general uncertainty. For example, it is unclear that the lysophosphatidylcholine (LPC) stabilized conformation observed by Perozo et al. (2002a,b) is in precisely the same conformation as the open state of the channel stabilized by applied tension, reconstituted in a PC18 bilayer. One experimentally accessible probe to conformational changes is a precise measurement of the applied tension dependence of the free energy difference between states. If the open and closed states are significantly perturbed by the applied tension, we would expect a deviation from the linear dependence (Eq. 71) of the free energy on applied tension. Alternatively, precise measurements of the area change between the open and closed states in different bilayers might show that the area change is lipid-context-dependent. We revisit the question of conformational changes below. At present, we conclude that experimental data of Perozo et al. (2002a,b) is compatible with the model. Due to both the approximate nature of the static geometry approximation and the systematic uncertainties inherent in patch-clamp measurements of channel opening free energies (E. Evans, personal communication), it is important not to place too high a premium on the precise fitting of the data of Perozo et al. (2002a).
A more direct experimental method for analyzing the free energy of the MscL closed state has been exploited by Powl et al. (2003). East, Lee, and co-workers (East and Lee, 1982; O'Keeffe et al., 2000; Powl et al., 2003) have developed Trp fluorescence spectroscopy to study lipid-protein interactions. Their technique measures the lipid-protein binding constant for channels reconstituted in liposomes. The log of this binding constant is the free energy difference between lipids at the boundary and lipids in the bulk of the bilayer (see Powl et al., 2003 for details). This free energy per lipid can then be converted into a line tension at the interface. Although this experimental technique provides a very direct measurement of the free energy per lipid, it is only sensitive to the free energy in the first layer of lipids surrounding the protein where there is direct interaction between lipid and protein. Powl et al. (2003) measure a minimum line tension for an acyl-chain length of 16, which approximately corresponds to a thickness of 37.5 Å. We assume that this chain length corresponds to zero mismatch, implying that the thickness of the closed state equals the equilibrium thickness of the bilayer,
 |
(77) |
We can now compute a theoretical line tension for the closed state as a function of acyl-chain length. In Fig. 14, we compare the experimental measurements of this line tension to the thickness deformation line tension predicted by theory. In the small mismatch regime, there is very reasonable agreement between theory and measurement. This is a nontrivial result, since, although we have fit the data to choose the minimum of the line tension, the curvature of the line tension (the second derivative with respect to the protein thickness) is predicted by the bending moduli of the membrane measured at very small curvature on micrometer-length scales! At large mismatch, the predictions of the theoretical model are significantly higher than the experimentally measured values.
FIGURE 14.

The theoretical line tension for MscL compared with the line tension estimated from the measurements of East and Lee (1982), O'Keeffe et al. (2000), and Powl et al. (2003). The experimental data for several different proteins has been aligned so that the minimum line tension is assumed to correspond to zero mismatch. In the small mismatch regime, there is very reasonable agreement between theory and the measurements. At large mismatch the story becomes more complicated. There is significant variation between proteins, and even between Eco and Tb MscL. These variations may signal conformational changes in the protein. The methods of East and Lee are only sensitive to the free energy in the first layer of lipids surrounding the proteins. It is therefore natural to expect the theoretical line tension to be larger than the measured line tension. We have plotted the saturating thickness deformation energy (GUW) for interface energies σ = ∞ (solid), σ = σ* (dotted), and σ = σ*/2 (dashed), because σ* probably underestimates the saturation effect since the interface of the bilayer which would initially be exposed to solvent is not extremely hydrophobic (e.g., White and Wimley, 1999).
There are several possible explanations for this discrepancy: 1), The predictions of the theory are too large for large mismatch signaling the onset of nonlinear elastic effects; 2), there are systematic problems comparing this competition assay to the deformation energy; or 3), conformational changes in the protein reduce the size of the mismatch. For the moment, let us assume that the theory is incorrect for large mismatch (1). If we use the measured line tension,  for a given mismatch, we can estimate the bilayer deformation free energy change between the open and closed states,
 |
(78) |
where the ′ is used to differentiate this computed free energy difference from that measured by Perozo et al. (2002a). ΔG′ can then be compared to the measured values of Perozo et al. (2002a) (ΔG) with the aim of examining the internal consistency of the model and both datasets. For WO = 36 Å, the free energies are presented in Table 2. Remember that the numbers from Perozo are the total free energy change between states, the sum of both the membrane and protein free energy changes, whereas those we have estimated from the data of Powl include only the membrane interaction term. As before we will assume that the conformation and energy of the protein are approximately static, independent of the bilayer lipid acyl-chain length. We therefore expect the free energy differences of Perozo and Powl to differ by a constant, corresponding to the protein conformational free energy difference, ΔGP. To eliminate the ΔGP contribution, we examine the relative changes in the opening free energy relative to the opening free energy for the acyl-chain length 16 bilayer,
 |
(79) |
TABLE 2.
Summary of the free energy differences measured by Perozo et al. (2002a) and those predicted from the line tension measured by Powl et al. (2003)
| n | ΔG (kT) | ΔΔG (kT) | ΔG′ (kT) | ΔΔG′ (kT) |
|---|---|---|---|---|
| 16 | 4 | 0 | 1.5 | 0 |
| 18 | 9.4 | 5.4 | 6.6 | 5.1 |
| 20 | 23.5 | 19.5 | 7.5 | 6 |
Note that n is the acyl-chain length, ΔG is the free energy differences between the open and closed state measured by Perozo et al., and ΔG′ is the deformation free energy difference predicted using the data of Powl et al. The relative free energy changes are defined ΔΔG ≡ ΔG − ΔG16 and ΔΔG′ ≡ ΔG′ − ΔG′16. (See the Appendix for more details on this calculation.)
The data of Powl et al. (2003) predicts the difference between the acyl-chain lengths 16 and 18 (ΔΔG18 ≈ ΔΔG′18) but fails spectacularly to predict the difference between the acyl-chain lengths 16 and 20 (ΔΔG20 ≠ ΔΔG′20). The agreement for small mismatch is no surprise since there is reasonable agreement between the measured line tension of Powl et al. (2003) and theory. But for large mismatch the measured line tension is just far too small to match the data of Perozo et al. (2002a). The reader may wonder whether this situation might be mitigated by changing the value of WO. However, it is very difficult to reconcile such small values of the line tension with the measured free energy differences of Perozo. Perhaps the most distinct characteristic of the data of East, Lee, and co-workers is the variation in the line tension for large mismatch between proteins and even between Eco and Tb MscL. This would seem to suggest, as they have speculated (Powl et al., 2003), that conformational changes in the protein (3, above) are the most attractive explanation for large mismatch dependence of the line tension. As we have already speculated, we expect the static conformation approximation to break down for large mismatch.
It is difficult to rule out that there may be systematic problems with comparing the results of this competition assay to theoretical estimates for a single component bilayer. The environment in the bulk of the mixed bilayer is different from that of a single component bilayer. Furthermore, for large mismatches, a very significant fraction of the deformation energy is not localized in the first ring of lipids surrounding the protein and hence, is not revealed in the measurements of Powl et al. We would expect these membrane-related systematic errors to be independent of the protein, in contrast to experimental observations. A much more meaningful comparison to the data of Perozo et al. (2002a) might be attempted if the same measurements were repeated for the MscL channel trapped in the open state (perhaps via crosslinking). This direct measurement of the bilayer interaction free energy would be a useful addition to the experimental story and provide a direct experimental test of our predicted value of the open channel thickness, WO.
In our previous article (Wiggins and Phillips, 2004) we proposed that the width of the hydrophobic region of the protein could be engineered to adjust the gating tension of the channel. Shortly after our article appeared, Yoshimura et al. (2004) published data describing precisely this type of experiment. Yoshimura and co-workers mutated residues in the hydrophobic region of the protein to hydrophilic asparagine and studied the gain/loss of function in the mutants. Single mutations were shown to possess significant loss-of-function phenotypes especially for mutations at the boundaries of the hydrophobic interface region of the channel. Yoshimura and co-workers also measured the relative increase in gating pressure, which is approximately proportional to the ratio of the opening free energies (see Eq. 75). Of the mutated channels that Yoshimura and co-workers were able to gate, there were mutations that gated at 1.5 times the wild-type pressure. The most severe loss-of-function mutations did not gate up to pressure of approximately twice the wild-type gating pressure. Theoretically, we can estimate the change in the opening free energy due to these alterations in the protein-lipid interface. For a small change in the hydrophobic width of the channel (dW = dWO = dWC),
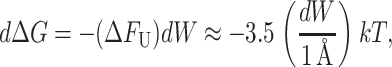 |
(80) |
for typical values (WO = 36 Å, WC = 37.5 Å, and n = 18). (Since these patch-clamp measurements were performed in spheroplasts rather than synthetic liposomes, the effective lipid parameters are unknown.) We expect the change in the opening tension to be approximately
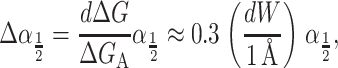 |
(81) |
where we used the same parameters as above to estimate the relative change in the opening tension. (Remember that the relative change in the opening tension and pressure will be the same if the patch radius is approximately constant.) The free energy changes corresponding to reducing the size of the hydrophobic interface of the protein by a few Ångstroms might energetically account for the observed increase in gating pressure and perhaps for those channels which did not gate. We hope to see this experiment repeated in synthetic liposomes where we would have more theoretical control of the system or alternatively studied with the methods employed by Powl et al. (2003) so that the change in the line tension for the closed state might be measured. We cannot rule out that more subtle mechanisms are responsible for the changes in the gating sensitivity. For example, in molecular dynamics simulations, Gullingsrud and Schulten (2003) have drawn attention to the significance of the region of the protein interface on which the tension is applied.
Computationally, thickness deformation of the membrane has been observed in molecular dynamics simulations performed by Elmore and Dougherty (2003). Their simulations of MscL in the closed conformation for lipid acyl-chain lengths 10–18 reveal that the lipids at the interface deform to offset the mismatch, at least in silico. Their simulations have also captured a complementary reduction in the protein hydrophobic interface thickness, a conformational change that violates our static conformation approximation (as well as the implicit static conformation approximation in Perozo et al., 2002b, or Sukharev et al., 2001), but which we have speculated may play a role in the discrepancy between our theoretical predictions and experimental measurements. This protein deformation could, in principle, be used to further generalize our analytic model, replacing the static conformation approximation with a model allowing protein deformation induced by the membrane, although the effective spring constant penalizing lipid-induced protein shape changes would need to be determined computationally. In fact, the spring constant for the closed state could be deduced from the data already provided by Elmore and Dougherty (2003). This more general model would be a natural extension to the model discussed here.
Spontaneous curvature and gating
Although we have discussed several quantitative studies of acyl-chain length versus free energy, the effects of spontaneous curvature on gating has, to our knowledge, only been studied by Perozo et al. (2002a,b). Perozo and co-workers have shown that bilayers asymmetrically doped with LPC, a spontaneous-curvature-inducing surfactant, can stabilize the open state in the absence of tension. In our recent article (Wiggins and Phillips, 2004) we showed that spontaneous-curvature-induced line tension could result in precisely this effect. However, we have been unable to make a quantitative analysis of this idea since the opening free energy has not been measured as a function of LPC concentration (see predictions in Fig. 7). We expect the concentration-dependence of the free energy difference to be linear in LPC concentration. More complicated scenarios are also possible. If the interface tilt is induced by LPC, we would expect an approximately quadratic rather than linear dependence on LPC concentration.
CONCLUSION
The MscL channel is an appealing system in which to study lipid-protein interactions since its function is to couple tension in the lipid membrane to protein conformation. During the gating transition, the channel undergoes a very large conformation change, dramatically expanding radially and leading to a significant local rearrangement of the lipid bilayer. The deformation free energies induced by this rearrangement and their role in channel gating has been the focus of this article. Although many uncertainties remain, we believe the start of a consistent story has begun to emerge from experiment. Indeed, we speculate that the framework described here might prove useful in analyzing the function of any ion channel whose gating leads to perturbations in the surrounding membrane.
Our goal in this article has been to build an analytic framework in which to provide quantitative interpretation and compare experimental results on MscL gating. To that end, we have expanded and improved upon an existing simple analytic membrane-protein model and applied it to mechanotransduction and the MscL system.
In Free Energy Estimates and Physical Interpretation, we estimated the size of various contributions to the deformation energy of the membrane and have discussed the scaling of these contributions. In Application to MscL Gating, we showed how this model, when coupled with a simple two-state static conformational model of the MscL channel, qualitatively and quantitatively agrees with nearly all of the experimental features of channel gating, although one important geometrical parameter, the open-state thickness of the protein, must still be fit. As part of our analysis, the model suggests that the assumption that protein conformational states are independent of their lipid context (such as the lengths of the lipids that the channel is reconstituted in) is perhaps not borne out experimentally, making structural models of gating even more subtle. Beyond the interpretation of existing experimental data, we have proposed a number of experiments which we believe will further elucidate the mechanisms of channel gating. Specifically, additional experiments analogous to those performed by Powl et al. (2003) with the channel locked into the open state could provide topical information about the conformation of the open state and its interaction with the membrane. Such data, when combined with the data already available for the closed state, would allow a direct comparison to the gating free energies measured by Perozo et al. (2002a) and a test of our predictions of how the free energy depends on the geometry of the open state. We still believe that a more controlled version of the experiments performed by Yoshimura et al. (2004), when combined with careful modeling, would allow the sensitivity of the channel to be tuned by changing the size of the hydrophobic interface. We hope that these experiments will be repeated in synthetic liposomes where the theoretical model is easier to apply. Finally, we suggest the need for a detailed test of the static conformation approximation by a careful measurement of the area change between states as a function of both applied tension and acyl-chain length. We hope that the approximations developed in this article will be useful in precisely formulating quantitative experimental questions.
Acknowledgments
Note added in proof:
A recent article by Markin and Sachs (2004) addresses some of the aspects of mechanosensation we have discussed in this article. Unfortunately, their article came to our attention too late to be cited directly in the text.
We are grateful to Doug Rees, Tom Powers, Jané Kondev, Klaus Schulten, Sergei Sukharev, and Evan Evans for useful discussions, suggestions, and corrections.
We also acknowledge support from National Science Foundation grant No. CMS-0301657 and the National Science Foundation-funded Center for Integrative Multiscale Modeling and Simulation as well as the Keck Foundation. P.A.W. acknowledges support through a National Science Foundation fellowship.
APPENDIX
Units and conversions
Throughout the article, we use kT at T = 300 K as our energy scale and Å as our fundamental length scale. Tension is in units of pN Å−1. This table provides the conversion to real-life units:
 |
(82) |
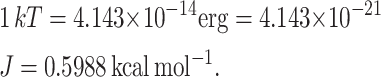 |
(83) |
 |
(84) |
 |
(85) |
 |
(86) |
Bilayer parameter model
We recommend Rawicz et al. (2000) (from which we have taken the table below) for a brief review of the mechanics of bilayers. There is a subtlety which we have not discussed in the article relating to the difference between peak-to-peak headgroup thickness which is measured from x-ray crystallography and mechanical thickness—that portion of the tail of the lipid which is deformed. The mechanical thickness of the bilayer is ∼1-nm less than the peak-to-peak thickness (Rawicz et al., 2000). When we discuss the scaling of the moduli, it is this thickness that we really consider. This uncertainty is compounded by the question of how this thickness relates to the hydrophobic thickness of the bilayer. The thickness of the interface between the hydrophobic region and the hydrophilic region is also difficult to define (White and Wimley, 1999). The MscL protein itself does not really have a sudden transition between hydrophobic residues and hydrophilic ones, meaning that one cannot really start with the structure and say definitively what the hydrophobic thickness is. This model is at best a caricature which attempts to capture the essential mechanics and it is for this reason we have not tried to differentiate between all these different thicknesses and replaced them all with a single approximation.
Having taken this Spartan view of the bilayer, we assume the bilayer acts as if there were only one elastic constant governing its behavior, the (effective) Young's Modulus of the lipid tails,
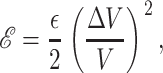 |
(87) |
where ℰ is the elastic energy density, V is the volume, and ε is the Young's modulus. The only length scale for the bilayer is its thickness 2a, so all the rest of the elastic moduli for the bilayer scale with ε and the number of powers of a are required to get the right units. These dimensional analysis arguments predict
 |
(88) |
 |
(89) |
 |
(90) |
This is an approximate scaling, not a physical law, but it is sufficient for our calculations (see Fig. 15). For a more rigorous argument and experimental results, see Rawicz et al. (2000). Table 3 gives the measured values for the elastic constants of a typical bilayer taken from Rawicz.
FIGURE 15.

Accuracy of lipid model. In the top panel, we plot lipid bilayer thickness versus acyl-chain width. There is reasonable agreement between the linear fit and the data, provided that the lipid is not polyunsaturated. In the bottom panel the effective spring constant 𝒦 is plotted versus lipid bilayer width. 𝒦 is approximately independent of the bilayer thickness. All data is from Rawicz et al. (2000).
TABLE 3.
Summary of the standard lipid parameters
| Lipid* | Length (atoms) | 2a (Å) | KA (kT/Å2) | KB (kT) |
|---|---|---|---|---|
| diC13:0 | 13 | 34.1 ± 0.5 | 0.576 ± 0.03 | 14 ± 2 |
| diC14:0 | 14 | 35.2 ± 0.6 | 0.565 ± 0.05 | 14 ± 2 |
| C18:0/1 | 18 | 40.7 ± 0.6 | 0.568 ± 0.03 | 21 ± 2 |
| diC18:1c9 | 18 | 36.9 ± 0.4 | 0.638 ± 0.04 | 20 ± 2 |
| diC18:2 | 18 | 34.9 ± 0.3 | 0.596 ± 0.05 | 10 ± 2 |
| diC18:3 | 18 | 34.3 ± 0.6 | 0.588 ± 0.08 | 9.3 ± 1 |
| diC20:4 | 20 | 34.4 ± 0.7 | 0.603 ± 0.02 | 10 ± 1 |
| diC22:1 | 22 | 43.7 ± 0.5 | 0.634 ± 0.02 | 29 ± 3 |
The data is from Rawicz et al. (2000). kT for T = 300 K. Length is the number of carbon atoms that comprise each of the two tails. The full names of the lipids are: 1,2-ditridecanoyl-sn-glycero-3-phosphocholine (diC13:0); 1,2-dimyristoyl-sn-glycero-3-phosphocholine (diC14:0); 1-oleoyl-2-stearoyl-sn-glycero-3-phosphocholine (C18:0/1); 1,2-dioleoyl-sn-glycero-3-phosphocholine (diC18:1c9); 1,2-dilinoleoyl-sn-glycero-3-phosphocholine (diC18:2); 1,2-dilinoleoyl-sn-glycero-3-phosphatidylcholine (diC18:3); 1,2-diarachidonoyl-sn-glycero-3-phosphocholine (diC20:4); 1,2-dierucoyl-sn-glycero-3-phosphocholine (diC22:1). For estimates of bilayer half thickness as a function of acyl-chain length, we have fit the peak-to-peak headgroup separation to acyl-chain length for the saturated lipids above. We have used the relation: 2a = 1.3n + 16.6 Å, (136), but slightly more elaborate formulas have been discussed in Bilayer Interface Energy. When discussing the lipids used by Perozo we have used the same naming convention he employed: PC12 (12:0 dilauroyl-phosphatidylcholine), PC10 (10:0 dicaproyl-phosphatidylcholine), PC16 (16:1 dipalmitoleoyl-phosphatidylcholine), PC18 (18:1 dioleoyl-phosphatidylcholine), and PC20 (20:1 eicosenoyl-phosphatidylcholine).
Indicates the lipid numbers used for standard values in calculations.
For estimates of bilayer thickness as a function of acyl-chain length, we have fit the peak-to-peak headgroup separation to acyl-chain length for the saturated lipids above as shown in Fig. 15. We have used the relation
 |
(91) |
although slightly more elaborate formulas are offered in Rawicz et al. (2000). When discussing the lipids used by other authors, we have used the same naming convention they employed: PC12 (12:0 dilauroyl-phosphatidylcholine), PC10 (10:0 dicaproyl-phosphatidylcholine), PC16 (16:1 dipalmitoleoyl-phosphatidylcholine), PC18 (18:1 dioleoyl-phosphatidylcholine), PC20 (20:1 eicossenoyl-phosphatidylcholine), PE (18:1 dioleoyl-phosphatidylethanolamine), LPL (lysophospholipid), LPC (lysophosphatidylcholine), DOPC (dioleoylphosphatidylcholine), and DOPE (dioleoylphosphatidylethanolamine).
Effective free energy density
The mean curvature contributions to the free energy density are
 , ,
|
(92) |
where the variation of the ℳ terms contribute to the action in the bulk (bilayer), the ∂ℳ terms are total derivatives and can be evaluated at the interface, and constant terms are dropped. The Gaussian curvature contributes only at the boundary, not in the bulk, and will be calculated exactly below. The tension contributions to the free energy density are
 , ,
|
(93) |
where, as before, the variation of the ℳ terms contribute to the action in the bulk (bilayer). The interaction free energy density is
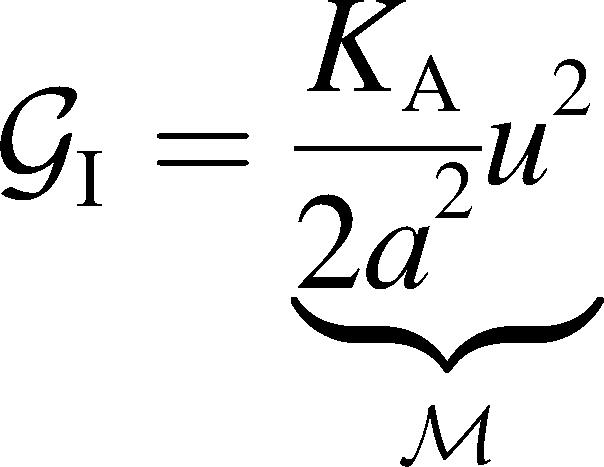 . .
|
(94) |
Equilibrium equations and solutions
The equations that result from the variation of u and h are
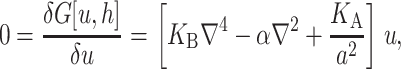 |
(95) |
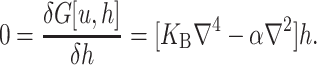 |
(96) |
One Laplacian can be dropped from the equation for h and amounts to the freedom for rotations of the bilayer in the x,z and y,z planes and displacements along the z axis. We choose a configuration by specifying the equilibrium position of the plane. Assuming cylindrical symmetry, these equations are satisfied by the modified Bessel function K0 as
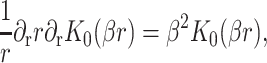 |
(97) |
resulting in the solutions
 |
(98) |
 |
(99) |
where β± and βH are given by
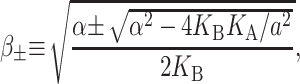 |
(100) |
 |
(101) |
where the branch cuts for the square-roots are along the negative real axis. β± need not be real and in fact if
 |
(102) |
the β± are complex, and u oscillates as it decays. The boundary conditions can be used to determine the constants A± and B as
 |
(103) |
 |
(104) |
where
 |
 |
For large z, the Bessel functions can be replaced by their asymptotic approximation as
 |
(105) |
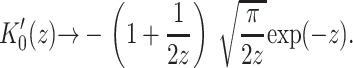 |
(106) |
The relevant length scale for u is the decay length for thickness deformation,
 |
(107) |
Since the decay length is shorter than the channel radius, we can expand our results in βR. By way of contrast, the length scale for midplane deformation is typically much larger since the restoring force, in the form of the tension, is relatively weak,
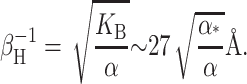 |
(108) |
At low tension the length scale is even larger. Fortunately we will see that when the analytic approximation breaks down, the midplane energy is irrelevant in comparison with the other contributions anyway.
Calculation of free energy
Except for the areal deformation term, the free energy can be calculated on the boundary by integrating by parts
 |
(109) |
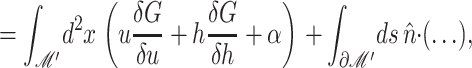 |
(110) |
where the variations in the integral over the bilayer ℳ are zero since the equations for equilibrium are satisfied. The surface integrals come from integration by parts. The spontaneous and background curvature contributions are
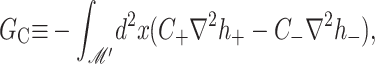 |
(111) |
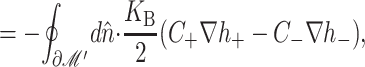 |
(112) |
 |
(113) |
The energy contributions from thickness deformations of the bilayer are
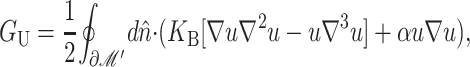 |
(114) |
 |
(115) |
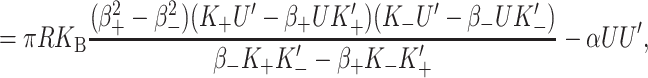 |
(116) |
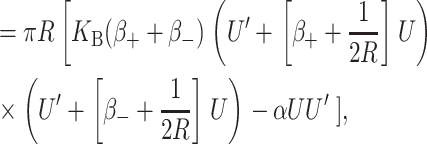 |
(117) |
where GU contains all the free energy terms in u except those proportional to C± and the asymptotic approximation has been used in the last line of the derivation. Consider the simple limit when U′ = 0, namely,
 |
(118) |
where we have discarded terms in lower powers of R. To address the validity of this approximation, we compare this result with the exact result. We make the radius dimensionless using the inverse decay length in the low tension limit
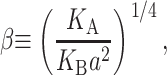 |
(119) |
 |
(120) |
We define a dimensionless thickness deformation free energy as
 |
(121) |
The exact result and the approximation are compared in Fig. 16.
FIGURE 16.

Validity of asymptotic approximation for dimensionless thickness deformation free energy. The curves above depict the difference between the exact result (Eq. 116, solid curve), the asymptotic expansion (Eq. 118, dashed curve), and the dominant scaling result (shown in Table 1, dotted curve). There is excellent agreement between the approximate result and exact result for radii relevant for MscL: 
The free energy associated with the deformation of the midplane is
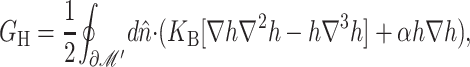 |
(122) |
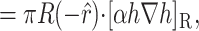 |
(123) |
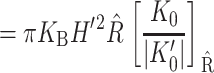 |
(124) |
where  The last line is the exact result of the model. If we apply the asymptotic approximation, the result reduces to
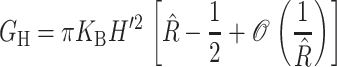 |
(125) |
The asymptotic approximation is violated for small tensions but the result is typically acceptable since the relative error in the energy when the tension is small is irrelevant. The prefactor is typically less than a kT and as can be seen in Fig. 17 the error is, at most, one-half this prefactor. We define a dimensionless midplane deformation free energy as
 |
(126) |
FIGURE 17.

Validity of asymptotic approximation for dimensionless midplane deformation free energy (Eq. 126). The curves above depict the difference between the exact result (Eq. 124, solid curve), the asymptotic expansion (Eq. 125, dashed curve), and the dominant scaling result (Table 1, dotted line). For MscL the prefactor πKBH′2 is typically <1 kT, implying that the greatest error (when the tension is 0) is a fraction of a kT at most.
The dimensionless energy defined above is compared with the approximate value in Fig. 17.
The Gaussian curvature contribution can be calculated exactly and has no local effect because it is related to a well-known topological invariant, the Euler Characteristic,
 |
(127) |
where det S is the Gaussian curvature and
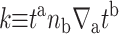 |
(128) |
is the curvature of the boundary where  is the unit tangent on the boundary and
  is the outward pointing unit normal to the boundary. See Polchinski (1998), for example. In terms of the Euler Characteristic, the Gaussian curvature contribution is
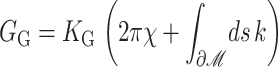 |
(129) |
The value χ depends on membrane topology alone and can be dropped since changes in protein conformation do not effect the membrane topology. The Gaussian bending energy is therefore exactly
 |
(130) |
where θ is the angle of the bilayer away from horizontal at the interface. For the bilayer model in the small-angle approximation, this is
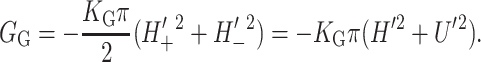 |
(131) |
The Gaussian curvature contribution induces bending of the protein to relieve the bending of the bilayer. Existing measurements are consistent with
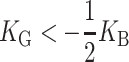 |
(132) |
(see Boal, 2002, for references), but we will assume that the magnitudes are similar. If this is the case, none of these corrections is particularly relevant for MscL.
Finally we calculate the areal deformation term. Before explaining the calculation, let us define precisely what we mean by the tension. The tension we are discussing is the applied tension, not a surface tension. Changes in the inclusion conformation do not effect the area of the bilayer; it is assumed that there is some small change in the global conformation which absorbs this area change. Furthermore these conformational changes do not change the tension since we assume that the bilayer is much larger than the size of the inclusion. Since the area of the bilayer is essentially fixed—at least the number of lipid molecules in the bilayer is fixed—the tension we discuss here is the applied tension rather than a surface tension.
The global conformation of the bilayer acts as a bilayer reservoir. The free energy cost for increasing the bilayer area of our small system is
 |
(133) |
where the change in the proteins area is minus that of the bilayers. As mentioned above we assume that the reservoir is large enough that changes in the protein conformation have no effect on the tension.
Saturation of thickness deformation
If the mismatch 2|U| is <2U*, then the mismatch is entirely absorbed by thickness deformation. The maximum thickness deformation free energy, corresponding to a mismatch of 2U*, is
 |
(134) |
evaluated for the closed state. For larger mismatches, 2U* is absorbed by the thickness deformation whereas 2(|U| − U*) is exposed to the solvent. The combined interface and thickness deformation free energy for |U| > U* is
 |
(135) |
This correction does not dramatically effect the qualitative picture of the thickness deformation discussed above. In fact, in Fig. 12 we have plotted the deformation energies for interface energy alone, thickness deformation alone, and the corrected thickness deformation to show that for the range of bilayer widths of interest in this problem, there is little difference between thickness deformation and the corrected thickness deformation, whereas ignoring thickness deformation altogether in favor of interface energy alone results in a significant error.
Details of the Perozo versus Powl comparison
Below we have estimated the bilayer deformation energy based on the EcoMscL data of Powl et al. (2003). For the closed states, we have simply used the values measured by Powl and co-workers. For the open state, we have used a fixed value of WO listed below and estimated the mismatch. From the mismatch, we have reinterpreted the data of Powl et al. (2003) as a function of mismatch (see Fig. 14) to estimate the line tension. From the line tensions, we then compute the deformation energy difference (ΔG ≡ 2π[fORO − fCRC]). These computations appear in Table 4.
TABLE 4.
Details of the computation for the comparison between the data of Perozo and Powl; see the Appendix
| n | 2a (Å) | UO (Å) | UC (Å) | fO (kT nm−1) | fC (kT nm−1) | ΔG (kT) |
|---|---|---|---|---|---|---|
| WO = 28.0 Å | ||||||
| 16 | 37.4 | 4.7 | 0.0 | 0.93 | 0.0 | 20 |
| 18 | 40.0 | 6.0 | 1.3 | 1.1 | 0.15 | 22 |
| 20 | 42.6 | 7.3 | 2.6 | 1.2 | 0.7 | 16 |
| WO = 36 Å | ||||||
| 16 | 37.4 | 0.7 | 0.0 | 0.07 | 0.0 | 1.5 |
| 18 | 40.0 | 2.0 | 1.3 | 0.4 | 0.15 | 6.6 |
| 20 | 42.6 | 3.3 | 2.6 | 0.8 | 0.7 | 7.5 |
References
- Bass, R. B., P. Srop, M. Barclay, and D. C. Rees. 2002. Crystal structure of Escherichia coli MscS, a voltage-modulated and mechanosensitive channel. Science. 298:1582–1587. [DOI] [PubMed] [Google Scholar]
- Betanzos, M., C. S. Chiang, H. R. Guy, and S. Sukharev. 2002. A large iris-like expansion of a mechanosensitive channel protein induced by membrane tension. Nat. Struct. Biol. 9:704–710. [DOI] [PubMed] [Google Scholar]
- Bilston, L. E., and K. Mylvaganam. 2002. Molecular simulations of the large conductance mechanosensitive (MscL) channel under mechanical loading. FEBS Lett. 512:185–190. [DOI] [PubMed] [Google Scholar]
- Blount, P., and P. C. Moe. 1999. Bacterial mechanosensitive channels: integrating physiology, structure and function. Trends Microbiol. 7:420–424. [DOI] [PubMed] [Google Scholar]
- Boal, D. 2002. Mechanics of the Cell. Cambridge University Press, Cambridge, UK.
- Canham, P. B. 1970. The minimum energy of bending as a possible explanation of the biconcave shape of the human red blood cell. J. Theor. Biol. 26:61–81. [DOI] [PubMed] [Google Scholar]
- Cantor, R. S. 1999. Lipid composition and the lateral pressure profile in bilayers. Biophys. J. 76:2625–2639. [DOI] [PMC free article] [PubMed] [Google Scholar]
- Cantor, R. S. 1997. Lateral pressure in cell membranes: a mechanism for modulation of protein function. J. Phys. Chem. B. 101:1723–1725. [Google Scholar]
- Chang, G., R. H. Spencer, A. T. Lee, M. T. Barclay, and D. C. Rees. 1998. Structure of the MscL homologue from Mycobacterium tuberculosis: a gated mechanosensitive ion channel. Science. 282:2220–2226. [DOI] [PubMed] [Google Scholar]
- Chen, Z., and R. P. Rand. 1997. The influence of cholesterol on phospholipid membrane curvature and bending elasticity. Biophys. J. 73:267–276. [DOI] [PMC free article] [PubMed] [Google Scholar]
- Dan, N., A. Berman, P. Pincus, and S. A. Safran. 1994. Membrane-induced interactions between inclusions. J. Phys. II (Fr.). 4:1713–1725. [Google Scholar]
- Dan, N., P. Pincus, and S. A. Safran. 1993. Membrane-induced interactions between inclusions. Langmuir. 9:2768–2771. [Google Scholar]
- Dan, N., and S. A. Safran. 1995. Solubilization of proteins in membrane. Isr. J. Chem. 35:37–40. [Google Scholar]
- Dan, N., and S. A. Safran. 1998. Effect of lipid characteristics on the structure of transmembrane proteins. Biophys. J. 75:1410–1414. [DOI] [PMC free article] [PubMed] [Google Scholar]
- de Kruijff, B. 1997. Lipids beyond the bilayer. Nature. 386:129–130. [DOI] [PubMed] [Google Scholar]
- de Kruijff, B., A. M. H. P. van den Besselaar, and L. L. M. van Deene. 1977. Outside-inside distribution and translocation of lysophosphatidylcholine in phosphatidylcholine vesicles as determined by 13C-NMR using (N-13CH3)-enriched lipids. Biochim. Biophys. Acta. 465:443–453. [DOI] [PubMed] [Google Scholar]
- East, J. M., and A. G. Lee. 1982. Lipid selectivity of the calcium and magnesium-ion dependent adenosine-triphosphatase, studied with fluorescence quenching by a brominated phospholipid. Biochemistry. 21:4144–4151. [DOI] [PubMed] [Google Scholar]
- Elmore, D. E., and D. A. Dougherty. 2003. Investigating lipid composition effects on the mechanosensitive channel of large conductance (MscL) using molecular dynamics simulations. Biophys. J. 85:1512–1524. [DOI] [PMC free article] [PubMed] [Google Scholar]
- Evans, E. A. 1974. Bending resistance and chemically induced moments in membrane bilayers. Biophys. J. 14:923–931. [DOI] [PMC free article] [PubMed] [Google Scholar]
- Fournier, J. B. 1999. Microscopic membrane elasticity and interactions among membrane inclusions: interplay between the shape, dilation, tilt and tilt-difference modes. Eur. Phys. J. B. 11:261–272. [Google Scholar]
- Gillespie, P. G., and R. G. Walker. 2001. Molecular basis of mechanosensory transduction. Nature. 413:194–202. [DOI] [PubMed] [Google Scholar]
- Goulian, M., O. N. Mesquita, D. K. Fygenson, C. Nielsen, O. S. Andersen, and A. Libshaber. 1998. Gramicidin channel kinetics under tension. Biophys. J. 74:328–337. [DOI] [PMC free article] [PubMed] [Google Scholar]
- Gruner, S. M. 1989. Stability of lyotropic phases with curved interfaces. J. Phys. Chem. 93:7562–7570. [Google Scholar]
- Gullingsrud, J. R., D. Kosztin, and K. Schulten. 2001. MscL gating studied by molecular dynamics simulations. Biophys. J. 80:2074–2081. [DOI] [PMC free article] [PubMed] [Google Scholar]
- Gullingsrud, J. R., and K. Schulten. 2002. Gating mechanisms of MscL studied by molecular dynamics simulations using applied surface tension. Biophys. J. 82:3066. [Google Scholar]
- Gullingsrud, J. R., and K. Schulten. 2003. Gating of MscL studied by steered molecular dynamics. Biophys. J. 85:2087–2099. [DOI] [PMC free article] [PubMed] [Google Scholar]
- Hamill, O., and B. Martinac. 2001. Molecular basis of mechanotransduction in living cells. Physiol. Rev. 81:685–740. [DOI] [PubMed] [Google Scholar]
- Helfrich, P., and E. Jakobsson. 1990. Calculations of deformation energies and conformations in lipid membranes containing gramicidin channels. Biophys. J. 57:1075–1084. [DOI] [PMC free article] [PubMed] [Google Scholar]
- Helfrich, W. 1973. Elastic properties of lipid bilayers. Z. Naturforsch. [C]. 28:693–703. [DOI] [PubMed] [Google Scholar]
- Huang, H. W. 1986. Deformation free energy of bilayer membrane and its effect on gramicidin channel lifetime. Biophys. J. 50:1061–1070. [DOI] [PMC free article] [PubMed] [Google Scholar]
- Israelachvili, J. N. 1991. Intermolecular and Surface Forces. 2nd Ed. Academic Press, London, UK.
- Keller, S. L., S. M. Bezrukov, S. M. Gruner, M. W. Tate, and I. Vodyanoy. 1993. Probability of alamethicin conductance states varies with nonlamellar tendency of bilayer phospholipids. Biophys. J. 65:23–27. [DOI] [PMC free article] [PubMed] [Google Scholar]
- Kumar, V. V., B. Malewicz, and W. J. Bauman. 1989. Lysophosphatidylcholine stabilizes small unilamellar phosphatidylcholine vesicles. Phosphorus-31 NMR evidence for the “wedge” effect. Biophys. J. 55:789–792. [DOI] [PMC free article] [PubMed] [Google Scholar]
- Landau, L. D., and E. M. Lifshitz. 1986. Theory of Elasticity, 3rd Ed. Butterworth-Heinemann, Oxford, UK.
- Lundbæk, J. A., and O. S. Andersen. 1994. Lysophospholipids modulate channel function by altering the mechanical properties of lipid bilayers. J. Gen. Physiol. 104:645–673. [DOI] [PMC free article] [PubMed] [Google Scholar]
- Lundbæk, J. A., P. Birn, J. Girshman, A. J. Hansen, and O. S. Andersen. 1996. Membrane stiffness and channel function. Biochemistry. 35:3825–3830. [DOI] [PubMed] [Google Scholar]
- Markin, V. S., and F. Sachs. 2004. Thermodynamics of mechanosensitivity. Phys. Biol. 1:110–124. [DOI] [PubMed] [Google Scholar]
- Mouritsen, O. G., and M. Bloom. 1984. Mattress model of lipid-protein interactions in membranes. Biophys. J. 46:141–153. [DOI] [PMC free article] [PubMed] [Google Scholar]
- Mouritsen, O. G., and M. Bloom. 1993. Models of lipid-protein interactions in membranes. Annu. Rev. Biophys. Biomol. Struct. 22:145–171. [DOI] [PubMed] [Google Scholar]
- Nielsen, C., M. Goulian, and O. Andersen. 1998. Energetics of inclusion-induced bilayer deformations. Biophys. J. 74:1966–1983. [DOI] [PMC free article] [PubMed] [Google Scholar]
- Olbrich, K., W. Rawicz, D. Needham, and E. A. Evans. 2000. Water permeability and mechanical strength of polyunsaturated lipid bilayers. Biophys. J. 79:321–327. [DOI] [PMC free article] [PubMed] [Google Scholar]
- O'Keeffe, A. H., J. M. East, and A. G. Lee. 2000. Selectivity in lipid binding to the bacterial outer membrane protein OmpF. Biophys. J. 79:2066–2074. [DOI] [PMC free article] [PubMed] [Google Scholar]
- Opsahl, L. R., and W. W. Webb. 1994. Transduction of membrane tension by the ion channel alamethicin. Biophys. J. 66:71–74. [DOI] [PMC free article] [PubMed] [Google Scholar]
- Perozo, E., A. Kloda, D. Marien-Cortes, and B. Martinac. 2002a. Physical principles underlying the transduction of bilayer deformation forces during mechanosensitive channel gating. Nature Struct. Biol. 9:696–703. [DOI] [PubMed] [Google Scholar]
- Perozo, E., A. Kloda, D. Marien-Cortes, and B. Martinac. 2002b. Open channel structure of MscL and the gating mechanism of mechanosensitive channels. Nature. 418:942–948. [DOI] [PubMed] [Google Scholar]
- Polchinski, J. 1998. String Theory, An Introduction to the Bosonic String. Cambridge University Press, Cambridge, UK.
- Powl, A. M., A. M. East, and A. G. Lee. 2003. Lipid-protein interactions studied by introduction of a tryptophan residue: the mechanosensitive channel MscL. Biochemistry. 42:14306–14317. [DOI] [PubMed] [Google Scholar]
- Rawicz, W., K. C. Olbrich, T. McIntosh, D. Needham, and E. A. Evans. 2000. Effect of chain length and unsaturation on elasticity of lipid bilayers. Biophys. J. 79:328–339. [DOI] [PMC free article] [PubMed] [Google Scholar]
- Sukharev, S. I., W. J. Sigurdson, C. Kung, and F. Sachs. 1999. Energetic and spatial parameters for gating of the bacterial large conductance mechanosensitive channel, MscL. J. Gen. Physiol. 113:525–539. [DOI] [PMC free article] [PubMed] [Google Scholar]
- Sukharev, S. I., S. R. Durell, and H. R. Guy. 2001. Structural models of the MscL gating mechanism. Biophys. J. 81:917–936. [DOI] [PMC free article] [PubMed] [Google Scholar]
- Turner, M. S., and P. Sens. 2004. Gating-by-tilt of mechanosensitive membrane channels. Cond-mat/0311574. [DOI] [PubMed]
- White, S. H., and W. C. Wimley. 1999. Membrane protein folding and stability: physical principles. Annu. Rev. Biophys. Biomol. Struct. 28:319–365. [DOI] [PubMed] [Google Scholar]
- Wiggins, P. A., and R. Phillips. 2004. Analytic models for mechanotransduction: gating a mechanosensitive channel. Proc. Natl. Acad. Sci. USA. 101:4071–4076. [DOI] [PMC free article] [PubMed] [Google Scholar]
- Yoshimura, K., A. Batiza, M. Schroeder, P. Blount, and C. Kung. 1999. Hydrophilicity of a single residue within MscL correlates with increased channel mechanosensitivity. Biophys. J. 77:1960–1972. [DOI] [PMC free article] [PubMed] [Google Scholar]
- Yoshimura, K., T. Nomura, and M. Sokabe. 2004. Loss-of-function mutations at the rim of the funnel of mechanosensitive channel MscL. Biophys. J. 86:2113–2120. [DOI] [PMC free article] [PubMed] [Google Scholar]