

Abstract
To gain insights into the molecular level mechanism of drug action at the membrane site, we have carried out extensive molecular dynamics simulations of a model membrane in the presence of a volatile anesthetic using a coarse-grain model. Six different anesthetic (halothane)/lipid (dimyristoylphosphatidylcholine) ratios have been investigated, going beyond the low doses typical of medical applications. The volatile anesthetics were introduced into a preassembled fully hydrated 512-molecule lipid bilayer and each of the molecular dynamics simulations were carried out at ambient conditions, using the NPT ensemble. The area per lipid increases monotonically with the halothane concentration and the lamellar spacing decreases, whereas the lipid bilayer thickness shows no appreciable differences and only a slight increase upon addition of halothane. The density profiles of the anesthetic molecules display a bimodal distribution along the membrane normal with maxima located close to the lipid-water interface region. We have studied how halothane molecules fluctuate between the two maxima of the bimodal distribution and we observed a different mechanism at low and high anesthetic concentrations. Through the investigation of the reorientational motions of the lipid tails, we found that the anesthetic molecules increase the segmental order of the lipids close to the membrane surface.
INTRODUCTION
It is generally accepted that anesthetics produce anesthesia through the reversible inhibition of synaptic transmission (Goodman et al., 1996), but how this occurs at the level of the cell membrane is unknown. The primary site of action (lipid membrane or membrane proteins) of volatile anesthetics (VA) is still a matter of debate (Eckenhoff, 2001).
The strong correlation between olive oil solubility of inhaled gases and their anesthetic potency (known as the Meyer-Overton correlation) suggests that the anesthetics may act on the oily lipid bilayer, where membrane proteins are embedded. Even though proteins are the current favored molecular target for theories of anesthesia, the hypothesis centered on lipids cannot be completely discarded. Many membrane studies on the mechanisms of anesthetic action have focused their attention on the effects of anesthetics on the physical properties of membranes, such as fluidity and membrane volume expansion, with attempts to link these effects to membrane function (Ueda et al., 1986; Lieb et al., 1982; Craig et al., 1987; Tsai et al., 1987; Tang et al., 1997; Baber et al., 1995; North and Cafiso, 1997). Recently, a renewed interest in the role of membrane lipids was triggered by a hypothesis from Cantor (1997), who suggested that modifications induced by the presence of VAs may indirectly alter membrane protein function by modifying the membrane protein conformational equilibria (Cantor, 1997). This model assumes that an anesthetic molecule would always interact either with the lipid-water interface or with the hydrophobic core of the phospholipid bilayer. Such inhomogeneous distribution within the membrane would induce an inhomogeneous increase of the lateral pressure profile which, in turn, would specifically affect the activity of membrane proteins (Cantor, 1997).
Phospholipid bilayers constitute one of the key building blocks in cellular systems, where they are responsible for virtually all cell wall structures. The lamellar phases of phospholipids in water are remarkably stable and efficient as interfacial barriers and exhibit an extreme flexibility and two-dimensional liquid crystal behavior, which makes it possible to reconstitute membrane proteins (such as ion channels) and insert small molecules into their structure (Lipowsky and Sackmann, 1995; Lindahl and Edholm, 2000).
The study of the interactions of anesthetic molecules with model phospholipid membranes is an active topic of research (Hauet et al., 2003; Koubi et al., 2003). Computer simulations provide a unique tool to analyze biomembrane properties from an atomic perspective with a level of detail missing in other techniques. Previous molecular dynamics (MD) simulation studies of the VA halothane incorporated within lipid bilayers with saturated acyl chains (Tu et al., 1998; Koubi et al., 2000) indicated that the anesthetic molecules are located in the upper part of the lipid acyl chains. These studies showed that the presence of halothane modified the structure of the membrane without exhibiting specific interactions with the lipids at the low clinical concentrations (Tu et al., 1998). Several structural modifications of the lipid bilayer when halothane was added were identified. These included a lateral expansion of the lipid membrane, an inhomogeneous modification of the acyl chain orientational order NMR parameters for the upper and lower regions, and a change in the orientation of the headgroup dipole moment.
Atomistic MD simulations have been shown to be very powerful in studying the interaction of anesthetics with model membranes (Koubi et al., 2000, 2003; Tu et al., 1998). However, these detailed studies are limited to length- and timescales that restrict the phenomena one is currently able to explore (Shelley et al., 2001a,b; Ayton and Voth, 2002; Saiz and Klein, 2002). The use of simplified models of the coarse-grain (CG) type can partially alleviate this problem because they use dramatically less computer time and have been proven to be very useful to simulate cooperative and mesoscopic-scale phenomena of experimental and theoretical interest, such as amphiphilic self-assembly, i.e., bilayer (Shelley et al., 2001a; Marrink et al., 2004), Langmuir monolayer (Lopez et al., 2002a), and inverse hexagonal (Shelley et al., 2001b) phases, nanotube-induced nonlamellar phase formation and lipid lateral sorting (Nielsen and Klein, 2002), Langmuir monolayer instability and collapse (Nielsen and Klein, 2002), and nanotube spontaneous insertion in lipid bilayers (Lopez et al., 2004), just to mention a few examples of biophysical relevance.
In this work, we use a CG model, which has been developed to mimic a number of properties of a fully hydrated dimyristoylphosphatidylcholine (DMPC) lipid bilayer in the fluid lamellar phase at ambient conditions and shown to reproduce semiquantitatively the density profiles of the different components along the membrane normal (Shelley et al., 2001a), to study the properties of model membranes in the presence of the VA halothane by means of MD simulations. To explore the effects of halothane within the model phospholipid bilayer over a wide range of solute concentrations, we go beyond the low doses of interest for clinical applications (Eckenhoff, 2001) and study six different halothane/lipid mole fractions, i.e., 0%, 12.5%, 25%, 50%, 75%, and 100%. We have focused our attention on the general structural properties of the lipid bilayer, the partitioning of the solute molecules within the membrane interior, the properties of the water-lipid interface, the coupling of lipid and anesthetic motion, and the segmental order of lipid acyl chains as a function of the anesthetic concentration.
THE MODEL
The CG model approach applied here involves the use of a simplified representation for water, alkanes, phospholipids, and VA molecules. The model used, which has been previously reported (Shelley et al., 2001a), was built to mimic a number of key physical and structural features known from experiment and atomistic simulations of the DMPC phospholipid in water. Here, we briefly describe the main characteristics of the CG model employed to study the model membrane with the anesthetic halothane (for a detailed description of the model and its parameterization, see Shelley et al., 2001b). The 118 atoms of the DMPC phospholipid were represented by 13 effective sites, i.e., the choline (CH), phosphate (PH), glycerol (GL), ester (E), chain methyl (Sα), and terminal methyl (Sβ) groups, as shown in Fig. 1. Since the ester groups of the lipid alkyl chains are not equivalent, we adopt the supra-label in the components of each tail (E1 and E2). The α-index for the Sα sites, which in general denotes that the two chains are not equivalent, was omitted in this schematic representation.
FIGURE 1.
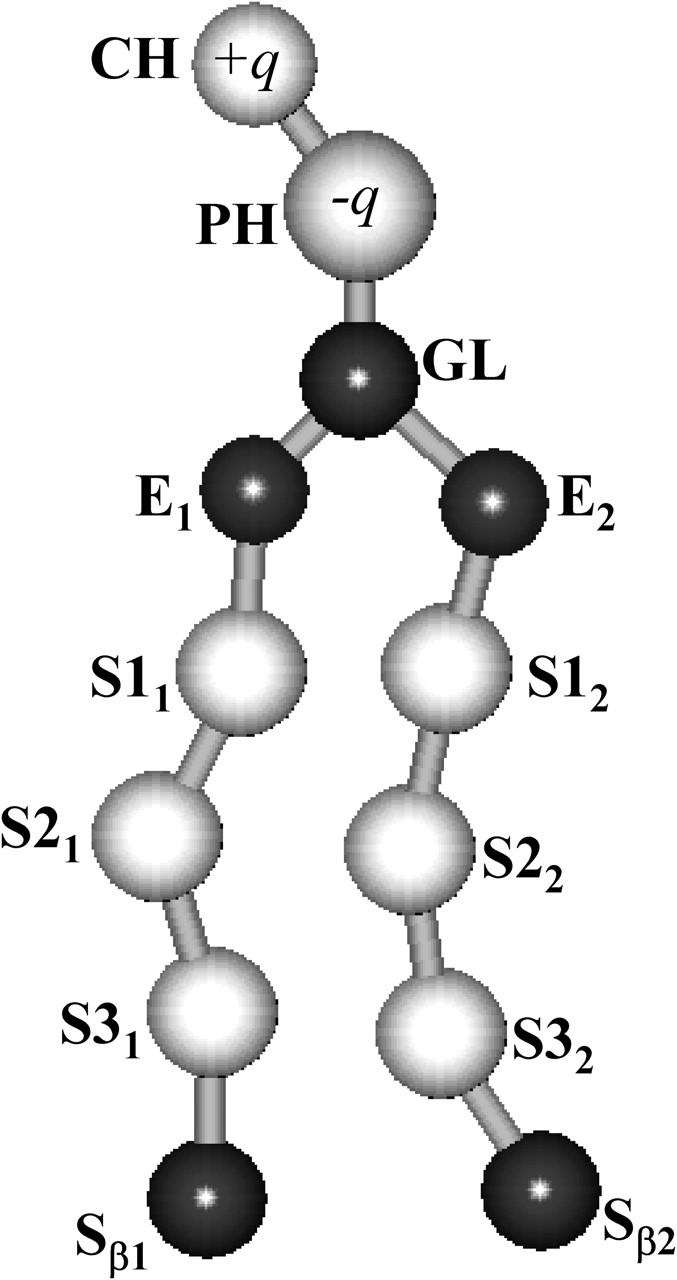
Coarse-grain representation of the DMPC phospholipid molecule. The choline (CH), phosphate (PH), glycerol (GL), ester (E), chain methyl (Sα), and terminal methyl (Sβ) groups are shown and labeled. The charge of the CH and PH groups is specified by ±q, where q = |e|, being e magnitude of the electron charge.
The different sites are linked by stretching and bending intramolecular potentials to obtain the representation of a lipid which preserves the rough shape of the DMPC molecule. The CH and PH groups, the only charged groups in this model, carry charges of +|e| and −|e|, respectively, but in an environment of dielectric constant equal to 78 (that of water). Smoothed tabulated potentials were used to describe the (intermolecular) interactions among CH, PH, GL, and E (nonbonded) sites. The other nonbonded interactions of the lipid groups were represented by soft Lennard-Jones (LJ) 9–6 potentials, with the parameters given in Shelley et al. (2001a). The different interactions were parameterized on the basis of the corresponding radial distribution functions (RDFs), gαβ(r), obtained from atomistic simulations. These RDFs were used as the starting point. The method to reconstruct the CG Hamiltonian from the RDFs uses the potential of mean force, Vαβ(r) ∝ − kBT ln(gαβ(r)), as the initial choice for the effective interaction potentials between the different CG sites (Shelley et al., 2001b; Lyabartsev and Laaksonen, 1995). The parameters are then adjusted iteratively until the RDFs or other desired quantities are appropriately matched within the pertinent accuracy. The model constructed in this way has been shown to reproduce semiquantitatively the density profiles of the different components in the direction normal to the interface of a preassembled DMPC lipid bilayer at room temperature and self-assembles into a lipid bilayer system from a random initial configuration (Shelley et al., 2001b).
In the CG model of the hydrated DMPC bilayer, single spherical sites represent triplets of water molecules (Shelley et al., 2001a) whose interactions were described by soft LJ 6–4 potentials, with the exception of the interaction between the water sites and the ester groups (E) of the lipids, which are represented by LJ 9–6 potentials.
Based on fully atomistic simulations, Shelley et al. (2001b) parameterized the CG representation for the VA halothane molecule used in the present work in a way consistent with the model developed for the lipid and water molecules. A single interaction site was used to represent the anesthetic halothane. This choice was justified by the fact that the orientational distributions of halothane molecules within the lipid bilayer were fairly isotropic as observed in atomistic simulations (Tu et al., 1998). The halothane molecule (CF3CHBrCl) has a dipole moment of ∼2 Debye (Scharf and Laasonen, 1996). In the current work, the charges were not explicitly taken into account for consistency with the model, where only the headgroups CH and PH are charged. Nevertheless, since the model is based on atomistic simulations, the electrostatic effects are taken into account in a statistical (implicit) manner. A schematic representation of the halothane molecule and the table with the LJ interaction parameters used (from Shelley et al., 2001b) are shown in Fig. 2 and in Table 1, respectively. The use of this relatively crude CG model has allowed us to explore different situations (larger system sizes and longer timescales) that are currently out of reach of fully atomistic simulations.
FIGURE 2.

Halothane molecule shown with its atoms represented as spheres, with their appropriate van der Waals radii.
TABLE 1.
Lennard-Jones (LJ) interaction parameters
| Sites | Type | σ(Å) | ε (K) |
|---|---|---|---|
| W-Ha | LJ64 | 5.1540 | 125.5000 |
| Sα-Ha | LJ64 | 5.0427 | 150.0000 |
| Sβ-Ha | LJ64 | 5.1665 | 150.0000 |
| E-Ha | LJ96 | 5.6700 | 194.4362 |
| PH-Ha | LJ96 | 5.5600 | 194.4362 |
| GL-Ha | LJ96 | 5.3600 | 194.4362 |
| CH-Ha | LJ96 | 7.3600 | 250.0000 |
| Ha-Ha | LJ96 | 5.728 | 183.7000 |
Ha and W are the symbols used for CG halothane and CG water sites.
METHODOLOGY
For the current study, we introduced the halothane CG sites into a preassembled DMPC lipid bilayer consisting on 512 lipid molecules and 4384 water CG sites. This lipid/water ratio corresponds to a fully hydrated (atomistic) system with ∼25.7 water molecules per lipid (Nagle and Tristram-Nagle, 2000). At this hydration, the DMPC lipid bilayer is in the biologically relevant fluid lamellar phase (Lα) at T = 30°C and p = 1 atm. We carried out MD simulations for six different halothane/lipid molar concentrations ranging from 0:512 to 512:512. In the notation used throughout this article, the term nh-bilayer (with n = 0, 64, 128, 256, 384, and 512) will refer to n-halothanes in a 512-DMPC lipid bilayer. An instantaneous configuration of the 128h-bilayer system, which corresponds to an anesthetic mole fraction of 25%, is shown in Fig. 3. The initial configuration of the solutes used here and that shown in Fig. 3 is consistent with the large lipid-water partition coefficient for halothane and other halogenated compounds (Koblin et al., 1994; Pang et al., 1980). We equilibrated each system for 2 ns and the data was then collected for an additional 5-ns run. The MD simulations were carried out at a temperature of 303.15 K and a pressure of 1 atm, using the constant number of particles, pressure, and temperature (NPT) ensemble. The simulation box was an orthorhombic flexible box with the usual periodic boundary conditions. The temperature and pressure were controlled using the Nosé-Hoover formalism (Frenkel and Smit, 1996; Tuckerman and Martyna, 2000). A chain length of 4 was used for the thermostat control. Three-stage multiple time-step integration using the RESPA algorithm was used to integrate the equations of motion (Martyna et al., 1992). The shortest time-step (1 fs) was used for bond-length and bond-angle integration, whereas the intermediate time-step, 5 fs, was used for nonbonded interactions shorter than 11 Å. The long time-step, 10 fs, was employed for nonbonded interactions between 11 Å and the cutoff used for short-range interactions. The van der Waals cutoff was set at 18 Å. The long-range electrostatic interactions located in the present model at the lipid-water interface were not truncated, but were treated instead with Ewald sums (Blume, 1993; Patra et al., 2003). The model was parameterized from atomistic simulations with full atomistic detail and, hence, includes full electrostatic effects for water in an average manner through the use of the mean-field tabulated potentials described above, which were implemented as described previously (Shelley et al., 2001a,b). The simulations reported in the present work were performed using the CM3D program (Moore and Klein, 1997).
FIGURE 3.

Snapshot of the 128h-lipid system with a halothane mole fraction of 25% at the end of the equilibrium simulation run. Only the atoms within simulation cell are shown. This system contains 11168 CG sites (512 CG lipids, 4384 CG water sites, and 128 CG halothane sites), which is considerably smaller (one order of magnitude) than the equivalent all-atom system with 100894 atoms. The orthorhombic simulation cell highlighted in blue has a size of Lx = 117.36 Å, Ly = 159.67 Å, and Lz = 54.53 Å (z,x view). The color code is as follows: halothane sites (green spheres), water sites (turquoise spheres), CH lipid headgroup sites (blue spheres), PH lipid headgroup sites (yellow spheres), GL lipid glycerol sites (gray spheres), ester lipid sites (red spheres), and lipid hydrocarbon chain sites (yellow lines).
Due to the use of soft interaction potentials and the lack of an explicit hydrogen bonding network at the interface between lipid headgroups and water, there is an enhanced diffusion of the molecular species. The speed-up in diffusion has been quantified by Lopez et al. (2002b) using the same CG model in a pure lipid bilayer, and they found a two-dimensional self-diffusion coefficient of 6.3 × 10⁻⁶cm2/s compared to the 6.5 × 10⁻⁸cm2/s of an all-atom simulation. This gives an idea of the effective timescales of the processes probed in the present simulations. The effective potentials between the CG interaction sites are basically potentials of mean force. To properly implement the dynamics into the current CG model, one could treat the missing degrees of freedom due to the coarse-graining of the system within the framework of the Mori-Zwanzig formalism. This would lead to a generalized Langevin type of equation with a dissipative term (with memory function) and a noise term. We are currently exploring to further develop the current CG model along these lines.
RESULTS AND DISCUSSION
Structural properties of the model membrane
To monitor how the model biomembrane is affected by the presence of the VA halothane molecules at different concentrations, we have compared the membrane properties, such as the area per lipid (A) and the interlamellar spacing (d, denoted here also by |Z|), which can be measured experimentally by x-ray and neutron scattering, of the different CG lipid bilayer systems.
The area per lipid was estimated for each studied nh-bilayer by computing the average projected in-plane area pe -lipid molecule during the last 5-ns of the simulations with the consideration that, in our case, the number of lipids was the same in both leaflets of the lipid bilayer during the entire simulation. For the pure lipid bilayer (0h-bilayer), the area per lipid was found to be ∼70 Å2, in agreement with previous calculations using the same CG model but a considerably smaller (one order-of-magnitude) system size (Lopez et al., 2002b). This value is ∼17% larger than that reported in fully atomistic models (∼59.2 Å2, Bandyopadhyay et al., 2001) and the latest x-ray data at similar conditions (∼59.6 Å2, Nagle and Tristram-Nagle, 2000). This indicates that the CG model slightly overestimates the A-value. It is worth noting that the reported experimental values for the area per lipid for DMPC range from 59.5 to 65.7 Å2, depending upon the method employed and the experimental conditions (Nagle and Tristram-Nagle, 2000).
In Fig. 4, we plot the average in-plane projected area-per-lipid A as a function of the molar concentration of halothane molecules. From this figure, it is evident that a monotonic increase of the area per lipid occurs when the anesthetic concentration is increased from ∼70 Å2 for the pure lipid bilayer (0%) to ∼78 Å2 for the 512h-bilayer system (100%). For low concentrations of the solute (12.5%; 64h-bilayer), however, the small change in the area per lipid lies within the statistical error. This is probably because, at low concentrations, halothane molecules are located in interstitial sites within the lipid bilayer. This is reasonable, since the increase in the excluded volume per halothane molecule is very small (∼80 Å3) at low concentrations compared to the increase at higher concentrations (∼200 Å3). The monotonic increase of the area per lipid as a function of the solute concentration is in good agreement with the results obtained in MD simulations with full atomistic detail carried out on dipalmitoylphosphatidylcholine (DPPC) lipid bilayers in the Lα phase. In this system, the area per lipid increased from the 61.8 Å2 for the pure DPPC lipid bilayer (Tu et al., 1995) to 63.6 Å2 (3% increase) at a halothane mole fraction of 6.5% (Tu et al., 1998) and to 72 Å2 (16% increase) for a halothane 50% mole fraction (Koubi et al., 2000).
FIGURE 4.

Average area per lipid as a function of the number n of halothane molecules in the nh-bilayer systems with 512 DMPC molecules. Errors, which were calculated as the standard deviations, are of the order of the symbol size.
The interlamellar spacing measured experimentally corresponds to the length of the simulation cell in the direction normal to the bilayer, |Z|. Our calculations indicate the lamellar spacing monotonically decreases with increasing halothane concentration, following as expected the opposite behavior observed for the area per lipid. As an example, in Fig. 5 (top) we depict the time-evolution and the average value of the lamellar spacing |Z| for two selected nh-bilayer systems, n = 0 (shaded lines) and n = 512 (solid lines). It is interesting to compare the behavior of the lamellar spacing after the anesthetic molecules are added with the behavior of the distance between the different lipid groups, such as the phosphate group, the choline group, and the glycerol group, across the membrane which give an idea of the lipid bilayer width. It is evident from Fig. 5 (three lower panels) that the difference between the average distance between the lipid headgroups and the glycerol backbone follows a behavior that is opposite to that of the lamellar spacing, slightly increasing with anesthetic concentration. To calculate these differences, we defined these group distances, denoted by CH-, PH-, and GL-spacing, as the difference between the average value of the upper and lower headgroup positions of each leaflet of the lipid bilayer. The time evolution and the average distance of each group of the lipid headgroup and glycerol spacing are also shown in Fig. 5 (three lower panels), for two of the nh-bilayers, n = 0 and n = 512. The lamellar spacing obtained using the CG model underestimates the value obtained experimentally (62.7 Å) (Nagle and Tristram-Nagle, 2000) and from atomistic simulations (61.5 Å) (Bandyopadhyay et al., 2001), which is consistent with the overestimation of the area per lipid.
FIGURE 5.
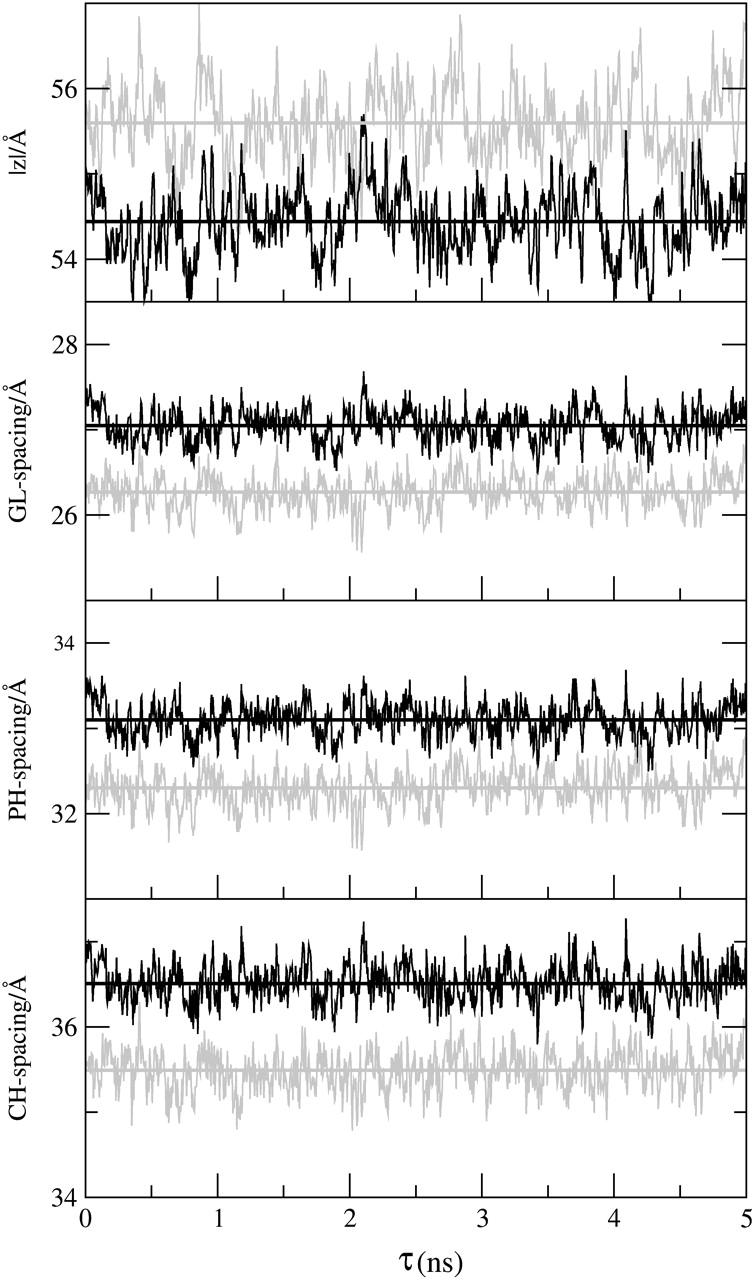
Time evolution and average values of (from top to bottom) the interlamellar spacing (|Z|); GL-spacing; PH-spacing; and CH-spacing for the 0h-bilayer (shaded) and the 512h-bilayer (solid).
Our results show that the monotonic (small) decrease of the system interlamellar spacing |Z| also observed in the atomistic simulations of DPPC (Tu et al., 1998; Koubi et al., 2000) is due to the redistribution of the water molecules inside the simulation cell with increasing area per lipid, as the concentration of the VA halothane increases. Therefore, this is not a property of the lipid bilayer. Interestingly, our results indicate that lipid bilayer thickness increases as a result of the incorporation of the halothane molecules and the area per lipid increases as well, whereas the interlamellar spacing decreases. The slight increase in the lamellar spacing compared to the area per lipid (anisotropic effect) observed upon increase of the anesthetic concentration is consistent with the differences observed for model lipid bilayers in in-plane and out-of-plane elastic properties (Lipowsky and Sackmann, 1995).
Partitioning of the solute molecules
A useful quantity to compare structural properties of membranes is the density profile normal to the bilayer surface, which can be obtained from x-ray or neutron scattering experiments (Smith and Majewski, 2000). We have calculated the electron density profiles (EDP), which can be compared to x-ray studies, for the three different components of the systems as well as the different groups of the CG lipids. In Fig. 6, we plot the average EDP along the direction normal to the bilayer surface (z), where z = 0 Å corresponds to the membrane center, for the lipid (dash-dotted lines), halothane (thick lines with symbols), and CG water sites (dotted lines). We have also included the EDP values of the two sites of the headgroups of the lipids (CH and PH) and the glycerol site, GL. The different EDP curves are shown for all the nh-bilayer systems with increasing concentration of halothanes, n, from top (n = 0) to bottom (n = 512). The CG'ed EDPs for the pure system (n = 0) and those with anesthetic (n ≥ 64) capture the main features observed with atomistic models (Tu et al., 1995, 1998; Koubi et al., 2000, 2003; Bandyopadhyay et al., 2001) and experimentally (Nagle and Tristram-Nagle, 2000). The overlapping between the water and lipid distributions indicates the size of the lipid-water interface. At this interface, the CG water sites are found to be hydrating the lipid headgroups (even when hydrogen bonds are not explicitly taken into account) and the tails of the water distribution decay at the glycerol sites, even penetrating into the upper Sα part of the hydrophobic lipid tails. The distribution of PH and CH groups of the lipid headgroups are also of considerable width, indicating a degree of perpendicular motion (along the z direction) of individual lipids (thermally excited protrusion modes) and water penetration. The perpendicular lipid motion creates a rough instantaneous membrane surface which is averaged over time, leading to a smoothly decaying density profile.
FIGURE 6.
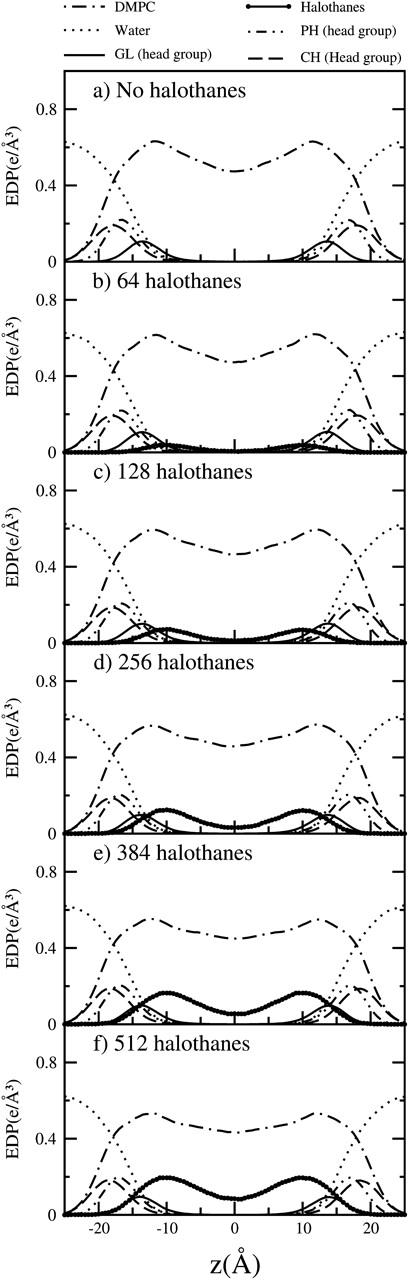
Electron density profiles corresponding to the three molecular species of the model membrane systems, i.e., lipid (– · – ·) and halothane (line with full sphere symbols) molecules, and water sites (⋯·). The curves obtained for the CH (– –) and PH (– ·· –) sites of the lipid headgroups and the GL (–) site of the glycerol backbone are also shown to highlight the location of the lipid-water interface. The results are shown for all the nh-bilayer systems: n = 0 (a), 64 (b), 128 (c), 256 (d), 384 (e), and 512 (f).
The behavior of water and lipid distributions and their different contributions do not seem to be affected by the different halothane concentrations (n = 0, ⋯, 512). At the lower halothane concentration (12.5% mole), we observed that the CG model reproduces the bimodal distribution for the halothane CG sites, which are preferentially localized close to the headgroups of the lipids, as observed in atomistic models (Koubi et al., 2000, 2003; Tu et al., 1998) and expected to be reproduced by the current CG model (Shelley et al., 2001a). As the concentration of anesthetic halothane increases, the intensity of the two peaks increases but they remain centered at the same position (z = ±10 Å), as evidenced in Fig. 7, where we plot only the halothane EDPs. For the systems with high anesthetic concentrations (mole fractions ≥ 50%), we observed, however, an increasing population of halothane CG sites in the center of the membrane (z = 0 Å) and the tails of the solute distributions tend to penetrate more within the lipid-water interface. The accessibility of the water-lipid interface to the solute molecules can be inferred from the overlapping density distribution profiles of water and halothane molecules. The data presented in Fig. 6 indicates that halothane molecules have access to the complex membrane interface, where water molecules, solute molecules, and lipid headgroups interact with each other (even if this CG model of halothanes is quite hydrophobic) and this is more evident for high anesthetic concentrations than for the lower concentrations (12.5% and 25%). These results agree well with experimental studies which show evidence that, in general, anesthetics seem to reside preferentially in the lipid hydrocarbon chain domain, near the lipid headgroup (Lieb et al., 1982; Craig et al., 1987; Tsai et al., 1987; Tang et al., 1997) and the NMR experiments that revealed that the orientational order of the lipid chains is slightly higher near the headgroups and is lower near the chain ends compared to that of the pure lipid bilayers (Baber et al., 1995; North and Cafiso, 1997).
FIGURE 7.

Comparison of the electron density profiles for the halothane CG sites as a function of the halothane mole fraction from 12.5% (64h-bilayer) to 100% (512h-bilayer).
Water-lipid interface
In previous atomistic studies of halothane in saturated DPPC lipid bilayers at high solute concentrations (mole fractions of 50%), it was observed that the distribution of halothane molecules close to the lipid-water interface caused a global reorientation of the lipid phosphatidylcholine headgroup dipole moments (Koubi et al., 2000). A similar behavior has also been observed in model lipid bilayers with highly unsaturated acyl chains (Koubi et al., 2003).
To characterize the zwitterionic headgroup conformation and reorientation, we calculated the orientation of the headgroup dipole moment (basically, the PH→CH vector, denoted by PH–CH) of the lipid with respect to the membrane normal. In Fig. 8, we plot the probability distribution of angles θ, P(θ), between the lipid headgroup PH–CH vectors and the bilayer normal,  for the CG lipid bilayer systems for the different halothane concentrations and compare the results with those of an atomistic simulation of the pure DMPC system in the inset. Our results for the pure lipid bilayer show that the CG model reproduces very well the all-atom (AA) distribution of the lipid headgroup dipoles and the average (and most probable) angle θ, which was found to be ∼60° and 70° for the CG and AA models (Saiz et al., 2004), respectively. The use of the simplified CG model for the different species, thus, slightly shifts the average orientation of the lipid headgroups and its more probable value causing the headgroups to point more away from the membrane surface and the distributions to become slightly broader.
FIGURE 8.

Orientational probability distribution P(θ) of the θ angle between the headgroup PH–CH vector (essentially the headgroup dipole moment) and the bilayer normal in arbitrary units. The results for the different halothane/DMPC ratios are shown and compared in the inset with that of an fully atomistic simulation of the DMPC system without anesthetic (from Saiz et al., 2004). Note that the CG model reproduces very well the results for the AA model.
The calculated P(θ) curves do not show any changes with the concentration of anesthetic, in contrast to the behavior observed in AA models (Koubi et al., 2000, 2003), where at high concentration of anesthetics (25% in polyunsaturated lipid bilayers and 50% in DPPC lipid bilayers) most of the lipid dipoles were on average oriented toward the interior of the lipid bilayer, i.e., pointing away from the water region (with θ > 90°). This difference between the CG and AA models is likely caused by the short-range potentials used in this study for the CG halothane sites. In contrast to the CG lipid headgroups, the CG halothane sites do not carry the small dipole moment of the halothane molecule. In the current CG model, the introduction for instance of an effective permanent dipole to the anesthetic site could be enough to compensate for the loss of detail of the site-site interactions, which leads to the insensitivity of the headgroups to the presence of the anesthetic molecules. In addition, one has to keep in mind that the parameterization used here for the CG lipids corresponds to the pure phospholipid bilayer system, which gives headgroup dipole orientations in excellent agreement with the AA model observations as shown in the present work. For instance, the change of the average headgroup orientation from θ < 90° to θ > 90°, would also imply a change on the headgroup hydration and, in general, in the interactions with the other components of the system. Therefore, an alternative route would consist of reparameterizing the model from the atomistic MD simulations of the DMPC lipid bilayer with the anesthetic molecules.
Lipid and halothane motions
In this section we investigated the coupling between lipid and halothane motions. Firstly, we have observed the halothane trajectories for the 5-ns of the MD simulations to explore how the motions of these molecules take place along the direction of the membrane normal (z coordinate). The trajectories projected in the x,z plane of two selected representative halothane molecules for the lowest halothane concentration 64h-bilayer (left) and the highest halothane concentration 512h-bilayer (right) systems are shown in Fig. 9. Giving a closer look at these trajectories, we can see that in both cases the halothanes prefer a specific z region of the bilayer as was already observed in the analysis of the electron density profiles of the solutes at the whole concentration range. At the two anesthetic concentrations, the halothane molecules fluctuate between the two regions corresponding to the peaks of the bimodal distribution of the EDP over the studied timescale. The transition between maxima, however, follows a different mechanism for low and high anesthetic concentrations. At low concentrations, the transition between maxima follows a hopping-between-maxima mechanism. At high concentrations, in contrast, the halothane molecules remain trapped for longer times in the bilayer center. This effect has not been reported in previous MD simulations due to the limitations in the timescales achieved by fully atomistic simulations.
FIGURE 9.

Trajectories of two selected representative halothane molecules during the 5 ns of the MD simulations for the (left) 64h-bilayer system and the (right) 512h-bilayer system projected in the x,z plane.
We have calculated the (two-dimensional) lateral mean-square displacement (MSD) within the x,y plane (basically the membrane surface), which is given by
 |
(1) |
where ri(t) constitutes the x and y components of the position of the molecular center-of-mass of the molecular species i, and the brackets indicate that averages were performed for the different molecules of type i and different time origins (t0) of the correlation function. The in-plane MSD was computed for two molecular types, i.e., the CG DMPC lipid and anesthetic halothane molecules, in all the studied nh-bilayers and the results obtained are shown in Fig. 10. From the MSD in the x,y plane, we found well-separated motion between the halothane sites and the centers of mass of the lipid molecules in the anesthetic containing model membranes for the five different solute concentrations as evidenced by the considerably higher displacements for halothane than for lipid molecules. We estimated the lateral self-diffusion coefficients, D, from the long-time mean-square displacement using the Einstein relationship, which for a two-dimensional system reads
 |
(2) |
to evaluate the order of magnitude of the differences between lipid's and halothane's in-plane MSDL(t).
FIGURE 10.

Two-dimensional lateral mean-square displacement, MSDL(t), of the molecular centers-of-mass of the CG DMPC lipid molecules and the halothane sites for all the nh-bilayer systems.
The CG D-values are on the order of 5 × 10⁻⁶ cm2/s. This is two orders-of-magnitude larger than those observed in atomistic MD simulations and experimentally, as pointed out previously in Lopez et al. (2002b), due to the use of the simplified model and the lack of the hydrogen bond network of water.
It is important to note that the in-plane self-diffusion coefficients for CG halothane sites—∼1 × 10⁻⁵ cm2/s—are more than one order-of-magnitude higher than those of the centers of mass of the CG lipid molecules for all the anesthetic concentrations. Therefore, the motion of anesthetic and lipid molecules (and, thus, of specific halothane-lipid complexes) is uncoupled in the x,y plane. This agrees well with the results of Tu et al. (1998) where subtle changes on a DPPC membrane structure were observed at clinical halothane concentrations without exhibiting specific lipid-halothane interactions. The wide range of concentrations investigated in the present work by the use of the CG model allow us to anticipate that this phenomenon is the case for mole fractions of halothane as high as 100% (even if anesthetic oligomerization occurs) and the anesthetic molecules basically diffuse in the effective field created by the lipids.
We have studied the motion of anesthetic and lipid molecules in the direction of the membrane normal (z) in a similar way to that of the x,y plane (data not shown) but for one-dimensional diffusion. The out-of-plane MSD of the lipid center of mass is restricted along z and after an initial regime it reaches a limiting value of ∼6 Å. This out-of-plane lipid motion corresponds to the typical lipid protrusion motions (Lipowsky and Sackmann, 1995). The amplitude of out-of-plane motion of the halothane sites is higher (∼15 Å) than that for the lipids.
The lipid acyl chains: segmental order
The effect of the solutes on the conformation of the lipid chains can be studied by monitoring the average orientation of the covalent bonds of the effective sites located in the interior of the bilayer. The segmental order of the acyl chains is usually studied in atomistic MD simulations by calculating the deuterium order parameter SCD, which is given by SCD = 〈(3 cos2 β − 1)/2〉, where β is the angle between a vector along the C–D bond and the membrane normal. Experimentally, SCD can be obtained from the residual quadrupole splitting, Δν, measured from deuterium magnetic resonance measurements as Δν = 3/4e2qQ/h SCD, where e2qQ/h is the deuteron quadrupole splitting constant. By deuterium substitution, the deuterium order parameter can be obtained for each carbon atom n along the lipid acyl chains (order parameter profile SCD(n)) (Seelig and Seelig, 1974). Here, to investigate averaged quantities, such as order parameters, the reorientational molecular motions have been analyzed through the time-correlation functions of the Legendre polynomials of the appropriate angles, which gives an idea of the fluidity of the membrane. We have defined a unitary vector, û, and calculated the corresponding correlation function C2(t), which can be defined as
 |
(3) |
where P2(t) is the second-order Legendre polynomial, cos θ = û(t) · û(t0), and the angle-brackets indicate that averages are performed for the different lipid molecules and different time origins (t0). The generalized order parameter associated with the correlation function S2 is given by
 |
(4) |
To extract the segmental order parameters from the decay of the correlation function 〈P2(t)〉, one must consider that it may have a non-zero asymptote for anisotropic systems such as the present lipid bilayer, i.e., a nonzero S2 value. We have calculated the C2(t) correlation functions of selected û vectors, which correspond to the tail covalent bonds, and are defined as
 |
 |
 |
 |
where the vectors rα (with α = E, S1, S2, S3, and Sβ) are the coordinates of the corresponding α-groups. Since the lipid tails are equivalent, the subscript indicating tails 1 and 2 of each CG lipid was omitted and, to calculate the correlation functions, averages were performed for lipid chains as well. In Fig. 11, we show the order parameter S2 calculated from Eq. 4 for each of the bond vectors.
FIGURE 11.

Segmental order parameter, S2, as a function of position of the vector bi along the lipid acyl chain (i = 1, ⋯, 4). The vectors b1 and b4 are located close to the lipid headgroup and at the end of lipid chain, respectively. Errors are smaller than the size of the symbol used.
In the order parameter profile of Fig. 11, vectors b1 and b4 are located close to the lipid headgroup (lipid-water interface) and at the end of lipid chain (membrane center), respectively. It is interesting to note that this curve has similar features to the orientational order parameter profiles |SCD(n)| obtained from atomistic simulations and NMR experiments in lipid bilayers (Koubi et al., 2000). These include the plateau for positions close to the lipid headgroup and values close to zero for the atoms at the end of the lipid chain, which highlights the anisotropy of the lipid bilayer. In both CG and fully atomistic systems, segments close to the lipid-water interface are more ordered, displaying an average preferential orientation, whereas segments located at the lipid chain ends are more disordered since zero values of the order parameters are typical of randomly oriented segments.
The incorporation of anesthetic molecules into the CG DMPC lipid bilayer causes a remarkable (monotonic) increase of the segmental order parameters as the halothane concentration increases. The order parameters associated to the CG covalent bonds located closer to the lipid headgroup and lipid-water interface b1 and b2 are the most affected by the solutes. The value of the order parameter associated with vector b4 located at the end of the chain does not present any disturbance. As the order parameters of the upper bonds increase with halothane concentration, the associated reorientational times decrease following the expected trend. This agrees well with NMR experiments and simulations that observed that the orientational order of the lipid acyl chains is slightly higher near the headgroups upon addition of the anesthetics (and is lower near the chain ends) compared to that of the pure lipid bilayers (Baber et al., 1995; North and Cafiso, 1997; Koubi et al., 2000). This anisotropic effect observed within the interior of the lipid bilayer could affect (indirectly) both the dynamics and structure of membrane-embedded proteins.
CONCLUSIONS
We have used a coarse-grain model to explore the properties of a model membrane in the presence of the volatile anesthetic halothane by performing extensive molecular dynamics simulations. The CG model was parameterized and developed to mimic a number of properties of a fully hydrated dimyristoylphosphatidylcholine lipid bilayer in the biologically relevant fluid lamellar phase, Lα, at ambient conditions. The CG model has been previously shown to reproduce semiquantitatively the density profiles of the different components in the direction normal to the interface of a preassembled DMPC lipid bilayer and the system self-assembles into a lamellar phase from a random initial configuration (Shelley et al., 2001a,b). This simplified model allows one to explore considerably longer timescales and larger system sizes than those currently available for fully atomistic MD simulations. To investigate the molecular mechanisms of anesthesia action at the membrane site, we have studied a wide range of anesthetic concentrations, namely, halothane mole fractions of 0%, 12.5%, 25%, 50%, 75%, and 100%, which correspond to halothane/lipid ratios ranging from 0:512 to 512:512, beyond the low doses typical of clinical use. The CG model membranes were found to be stable for the whole concentration range studied at the conditions of the MD simulations during the longer than 7 ns CG runs at constant temperature (303.15 K) and pressure (1 atm). The use of soft interaction potentials in the CG type models expedites the diffusive dynamics of the system components.
The effect of the anesthetic molecules on the general structure of the lipid bilayer consisted of a monotonic increase of the area per lipid with anesthetic concentration and a decrease in the interlamellar spacing, in good agreement with previous atomistic simulations (Tu et al., 1998; Koubi et al., 2000). Interestingly, we observed only a small increase of the lipid bilayer width for all concentrations, which indicates that the decrease in the interlamellar spacing as halothane is incorporated into the lipid bilayer is a consequence of the redistribution of the water molecules inside the simulation cell as the area per lipid increases, and is not a property of the model membrane. For the low halothane concentrations (12.5%), the increase in the area per lipid is very small, which is consistent with the occupancy by the halothane molecules of interstitial sites.
The CG model reproduces well the most probable location of the anesthetic molecules within the membrane observed in AA MD simulations and NMR experiments. The density profiles of the anesthetic molecules display a bimodal distribution along the membrane normal with maxima located at the upper part of the lipid chains, close to the lipid-water interface, for all the studied systems. The increase of the solute concentration, however, causes a considerable number of halothane molecules to be located in the middle part of the bilayer (giving a stronger cohesion of the membrane), whereas the organization of the other different components along the membrane normal did not change appreciably. Due to the longer timescales and system sizes reached in the present study, we were able to study, for the first time, how halothane molecules fluctuate between the two preferential locations along the membrane normal and observed a different mechanism at low and high anesthetic concentrations. At low concentrations, the transition between maxima of the bimodal distribution follows a hopping-between-maxima mechanism. At high concentrations, in contrast, the halothane molecules remain trapped for longer times in the bilayer center. The differences of more than an order of magnitude observed for the two-dimensional in-plane self-diffusion coefficients of lipid and halothane molecules indicate that lipid and solute motions are uncoupled in the membrane.
Through the investigation of the segmental order of the lipid chains, we observed that the anesthetic molecules affected the order of the lipid acyl chains in an anisotropic way. The incorporation of anesthetic molecules into the CG DMPC lipid bilayer causes a remarkable (monotonic) increase of the segmental order parameters as the halothane concentration increases. The order parameters associated to the CG covalent bonds located closer to the lipid headgroup and lipid-water interface are the most affected by the solutes. The reorientational times associated with the upper bonds, however, decrease as the halothane concentration increases, and the corresponding order parameter increases. This agrees well with NMR experiments and simulations that observed that the orientational order of the lipid acyl chains is slightly higher near the headgroups upon addition of the anesthetics (and is lower near the chain ends) compared to that of the pure lipid bilayers (Baber et al., 1995; North and Cafiso, 1997; Koubi et al., 2000). This anisotropic effect observed within the interior of the lipid bilayer could affect (indirectly) both the dynamics and structure of proteins embedded into the membrane.
The study of the zwitterionic headgroup conformation and orientation of the pure lipid bilayer indicated that the CG model reproduces very well the fully atomistic distribution of the lipid headgroup dipoles and the average (and most probable) angle θ, which was found to be ∼60° and 70° for the CG and AA models (Saiz et al., 2004), respectively. The probability distributions do not show any changes with the concentration of anesthetic, in contrast to the behavior observed in AA models (Koubi et al., 2000, 2003), where the presence of halothane molecules close to the lipid-water interface caused a global reorientation of the headgroup dipoles. We suggested and discussed several possibilities on how to improve the current model to account for this effect within the framework of the present CG model.
In summary, we have shown that the CG model reproduces semiquantitatively crucial properties of the DMPC lipid bilayer—namely, the segmental order anisotropy of the lipid acyl chains and the orientational probability distribution of the headgroup dipoles, and the average angle of the headgroup dipole moment with respect to the bilayer normal, in addition to the previously reported agreement of the electron density profiles of the different components along the membrane normal. We have been able to reproduce and quantify the different effects observed experimentally and by fully atomistic simulations as a function of the anesthetic concentration on the properties of the phospholipid bilayer in the fluid lamellar phase, such as the monotonic increase in the area per lipid, the increase of the segmental order parameters of the upper acyl chain bonds and the halothane partitioning within the membrane.
Acknowledgments
We thank K. J. Oh for helpful discussions.
This work has been supported by the National Institutes of Health through grant No. P01 GM 55876.
Mónica Pickholz's present address is Universidade Estatual de Campinas, Instituto de Física Gleb Wataghin, Cidade Universitária Zeferino Vaz, Barao Geraldo 13083-970 Campinas SP, Brazil.
References
- Ayton, G., and G. A. Voth. 2002. Bridging microscopic and mesoscopic simulations of lipid bilayers. Biophys. J. 83:3357–3370. [DOI] [PMC free article] [PubMed] [Google Scholar]
- Baber, J., J. F. Ellena, and D. S. Cafiso. 1995. Distribution of general anesthetics in phospholipid bilayers determined using H2 NMR and H1-H1 NOE spectroscopy. Biochemistry. 34:6533–6539. [DOI] [PubMed] [Google Scholar]
- Bandyopadhyay, S., J. C. Shelley, and M. L. Klein. 2001. Molecular dynamics study of the effect of surfactant on a biomembrane. J. Phys. Chem. B. 105:5979–5986. [Google Scholar]
- Blume, A. 1993. Phospholipids Handbook. Dekker, New York.
- Cantor, R. S. 1997. The lateral pressure profile in membranes: a physical mechanism of general anesthesia. Biochemistry. 36:2339–2344. [DOI] [PubMed] [Google Scholar]
- Craig, N. C., G. J. Bryant, and I. W. Levin. 1987. Effects of halothane on dipalmitoylphosphatidylcholine liposomes—a Raman-spectroscopic study. Biochemistry. 26:2449–2458. [DOI] [PubMed] [Google Scholar]
- Eckenhoff, R. G. 2001. Promiscuous ligands and attractive cavities: how do the inhaled anesthetics work? Mol. Interv. 1:258–268. [PubMed] [Google Scholar]
- Frenkel, D., and B. Smit. 1996. Understanding Molecular Simulations. Academic Press, San Diego, CA.
- Goodman, D. M., E. M. Nemoto, R. W. Evans, and P. M. Winter. 1996. Anesthetics modulate phospholipase-C hydrolysis of monolayer phospholipids by surface pressure. Chem. Phys. Lipids. 84:57–64. [DOI] [PubMed] [Google Scholar]
- Hauet, N., F. Artzner, F. Boucher, C. Gabrielle-Madelmont, I. Cloutier, G. Keller, P. Lesieur, D. Durand, and M. Patermostre. 2003. Interaction between artificial membranes and enflurane, a general volatile anesthetic: DPPC-enflurane interaction. Biophys. J. 84:3123–3137. [DOI] [PMC free article] [PubMed] [Google Scholar]
- Koblin, D., B. Chortkoff, M. Laster, E. Eger, M. Halsey, and P. Ionescu. 1994. Polyhalogenated and perfluorinated compounds that disobey the Meyer-Overton hypothesis. Anesthesiology. 79:1043–1048. [DOI] [PubMed] [Google Scholar]
- Koubi, L., M. Tarek, M. L. Klein, and D. Sharf. 2000. Distribution of halothane in a dipalmitoyl phosphatidylcholine bilayer from molecular dynamics calculations. Biophys. J. 78:800–811. [DOI] [PMC free article] [PubMed] [Google Scholar]
- Koubi, L., L. Saiz, M. Tarek, D. Scharf, and M. L. Klein. 2003. Influence of anesthetic and nonimmobilizer molecules on the physical properties of a polyunsaturated lipid bilayer. J. Chem. Phys. B. 107:14500–14508. [Google Scholar]
- Lieb, W. R., M. Kovalycsik, and R. Mendelsohn. 1982. Do clinical levels of general anesthetics affect lipid bilayers? Evidence from Raman scattering. Biochim. Biophys. Acta. 688:388–398. [DOI] [PubMed] [Google Scholar]
- Lindahl, E., and O. Edholm. 2000. Spatial and energetic-entropic decomposition of surface tension in lipid bilayers from molecular dynamics simulations. J. Chem. Phys. 113:3882–3893. [Google Scholar]
- Lipowsky, R., and E. Sackmann. 1995. Structure and Dynamics of Membranes, Handbook of Biological Physics, Vol. 1A. Elsevier, Amsterdam, The Netherlands.
- Lopez, C. F., S. O. Nielsen, P. B. Moore, J. C. Shelley, and M. L. Klein. 2002a. Self-assembly of a phospholipid Langmuir monolayer using coarse-grained molecular dynamics simulations. J. Phys. Condens. Matter. 14:9431–9444. [Google Scholar]
- Lopez, C. F., P. B. Moore, J. C. Shelley, M. Y. Shelley, and M. L. Klein. 2002b. Computer simulation studies of biomembranes using a coarse model. Comp. Phys. Comm. 147:1–6. [Google Scholar]
- Lopez, C. F., S. O. Nielsen, P. B. Moore, and M. L. Klein. 2004. Understanding nature's design for a nanosyringe. Proc. Natl. Acad. Sci. USA. 101:4431–4434. [DOI] [PMC free article] [PubMed] [Google Scholar]
- Lyabartsev, A. P., and A. Laaksonen. 1995. Calculation of effective interaction potentials from radial distribution functions: a reverse Monte Carlo approach. Phys. Rev. E. 52:3730–3737. [DOI] [PubMed] [Google Scholar]
- Marrink, S. J., A. H. de Vries, and A. E. Mark. 2004. Coarse-grained model for semiquantitative lipid simulations. J. Phys. Chem. B. 108:750–760. [Google Scholar]
- Martyna, G. J., M. L. Klein, and M. E. Tuckerman. 1992. Nosé-Hoover chains—the canonical ensemble via continuous dynamics. J. Chem. Phys. 97:2635–2643. [Google Scholar]
- Moore, P. B., and M. L. Klein. 1997. Implementation of a general integration for extended system molecular dynamics. Technical report, University of Pennsylvania, http://www.cmm.upenn.edu/moore.
- Nagle, J. F., and S. Tristram-Nagle. 2000. Structure of lipid bilayers. Biochim. Biophys. Acta. 1469:159–195. [DOI] [PMC free article] [PubMed] [Google Scholar]
- Nielsen, S. O., and M. L. Klein. 2002. A coarse grain model for lipid monolayer and bilayer studies. In Bridging the Timescales: Molecular Simulations for the Next Decade. P. Nielaba, M. Mareschal, and G. Ciccotti, editors. Springer, Berlin, Germany. 27–63.
- North, C., and D. S. Cafiso. 1997. Contrasting membrane localization and behavior of halogenated cyclobutanes that follow or violate the Meyer-Overton hypothesis of general anesthetic potency. Biophys. J. 72:1754–1761. [DOI] [PMC free article] [PubMed] [Google Scholar]
- Pang, K.-Y. Y., L. M. Braswell, L. Chang, T. J. Sommer, and K. W. Miller. 1980. The perturbation of lipid bilayers by general anesthetics: a quantitative test of the disordered lipid hypothesis. Mol. Pharmacol. 18:84–90. [PubMed] [Google Scholar]
- Patra, M., M. Karttunen, M. T. Hyvonen, E. Falck, P. Lindqvist, and I. Vattulainen. 2003. Molecular dynamics simulations of lipid bilayers: major artifacts due to truncating electrostatic interactions. Biophys. J. 84:3636–3645. [DOI] [PMC free article] [PubMed] [Google Scholar]
- Saiz, L., and M. L. Klein. 2002. Computer simulation studies of model biological membranes. Acc. Chem. Res. 35:482–489. [DOI] [PubMed] [Google Scholar]
- Saiz, L., S. Bandyopadhyay, and M. L. Klein. 2004. Effect of the pore region of a transmembrane ion channel on the physical properties of a simple membrane. J. Phys. Chem. B. 108:2608–2613. [Google Scholar]
- Scharf, D., and K. Laasonen. 1996. Structure, effective pair potential and properties of halothane. Chem. Phys. Lett. 258:276–282. [Google Scholar]
- Seelig, A., and J. Seelig. 1974. The dynamic structure of fatty acyl chains in a phospholipid bilayer measured by deuterium magnetic resonance. Biochemistry. 13:4839–4845. [DOI] [PubMed] [Google Scholar]
- Shelley, J. C., M. Y. Shelley, R. C. Reeder, S. Bandyopadhyay, and M. L. Klein. 2001a. A coarse-grain model for phospholipid simulations. J. Phys. Chem. B. 105:4464–4470. [Google Scholar]
- Shelley, J. C., M. Y. Shelley, R. C. Reeder, S. Bandyopadhyay, P. B. Moore, and M. L. Klein. 2001b. Simulations of phospholipids using a coarse-grain model. J. Phys. Chem. B. 105:9785–9792. [Google Scholar]
- Smith, G. S., and J. Majewski. 2000. X-ray and neutron studies of lipid bilayers. In Lipid Bilayers, Structure and Interactions. J. Katasaras and T. Gutberlet, editors. Springer, Berlin, Germany.
- Tang, P., B. Yan, and Y. Xu. 1997. Different distribution of fluorinated anesthetics and nonanesthetics in model membrane: an F-19 NMR study. Biophys. J. 72:1676–1682. [DOI] [PMC free article] [PubMed] [Google Scholar]
- Tsai, Y. S., S. M. Ma, H. Kamaya, and I. Ueda. 1987. Fourier-transform infrared studies on phospholipid hydration: phosphate-oriented hydrogen-bonding and its attenuation by volatile anesthetics. Mol. Pharmacol. 26:623–630. [PubMed] [Google Scholar]
- Tu, K., D. J. Tobias, and M. L. Klein. 1995. Constant pressure and temperature molecular dynamics simulation of a fully hydrated liquid crystal phase dipalmitoylphosphatidylcholine bilayer. Biophys. J. 69:2558–2562. [DOI] [PMC free article] [PubMed] [Google Scholar]
- Tu, K. C., M. Tarek, M. L. Klein, and D. Scharf. 1998. Effects of anesthetics on the structure of a phospholipid bilayer: molecular dynamics investigation of halothane in the hydrated liquid crystal phase of dipalmitoylphosphatidylcholine. Biophys. J. 75:2123–2134. [DOI] [PMC free article] [PubMed] [Google Scholar]
- Tuckerman, M. E., and G. J. Martyna. 2000. Understanding modern molecular dynamics: techniques and applications. J. Phys. Chem. B. 104:159–178. [Google Scholar]
- Ueda, I., M. Hirakawa, K. Arakawa, and H. Kamaya. 1986. Do anesthetics fluidize membranes? Anesthesiology. 64:67–71. [DOI] [PubMed] [Google Scholar]