

Abstract
The underlying physico-chemical principles of the interactions between domains in protein folding are similar to those between protein molecules in binding. Here we show that conserved residues and experimental hot spots at intermolecular binding interfaces overlap residues that vibrate with high frequencies. Similarly, conserved residues and hot spots are found in protein cores and are also observed to vibrate with high frequencies. In both cases, these residues contribute significantly to the stability. Hence, these observations validate the proposition that binding and folding are similar processes. In both packing plays a critical role, rationalizing the residue conservation and the experimental alanine scanning hot spots. We further show that high-frequency vibrating residues distinguish between protein binding sites and the remainder of the protein surface.
INTRODUCTION
Protein-protein association is critical for all cellular processes. Genome-scale characterization of protein-protein interaction maps (Uetz et al., 2000; Gavin et al., 2002) and the structure-based assembly of the network (Aloy et al., 2004) provide a promise that we shall be able to obtain a picture of the entire cell. Whether evolution chooses to split genes to increase the module interactions in the proteome or keeps the genes intact, the underlying physico-chemical principles of the interactions between domains should be similar to those between the protein molecules. The only difference is the presence (protein folding) or absence (protein-protein binding) of chain connectivity. One such feature that has been identified using the concept of the insufficiently dehydrated hydrogen bonds (Fernandez and Scheraga, 2003), is that the number of insufficiently dehydrated hydrogen bonds tends to increase with connectivity in proteomic networks (Fernandez et al., 2004). Here we test the similarity between folding and binding nuclei through an examination of the normal mode frequencies of the folding nucleus and the experimental and computational hot spot residues in protein-protein interactions.
To identify the residues contributing significantly to the stability of protein associations, protein-protein complexes have been analyzed experimentally and computationally. Experimentally, they have been probed via alanine scanning mutagenesis to discover the residue “hot spots” at their interfaces. A hot spot is a residue that when mutated to alanine, gives rise to a distinct drop in the binding constant (>2 kcal/mol) by destabilizing the bound state ensemble. Computationally, alanine scanning calculations (Massova and Kollman, 1999), simple physical models (Kortemme and Baker, 2002), Monte Carlo evaluation of the energy landscapes (Verkhivker et al., 2002) and studies on the residue-specific energy contributions to the binding (Kortemme and Baker, 2002; Verkhivker et al., 2002) have been undertaken to understand the origin of the stabilizing contributions of the hot spots. Structural comparisons of protein families (Hu et al., 2000; Ma et al., 2003; Keskin et al., 2004) have further shown that structurally conserved residues correlate with the hot spots. Both residue hot spots and conserved residues have been shown to couple across the interfaces (Halperin et al., 2004) and to be within well-packed environments (Halperin et al., 2004; Keskin et al., 2005). Furthermore, conserved residue hot spots distinguish between binding sites and exposed protein surfaces (Ma et al., 2003).
Conserved residues within the compact protein cores have been postulated to be critical for protein folding (Fersht, 1976). Theoretical and experimental studies suggest that there is a correlation between structurally conserved residues in the densely packed protein cores and those observed in mutational studies to play a key role in protein folding. These are termed kinetically important residues (Shoemaker et al., 1997) or hot spots (Shakhnovich et al., 1996), because they describe highly ordered contacts in the transition state. Hence, they are strongly constrained and conserved. For several proteins residues critical for folding were identified as high-frequency vibrating (HFV) residues by the Gaussian network model (GNM) (Demirel et al., 1998; Bahar et al., 1998). Hence, the question arises whether the structurally conserved residues at the interfaces, shown to be correlated with the experimental binding hot spots, exhibit similar vibrational motions as those in the folding nucleus. This would be a direct indication that certain critical residues similarly control folding and binding. Furthermore, because conserved residues distinguish binding sites from the rest of the protein surface (Ma et al., 2003), the HFV residues may identify protein interaction sites without the need for multiple structures in a conservation study.
Here, we carry out dynamic mode analysis by the GNM for monomers, taken from their complexed structures. Each complex is the representative of an interface cluster (Keskin et al., 2004). The vibrational motions of residues in the high-frequency modes are calculated and compared with the structurally conserved residues obtained for each interface cluster (Keskin et al., 2004, 2005). Comparisons are also performed with the experimental hot spots for cases where both proteins in the complex were alanine scanned.
Here we provide data indicating similar organizations in protein binding and protein folding. The similarity between the processes has already been implied theoretically and experimentally (reviewed in Tsai et al., 1998). We use a data set of protein-protein interfaces recently derived from the entire Protein Data Bank (PDB) (Keskin et al., 2004). By multiply superimposing clustered structurally similar interfaces (Shatsky et al., 2004), we obtain structurally conserved residues. The identity of the conserved residues correlates with the experimental hot spot residues (Hu et al., 2000; Ma et al., 2003). Analysis of the organization of the conserved residues and of the hot spots indicates that they are clustered within locally highly packed regions (Keskin et al., 2005), consistent with their conservation and their experimentally observed free energy contribution to the binding. Clustered conserved residues in locally highly packed regions are reminiscent of protein cores (Shakhnovich et al., 1996). Further, as might be expected from tightly packed residues, analysis of their dynamic modes in both cores and interfaces demonstrates that they similarly display high-frequency vibrational motions.
METHODS
Gaussian network model
In the GNM theory (Bahar et al., 1998, 1997) the protein is modeled as a three-dimensional elastic network. The junctions are the Cα-atoms. The interactions between the residues within the first interaction shell (7 Å) (Miyazawa and Jernigan, 1985; Bahar and Jernigan, 1997) are assumed to be connected by elastic springs with a uniform force constant γ (Tirion, 1996). Residues i and j in the folded protein are assumed to undergo Gaussian fluctuations about their mean positions in the separation Rij = |Rj − Ri|, where Ri and Rj are the respective position vectors of the ith and jth Cα-atoms. According to the GNM, the equilibrium mean-square fluctuations of individual residues can be decomposed into a series of modes from highest to slowest. The ith eigenvalue λi is representative of the frequency of the ith mode of motion (which is (γ λi) 1/2), and the ith eigenvector gives the shape of this mode as a function of the residue index. The slowest mode usually describes the global motions (Wu and Ma, 2004; Keskin et al., 2000) and hinge sites. On the other hand, the high-frequency modes indicate the most strongly constrained sites that are subject to rapid local fluctuations in the presence of intricate coupling between all residues. Sites identified by peaks emerging in these mode shapes are frequently associated with stability and function (Demirel et al., 1998; Bahar et al., 1998). The GNM method is closely related to the normal mode analysis of elastic bodies. The use of the single-parameter Hooken potential was shown to yield low-frequency normal modes as accurately as those obtained with more detailed, empirical force fields (Tirion, 1996). The new advances in normal mode analysis have been useful in studying large-amplitude and low-frequency molecular deformations that are involved in protein function. These applications have been reviewed recently (Ma, 2004).
The interface data set
We use a diverse, nonredundant data set of protein-protein interfaces (Keskin et al., 2004). We divide the interface residues into two types: two residues (one from each chain), which are in direct contact are called interacting residues. Residues in the vicinity of interacting residues are “nearby” residues. Structurally conserved interacting and nearby residues were extracted for each of the 103 interface clusters by multiple structure alignment of the cluster members, using MultiProt (Keskin et al., 2004; Shatsky et al., 2004). Residues are defined as conserved if their conservation ratio is >0.5. The conservation ratio is the ratio of the number of identical residues to the number of all types of residues at a specific position in the structural alignment of the interfaces. The data set is at http://protein3d.ncifcrf.gov/∼keskino and http://home.ku.edu.tr/∼okeskin/INTERFACE/INTERFACES.html. MultiProt is at http://bioinfo3d.cs.tau.ac.il/MultiProt. The alanine scanning data have been taken from ASEbd (Thorn and Bogan, 2001).
Clustering the high-frequency vibrating residues in space
Residues identified as HFV residues are pooled. To cluster, we calculate the distance between each HFV pair. The number of neighbors is computed for each HFV residue with a distance cutoff of 12 Å. The residue with the highest number of neighbors is considered as the center of the first cluster. All neighbors of this HFV residue are removed from the pool. The center of the second cluster is similarly determined using the new pool of the HFV residues. This procedure is repeated until each HFV residue is assigned to a cluster. To assess the robustness of the clustering, we test distance cutoffs of 8, 10, and 12 Å. This simple clustering method is presented schematically for a number of hypothetical HFV residues in Appendix A.
RESULTS AND DISCUSSION
First, the HFV residues are compared with structurally conserved residues of the clusters' representatives. Ninety monomers out of the 100 representatives that contain conserved residues are used. A few cases with only helices are excluded, to avoid ambiguity in the multiple alignments. There are <10% outliers in the analyzed structures. To assess the significance of the correlation, the conserved residues are also analyzed with respect to the randomly sampled peaks. The HFV residues are further compared with hot spots from the alanine-scanning database in six complexes, where both monomers were alanine scanned. No outliers are detected. Second, we compare the trends in the interfaces versus the remainder of the surface. Here, 100 monomers are analyzed, because no conservation is needed. Again, we find <10% outliers. We could identify interfaces for >90% of the cases. Third, we compare the monomers in the isolated and complexed states. We observe a similar dynamical behavior between the isolated and the complexed states. Below, we provide details for the three types of analyses.
Comparison of high-frequency vibrating residues with structurally conserved and hot spots residues
The normalized mode shape is described by the vibrations versus residue index along the kth mode. The peaks identify residues that display local vibrations. Two parameters are set to identify a HFV residue from the associated mode shape: the threshold for the lower value of the height of the peaks and the number of fastest modes to be incorporated into the weighted average. The threshold is set >0.005. The number of fast modes is set to be proportional to the protein size (here, 4). On average, the number of residues in peaks above the threshold corresponds to <15% of the protein size. The parameters are optimized over the 90 monomers for the best match between the high-frequency fluctuating residues and the structurally conserved residues. The monomers derive from the clusters' representatives (Keskin et al., 2004). The PDB codes are given in Appendix B.
Fig. 1 a displays an example of the distribution of the mean-square vibrations in the weighted average of the four fastest modes for monomer A from the complex of a serine protease inhibitor (PDB, 1tfx), the representative of one interface cluster. Here, there are 26 HFV residues grouped into one cluster (Fig. 1 b, green). As may be seen in Fig. 1 a, the structurally conserved residues correlate with the HFV residues. Fig. 1 c displays an example of the correlation of the HFV residues with the hot spot residues from the alanine scanning database, ASEdb (Thorn and Bogan, 2001) for the ribonuclease inhibitor-angiogenin complex. Interestingly, all other peaks also correlate with functional residues. Those residues were reported as involved in hydrogen bond interactions and forming contacts at the interface (Tables II and III in Papageorgiou et al., 1997). The high-frequency peaks look periodic due to the structural properties of this repeat protein. Appendix C enumerates the cases we have used.
FIGURE 1.

(a) The distribution of the mean-square vibrations in the fastest four modes of dynamics of the monomer A structure of a serine protease, from the complex serine protease-inhibitor (1tfx), which is the representative structure of an interface cluster. The number of the HFV residues is 26 (0.12 × 223; 223 is the residue number), with the parameters 0.005 and 4 for the lower threshold in the height of the peaks and the number of fast modes incorporated, respectively. The blue dots display the interacting and the nearby conserved residues (6). (b) The ribbon diagram of 1tfx with the high-frequency fluctuating residues grouped into one cluster are depicted in green on monomer A drawn together with the inhibitor C. (c) The vibrations in the fastest 10 modes of a ribonuclease inhibitor A from its complex with angiogenin (PDB, 1a4y). The binding hot spot residues from alanine scanning data, ASEdb (Thorn and Bogan, 2001), are marked with red dots. Blue circles display those residues reported in the literature as involved in hydrogen bond interactions and forming contacts at the interface (Tables II and III in Papageorgiou et al., 1997). The correspondence between the peaks and the red dots and blue circles is remarkable.
A similar situation exists for folding core residues (Rader and Bahar, 2004). Fig. 2 presents the barnase example. The highest frequency vibrating residues correlate with residues with the lowest exchange rates and the highest protection factors in hydrogen exchange experiments (Perrett et al., 1995). As seen in Fig. 1 b, the HFV residue cluster is similar to the hot spots in folding cores (Fersht, 1976; Mirny, 2001) and in the binding regions (Bogan and Thorn, 1998). The clusters are mostly buried, in cores or in interfaces, where they are largely in the “nearby” layer in the first coordination shell bordering contact residues (Tsai et al., 1998).
FIGURE 2.

The vibrations in the fastest five modes of barnase, 1brsD, from its complex structure with barstar, 1brs. The folding core residues of the wild-type barnase from hydrogen exchange experiments (Perrett et al., 1995) are marked with black dots.
Fig. 3 displays the number of the interacting and nearby conserved residues overlapped versus nonoverlapped by the HFV residues for 90 structures. In the overlap, a window of three residues in sequence and 7 Å in space is considered. With this window, on average the HFV residues overlap 75% of the conserved residues in each structure. Analysis of the shortest distance between any HFV residue to a conserved residue shows that 73% of the conserved residues are highly populated around the HFV residues at a distance <7 Å; 24% are farther, however, these residues are part of a cluster with >50% overlap with the HFV residues. The remaining 3% are part of a cluster with no members overlapping at <7 Å. Thus, 3% of all conserved residues in <10% structures are outliers. The monomer structures used in the analysis are given in Appendix B.
FIGURE 3.

The number of conserved residues overlapping and not overlapping the HFV residues for 90 cases. A distance in space and in sequence is allowed for the comparison, up to three residues along the sequence and 7 Å in space. The outliers: 1g1kA, B (structural protein; with another binding region); 1irxA, B (ligase; a lower threshold value <0.005 of the high-frequency peaks is needed to be able to identify the HFV residues); 1j46A (oxyreductase; a lower threshold required for the height of the peaks); 1pmaA, B (protease; multiple interfaces); 1dubA, B (lyase; multiple interfaces); 1fntC (hydrolase activator; multiple interfaces); 1dz4A (oxyreductase; two clusters at other regions on the surface); 1fpuA (transferase; one large folding core and a cluster somewhere else on the surface). The outliers are depicted by ×. The number of cases below the line is 14.
To assess the significance of the overlap of the HFV residues with the conserved residues, we carry out a correlation analysis with respect to random sampling of the high-frequency peaks obtained by GNM. The fractions of the conserved residues overlapped by the high-frequency peaks with an exact match and in a window of one residue, two residues, three residues, three residues and 5 Å, three residues and 7 Å, respectively, are 0.24, 0.40, 0.49, 0.57, 0.65, 0.75 by GNM and 0.14 (±7 × 10⁻³), 0.26 (±7 × 10⁻³), 0.36 (±6 × 10⁻³), 0.45 (±9 × 10⁻³), 0.57 (±1 × 10⁻³), 0.68 (±1 × 10⁻²) by random sampling. The numbers in the parentheses indicate the deviations between the results of several independent runs. In each run, hundreds of fast-mode shapes are randomly constructed for the respective cases. The overlap both by GNM and by random sampling increases but the difference between the two decreases as we widen the window; yet, the correlation is lower in all random sampling cases. This is expected because in contrast to the clustering tendency of the high-frequency fluctuating residues, the widening window favors random sampling more when the random peaks are evenly distributed in the structure. Indeed, the average size of the clusters of the high-frequency vibrating residues are 6.5 and 8.4 residues if we consider all clusters including those with one residue and excluding those with one residue, respectively. This implies that a smaller number of HFV residue clusters obtained by GNM overlap 75% of the conserved residues whereas several residue clusters of small sizes obtained in randomly generated samples overlap 68% of the conserved residues. Several groups of randomly sampled peaks do not point to a plausible site, unlike the high-frequency peak clusters. Thus, it appears necessary to incorporate the clustering property of HFV residues in space into the correlation analysis for a better assessment of the overlap of the conserved residues and the high-frequency peaks by GNM versus the random analysis.
As a complementary analysis, we identify the centers, either α-carbon or side-chain centroids of the residues closest to each conserved residue, from the high-frequency peaks by GNM and by random sampling. Fig. 4 a compares the average distribution of the distances of the closest 15 centers to a conserved residue for the two types of cases. This analysis appears to display the enriched existence of the HFV residues in the first coordination shell of a conserved residue in the native packing, versus the shift of the distribution toward the second coordination shell of the conserved residues in the random packing. The number of sites, 15, may represent ∼7.5 residues, which is close to the average size of a HFV residue cluster. On the other hand, Fig. 4 b shows that if we take different values to define nearby residues, the distance of the peaks (of the distributions of the closest center distances) from a conserved residue vary. As the number of neighboring sites by GNM and by random sampling to a conserved residue is increased, the peaks of the distributions level off at a distance ∼6.5 and ∼10.5 Å, respectively.
FIGURE 4.
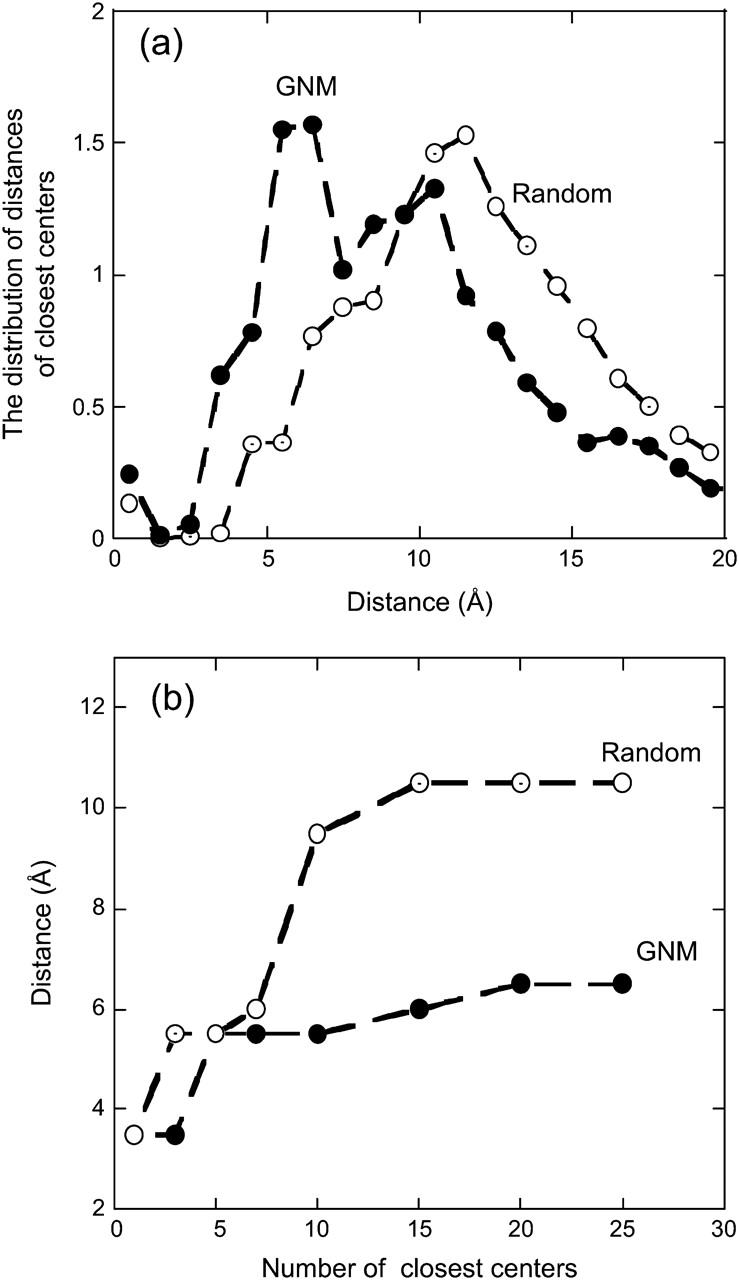
(a) The average distribution of the distances of the closest 15 α-carbon or side-chains centers of the HFV residues to a conserved residue by GNM and by random sampling. The distances are considered at intervals of 1 Å. The number of sites, 15, may represent ∼7.5 residues, which is close to the average size of a HFV residue cluster. The distribution of the HFV residues centered at the first and the second coordination shell of a conserved residue in native and random packing, respectively. (b) The position of the peak of the average distribution of the distances of the closest centers to a conserved residue versus the number of the closest centers considered. The closest centers are the α-carbons or the side chains of the high-frequency vibrating residues by GNM and by random sampling. The peaks of the distributions of the latter centers level off at a distance ∼6.5 and ∼10.5 Å, respectively, as the number of the closest centers is increased.
The agreement between the high-frequency vibrating and the structurally conserved residues corresponding to >90% of the analyzed structures is remarkable. Potential reasons for outliers include: i), the HFV residue may belong to another binding region or to a folding core; ii), inaccuracies may exist in the multiple structural superposition to obtain conserved residues, and the presence of crystal interfaces in the data set. There, a conserved residue is functionally meaningless; iii), a residue may be conserved for a different reason, for example a specific functional interaction. In this regard, we note that the correlation between conserved residues and experimental hot spots is also around 0.90 (Keskin et al., 2005), possibly reflecting similar reasons.
The analysis above was carried out with the clusters' representatives (Keskin et al., 2004). To assess the robustness of the distribution of the vibrations in the fastest modes for different structures in the same interface cluster, for one cluster (the transferases; PDB codes, 10gs, 1b48, 1f2e, 1gwc, 1axd, 1c72, 1gnw, 1jlv, 1pd2), the calculations were carried out for all cluster members. The results indicate that the high-frequency fluctuating residues occur at similar positions in all cluster interfaces (not shown).
High-frequency vibrating residues in the interfaces versus the rest of the surface
The residues at the peaks in the fastest mode shapes are mapped. The interface data set (Keskin et al., 2004) was used as a benchmark. Our goal is to see whether HFV residues can be used to distinguish between the interfaces and the rest of the surface. Previously, we have shown that conserved residues distinguish between the two (Ma et al., 2003). However, for structurally conserved residues, multiple structures are needed. Because HFV residues correlate with conserved residues, they might be used directly for this purpose, making it sufficient to have a single structure for binding site prediction.
In the analysis, we consider a shell of 7 Å from the surface. The number of the HFV residues in contact with both (interface, surface) regions is calculated. Surface residues are identified using ACCESS (Lee and Richards, 1971). The surface area for each residue is calculated and compared with the residue in Gly-X-Gly (Chothia, 1975). Here, a residue is exposed if its accessible surface area is >20% of the residue accessible surface area in extended conformation. Fig. 5 displays the (normalized) numbers of HFV residues overlapping with interface residues versus the rest of the surface for the 100 monomers. The results indicate that the HFV residues distinguish between the interfaces and the rest of the surfaces, just as the structurally conserved residues and the hot spot residues do. The results with <10% outliers are in agreement with the overlap of the HFV residues with the structurally conserved residues at the interfaces. The outliers are listed in the figure caption. Most are the same as in the correlation with the structurally conserved residues.
FIGURE 5.

The number of HFV residues contacting with the interface residues versus contacting with the rest of the surface residues for 100 cases. It is normalized by the number of interface residues and the number of residues in the rest of the surface, respectively. The width of the shell and the distance criteria for the interaction are taken as 7 Å; n is used to represent the number of the respective cases. The outliers: 1is7L (hydrolase/protein binding; no conservation neither in interacting nor in nearby residues); 1irxA, B (ligase; a lower threshold value <0.005 of high-frequency peaks is needed to be able to identify HFV residues); 1j46A (oxyreductase; lower threshold required for the fast-mode peaks); 1pmaA, B (protease; multiple interfaces); 1fntC (hydrolase activator; many interfaces); 1dz4A (oxyreductase; two clusters at other binding regions); 1fpuA, B (transferase; a large folding core and a cluster of residues somewhere else on the surface). The outliers are depicted by ×. The number of cases off the diagonal on the space of the noninterface surface residues is 25.
High-frequency vibrating residues in the monomers in the isolated and complexed states
Here, one of our aims is to investigate to what extent we can predict a binding site by analysis of residues' vibrational motions. Above, the monomer structures were taken from the complexed structures. However, there may be conformational changes between the unbound and the complexed monomers due to binding-induced perturbations leading to altered HFV residue patterns. The dynamic mode analysis is carried out for six cases for which we have both the monomeric and the complexed forms. Fig. 6 a displays the vibrations of the residues in the weighted average of the six fastest modes for the isolated monomer structure of glutathione S-transferase (PDB, 1b8x) and monomer A extracted from the complex of glutathione S-transferase (PDB, 1c72). The root mean-square deviation between the two structures is 8 Å. The number of the HFV residues corresponds to 13% of the residues in the structure. The structurally conserved residues are marked on the plot. All conserved residues are identified by the high-frequency peaks. The positions of the peaks and of the conserved residues are mostly in the nearby shell rather than on the surface residues. On the other hand, the other peaks may be associated with another binding site: the side chains of Tyr-6, Gly-11, Leu-12, Arg-107, Tyr-115, Gln-165, Ile-207, and Phe-208 define the pocket of the 1,2-epoxy-3-(p-nitrophenoxy) propane (EPNP) moiety (Chern et al., 2000). Some of the EPNP binding residues overlap with the high-frequency peaks and some are nearby. However, as the HFV residues cluster in space as those of the binding site, a plausible site for EPNP can be suggested even though there may be a partial overlap between the two clusters. Residues in peaks close to residues 20 and 155 that are nearby the EPNP site are mostly not near surface residues. This may suggest that some of these peaks may be associated with core residues. Fig. 6 b depicts ribbon diagrams of these two structures. These results are not surprising, as the HFV residues are still largely buried as are the conserved residues (mostly at the “nearby” layer (Ma et al., 2003; Keskin et al., 2005).
FIGURE 6.
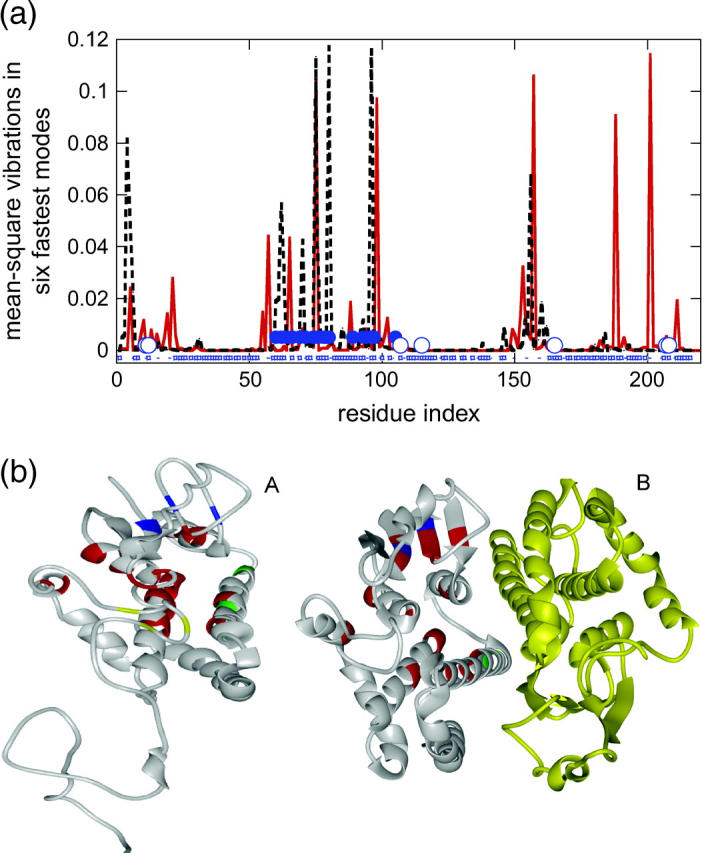
(a) The vibrations of the residues in the fastest six modes for the native monomer structure glutathione S-transferase, 1b8x (red), and the monomer A from its complex structure, 1c72 (dashed black). The interacting and nearby conserved residues and the residues of EPNP site are marked with blue dots and blue circles, respectively. The surface residues are labeled by blue squares. (b) The ribbon diagrams of the isolated monomer and the complex structures on which the HFV residues from panel a are marked. Red, blue, green, and yellow represent four clusters of the HFV residues on 1b8x (A) and red, blue, and green represent the three clusters of the HFV residues on 1c72A (B). The number of the HFV residues identified corresponds to ∼13% of the protein size. The root mean-square deviation between the two structures is 8 Å (on 212 residues; considering Cα-atoms).
This analysis here shows that there are certain regions in unbound structures that have similar local packings as those observed in bound structures. These regions may relate to the evolutionary conserved anchor residues as recently suggested by Rajamani et al. (2004).
CONCLUSIONS
Here we carry out a comprehensive analysis of a nonredundant data set of protein-protein interfaces derived from the entire PDB (Keskin et al., 2004). Starting from over 21,000 interfaces, at the highest level the data set contains 103 clusters. The clusters that contain conserved residues in a multiple structure alignment are used in the analysis. We find that the majority (>90%) of the conserved residues in the representative structures overlap clusters of high-frequency vibrating residues. We further carry out the analysis on protein-protein complexes where both members of the complex were alanine scanned, and contain residue hot spots. We find that without a single exception, all hot spots are HFV residues. At the same time, conserved residues in protein cores (Shakhnovich et al., 1996) and hot spots observed in hydrogen exchange experiments (Roder et al., 1988) also vibrate with high frequencies (Demirel et al., 1998). Hence, our results provide data substantiating the earlier proposition (Tsai et al., 1998) that protein binding and protein folding have similar underlying principles.
Here, we further observe that HFV residue clusters distinguish binding sites from the remainder of the protein surface. Previously, to computationally differentiate between the two, multiple structures were needed to detect conserved residues. Here we show that analysis of single structures and detection of regions of HFV residues may be sufficient to identify the location of protein binding sites with a relatively high probability.
The validation of the proposition that binding and folding are similar processes leads us to several conclusions: i), it confirms the evolutionary origin of split genes (Marcotte et al., 1999), and ii), it provides support to the hierarchical model of protein folding. Moreover, iii), it suggests that proteins can be combinatorially designed by fusing relatively stable substructures derived from different native proteins. It further supports iv), a similarity in scoring schemes in binding and folding, except for the relative contributions of the hydrophobic effect versus electrostatic interactions. It implies v), that as in folding, local packing is an extremely important factor in stabilizing protein associations, rationalizing the residue conservation and the experimental hot spots. Above all, vi), it fits with the general principles of chemistry of molecular organization, whether in subdomains, domains, subunit associations, and macromolecular assemblies, whether of native proteins or in amyloid fibrils.
Acknowledgments
We thank Drs. K. Gunasekaran, D. Zanuy, H.-H. (G). Tsai, C.-J. Tsai, and Y. Pan. We thank I. Halperin for assembling the alanine scanning double mutant data. We thank Dr. Jacob V. Maizel for discussions and encouragement.
The research of R. Nussinov in Israel was supported in part by the Center of Excellence in Geometric Computing and its Applications, funded by the Israel Science Foundation (administered by the Israel Academy of Sciences). This project has been funded in whole or in part with federal funds from the National Cancer Institute, National Institutes of Health, under contract No. NO1-CO-12400. T.H. greatly acknowledges the State Planning Organization of Bogazici University grant No. 01K120280 and Bogazici University research grant No. 02HA501, Turkish Academy of Sciences, in the framework of the Young Scientist Award Program (EA-TUBA-GEBIP/2001-1-1).
The publisher or recipient acknowledges the right of the U.S. government to retain a nonexclusive, royalty-free license in and to any copyright covering the article.
APPENDIX A
Figure .

APPENDIX B
The PDB codes of the monomer structures with the interfaces indicated in parentheses.
1kbA (AB); 1kbB (AB); 1tfxA (AC); 1tfxC (AC); 1if3A (AC); 1if3C (AC); 1tf6B (BD); 1c41A (AB); 1c41B (AB); 11ejoH (HP); 1bjjB (BC); 1bjjC (BC); 1i10A (AC); 1i10C (AC); 1c72A (AB); 1c72B (AB); 1abrA (AB); 1abrB (AB); 1sbwA (AI); 1sbwI (AI); 1fj1A (AF); 1fj1F (AF); 1dz1A (AB); 1dz1B (AB); 1fntG (Ge); 1b77A (AC); 1b77C (AC); 1d9kC (CP); 1bj1H (HW); 1fj1D (DE); 1fj1DE (DE); 1lmkA (AE); 1lmkE (AE); 1bev1 (13); 1bev3 (13); 1as4A (AB); 1as4B (AB); 1g1kA (AB); 1g1kB (AB); 1is7A (AL); 1is7L (AL); 1rvf1 (14); 1rvf4 (14); 1hyrB (BC); 1aw1A (AB); 1aw1B (AB); 1ao3A (AB); 1fq3A (AB); 1irxA (AB); 1irxB (AB); 1ijxC (CD); 1j46A (AB); 1js1Y (XY); 1rbiS (SB); 1a8kA (AC); 1k4wA (AB); 1cov1 (12); 1cov2 (12); 1klfD (DF); 1brbE (EI); 1brbI (EI); 1pmaA (AB); 1pmaB (AB); 1ca7A (AB); 1ca7B (AB); 1bev2 (23); 1bev3 (23); 1qu9A (AB); 1qu9B (AB); 1fntC (CK); 1fntK (CK); 1aoiC (CD); 1aoiD (CD); 1fytB (BD); 1fytD (BD); 1azeA (AB); 1azeB (AB); 1ezvG (FG); 2snIE (EI); 2snII (EI); 1ae1A (AB); 1ae1B (AB); 1dzqA (AB); 1dzqB (AB); 1cd0A (AB); 1cd0B (AB); 1dz4A (AB); 1dz4B (AB); 1cydA (AB); 1cydB (AB); 1dylB (BD); 1d3bA (AF); 1d3bF (AF); 1fpuA (AB); 1fpuB (AB); 1dubA (AC); 1dubC (AC); 1iaqA (AB); 1iaqB (AB); 1azsB (BC).
APPENDIX C
The following are structures for which there are hot spots data from the alanine scanning data, ASEdb (Thorn and Bogan, 2001), and consequently are analyzed here. Suffixes “1” and “2” indicate the monomers of the complex.
3hfm.1,3hfm.2; antibody-antigen complex
1dvf.1,1dvf.2; idiotope-antidiotope complex
1a4y.1, 1a4y.2; ribonuclease inhibitor-angiogenin complex
1brs.1, 1brs.2; barnase (G-specific endonuclease)-barstar complex
1jck1.1,1jck.2; toxin-receptor complex
3hhr.1 and 3hhr.2; human growth hormone-receptor complex
References
- Aloy, P., B. Bottcher, H. Ceulemans, C. Leuwein, C. Mellwig, S. Fischer, A. C. Gavin, P. Bork, G. Superti-Furga, L. Serrano, and R. B. Russel. 2004. Structure-based assembly of protein complexes in yeast. Science. 303:2026–2029. [DOI] [PubMed] [Google Scholar]
- Bahar, I., A. R. Atilgan, M. C. Demirel, and B. Erman. 1998. Vibrational dynamics of folded proteins: significance of slow and fast motions in relation to function and stability. Phys. Rev. Lett. 80:2733–2736. [Google Scholar]
- Bahar, I., A. R. Atilgan, and B. Erman. 1997. Direct evaluation of thermal fluctuations in proteins using a single-parameter harmonic potential. Fold. Des. 2:173–181. [DOI] [PubMed] [Google Scholar]
- Bahar, I., and R. L. Jernigan. 1997. Inter-residue potentials in globular proteins and the dominance of highly specific hydrophilic interactions at close separation. J. Mol. Biol. 266:195–214. [DOI] [PubMed] [Google Scholar]
- Bogan, A. A., and K. S. Thorn. 1998. Anatomy of hot spots in protein interfaces. J. Mol. Biol. 280:1–9. [DOI] [PubMed] [Google Scholar]
- Chern, M.-K., T.-C. Wu, C.-H. Hsieh, C.-C. Chou, L.-F. Liu, I.-C. Kuan, Y.-H. Yeh, C.-D. Hsiao, and F. T. Tam. 2000. Tyr115, Gln165 and Trp209 contribute to the 1,2-epoxy-3-(p nitrophenoxy)propane-conjugating activity of glutathione S-transferase cGSTM1-1. J. Mol. Biol. 300:1257–1269. [DOI] [PubMed] [Google Scholar]
- Chothia, C. 1975. Nature of accessible and buried surfaces in proteins. J. Mol. Biol. 105:1–14. [DOI] [PubMed] [Google Scholar]
- Demirel, M. C., A. R. Atilgan, R. L. Jernigan, B. Erman, and I. Bahar. 1998. Identification of kinetically hot residues in proteins. Protein Sci. 7:2522–2532. [DOI] [PMC free article] [PubMed] [Google Scholar]
- Fernandez, A., and H. A. Scheraga. 2003. Insufficiently dehydrated hydrogen bonds as determinants of protein interactions. Proc. Natl. Acad. Sci. USA. 100:113–118. [DOI] [PMC free article] [PubMed] [Google Scholar]
- Fernandez, A., R. Scott, and R. S. Berry. 2004. The nonconserved wrapping of conserved protein folds reveals a trend toward increasing connectivity in proteomic networks. Proc. Natl. Acad. Sci. USA. 101:2823–2827. [DOI] [PMC free article] [PubMed] [Google Scholar]
- Fersht, A. R. 1976. Nucleation mechanisms in protein folding. Curr. Opin. Struct. Biol. 7:3–9. [DOI] [PubMed] [Google Scholar]
- Gavin, A. C., M. Bosche, R. Krause, P. Grandi, M. Marzioch, A. Bauer, J. Schultz, J. M. Rick, A. M. Michon, C. M. Cruciat, M. Remor, C. Hofert, et al. 2002. Functional organization of the yeast proteome by systematic analysis of protein complexes. Nature. 415:141–147. [DOI] [PubMed] [Google Scholar]
- Halperin, I., H. Wolfson, and R. Nussinov. 2004. Protein-protein interactions: coupling of structurally conserved residues and of hot spots across interfaces. Implications for docking. Structure. 12:1027–1038. [DOI] [PubMed] [Google Scholar]
- Hu, Z., B. Ma, H. Wolfson, and R. Nussinov. 2000. Conservation of polar residues as hot spots at protein interfaces. Proteins. 39:331–342. [PubMed] [Google Scholar]
- Keskin, O., R. L. Jernigan, and I. Bahar. 2000. Proteins with similar architecture exhibit similar large-scale dynamic behavior. Biophys. J. 78:2093–2106. [DOI] [PMC free article] [PubMed] [Google Scholar]
- Keskin, O., B. Ma, and R. Nussinov. 2005. Hot regions in protein-protein interactions: the organization and contribution of structurally conserved hot spot residues. J. Mol. Biol. 345:1281–1294. [DOI] [PubMed] [Google Scholar]
- Keskin, O., C. J. Tsai, H. Wolfson, and R. Nussinov. 2004. A new, structurally nonredundant, diverse data set of protein-protein interfaces and its implications. Protein Sci. 13:1043–1055. [DOI] [PMC free article] [PubMed] [Google Scholar]
- Kortemme, T., and D. Baker. 2002. A simple physical model for binding energy hot spots in protein-protein complexes. Proc. Natl. Acad. Sci. USA. 99:14116–14121. [DOI] [PMC free article] [PubMed] [Google Scholar]
- Lee, B., and F. M. Richards. 1971. The interpretation of protein structures: estimation of static accessibility. J. Mol. Biol. 55:379–400. [DOI] [PubMed] [Google Scholar]
- Ma, J. P. 2004. New advances in normal mode analysis of supermolecular complexes and applications to structural refinement. Curr. Protein Pept. Sci. 5:119–123. [DOI] [PMC free article] [PubMed] [Google Scholar]
- Ma, B., T. Elkayam, H. Wolfson, and R. Nussinov. 2003. Protein-protein interactions: structurally conserved residues distinguish between binding sites and exposed protein surfaces. Proc. Natl. Acad. Sci. USA. 100:5772–5777. [DOI] [PMC free article] [PubMed] [Google Scholar]
- Marcotte, E. M., M. Pellegrini, H. L. Ng, D. W. Rice, T. O. Yeates, and D. Eisenberg. 1999. Detecting protein function and protein-protein interactions from genome sequences. Science. 285:751–753. [DOI] [PubMed] [Google Scholar]
- Massova, I., and P. A. Kollman. 1999. Computational alanine scanning to probe protein-protein interactions: a novel approach to evaluate binding free energies. J. Am. Chem. Soc. 121:8133–8143. [Google Scholar]
- Mirny, L., and E. J. Shakhnovich. 2001. Evolutionary conservation of the folding nucleus. J. Mol. Biol. 308:123–129. [DOI] [PubMed] [Google Scholar]
- Miyazawa, S., and R. L. Jernigan. 1985. Estimation of effective interresidue contact energies from protein crystal-structures: quasi-chemical approximation. Macromolecules. 18:534–552. [Google Scholar]
- Papageorgiou, A. C., R. Shapiro, and K. R. Acharya. 1997. Molecular recognition of human angiogenin by placental ribonuclease inhibitor—an X-ray crystallographic study at 2.0 angstrom resolution. EMBO J. 16:5162–5177. [DOI] [PMC free article] [PubMed] [Google Scholar]
- Perrett, S., J. Clarke, A. M. Hounslow, and A. R. Fersht. 1995. Relationship between equilibrium amide proton-exchange behavior and the folding pathway of barnase. Biochemistry. 34:9288–9298. [DOI] [PubMed] [Google Scholar]
- Rader, A. J., and I. Bahar. 2004. Identification of core amino acids stabilizing rhodopsin. Polym. 45:659–668. [DOI] [PMC free article] [PubMed] [Google Scholar]
- Rajamani, D., S. Thiel, V. Sandor, and C. J. Camacho. 2004. Anchor residues in protein-protein interactions. Proc. Natl. Acad. Sci. USA. 3:11287–11292. [DOI] [PMC free article] [PubMed] [Google Scholar]
- Roder, H., G. A. Elove, and S. W. Englander. 1988. Structural characterization of folding intermediates in cytochrome-c by h-exchange labeling and proton NMR. Nature. 335:700–704. [DOI] [PMC free article] [PubMed] [Google Scholar]
- Shakhnovich, E., V. Abkevich, and O. Ptitsyn. 1996. Conserved residues and the mechanism of protein folding. Nature. 379:96–98. [DOI] [PubMed] [Google Scholar]
- Shatsky, M., R. Nussinov, and H. Wolfson. 2004. A method for simultaneous alignment of multiple protein structures. Proteins. 56:143–156. [DOI] [PubMed] [Google Scholar]
- Shoemaker, B. J., J. Wang, and P. G. Wolynes. 1997. Structural correlations in protein folding funnels. Proc. Natl. Acad. Sci. USA. 94:777–782. [DOI] [PMC free article] [PubMed] [Google Scholar]
- Thorn, K. S., and A. A. Bogan. 2001. ASEdb: a database of alanine mutations and their effects on the free energy of binding in protein interactions. Bioinformatics. 17:284–285. [DOI] [PubMed] [Google Scholar]
- Tirion, M. M. 1996. Large amplitude elastic motions in proteins from a single-parameter, atomic analysis. Phys. Rev. Lett. 77:1905–1908. [DOI] [PubMed] [Google Scholar]
- Tsai, C. J., D. Xu, and R. Nussinov. 1998. Protein folding via binding and vice versa. Fold. Des. 3:R71–R80. [DOI] [PubMed] [Google Scholar]
- Uetz, P., L. Giot, G. Cagney, T. A. Mansfield, R. S. Judson, J. R. Knight, D. Lockshon, V. Narayan, M. Srinivasan, P. Pochart, A. Qureshi-Emili, Y. Li, B. Godwin, et al. 2000. A comprehensive analysis of protein-protein interactions in Saccharomyces cerevisiae. Nature. 403:623–627. [DOI] [PubMed] [Google Scholar]
- Verkhivker, G. M., D. Bouzida, D. K. Gehlhaar, P. A. Rejto, S. T. Freer, and P. W. Rose. 2002. Monte Carlo simulations of the peptide recognition at the consensus binding site of the constant fragment of human immunoglobulin G: the energy landscape analysis of a hot spot at the intermolecular interface. Proteins. 48:539–557. [DOI] [PubMed] [Google Scholar]
- Wu, Y. H., and J. P. Ma. 2004. Refinement of F-actin model against fiber diffraction data by long-range normal modes. Biophys. J. 86:116–124. [DOI] [PMC free article] [PubMed] [Google Scholar]