Abstract
We have performed molecular dynamics simulations of the interactions of the peptide SP-B1–25, which is a truncated version of the full pulmonary surfactant protein SP-B, with dipalmitoylphosphatidylcholine monolayers, which are the major lipid components of lung surfactant. Simulations of durations of 10–20 ns show that persistent hydrogen bonds form between the donor atoms of the protein and the acceptors of the lipid headgroup and that these bonds determine the position, orientation, and secondary structure of the peptide in the membrane environment. From an ensemble of initial conditions, the most probable equilibrium orientation of the α-helix of the peptide is predicted to be parallel to the interface, matching recent experimental results on model lipid mixtures. Simulations of a few mutated analogs of SP-B1–25 also suggest that the charged amino acids are important in determining the position of the peptide in the interface. The first eight amino acids of the peptide, also known as the insertion sequence, are found to be essential in reducing the fluctuations and anchoring the peptide in the lipid/water interface.
INTRODUCTION
Peptide-lipid interactions play a vital role in various biological processes such as signal transduction, cell fusion, and protein trafficking. Small membrane peptides are of fundamental interest both because of their biological activity and because they act as models for larger membrane proteins such as ion channels. Understanding small peptide-lipid interactions is a requisite first step toward the understanding of more complex phenomena seen in larger membrane proteins such as protein insertion into the membrane, folding in the membrane, protein-protein association, pore formation, and signal transduction. Recent experimental and computational advances have enabled detailed studies of the dynamics and energetics of interactions between small peptides and lipids (Simon and McIntosh, 2002). Experimental techniques such as solid-state NMR, neutron scattering, and x-ray scattering provide vital information about the ensemble-averaged peptide-lipid interactions. On the other hand, molecular dynamics simulations can provide insight about these interactions at a length scale that is still not realizable through most experiments. However, currently atomistic simulations are limited by high computational costs, small system sizes, and, most of all, the short timescale ( nanoseconds) that can be studied. Nevertheless, simulations, when complemented by experiments, can give a clearer picture of the systems of interest than can experiments alone.
Lung surfactant (LS) is a mixture of lipids and proteins that lines the alveolar epithelial cells of mammalian lungs. The main biophysical function of LS is to reduce the surface tension at the air/water interface in the lungs. Dysfunction or absence of LS leads to respiratory distress syndrome (RDS) in both neonates and adults. A typical treatment for RDS involves the use of animal surfactants as a replacement for human lung surfactant. However, animal sources carry the danger of viral infection or negative immunological response. Thus the production of a synthetic lung surfactant remains an important research goal and to facilitate this, the exact nature of the interactions of the various components of the LS needs to be fully understood.
LS is a mixture of various lipids (saturated, unsaturated, charged, and neutral), proteins (hydrophilic and hydrophobic), fatty acids, and cholesterol. The relative proportions of these various components vary from species to species. Dipalmitoylphosphatidylcholine (DPPC), a disaturated zwitterionic phospholipid, is the main tensoactive (surface-tension-reducing) component of LS, constituting ∼40–50% of it by mass. During the compression of the lung, DPPC packs tightly as a monolayer and enables near-zero surface tension of the lining of the lung. However, DPPC alone cannot respread rapidly during the expansion stage and hence surfactant therapies based on DPPC alone are bound to fail (Chu et al., 1967). Unsaturated and charged lipids such as palmitoyloleoylphosphatidylcholine, dipalmitoylphosphatidylglycerol (DPPG), and palmitoyloleoylphosphatidylglycerol (POPG) provide the necessary fluidity to obtain surfactant respreading during the expansion cycle. Nonetheless, mixtures of unsaturated lipids and DPPC inadequately mimic the properties of LS. Numerous in vitro and in vivo experiments have shown that surfactant protein B (SP-B) and surfactant protein C greatly enhance the surface properties of lipid monolayers (Oosterlaken-Dijksterhuis et al., 1991; Hall et al., 1992; Yu and Possmayer, 1990, 1992). In particular, SP-B has been found to be critically important for the proper respiratory function in vivo (Pryhuber, 1998; Nogee et al., 1993). LS reconstituted with synthetic phospholipids and SP-B alone appear to yield full biophysical functioning in preterm infant rhesus monkeys (Revak et al., 1991, 1996). The singularly important role of SP-B in facilitating respiratory function was also shown by genetic knockout experiments in which mice exhibit RDS when SP-B production is blocked (Clark et al., 1995). The protein SP-B is relatively short, containing only 78 amino acid residues. An even shorter version of the protein, the N-terminal, 25-amino acid, α-helical peptide SP-B1–25 produces much the same effect as the whole protein (Bruni et al., 1998). Thus, a mixture of DPPC, anionic lipids, and SP-B1–25 is an excellent model for the mammalian lung surfactant.
The sequence of SP-B1–25 in humans is FPIPL PYCWL CRALI KRIQA MIPKG, with most residues being highly conserved in other species. The first eight residues are highly hydrophobic and are hypothesized to form an insertion sequence. This part of the protein is relatively inflexible due to the presence of three alternating proline residues. Residues 9–22 form an amphipathic α-helix, and the last three residues form a coil motif. A ribbon diagram of SP-B1–25 depicting the cationic, anionic, and hydrophobic regions is shown in Fig. 1. Experiments in vitro using model surfactants have shown that during a compression cycle mimicking that of breathing, the monolayers get enriched in DPPC through the squeezing out of non-DPPC lipids and proteins (Yu and Possmayer, 1992; Taneva and Keough, 1994a,b; Pastrana-Rios et al., 1994; Kruger et al., 1999), resulting in near-zero surface tension. The squeezed-out material is stored in a multilamellar phase directly beneath the monolayer, ready to be respread into the monolayer during the expansion cycle of the alveoli (Schurch et al., 1995, 1998). There is significant evidence that SP-B plays a vital role in retaining the squeezed out lipids near the interface (Nag et al., 1999; Creuwels et al., 1996). However, recent studies indicate that fluidity might be a relatively minor determinant of adsorption and that solid films, which resist collapse, can form by kinetic processes unrelated to equilibrium phase behavior (Piknova et al., 2002). Thus, the postulated role of SP-B is still inconclusive. Nevertheless, it is clear that SP-B interacts differently with DPPC than with other lipids and this difference is partially responsible for the proper functioning of the lung. Since DPPC is a zwitterionic lipid, this suggests possible similarities between lung-surfactant SP-B peptide and antimicrobial peptides, since the latter selectively target bacterial membranes, which are inherently more anionic than eukaryotic membranes. This difference in lipid composition leads to the disruption of the bacterial membrane and eventually leads to cell death, although not affecting the host eukaryote.
FIGURE 1.
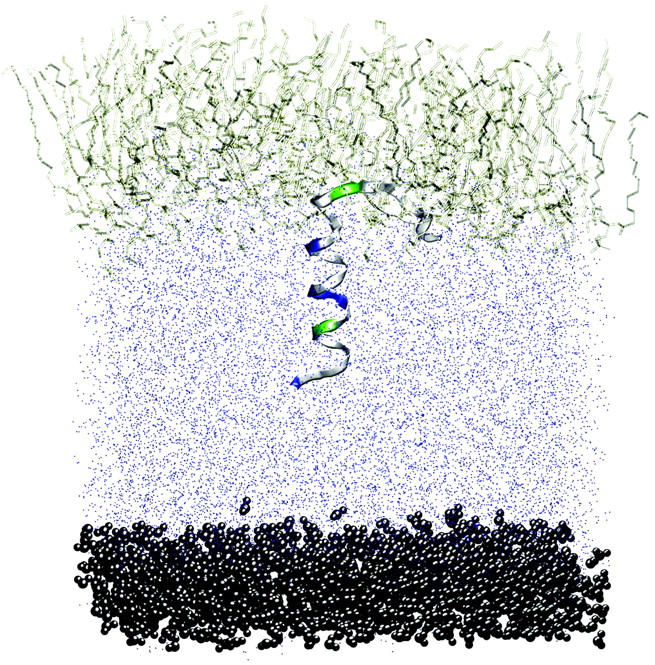
Snapshot of the lipid/water/peptide monolayer used in the simulations. The lipids are represented as bonds. Water is shown by blue dots and the restraining layer of water (the wall) is shown as black spheres. The peptide is represented as a ribbon. In the ribbon, blue regions represent anionic amino acids, green regions represent cationic amino acids, and white regions represent hydrophobic domains. This system consists of 64 DPPC molecules, ∼6500 water molecules, and one peptide. The system is periodic in all three directions. The image was created using visual molecular dynamics (Humphrey et al., 1996).
Earlier, 2-ns long simulations (Kaznessis et al., 2002) showed that SP-B1–25 interacts more strongly with DPPG lipid monolayers than with DPPC monolayers. Their work also showed that the interactions between the headgroup regions of the DPPG lipids and the cationic amino acids of the peptide were particularly strong. This study also revealed that in DPPG monolayers, the peptide tended to tilt upwards, inserting its hydrophobic groups into the lipid tail region and its helical amphipathic region into the lipid headgroup region, whereas in DPPC monolayers, the peptide was parallel to the interface, mostly in the water subphase. However, there is experimental evidence to the contrary, suggesting a shallow profile for the peptide at the interface (Wang et al., 2003; Dieudonne et al., 2001; Gordon et al., 1996 ; Cruz et al., 1998; Lee et al., 2000). Recent experiments by Wang et al. (2003) suggest that in model LS mixtures, which contain both DPPC and other lipid components, the peptide adopts a conformation that is parallel to the interface with the insertion region interacting with the interface, the cationic amino acids interacting with the water subphase, and the hydrophobic amino acids of the helix region interacting with the lipid tail region. Thus, there is still confusion about the preferred conformation of the SP-B1–25 peptide in various lipid environments. To elucidate further the nature of the interactions between SP-B1–25 and the lipid components, in this report, we study the truncated lung surfactant protein SP-B1–25 and its mutants, with DPPC lipid monolayers using molecular dynamics simulations with focus on the specific interactions between the lipid interfacial region and the polar amino acids of the peptide.
METHODS
We have performed a series of simulations of a monolayer containing 64 DPPC molecules, at a density of 62.5 Å2/lipid, a peptide, and ∼6500 water molecules. The different stages of the simulations and the conditions imposed during each stage are provided in Table 1, and the peptides, starting conditions, and run times are given in Table 2. All the simulations were performed using the GROMACS simulation package (Berendsen et al., 1995; Lindahl et al., 2001). The modified GROMOS united-atom parameter set was used after downloading from http://moose.bio.ucalgary.ca/download.html, file: lipid.itp. The peptide structure and coordinates were downloaded from the Protein Data Bank (code, 1DFW). This peptide was then used as a template to obtain the mutated peptides MUT1–MUT5. The software Swiss Protein Data Bank viewer (http://us.expasy.org/spdbv/) was used to perform the mutations.
TABLE 1.
Simulation parameters for the various stages
| Lipid equilibration | Peptide insertion | Peptide-lipid equilibration | Production run | |
|---|---|---|---|---|
| Temperature (K) | 323 | 323 | 323 | 323 |
| Pressure (atm) | 1 | 1 | 1 | 1 |
| vdW cutoff (nm) | 1.2 | 1.2 | 1.2 | 1.2 |
| Electrostatics | PME | PME | PME | PME |
| Length of the run (ns) | 5 | 0.05 | 1 | 10 |
| Position restraints | none | Lipid phosphorus atoms* | Peptide backbone | none |
| Position restraint force (kJ/mol/m2) | — | 1000 | 1000 | — |
| Hole making force (kJ/mol/m2) | — | 100 | — | — |
vdW, van der Waals.
During the peptide insertion stage, the lipid phosphorus atoms were position-restrained in the xy plane.
TABLE 2.
List of simulations
| Sequence | Angle formed by helix with interfacial plane (°) | Cα atom of peptide in plane with average position of lipid P8 atom | Total simulation time (ns) | |
|---|---|---|---|---|
| PER1 | FPIPLPYCWLCRALIKRIQAMIPKG | 90 | W-9 | 20 |
| PER2 | FPIPLPYCWLCRALIKRIQAMIPKG | 90 | C-11 | 10 |
| PER3 | FPIPLPYCWLCRALIKRIQAMIPKG | 90 | A-13 | 10 |
| PAR1 | FPIPLPYCWLCRALIKRIQAMIPKG | 0 | W-9* | 10 |
| PAR2 | FPIPLPYCWLCRALIKRIQAMIPKG | 0 | W-9* | 10 |
| PAR3 | FPIPLPYCWLCRALIKRIQAMIPKG | 0 | W-9* | 10 |
| PAR4 | FPIPLPYCWLCRALIKRIQAMIPKG | 0 | C-11 | 10 |
| PAR5 | FPIPLPYCWLCRALIKRIQAMIPKG | 0 | A-13 | 10 |
| MUT1 | WLCRALIKRIQAMIPKG | 90 | W-9 | 10 |
| MUT2 | FPIPLPYCWLCAALIAAIQAMIPAG | 90 | W-9 | 10 |
| MUT3 | WLCAALIAAIQAMIPAG | 90 | W-9 | 10 |
| MUT4 | FPIPLPYCWLCAALIKRIQAMIPAG | 90 | W-9 | 10 |
| MUT5 | LPYCWLCRALIKRIQAMIPKG | 90 | W-9 | 10 |
| WAT | FPIPLPYCWLCRALIKRIQAMPIKG | — | SP-B1–25 in water | 20 |
All the PER simulations begin with the peptide perpendicular to the interface and the PAR simulations begin with the peptide parallel to the interface. MUT simulations were performed on peptides that were mutated from the original sequence, and they begin with the peptide perpendicular to the interface.
PAR1, PAR2, and PAR3 differ in the orientation of the hydrophobic sequence (residues 1–8) with respect to the interface. In PAR1, the sequence is embedded in the lipid tail region, in PAR2, the sequence is embedded in the water subphase, and in PAR3, the sequence is embedded in the interfacial region. These orientations were achieved by rotating the peptide by 90° at a time about its principal helical axis. PER2 is inserted deeper into the lipid tail region than is PER1, and PER3 is deeper than PER2.
Monolayer configuration and equilibration
The system consisted of 64 DPPC lipids in a monolayer leaflet, ∼6500 water molecules, one peptide, and an appropriate number of counterions to maintain electroneutrality of the system. (see Fig. 1). The initial monolayer configuration was obtained by replicating a single DPPC molecule 64 times as a monolayer in a box of size 6.4 × 6.4 × 30 nm. Then, ∼6500 water molecules were added below the headgroup region of the monolayer and periodic boundary conditions were applied in all three directions. The large distance between the lipid tails and the water molecules in the periodic image in the z direction ensured that interactions among them were minimal. The molecules in a water layer with a thickness of ∼0.7 nm were position-restrained to act as a wall. This barrier essentially disallows water in the bulk to diffuse through and rejoin the lipid tail region. This monolayer leaflet was equilibrated for 5 ns using conditions specified in Table 1. A cut-off was used for van der Waals interactions and particle mesh Ewald summation (PME) was used for electrostatic interactions (Essmann et al., 1995). The temperature was maintained at 323 K by coupling the system to a Berendsen thermostat (Berendsen et al., 1984). The pressure was controlled by isotropically coupling to a Berendsen barostat at 1 atm pressure. Thus, the volume of the system fluctuated during this step. During the equilibration run, we did not observe any water molecules diffuse either through the lipid tails in the positive z direction or through the restrained water region in the negative z direction. The final configuration from this equilibration simulation was used as the starting condition for all the simulations.
Peptide insertion and equilibration
Peptides, listed in Table 2, were inserted into the equilibrated monolayer obtained from step 1. The insertion into the monolayer was effected using the “hole” protocol (Faraldo-Gomez et al., 2002). Briefly, the molecular surface of the peptide to be inserted was scanned using the program MSMS (Sanner et al., 1996). Then, a molecular dynamics simulation was performed on the monolayer with an additional hole-making force. This created a hole corresponding to the molecular surface in the appropriate region of the lipid monolayer. Then, the peptide was inserted into the hole and an energy minimization step was performed with position restraints on the whole peptide. Then, an appropriate number of counterions was added to ensure electroneutrality of the system. After this step, the backbone atoms of the peptide were position-restrained and an equilibration run of 1 ns was performed in the NPzAT ensemble, allowing the lipids to equilibrate around the peptide and the side chains to sample other conformations. The final configuration from the equilibration run was the starting condition for the production runs for all the simulations.
Production runs
All the peptides listed in Table 2 were inserted into the monolayer obtained from step 1 using the protocol described in step 2. Then, a molecular dynamics simulation was performed on the whole system using conditions specified in Table 1 in the NPzAT ensemble. The area of the system was maintained at 62.5 A2/lipid. (This corresponds to the equilibrium area of the simulation cell at the end of the equilibration run). In the z direction (axis perpendicular to the water/lipid interface), a Berendsen barostat was applied to maintain a pressure of 1 atm. The system was coupled to a Berendsen temperature bath at 323 K. A cut-off was used for van der Waals interactions and PME summation was used for calculation of the electrostatic interactions. The bond lengths were constrained using the LINCS algorithm (Hess et al., 1997). The simulations were 10 ns long with a time step of 2 fs. The coordinates were saved every 500 steps (every ps) to give a trajectory with 10,000 frames that was used for analysis.
RESULTS AND DISCUSSION
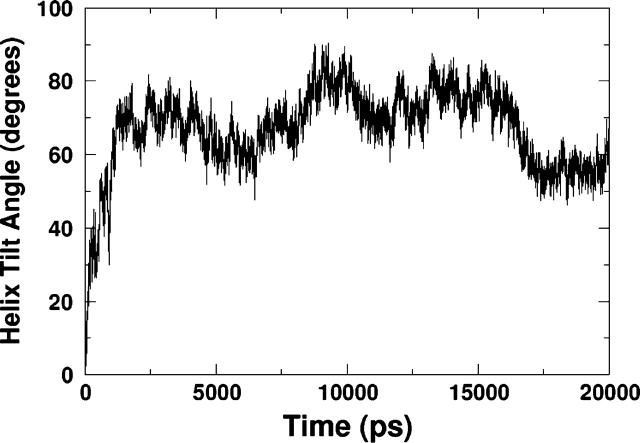
Simulations were carried out with the peptide initially perpendicular to the interface (PER1, PER1, and PER3 in Table 2) as well as initially parallel to the interface (PAR1, PAR2, PAR3, PAR4, and PAR5). Since the exact position of the peptide with respect to the interface is unknown experimentally (i.e., the depth of insertion), in most of the simulations, we placed the peptide such that the Cα atom of the W-9 residue was in the same z-position as the average position of the lipid phosphorus atoms (PER1, PAR1–PAR3, MUT1–MUT5). This is a reasonable starting condition since the tryptophan residue is found to have a preferred interfacial position in most membrane proteins. This also enables us to compare our results with those of Kaznessis et al. (2002). We also performed some simulations with subtly different initial conditions (different depths of insertion) to study the effect of initial condition on the final configuration of the peptide (PER2, PER3, PAR4, and PAR5). Simulations were also performed with mutated versions of the peptide (MUT1, MUT2, MUT3, MUT4, and MUT5), where the specific mutations are presented in Table 2. All the simulations were performed for 10 ns each except for PER1, which was run for 20 ns. The results from PER1 will be discussed in detail, and the results from the other simulations compared with these. After a 1-ns equilibration run, during which the peptide backbone was kept fixed in position, a 20-ns production run was performed. Snapshots from the beginning and the end of the simulation are shown in Fig. 2. We can clearly see that the peptide, which is initially in a vertical position, moves to a final configuration with the major axis horizontal to the interface. The angle formed by the helical portion of the peptide with the membrane normal is shown in Fig. 3. This angle is simply the angle between the z axis and the line connecting the Cα atoms of residues W-9 and I-22. The peptide is purported to be an α-helix between these residues (although the secondary structure may change during the duration of the simulation). This simple method of calculation leads to fairly large fluctuations in the tilt angle. Moreover, this method does not take into account any major secondary structure changes (such as kinks) in the intermediate residues. However, since the helix length is fairly small, spanning ∼15 residues, and we are just interested in the overall orientation of the peptide, this method of calculation is adequate for calculating the tilt angle. Using this method, a 0° tilt angle (±20°) represents a vertical orientation of the peptide and a 90° tilt angle (±20°) represents a horizontal orientation of the peptide. Thus, Fig. 3 illustrates that the peptide changes over from an initial vertical position to a largely horizontal orientation at the end of the simulation. This can be explained by the nature of the interactions between the peptide and the lipid.
FIGURE 2.
Snapshots from the beginning and end (20 ns) of simulation PER1. Initially, the peptide is perpendicular to the water/lipid interface. The final configuration is closer to a parallel orientation. Note that the water molecules have been omitted for the sake of clarity.
FIGURE 3.
Angle formed by the helix with the membrane normal in simulation PER1. With respect to the interface normal, 0° is perpendicular and 90° is parallel. The helix tilt angle is calculated by measuring the angle between the vertical z axis and the line formed by the Cα atoms of residues C-8 and I-22. This shows that the peptide moves from an initial position that is perpendicular to the lipid/water interface to a final position that is mostly parallel to the lipid/water interface.
The lipid tail region, consisting of the acyl chains, is highly hydrophobic and is devoid of any formal charges, whereas the lipid headgroup region, consisting of the phosphatidylcholine group, is a complex domain where electrostatic interactions are likely to dominate. DPPC is a zwitterionic lipid, i.e., it has no net charge, but it has a charge distribution within the headgroup, which induces a dipole moment. This enables the headgroups to form hydrogen bonds with the peptides, especially with the cationic amino acids. The headgroup of each DPPC molecule has eight possible hydrogen-bond acceptors. The peptide has a plethora of donor elements, some of them in the peptide backbone and others in the polar side chains. These hydrogen-bond interactions determine the final conformation of the peptide in the lipid environment. We show a schematic representation of the lipid chain in Fig. 4. The hydrogen-bond acceptor sites are present in the phosphate and glycerol regions of the phospholipid. We have also labeled the oxygens as O1–O4 in the phosphate region and O5–O8 in the glycerol region. Due to the helical structure of the peptide, the peptide backbone donors are not as easily accessible to the lipid acceptors as are the peptide side chains. Hence, we can expect side chain-lipid interactions to be more prevalent and stronger than backbone-lipid interactions. Analysis of the peptide sequence shows that there are seven amino acids that are most likely to be hydrogen-bond donors. They are tyrosine 7 (Y-7), tryptophan 9 (W-9), arginine 12 (R-12), lysine 16 (K-16), arginine 17 (R-17), glutamine 19 (Q-19), and lysine 24 (K-24). Tyrosine and tryptophan have one hydrogen-bond donor each, whereas the others have more donor sites: glutamine has two donors, lysine has three, and arginine has five. These donors can form hydrogen bonds with the acceptors of the DPPC atoms to create a large hydrogen-bonded network, which will play a crucial role in determining the conformation of the peptide in the lipid.
FIGURE 4.
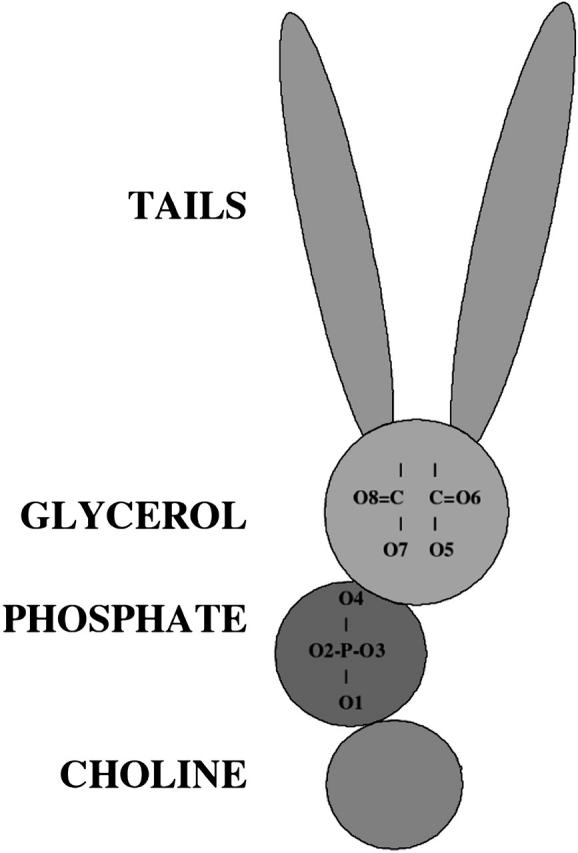
A schematic representation of the lipid, showing the tail, glycerol, phosphate, and choline regions. The oxygens in the phosphate and glycerol region, which are the hydrogen-bond acceptor sites, are numbered, and these indices are used in the discussion of hydrogen-bonding statistics.
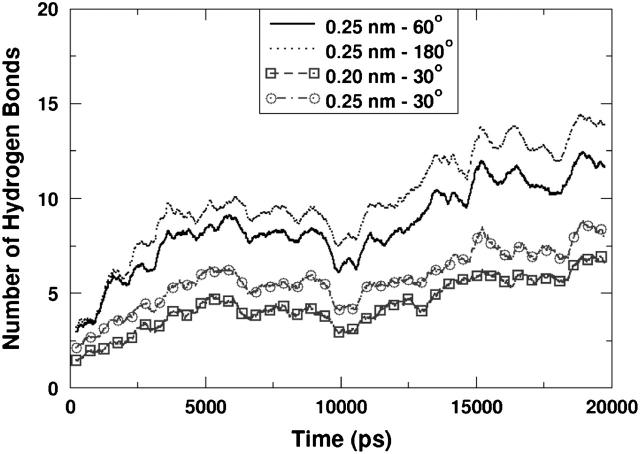
We analyzed the hydrogen-bonding characteristics of the aforementioned amino acids during the course of the simulation. Following a widely used criterion (Jeffrey and Sanger, 1991), a hydrogen bond is said to exist if the donor-acceptor distance is <0.25 nm and the angle formed by the donor-hydrogen-acceptor triplet is <60°. Analysis using a stricter or looser criterion for bonding provided very similar results qualitatively. For the sake of comparison we have plotted, in Fig. 5, the number of hydrogen bonds formed between the peptide and the lipids in simulation PER1. We have used four different criteria for hydrogen bonding. Along with the widely used 0.25-nm, 60° criterion, we used a strict 0.25-nm, 30°, an even stricter 0.2 nm, 30°, and an extremely liberal 0.25-nm, 180° criterion. We found that, quantitatively, the different criteria produced different results, as shown in Fig. 5, with a larger number of bonds counted using the liberal criterion and fewer bonds counted using the strictest criterion. However, qualitatively, the curves show very similar trends. This is also observed from hydrogen-bonding existence maps as will be discussed shortly. Since a large amount of the discussion in this article is based on the persistence of hydrogen bonds, it is important to note that the results from the different criteria did not affect the interpretation of the trends qualitatively. Hence, the typical 0.25, 60° criterion was used for analysis of all the trajectories. Note that according to the criterion we have used a single donor could theoretically form more than one hydrogen bond at any given time if there were a sufficient number of acceptor sites in the vicinity of the donor atom that satisfied the hydrogen-bonding criterion. However, this is highly unlikely due to geometric constraints.
FIGURE 5.
Number of hydrogen bonds between the peptide and lipid using different geometric criteria for the definition of a hydrogen bond. The geometric criterion uses a cut-off for the donor-acceptor distance and the donor-hydrogen-acceptor angle. Although the different criteria predict different numbers of hydrogen bonds, the qualitative trend is similar.
At the beginning of the simulation, the W-9 residue and the Y-7 residue are present in the interfacial region. R-12, K-16, R-17, Q-19, and K-24 are in the water subphase. Hence, the latter five residues do not have the ability to form hydrogen bonds with the lipid at the beginning of the simulation. However, these residues are free to form hydrogen bonds with water, but these bonds are likely to be short lived due to the high diffusivity of water. For these reasons, the portion of the peptide in the water subphase is likely to be very flexible and sample more configurations than the part of the peptide that is embedded in the lipid. However, given enough time, the portion in the water subphase will eventually be able to reconfigure to interact with the lipid headgroups, and therefore be able to form hydrogen bonds with the lipid. This phenomenon is shown in Fig. 6 c, where the glutamine 19 residue forms its first hydrogen bond at ∼10 ns and these bonds stay persistent throughout the rest of the simulation.
FIGURE 6.
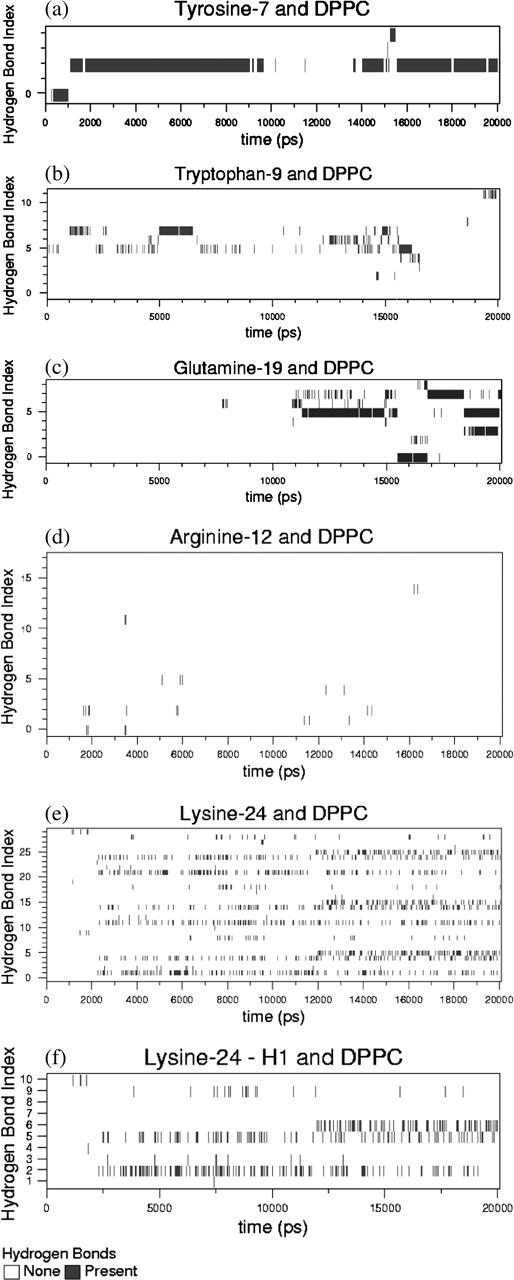
Hydrogen-bond existence map for various amino acids interacting with DPPC. Black implies the presence of a hydrogen bond and white implies the absence of one. The y-coordinate shows the hydrogen-bond index. Each index represents a unique donor-acceptor pair: (a) DPPC and tyrosine-7; (b) DPPC and tryptophan-9; (c) DPPC and glutamine-19; (d) DPPC and arginine-12; (e) DPPC and lysine-24; and (f) DPPC and lysine-24-hydrogen 1 (Fig. 6 f is a subset of Fig. 6 e). A detailed explanation of the individual bond indices corresponding to Fig. 6 f is shown in Table 3.
Fig. 6 a shows the hydrogen-bond existence map for the side chain of Y-7 and DPPC. Tyrosine has one donor atom and each DPPC has eight possible acceptor atoms. Since there are 64 DPPC lipids in the system, a total of 512 lipid acceptors are present in the system. Hence, if the tyrosine side chain is able to sample all of its possible conformational space (i.e., given enough time), theoretically it could sample 512 unique hydrogen bonds. But due to the short timescale of the simulation and the fact that the lipid diffusivity is extremely low, the side chain can only sample a small portion of its conformational space. So the tyrosine can form hydrogen bonds only with the lipid acceptor atoms in its immediate neighborhood. During the course of the 20-ns simulation, it forms five unique hydrogen bonds. Analysis of the bonding characteristics shows these bonds are formed with just two of the neighboring DPPC molecules, one bond with the first DPPC molecule and four with the second. One of those bonds (bond index number 2 in Fig. 6 a) is the most persistent and is continuously present for long periods of time. Note that in this figure, the indices are labeled from 0 to 4. Similar existence maps are shown for W-9 (12 unique hydrogen bonds), R-12 (18 bonds), Q-19 (9 bonds), and K-24 (30 unique bonds). K-16 and R-17 each formed just one hydrogen bond, each lasting just a few picoseconds, and hence those maps are not shown here. Note that K-16 and R-17 form hydrogen bonds with water throughout the course of the simulation. However, these hydrogen bonds are not persistent due to the high diffusivity of water molecules.
At the beginning of the simulation, the Cα atom of the W-9 residue was placed at the interfacial region, in plane with the average position of the phosphorus atom of the lipids. This positioned the side chain of W-9 slightly above the interfacial region, interacting with the acyl chains of the lipid tail. Nevertheless, the side chain of this residue is close enough to the acceptor groups that it is able to form hydrogen bonds with the neighboring DPPC molecules. K-24 was initially present deep in the water subphase, ∼2 nm away from the interface. However, after ∼2 ns of simulation, fluctuations enabled it to move close enough to the interfacial region to form hydrogen bonds with lipids. Once the residue moved close enough to the lipid headgroups to interact, due to the limited diffusivity of the lipid molecules in the timescale of the simulation, the lysine residue stayed bound to the lipid headgroup region. This is shown in Fig. 6 e. We observe that although the lysine hydrogen bonds last throughout the simulation, they are extremely intermittent, frequently breaking and reforming. The lysine side chain can form at least three unique hydrogen bonds at any given time due to its three donor atoms, which compete for acceptors. Because of fluctuations and the abundance of acceptor sites, all donors are electrostatically attracted to the different acceptor sites simultaneously. This competition leads to frequent bond formation and breaking and hence the observed intermittency in the hydrogen-bonding characteristics. Nevertheless, the donors still remain in the same vicinity. In Fig. 6 e, although 30 unique hydrogen bonds are observed, all these K-24 side-chain bonds are formed with the acceptor sites of just three DPPC molecules during the entire course of the simulation. This “pinning” of the K-24 and other amino acids by multiple hydrogen bonds is likely to lead to a very low diffusivity of the peptide in the monolayer, a diffusivity much too small to be measured in a 20-ns simulation.
Fig. 6 e shows the 30 unique hydrogen-bond indices as a function of time. We can see three similar clusters of hydrogen bonds, roughly grouped into indices 1–10, 11–20, and 21–30. In Fig. 6 e, the first 10 indices correspond to the hydrogen bonds formed by the first hydrogen of the lysine side chain; the next 10 correspond to those formed by the second hydrogen, and the last 10 correspond to those formed by the third hydrogen. The interpretation of the hydrogen-bond indices is facilitated by showing, on an expanded scale, the first 10 hydrogen bonds in Fig. 6 f. These 10 unique hydrogen bonds are formed by different sets of nitrogen-hydrogen-acceptor triplets, where the nitrogen and hydrogen are the same in all 10 bonds, and the acceptors are 10 different oxygens in the lipid headgroups. Analysis shows that a total of three DPPC lipids form hydrogen bonds with this particular lysine side chain, with the bulk of the bonding formed by a single DPPC lipid. The specific acceptors corresponding to each index in Fig. 6 e are tabulated in Table 3. Bond indices 1 and 10 are formed by lipids 1 and 3 (arbitrarily numbered), whereas the other eight bonds are formed by the second DPPC molecule. The specific oxygens are mentioned in the table and they correspond to those labeled in Fig. 4. From Fig. 6 f, we can see that bonds with indices 2 and 5 are the most persistent in the simulation. These two oxygens correspond to the lipid phosphate group (see Table 3). At ∼12,000 ps, another reasonably persistent hydrogen bond is formed, corresponding to O5 of the lipid, which is present in the glycerol region. It is interesting to note that in this particular case, the second lipid uses all of its hydrogen-bond acceptor sites to interact with the lysine side chain. Thus the interactions are highly localized and this effectively restricts the mobility of the peptide in the timescale of the simulations. Hydrogen-bond existence maps using the stricter 0.20-nm, 30° criterion show qualitatively identical behavior (data not shown).
TABLE 3.
Hydrogen-bond acceptor sites corresponding to specific bond indices
| Index | Acceptor |
|---|---|
| 1 | DPPC1–O3 |
| 2 | DPPC2–O1 |
| 3 | DPPC2–O2 |
| 4 | DPPC2–O3 |
| 5 | DPPC2–O4 |
| 6 | DPPC2–O5 |
| 7 | DPPC2–O6 |
| 8 | DPPC2–O7 |
| 9 | DPPC2–O8 |
| 10 | DPPC3–O8 |
Similar tendencies are observed in the case of Q-19 (Fig. 6 c), which first encounters the interfacial region after ∼10 ns and then forms hydrogen bonds with the DPPC molecules. However, in the case of R-12 (Fig. 6 d), the hydrogen bonding with the DPPC interface is not so persistent despite the fact that it is much closer to the interface at the beginning of the simulation than is Q-19 or K-24. This is due to the fact that the R-12 side chain is spatially constrained to remain in the water subphase because of the sequence of earlier hydrogen-bonding events, which anchor the peptide in a position and orientation that makes R-12 unable to reach the lipid interface. Thus, it forms a sparse number of hydrogen bonds compared to K-24, Y-7, W-9, or Q-19. Similar spatial constraints disallow interactions of K-16 and R-17 with the DPPC headgroups.
From this simulation, a clearer picture of lipid-peptide interactions emerges. Hydrogen bonding between the peptide and lipid headgroups is persistent and determines the conformation of the peptide. The portion of the peptide in the water subphase can sample a much larger conformational space until it encounters the lipid interfacial region. Once the amino acids that have hydrogen-bond donors get close enough to the interface, they form hydrogen bonds with the lipids, which pin the amino acid to the immediate vicinity of the acceptor atoms. The hydrogen bonds thus greatly limit the diffusivity of the peptide and the conformational space that the peptide can sample, ultimately controlling the equilibrium distribution of configurations of the peptide-lipid complex, which is realized at simulation times too long to be achievable by current computational methods. However, we can conclude that the peptide prefers to reside in the interface since this leads to the most favorable configuration through formation of hydrogen bonds. Although the discussion above has been limited to the side chains, the peptide backbone also forms hydrogen bonds with the DPPC acceptor headgroups. However, these bonding events can be considered to be byproducts of the side chain-lipid interactions, which largely control the overall peptide-lipid interaction because of their easier accessibility and hence higher probability of donor-acceptor interaction.
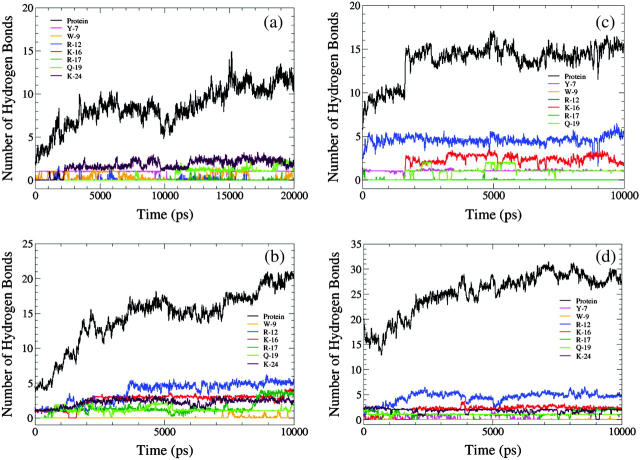
Fig. 7 a shows the total number of hydrogen bonds between the peptide and lipid over the course of the simulation. The contributions from individual amino acids are also shown. For the sake of clarity, a running average over 20 ps has been plotted and thus the number of bonds can be fractional and not necessarily an integer. In general, the total number of hydrogen bonds between the peptide and the lipids increases with time. Initially, when the peptide is vertical with respect to the interface, very few amino acids are in contact with the choline groups. As the simulation progresses, more groups come into contact with the headgroups, leading to more hydrogen bonds.
FIGURE 7.
The number of hydrogen bonds formed between DPPC and the peptide SP-B1–25 and its component amino acids in various simulations: (a) PER1; (b) PER2; (c) PER3; and (d) PAR3. To reduce the noise, a running average over 20 ps is plotted here.
Table 4 provides some detailed hydrogen-bonding statistics of PER1 and the other simulations. We show the total number of hydrogen bonds between the following pairs at early and late stages of the simulations: protein-lipid, protein-water, lipid-water, and intramolecular protein hydrogen bonds. The early stage is an average over the first nanosecond of the simulation, whereas the late stage corresponds to an average over the last 10 ns for PER1 and the last 5 ns for all the other simulations. The standard deviations for all the values provided in the table are small enough that statistically meaningful trends from the early to late stages can be elucidated. Fig. 7 a shows that the number of lipid-protein interactions increases with time. Data from Table 4 also show that the number of protein-water hydrogen bonds and lipid-water hydrogen bonds decreases with time. This is to be expected, since the peptide forms more hydrogen bonds with the lipids as time increases. This effectively renders some of the lipid (acceptor) sites and protein (donor and acceptor) sites inaccessible to the water molecules. We also show the intramolecular protein-protein hydrogen bonds in Table 4. These hydrogen bonds are mostly just the 1–4 hydrogen bonds of the α-helical structure. We observe that for PER1, the number of protein-protein hydrogen bonds decreases slightly with time. This mostly has to do with subtle secondary-structure rearrangements in the peptide.
TABLE 4.
Average number of hydrogen bonds formed at the early and late stages of the simulations for protein-lipid pairs, protein-water pairs, lipid-water pairs, and intramolecular peptide hydrogen bonds
| Protein-lipid
|
Protein-water
|
Lipid-water
|
Protein-protein
|
|||||
|---|---|---|---|---|---|---|---|---|
| Run | 0–1 ns | 5–10 ns | 0–1 ns | 5–10 ns | 0–1 ns | 5–10 ns | 0–1 ns | 5–10 ns |
| PER1 | 3.2 | 9.9 | 38.4 | 31.7 | 394 | 369 | 12 | 8.7 |
| PER2 | 9.1 | 14.4 | 34.1 | 23.2 | 406 | 387 | 10.9 | 7.1 |
| PER3 | 5.3 | 17.1 | 27.4 | 16.0 | 405 | 385 | 14.6 | 13.5 |
| PAR1 | 14.8 | 19.4 | 19.9 | 11.8 | 400 | 388 | 11.8 | 11.9 |
| PAR2 | 10.1 | 15.3 | 30.3 | 20.1 | 407 | 387 | 9.3 | 8.4 |
| PAR3 | 16.2 | 28.1 | 27.8 | 15.5 | 397 | 368 | 6.0 | 5.8 |
| PAR4 | 9.3 | 22.3 | 31.7 | 19.0 | 397 | 367 | 8.8 | 7.0 |
| PAR5 | 14.5 | 17.8 | 12.7 | 11.1 | 388 | 372 | 13.8 | 13.1 |
| MUT1 | 4.9 | 9.7 | 36.3 | 28.5 | 403 | 395 | 8.9 | 7.9 |
| MUT2 | 1.6 | 5.4 | 26.3 | 21.5 | 400 | 378 | 13.3 | 8.0 |
| MUT3 | 3.1 | 6.1 | 21.1 | 11.6 | 407 | 380 | 11.3 | 10.2 |
| MUT4 | 3.6 | 11.8 | 31.3 | 23.6 | 403 | 382 | 12.3 | 7.9 |
| MUT5 | 8.1 | 17.9 | 30.6 | 18.5 | 405 | 382 | 10.7 | 8.9 |
For the beginning of the simulations, the first nanosecond is averaged and for the late stages of the simulation, the last 5 ns are averaged. For simulation PER1, the last 10 ns are averaged for the late stages. The general trend is for the number of protein-lipid hydrogen bonds to increase with time, the protein-water and lipid-water hydrogen bonds to decrease with time, and the intramolecular protein hydrogen bonds to stay constant or slightly decrease with time. The standard deviations in all the values in this table are approximately of the magnitude 1. Hence, comparisons of early and late stages of a given simulation are indeed statistically valid (except, in some cases, protein-protein interactions).
Thus, PER1 shows that the peptide moves from an initially vertical orientation to a mostly horizontal one, and in the process, forms persistent hydrogen bonds with the lipid headgroup regions. This also effectively reduces the number of peptide-water and lipid-water hydrogen bonds.
Other simulations with an initially perpendicular orientation of the peptide
To understand the effect of the initial position and orientation of the peptide on its conformational evolution, we performed many 10-ns simulations with different initial conditions than those of PER1 (see Table 1). PER2 was simulated with the peptide helix perpendicular to the interfacial plane (as in PER1), but with the position of the Cα of the 11th residue (a cysteine residue) at the same z-position as the average phosphorus atom of the lipids. Since in PER1 the 9th residue was placed at this position, in PER2 the peptide is inserted more deeply into the lipid tail region than in PER1. This positions Y-7 and W-9 farther away from the interface and deeper into the lipid tail region, relative to PER1. This also positions R-12 at the interface and places K-16, R-17, Q-19, and K-24 closer to the interface than in PER1. With this initial condition, the simulation was performed for 10 ns and the number of hydrogen bonds formed is plotted in Fig. 7 b, averaged over 20 ps. There are significant differences in the hydrogen-bonding characteristics between this run and PER1. R-12 and K-16, which formed very few bonds in PER1, form the most bonds in PER2. This is due to the fact that R-12 is at the interface at the beginning of the simulation and is able to form hydrogen bonds instantly. This can be seen from Fig. 7 b, where R-12 forms ∼5 bonds at the very beginning of the simulation and continues to maintain five bonds throughout the simulation. K-16, which is initially in the water subphase, forms its first hydrogen bond at ∼1600 ns and continues to maintain that bond until the end of the run at 10 ns. Interestingly, R-17 hardly forms any hydrogen bonds. Again, this is a result of simple spatial constraints. K-24 is also excluded from forming any hydrogen bonds since it resides in the water subphase throughout the 10-ns simulation. Another interesting observation is that W-9, which is in the lipid tail region, hardly forms any hydrogen bonds. Table 4 shows that PER2 also follows a similar trend in the various hydrogen-bonding characteristics. We see an increase in the number of protein-lipid hydrogen bonds as the simulation progresses, and a decrease in the protein-water and lipid-water hydrogen bonds.
Fig. 7 c shows the hydrogen-bonding characteristics of simulation PER3, where the peptide was initially oriented vertically with the Cα atom of A-13 (alanine) positioned in plane with the average lipid phosphorus atom. Thus, initially R-12 is in the interfacial region, Y-7 and W-9 are in the lipid tail region, and K-16, R-17, Q-19, and K-24 are all in the water subphase. We observe no hydrogen bonding with Y-7, since it is now deeper in the lipid tail region. W-9, which is also in the lipid tail region (but closer to the interfacial region than Y-7), shows sparse hydrogen bonding. R-12, K-16, Q-19, and K-24 form persistent hydrogen bonds. The interesting observation in this simulation is that although R-17 is initially close to the headgroup region, over the course of the simulation it only forms an average of two hydrogen bonds (out of the possible five), and does so only late in the simulation. Again, Table 4 shows similar trends for this simulation as in PER1 and PER2.
Simulations with an initially parallel orientation of the peptide
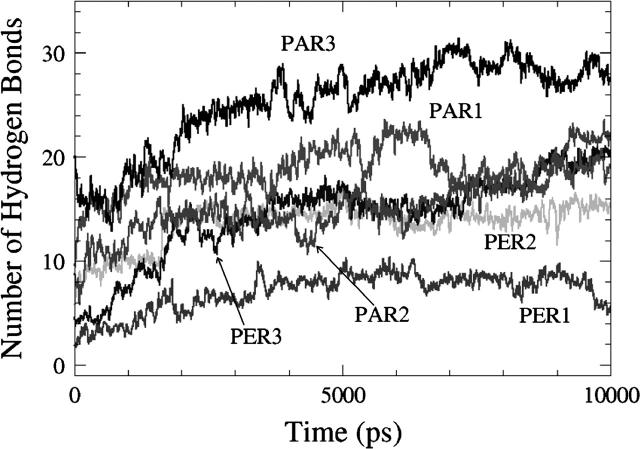
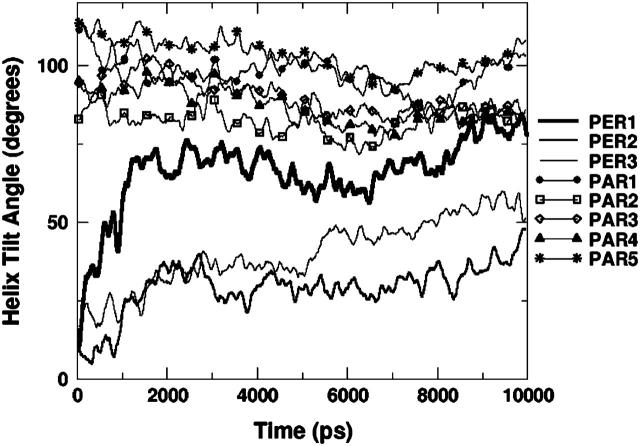
In both PER2 and PER3, the helix is initially vertical, and adopts a final orientation that is closer to horizontal (though not fully horizontal) at the end of the 10-ns simulation, to accommodate the side chain-lipid interactions. This suggests that a horizontal orientation might be more favorable than a vertical one. To test this idea, we performed five independent simulations (PAR1, PAR2, PAR3, PAR4, and PAR5), each 10 ns long, with different starting positions for the peptide, but with the peptide helical axis parallel to the interface. Results from one of these simulations (PAR3) is shown in Fig. 7 d. The total number of hydrogen bonds between the peptide and the lipid is higher in this simulation than in PER1, PER2, or PER3 because all the side-chain residues are much closer to the headgroups at the beginning of the simulation than in the PER simulations. Y-7, R-12, K-16, Q-19, and K-24 form persevering hydrogen bonds throughout the course of the simulation. Even in this simulation, R-17 is partially constrained and does not engage all of its donor atoms in hydrogen bonding. W-9 again forms no hydrogen bonds even though it resides very close to the interfacial region. This behavior of W-9, both in this simulation and in earlier PER simulations, can be explained by the bulkiness of the tryptophan side chain and hence the ability to screen out the donor nitrogen in most cases. Fig. 8 shows the total number of hydrogen bonds between the peptide and lipids in the six different simulations, three with initially vertical peptides and three from initially horizontal peptides. As a general trend, peptides with an initial horizontal orientation form more hydrogen bonds with the lipid headgroups than those that begin with a vertical orientation. This is to be expected, since for horizontally oriented peptides the hydrogen-bond donors are closer to the acceptor sites than for vertically oriented peptides. In all the PER simulations, the peptide helix orientation shifts from an initially vertical orientation to an orientation that is tilted to varying degrees. In all the PAR simulations, the final peptide orientation resembles the initial horizontal orientation. Fig. 9 shows the helix tilt angles of all these simulations. Thus, in the timescale of these simulations, it is clear that almost all the initial configurations favor a final configuration in which the peptide helix lies parallel to the interface and this phenomenon can be explained purely in terms of maximization of hydrogen bonding between the peptide and the lipid. The analysis of the peptide-water and lipid-water hydrogen bonds for the PAR simulations show trends similar (Table 4) to the PER simulations. Although the absolute magnitudes differ, the number of lipid-peptide hydrogen bonds increases, and the number of lipid-water and water-peptide hydrogen bonds decreases with time. This correlates well with the tendency to orient to a more parallel orientation, thus reducing the accessibility of the water molecules to some of the protein and lipid surface area.
FIGURE 8.
The total number of hydrogen bonds formed between DPPC and the peptide SP-B1–25 in six different simulations. PER1, PER2, and PER3 have an initial perpendicular orientation for the peptide with different depths of insertion (PER3 inserted deepest and PER1 shallowest), whereas PAR1, PAR2, and PAR3 have initial parallel orientations. For the sake of clarity, a running average over 20 ps is plotted here. As a general trend, peptides with an initial horizontal orientation form more hydrogen bonds.
FIGURE 9.
Tilt angle of the α-helix with respect to the z axis. With respect to the interface, 0° represents a vertical orientation, whereas 90° represents a horizontal orientation. Peptides that start from a horizontal configuration tend to stay horizontal whereas peptides with an initially vertical orientation tilt toward a more horizontal orientation.
We observed that all peptides bob, twist, and tilt to accommodate the tendency of the side-chain donors to form hydrogen bonds with the lipid headgroups. This causes the secondary structure of the peptide backbone to change with time. As mentioned earlier, the first eight amino acids of the peptide form a coil motif, residues 9–22 form an α-helix, and the last few residues form a coil. This is the measured structure of SP-B1–25 in POPG lipids (Gordon et al., 2000). During the course of the simulation, this secondary structure of the peptide changes. We broadly capture that effect in Table 4 by observing the intramolecular hydrogen bonds of the peptide. At early stages, the peptide is close to the initial structure. However, as time progresses, the peptide secondary structure changes, due to interactions with water and the lipid. In general, the ends of the peptide fray due to interactions with water and slight unraveling of the peptide. This leads to a reduction in the number of peptide-peptide hydrogen bonds. The secondary structure change is fairly subtle in most of the simulations performed in this work. However, some of the simulations do show drastic changes in the secondary structure of the peptide. Fig. 10 shows the secondary-structure profile from different simulations. PER2 shows a drastic change in secondary structure between ∼2 and 8 ns of the simulation, especially in residues 9–22, which is the α-helical region. This represents the period of time during which the cationic side chains are forming hydrogen bonds. The peptide backbone accommodates this by breaking some of the intramolecular hydrogen bonds. This leads to unraveling of the α-helix and formation of a π-helix structure, which is a more loosely wound secondary structure than the original α-helix. This enables the side chains to sample a larger conformational space and form hydrogen bonds. During the last 2 ns of the simulation, we observe some parts of the π-helix fold back to an α-helix motif.
FIGURE 10.
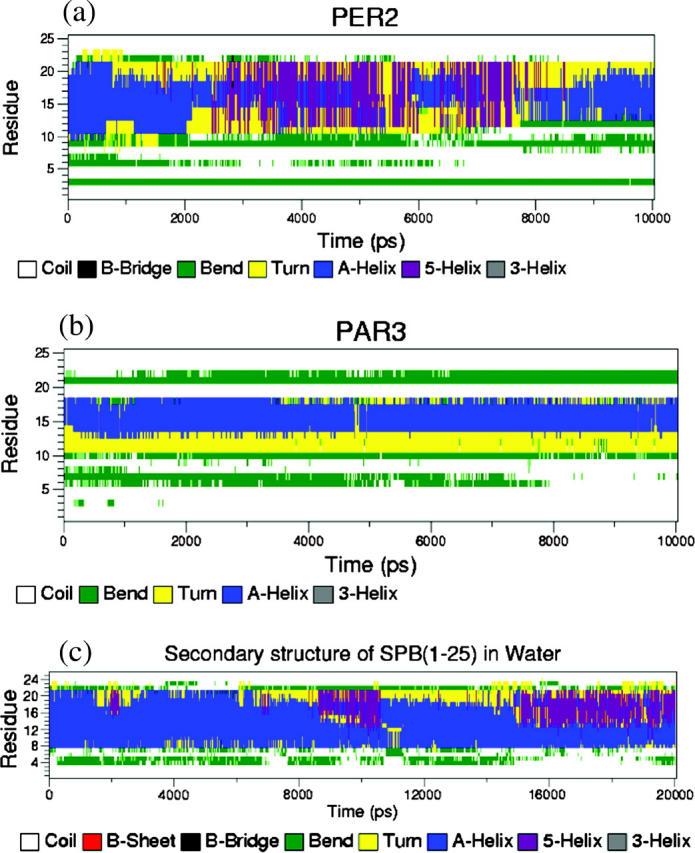
Secondary-structure profile of peptides in (a) simulation PER2, where the peptide is initially perpendicular to the interface; (b) simulation PAR3, where the peptide is initially parallel to the interface; and (c) a simulation of SP-B1–25 in water to show the destabilizing effect of water on the secondary structure.
In simulation PAR3 in Fig. 10, the peptide is initially in the interfacial region. Thus, most of the side-chain donors are accessible for hydrogen bond formation from the start of the simulation and therefore not much conformational rearrangement of the backbone is necessary to achieve the favorable hydrogen bonding. Hence, the peptide backbone remains fairly stable throughout the simulation. Note that although residues 9–22 of the peptide are α-helical during the initial simulation set up process, some of the helicity is lost during the equilibration stage, especially in residues 9–12 and 19–22. Nonetheless, the secondary structure is fairly stable (although it is not uniformly the expected α-helical structure) throughout the PAR simulations, whereas drastic rearrangements occur in PER simulations. This phenomenon is also generally observed in the other PAR and PER simulations (data not shown). For the sake of comparison, the secondary structure of the peptide simulated in a bath of water is also shown. We observe that loss of secondary structure is fairly severe in this simulation. Thus, we can see that the peptide tends to fray along the terminus when in contact with water. This could explain some of the loss in secondary structure of the peptide in all the simulations with the lipids and water, since the peptides in those simulations are always surrounded by a large number of water molecules, depending on the initial conditions.
Thus, from the series of PAR and PER simulations, some general conclusions can be drawn. The peptides seem to prefer a horizontal orientation to maximize the contact between the donor side chains and the lipid headgroups. The secondary structure of the peptide is also modified to enable this. The interactions between the cationic amino acids and the headgroup seem to be fairly important. It is commonly believed that the first eight amino acids of the peptide form an insertion sequence and it is extremely important in anchoring the peptide to the interface. To further study the importance of the charged amino acids and the insertion sequence, we performed a few more simulations where the peptide was mutated at select amino acids.
Mutated peptides
We performed five simulations (MUT1–MUT5) of mutated peptides in DPPC monolayers. Details of the amino acid sequences of the peptides are provided in Table 2. The initial peptide orientation in all these simulations is vertical, similar to PER1, with the Cα atom of the W-9 residue in plane with the average position of the phosphorus atoms. In MUT1, the entire insertion sequence is removed to give a shorter version of the peptide. In MUT2, all the lysines and arginines are replaced by alanines to give a neutral peptide. MUT3 is a combination of MUT1 and MUT2 in that the insertion sequence is removed and the charged amino acids are mutated to alanines. In MUT4, only two of the charges are removed (R-12 and K-24) and replaced by alanines; and in MUT5, only the first four residues of the insertion sequence are removed to give a 21-amino acid-long peptide. These mutations give us a broad enough spectrum of changes to decipher the importance of the insertion sequence and the cationic amino acids.
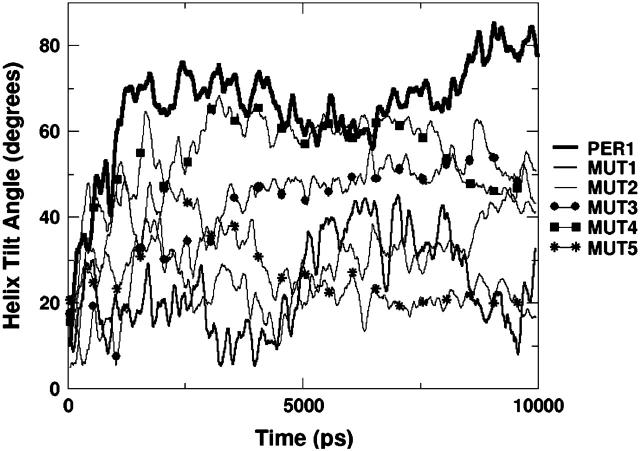
From Table 4, we can observe that, as expected, MUT2 and MUT3 (which have no charged residues) form the fewest hydrogen bonds and MUT5 forms the most hydrogen bonds, with MUT1 and MUT4 in between. Because of the lack of charges on the side chains, all the hydrogen bonding in MUT2 and MUT3 mutants occurs through donors on the peptide backbone and polar side chains. MUT4 has two of the charged groups still remaining and hence it interacts more strongly with the DPPC than either MUT2 or MUT3. MUT1 and MUT5 have all the cationic residues intact. Thus, they should have stronger interactions with the lipid headgroup when compared to the other three mutants. The insertion sequence is believed to anchor the peptide in the interfacial region and determine the orientation of the peptide. Fig. 11 depicts the helical tilt angle of all the MUT simulations. Unlike the PER and PAR simulations, in these simulations with mutated peptides, we observe widely varying behavior. MUT1, which has no insertion sequence, shows wild fluctuations about an average tilt angle of 20° with the z axis, which is a nearly perpendicular orientation. This lends credence to the hypothesis that the insertion sequence is necessary to stably anchor the peptide at the interface. MUT2, which has the insertion sequence but no charged residues, also shows fluctuations similar to MUT1, indicating that lack of hydrogen bonding also leads to fluctuating orientations. These two simulations behave as expected from the earlier analyses. However, unexpectedly, MUT3, which is both truncated and uncharged, seems to show a steady trend toward a more tilted orientation from the initial vertical position. This can perhaps be explained by the fact that due to the lack of both an insertion sequence and charges, the peptide resides mostly in the water subphase and has a greater conformational freedom than the peptides in the other simulations. Also, due to the truncations, the first residue in this mutant happens to be W-9, which is assumed to be one of the ends of the helix for the tilt angle calculations. Because this W-9 is a terminal residue, it tends to be more frayed than a W-9 residue in the middle of a sequence. MUT4, which lacks two of the five charged amino acids, shows a similar trend, tending toward a more horizontal orientation. Toward the end of the simulation, the trend is slightly reversed, but nevertheless the overall orientation tilts away from the vertical position.
FIGURE 11.
Tilt angle with respect to the z axis of the α-helix of mutated peptides (simulations MUT1–MUT5). With respect to the interface, 0° represents a vertical orientation whereas 90° represents a horizontal orientation.
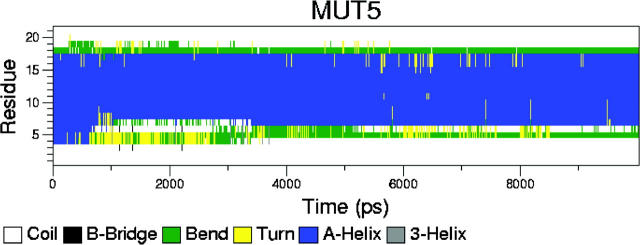
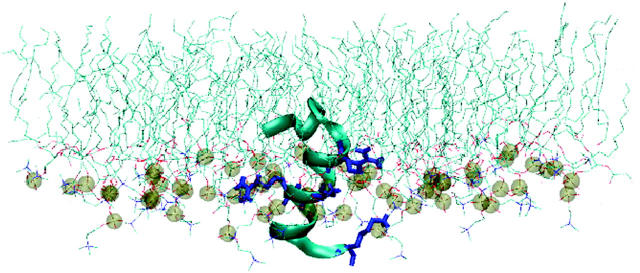
Table 4 shows that of all the mutated peptides, MUT5 forms the most hydrogen bonds with DPPC. This is to be expected since it has all the charged residues and the insertion sequence is partially present. Thus, of all the mutated peptides, we should expect MUT5 to behave most similarly to the unmutated peptide. This is apparent in the hydrogen-bonding characteristics. However, the peptide does not rotate toward a parallel orientation as occurs in simulations PER1, PER2, and PER3. This can be explained by analyzing the peptides' conformations and proximity to lipid donors. As observed in almost all the PER simulations, some of the cationic residues do not hydrogen-bond with the lipids or do so sparingly. This is because they are either in the water subphase away from the interface or are conformationally disallowed to form bonds. We observed this especially in adjacent residues K-16 and R-17. Both these residues have long side chains that can “snorkel” through the water to find favorable interactions with the lipid. However, as a peptide tilts itself toward the lipid headgroup region, if both the residues happen to be on the side of the helix that is away from the interface, then in the simulation time available, not all of the seven donor side chains will be able to find suitable acceptors. Longer times will eventually permit all the donor atoms to find acceptor atoms to form persistent hydrogen bonds, through changes in the secondary structure of the peptide. MUT5 represents a case where all the donor amino acids find suitable acceptor sites within the timescale of the simulation (although such a trajectory or sequence of events is a low-probability-event). Thus, the peptide does not need to alter its secondary structure to enable these favorable events. This can also be clearly seen in Fig. 12, which shows that the secondary structure of the peptide remains fairly constant with time, with a well-preserved α-helical content. A snapshot from the final stages of the simulation is shown in Fig. 13. The four charged residues—R-12, K-16, R-17, and K-24—are shown as blue bonds. The phosphorus atoms are drawn as van der Waals spheres for reference. We can see that all four residues manage to interact with the lipid interface region in this snapshot. This is the reason for the large number of hydrogen bonds and relative stability of the peptide. Water has not been shown for the sake of clarity.
FIGURE 12.
Secondary structure of the peptide in simulation MUT5. Note that the secondary structure is highly conserved throughout the simulation.
FIGURE 13.
Snapshot of the simulation MUT5 at 10 ns. The peptide is shown as ribbons. The DPPC lipid is drawn as lines. The charged amino acids are depicted as blue bonds. The phosphorus atoms of the lipid molecules are drawn as spheres to clarify the approximate position of the interface. Water molecules are not shown. Observe that all the charged amino acids are in the lipid/water interface region, leading to a large number of hydrogen bonds and a stable peptide secondary structure and relative orientation.
Thus, the results from the study of mutated peptides suggest that the insertion sequence is probably necessary to anchor the peptide at the interface. They also suggest that the charged amino acids are essential for binding the peptide to the interface. Some inconsistencies in the orientation of the peptide are observed in some of the MUT simulations. A strongly bonded peptide in MUT5, coupled with fluctuating tilt angles and a highly preserved secondary structure, seems to suggest that a parallel orientation of the peptide is not a necessary condition for strong binding. However, when the results of all the simulations are put into perspective, it is clear that a horizontal orientation is the most likely and energetically favorable position since it maximizes the interactions between the cationic side chains and the zwitterionic headgroups.
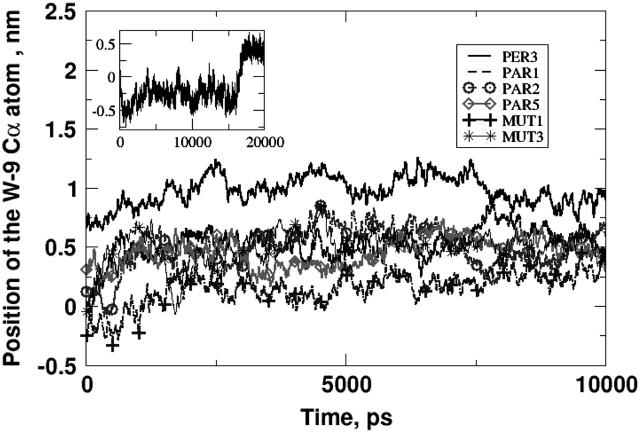
Having discussed in detail the peptide orientation, we discuss the relative positions of the peptide with respect to the interface. In most of the simulations, the initial position of the peptide was such that the backbone carbon atom of the tryptophan residue was in plane (same z-coordinate) with the average lipid phosphorus atom. This was an arbitrary, but reasonable, choice. Some of the simulations had slightly different insertion depths (see Table 2), but in no case differing by >0.5 nm from the standard case (Cα of the W residue in plane with phosphorus). The lipid/water interfacial region is fairly wide and we are interested in observing the position of the peptide, specifically the tryptophan residue, as the simulation progresses. The position of the backbone carbon atom of the tryptophan residue as a function of simulation time is plotted for some of the simulations inFig. 14. We have only shown six simulations for the sake of clarity. In this figure, the zero position corresponds to the average position of the phosphorus atoms in the DPPC bilayer. Positive values correspond to positions above the phosphorus plane (i.e., deeper into the lipid tail region), and negative values correspond to positions below the phosphorus plane (i.e., closer to the water subphase). See Fig. 1 for reference. We can see that, after 10-ns runs, the general trend is for the Cα atom of the tryptophan residue to reside ∼0.5 nm above the average phosphorus atom. Similar trends were observed for a few of the other simulations not shown in this figure. However, it must be mentioned that in two of the simulations not shown here, the average position of the tryptophan residue was below the average phosphorus plane. Nevertheless, our simulations show that the overall trend was for the Cα atom of the tryptophan residue to reside a few Angstroms above the plane formed by the phosphorus atoms of the lipid. The inset in Fig. 14 shows the position of the tryptophan residue in simulation PER1. Although at early stages, the peptide has a shallow profile, after 15 ns, the peptide inserts itself deeper into the lipid bilayer. Thus, typically the peptide's position at the end of the simulation is such that the tryptophan residue is anchored in the interfacial region at a tilted orientation. An earlier, much shorter simulation by Kaznessis et al. (2002) showed that the peptide was expelled into the water subphase in DPPC monolayers. We do not observe that phenomenon in our simulations.
FIGURE 14.
The average position of the backbone carbon of the tryptophan residue in some of the simulations. Zero on the y axis represents the average position of the lipid phosphorus atoms. A positive value corresponds to a deeply inserted position (closer to the lipid tails) and a negative value corresponds to a shallower position (closer to the water subphase). The general trend is for the tryptophan residue to reside ∼5 Å above the phosphorus plane. The inset shows the longer PER1 simulation.
Recent experimental results using fluorescence quenching (Wang et al., 2003) predicted the location and depth of each residue of the SP-B1–25 peptide in a model phospholipid bilayer. This bilayer was a mixture of DPPC, cholesterol, and anionic PG. However, since DPPC was the major component, we presume that their results can be compared with ours, at least as a first approximation. Their results showed that residues F-1 through P-6 are present at the interface, residues Y-7, C-8, and W-9 are present in the lipid tail region, residues L-10 through I-22 form an α-helix which has its axis parallel to the interface, and residues P-23, K-24, and G-25 lie at the interface. Our 10- to 20-ns-long simulations agree well with these results. The simulation that most resembles the conformation from this experiment is PAR3, where the peptide was initially placed parallel to the interface. Interestingly, this simulation forms the most hydrogen bonds, suggesting the most favorable position. Their results also show that this position and orientation is consistent with that of the SP-B1–25 domain in the naturally occurring full-length protein SP-B1–78. This also supports earlier reports suggesting a shallow profile for the peptide rather than a vertical or an inserted profile.
The supposed function of SP-B1–78 (and, presumably of SP-B1–25) is to interact with both DPPC and the anionic lipids to maintain the “squeezed out” lipids directly under the monolayer so that they can respread during the expansion cycle of the lung. In this study, we focused on the interactions between SP-B1–25 and DPPC. The other important interaction that needs to be studied is the one between SP-B1–25 and the anionic lipids DPPG and POPG. Note that these interactions are likely to be different from the DPPC-peptide interactions. From the perspective of hydrogen bonding, DPPC lipids possess only acceptor sites. However, DPPG and POPG, which have a glycerol headgroup, have both donor and acceptor sites. This will probably drastically change the electrostatic interactions between the peptide and lipid. Understanding this difference in interactions between the peptide and the lipid at a molecular level could be a very important step to understanding squeeze-out. Simulations of DPPG lipids and SP-B1–25 peptide are currently under way. We have also performed some simulations of SP-B1–25 peptide in palmitic monolayers.
We simulated in the NPzAT ensemble, where the lateral area was fixed and the pressure was allowed to fluctuate in the z direction. However, in vivo, the LS monolayer constantly undergoes changes in surface area. Obviously this slow (milliseconds to seconds) process cannot be simulated by molecular dynamics. However, it is probably a wise idea to simulate the same system at different surface areas and using different ensembles. Hydrogen bonding by the peptide is highly dependent on the distribution of acceptor and donor sites around the peptide. A different surface area could change the charge distribution, which in turn can change the hydrogen-bonding characteristics.
Earlier experimental results by Lee et al. (2001) on palmitic acid (PA) monolayers suggested a tilted orientation for the peptide. Palmitic acid is a minor component of LS. However, it is easier to characterize experimentally than lipids with bulky headgroups. Palmitic acid has a very small headgroup and does not possess as many bonding sites as a choline headgroup. Hence, we speculate that the peptide can sample more conformations in a PA monolayer than in a DPPC monolayer and can diffuse around more freely. Thus, a tilted, rather than horizontal, orientation is not unlikely in PA monolayers. Synthetic peptides with amphipathic properties, such as KL4 (sequence: K(L4K)3L4K) and RL4, have been partially successful in restoring proper respiratory function. Studies of these simpler peptides could also yield a better understanding of lipid-peptide interactions at a molecular scale.
SUMMARY AND CONCLUSIONS
Simulations of DPPC monolayers with SP-B1–25 peptide and its mutants have provided many insights into the nature of the interactions between the peptides and the lipids. Zwitterionic DPPC has a tendency to form hydrogen bonds with the polar and cationic amino acids of the peptide. These bonding interactions dictate the structure, orientation, and positioning of the peptide in the lipid/water interface. Simulations with different starting conditions suggest that the most favorable position for the peptide is with its helical axis parallel to the interface. This position optimizes the hydrogen-bonding probability of the peptide by exposing its side chains to a maximum number of external donor and acceptor sites. Although peptides in some of the simulations did not reach a near-horizontal orientation on the timescale of the simulation due to locally trapped minima, longer simulations will probably produce nearly horizontal orientations. The peptide backbone secondary structure fluctuates through breakage of intramolecular hydrogen bonds, which enables the formation of intermolecular hydrogen bonds by the side-chain groups. All the simulations showed a similar trend of increasing peptide-lipid hydrogen bonds, along with decreasing peptide-water and lipid-water interactions. Using different criteria for hydrogen bonding showed slightly different quantitative behavior but nearly identical qualitative behavior. We also observe that the depth of insertion is fairly conserved, with the tryptophan residues lingering a few Angstroms above the average phosphorus position of the lipid, in the interfacial region. We do not observe drastic extremes in positions, like insertion into the lipid tail region or expulsion from the bilayer in the timescale of the simulations. Our simulation results match reasonably well with existing experiments that also show a horizontal equilibrium orientation of the peptide.
The most immediate issues that need to be addressed include the nature of interactions of these peptides with anionic lipids with charged headgroups, such as POPG, and fatty acids with small headgroups, such as palmitic acid. Longer simulations might clarify a few of the conflicting trends observed in the simulations with DPPC presented here. Another important goal will be to study the interactions of simpler model peptides such as KL4 and RL4. These simulations could yield insights into the rational design of synthetic lung surfactants and, more importantly, a better fundamental understanding of the molecular interactions between lipids and peptides, one of the most common, yet least understood, aspects of molecular biology.
References
- Berendsen, H. J. C., J. P. M. Postma, W. F. van Gunsteren, A. Dinola, and J. R. Haak. 1984. Molecular dynamics with coupling to an external bath. J. Chem. Phys. 81:3684–3690. [Google Scholar]
- Berendsen, H. J. C., D. van der Spoel, and R. van Drunen. 1995. GROMACS: A message-passing parallel molecular dynamics implementation. Comput. Phys. Commun. 91:43–56. [Google Scholar]
- Bruni, R., J. M. Hernandez-Juviel, R. Tanoviceanu, and F. J. Walther. 1998. Synthetic mimics of surfactant proteins B and C: In vitro surface activity and effects on lung compliance in two animal models of surfactant deficiency. Mol. Genet. Metab. 63:116–125. [DOI] [PubMed] [Google Scholar]
- Chu, J., J. A. Clements, E. K. Cotton, M. H. Klaus, A. Y. Sweet, and W. H. Tooley. 1967. Neonatal pulmonary ischemia. I. Clinical and physiological studies. Pediatrics. 40:709–782. [PubMed] [Google Scholar]
- Clark, J. C., S. E. Wert, C. J. Bachurski, M. T. Stahlman, B. R. Stripp, T. E. Weaver, and J. A. Whitsett. 1995. Targeted disruption of the surfactant protein B gene disrupts surfactant homeostasis, causing respiratory failure in newborn mice. Proc. Natl. Acad. Sci. USA. 92:7794–7798. [DOI] [PMC free article] [PubMed] [Google Scholar]
- Creuwels, L. A. J. M., L. M. G. van Golde, and H. P. Haagsman. 1996. Surfactant protein B: effects on lipid domain formation and intermembrane lipid flow. Biochim. Biophys. Acta. 1285:1–8. [DOI] [PubMed] [Google Scholar]
- Cruz, A., C. Casals, I. Plasencia, D. Marsh, and J. Perez-Gil. 1998. Depth profiles of pulmonary surfactant protein B in phosphatidylcholine bilayers, studied by fluorescence and electron spin resonance spectroscopy. Biochemistry. 37:9488–9496. [DOI] [PubMed] [Google Scholar]
- Dieudonne, D., R. Mendelsohn, R. S. Farid, and C. R. Flach. 2001. Secondary structure in lung surfactant SP-B peptides: IR and CD studies of bulk and monolayer phases. Biochim. Biophys. Acta. 1511:99–112. [DOI] [PubMed] [Google Scholar]
- Essmann, U., L. Perera, M. L. Berkowitz, T. Darden, H. Lee, and L. G. Pedersen. 1995. A smooth particle mesh Ewald method. J. Chem. Phys. 103:8577–8593. [Google Scholar]
- Faraldo-Gomez, J. D., G. R. Smith, and M. S. P. Sansom. 2002. Setting up and optimization of membrane protein simulations. Eur. Biophys. J. 31:217–227. [DOI] [PubMed] [Google Scholar]
- Gordon, L. M., S. Horvath, M. L. Longo, J. A. Zasadzinski, H. W. Taeusch, K. Faull, C. Leung, and A. J. Waring. 1996. Conformation and molecular topography of the N-terminal segment of surfactant protein B in structure-promoting environments. Protein Sci. 5:1662–1675. [DOI] [PMC free article] [PubMed] [Google Scholar]
- Gordon, L. M., K. Y. C. Lee, M. M. Lipp, J. A. Zasadzinski, F. J. Walther, M. A. Sherman, and A. J. Waring. 2000. Conformational mapping of the N-terminal segment of surfactant protein B in lipid using C-13-enhanced Fourier transform infrared spectroscopy. J. Pept. Res. 55:330–347. [DOI] [PubMed] [Google Scholar]
- Hall, S. B., A. R. Venkitaraman, J. A. Whitsett, B. A. Holm, and R. H. Notter. 1992. Importance of hydrophobic apoproteins as constituents of clinical exogenous surfactants. Am. Rev. Respir. Dis. 145:24–30. [DOI] [PubMed] [Google Scholar]
- Hess, B., H. Bekker, H. J. C. Berendsen, and J. G. E. M. Fraaije. 1997. LINCS: A linear constraint solver for molecular simulations. J. Comput. Chem. 18:1463–1472. [Google Scholar]
- Humphrey, W., A. Dalke, and K. Schulten. 1996. VMD: visual molecular dynamics. J. Mol. Graph. 14:33–38. [DOI] [PubMed] [Google Scholar]
- Jeffrey, G. A., and W. Sanger. editors.1991. Hydrogen Bonding in Biological Structures. Springer Verlag, Berlin.
- Kaznessis, Y. N., S. Kim, and R. G. Larson. 2002. Specific mode of interaction between components of model pulmonary surfactants using computer simulations. J. Mol. Biol. 322:569–582. [DOI] [PubMed] [Google Scholar]
- Kruger, P., M. Schalke, Z. D. Wang, R. H. Notter, R. A. Dluhy, and M. Losche. 1999. Effect of hydrophobic surfactant peptides SP-B and SP-C on binary phospholipid monolayers. I. Fluorescence and dark-field microscopy. Biophys. J. 77:903–914. [DOI] [PMC free article] [PubMed] [Google Scholar]
- Lee, K. Y. C., J. Majewski, T. L. Kuhl, P. B. Howes, K. Kjaer, M. M. Lipp, A. J. Waring, J. A. Zasadzinski, and G. S. Smith. 2000. The incorporation of lung surfactant specific protein SP-B into lipid monolayers at the air-fluid interface. Proc. Materials Research Society Symposium on Applications of Synchrotron Radiation Techniques to Material Science. 590:177–182. [Google Scholar]
- Lee, K. Y. C., J. Majewski, T. L. Kuhl, P. B. Howes, K. Kjaer, M. M. Lipp, A. J. Waring, J. A. Zasadzinski, and G. S. Smith. 2001. Synchrotron x-ray study of Lung surfactant-specific protein SP-B in lipid monolayers. Biophys. J. 81:572–585. [DOI] [PMC free article] [PubMed] [Google Scholar]
- Lindahl, E., B. Hess, and D. van der Spoel. 2001. GROMACS 3.0: A package for molecular simulation and trajectory analysis. J. Mol. Model. 7:306–317. [Google Scholar]
- Nag, K., J. G. Munro, K. Inchley, S. Schurch, N. O. Petersen, and F. Possmayer. 1999. SP-B refining of pulmonary surfactant phospholipid films. Am. J. Physiol. 277:L1179–L1189. [DOI] [PubMed] [Google Scholar]
- Nogee, L. M., D. E. DeMello, L. P. Dehner, and H. R. Colten. 1993. Brief report: deficiency of pulmonary surfactant protein B in congenital alveolar proteinosis. N. Engl. J. Med. 328:406–410. [DOI] [PubMed] [Google Scholar]
- Oosterlaken-Dijksterhuis, M. A., H. P. Haagsman, L. M. G. van Golde, and R. A. Demel. 1991. Characterization of lipid insertion into monomolecular layers mediated by lung surfactant proteins SP-B and SP-C. Biochemistry. 30:10965–10971. [DOI] [PubMed] [Google Scholar]
- Pastrana-Rios, B., C. R. Flach, J. W. Brauner, A. J. Mautone, and R. Mendelsohn. 1994. A direct test of the squeeze-out hypothesis of the lung surfactant function: external reflection FTIR at the air-water interface. Biochemistry. 33:5121–5127. [DOI] [PubMed] [Google Scholar]
- Piknova, B., V. Schram, and S. B. Hall. 2002. Pulmonary surfactant: phase behavior and function. Curr. Opin. Struct. Biol. 12:487–494. [DOI] [PubMed] [Google Scholar]
- Pryhuber, G. S. 1998. Regulation and function of pulmonary surfactant protein B. Mol. Genet. Metab. 64:217–228. [DOI] [PubMed] [Google Scholar]
- Revak, S. D., T. A. Merritt, C. G. Cochrane, G. P. Heldt, M. S. Alberts, D. W. Anderson, and A. Kheiter. 1996. Efficacy of synthetic peptide-containing surfactant in the treatment of respiratory distress syndrome in preterm infant rhesus monkeys. Pediatr. Res. 39:715–724. [DOI] [PubMed] [Google Scholar]
- Revak, S. D., T. A. Merritt, M. Hallman, G. Heldt, R. J. La Polla, K. Hoey, R. A. Houghten, and C. G. Cochrane. 1991. The use of synthetic peptides in the formation of biophysically and biologically active pulmonary surfactants. Pediatr. Res. 29:460–465. [DOI] [PubMed] [Google Scholar]
- Sanner, M. F., A. J. Olson, and J. C. Spehner. 1996. Reduced surface: an efficient way to compute molecular surfaces. Biopolymers. 38:305–320. [DOI] [PubMed] [Google Scholar]
- Schurch, S., F. H. Y. Green, and H. Bachofen. 1998. Formation and structure of surface-films: captive bubble surfactometry. Biochim. Biophys. Acta. 1408:180–202. [DOI] [PubMed] [Google Scholar]
- Schurch, S., R. Qanbar, H. Bachofen, and F. Possmayer. 1995. The surface-associated surfactant reservoir in the alveolar lining. Biol. Neonate. 67:61–76. [DOI] [PubMed] [Google Scholar]
- Simon, A. S., and T. J. McIntosh. 2002. Peptide-Lipid Interactions. Academic Press, London.
- Taneva, S., and K. M. W. Keough. 1994a. Pulmonary surfactant proteins SP-B and SP-C in spread monolayers at the air-water interface. I. Monolayers of pulmonary surfactant protein SP-B and phospholipids. Biophys. J. 66:1137–1148. [DOI] [PMC free article] [PubMed] [Google Scholar]
- Taneva, S., and K. M. W. Keough. 1994b. Pulmonary surfactant proteins SP-B and SP-C in spread monolayers at the air-water interface. II. Monolayers of pulmonary surfactant protein SP-C and phospholipids. Biophys. J. 66:1149–1157. [DOI] [PMC free article] [PubMed] [Google Scholar]
- Wang, Y. D., K. M. K. Rao, and E. Demchuk. 2003. Topographical organization of the N-terminal segment of lung pulmonary surfactant protein B (SP-B1–25) in phospholipid bilayers. Biochemistry. 42:4015–4027. [DOI] [PubMed] [Google Scholar]
- Yu, S. H., and F. Possmayer. 1990. Role of bovine pulmonary surfactant-associated proteins in the surface-active property of phospholipid mixtures. Biochim. Biophys. Acta. 1046:233–241. [DOI] [PubMed] [Google Scholar]
- Yu, S. H., and F. Possmayer. 1992. Effect of pulmonary surfactant protein B (SP-B) and calcium on phospholipid adsorption and squeeze-out of phosphatidylglucerol from binary phospholipid membranes contatining; dipalmitoylphosphatidylcholine. Biochim. Biophys. Acta. 1126:26–34. [DOI] [PubMed] [Google Scholar]


