Abstract
There have been numerous attempts to describe the mechanism of B-Z transition. Our simulations based on the stochastic difference equation with length algorithm show that a short DNA oligomer will tend to unwind and overstretch during the transition. The overstretching of DNA is then understood from the Zhou, Zhang, and Ou-Yang model. Unlike the Harvey model, the stretched intermediate model does not pose any steric dilemma; we are able to show that the chain sense reversal progresses spontaneously using the stretched intermediate model. A nonlinear DNA model is used to describe the origins and mechanism of base rotation in the stretched intermediate state of DNA. We also propose an experiment that can verify the existence of a stretched intermediate state during B-Z transition, thus opening up fresh grounds for experimentation in this field.
INTRODUCTION
Z-DNA and B-Z transition
The existence of Z-DNA was first suggested by optical experiments showing that a polymer comprising of alternating guanine and cytosine residues in 4 M NaCl solution produced a nearly inverted circular dichroism spectrum (Herbert and Rich, 1996, 1999). The reason for the inversion was not well known until 1979, when the first atomic resolution reveals, ironically, not the familiar right-handed B-DNA that Watson and Crick discovered in 1953, but a left-handed helix that we now call Z-DNA. The general response by the scientific community to this discovery was amazement coupled with skepticism (Rich and Zhang, 2003), for Z-DNA is an anomaly. First of all, it is left-handed that departs dramatically from that of the vast remainder of B-DNA family of right-handed conformers. Secondly, in B-DNA, all bases adopt the anti-position whereas in Z-DNA, every other base is found in syn-position (Wolfl, 1995). Thirdly, the direction of the 5′–3′ progression in the backbone chains is reversed relative to B-DNA. The anomalous morphology of Z-DNA and its possible involvement in gene expression and recombination has thus led to a fury of scientific investigations on B-Z transitions.
One of the earliest models used to describe B-Z transition is known as the Harvey model (Harvey, 1983). It suggests that the cooperative B-Z transition is based on basepair rotation without basepair breakage and unwinding of the helix. According to Harvey, this process is facilitated by longitudinal DNA breathing modes. Another early view regarding the mechanism of B-Z transition involves basepair opening before rotation (Wang model) (Wang et al., 1979). Unfortunately, a problem remains with these models: they involve a torturous 180° rotation of bases and rearrangement of backbone that pose a steric dilemma subsequently known as the chain sense (5′ → 3′ direction) paradox. To solve this paradox, other models have been proposed. One view is that the transition occurs through an intermediate A-type conformation without disruption of interbase hydrogen bonds and severe sterical hindrance (Saenger and Heinemann, 1989). Some researchers even seek to address this paradox by suggesting that the left-handed helix observed in crystallography is not the Z-DNA with its chain sense reversed, but an alternative left-handed version whose chain sense is the same as Watson and Crick's B-DNA (Hence, the name Z(WC)-DNA) (Ansevin and Wang, 1990). Currently, the accepted picture of the B-Z transition is the zipper model (Ho, 1994). The zipper model involves the high energy nucleation of a B-Z junction that then propagates through the DNA polymer until the entire B-DNA polymer is transformed into Z-DNA. Unfortunately, this model does not reveal many structural and dynamical details of the transition itself by limiting its application to the thermodynamics of B-Z transition.
Despite the existence of numerous models to account for the B-Z transition, experiments have not yet come up with a conclusive answer to this fundamental problem. Up until this moment, there are only several well-known and conclusive facts regarding B-Z transition (Blackburn and Gait, 1995):
High-salt solution can stabilize Z-DNA due to the vast decrease in electrostatic repulsion of the phosphate backbones.
Negative supercoiling of DNA requires energy and tends to unwind B-DNA to form Z-DNA.
Transcription stabilizes Z-DNA. When RNA polymerase complex interacts with the DNA duplex during transcription, it does not rotate around the helical DNA but instead ploughs straight through, causing the DNA behind the polymerase to be unwound and be subjected to negative torsional strain that stabilizes Z-DNA.
Nonetheless, recent discoveries of the biological role of Z-DNA (Gruskin and Rich, 1993), manipulations of DNA using tweezers (Leger et al., 1999; Smith, 1998) and advancements in computational biology enable us to take a further look at the fundamental and yet unsolved problem of B-Z transition. The invention of a DNA nanomachine based on the B-Z transition in 1999 also leads us to ponder whether DNA unwinds during B-Z transition (Mao et al., 1999; Seeman and Belcher, 2002). If DNA unwinds during the transition, the machine can then be used as a nanomotor. To study this problem, we propose to use the stochastic difference equation algorithm to predict the B-Z conformational transition.
An overview of the SDE approach
Molecular dynamics (MD) simulation has numerous successes in computational studies of biological macromolecules. It has shed light on numerous biochemical processes such as ligand binding, ligand diffusion, and folding of proteins. Nevertheless, a clear limitation of molecular dynamics simulation is the restriction to short timescales. Currently, simulations of large complex molecular systems are restricted to nanoseconds, which are too brief to understand many interesting biophysical phenomenon. Examples of these molecular systems include the R-to-T transition in hemoglobin that requires tens of microseconds and ion permeation through the gramicidin channel (microseconds) (Elber et al., 2002).
An alternative is therefore required if one wants to probe the long-time dynamical behavior of molecular systems. This alternative is to use the boundary value formulation (Elber et al., 2003), or functionals and actions. The boundary value formulation has an advantage over conventional MD when one needs to understand the evolution of one state to another without having to specify the exact initial conditions or environmental conditions that will lead to the evolved state. This is because in some instances, the initial and environmental conditions are not known, or are difficult to achieve. In the case of actions, one can make use of the following definition of classical action (Landau and Lifshitz, 1960):
 |
(1) |
which is based on integration over the pathlength  Y refers to the mass weighted coordinates
  A straightforward optimization of the discrete version of the action defined in Eq. 1 to obtain the desired classical trajectory might seem attractive at first sight. However, there exists a serious pitfall in the above-mentioned approach. Optimization of the action can be very difficult due to the fact that the action can change from having a minimum to having a maximum as a function of the step size. In other words, the discrete version of the action cannot be used with significantly larger time steps.
To overcome this problem, Elber et al. (2002) proposed to use a nondeterministic approach that is based on stochastic modeling of the numerical errors introduced by the finite difference formula. These errors arise as a result of finite computer accuracy. For instance, small changes in the initial conditions can vastly alter the computed trajectory because practical calculations always have truncation errors. The sum of the numerical error  and the numerical trajectory
  will give us the exact trajectory
Consider now the finite difference equations that define the error functions for the “true” trajectory that can be obtained via functional variation of Eq. 1 to yield:
 |
(2) |
where l is used to denote the pathlength and e is the unit vector parallel to the path direction, which can be estimated by finite difference to be:
 |
(3) |
Now, according to numerical experiments carried out by Elber et al., (1999) the error functions can be modeled as follows:
- For large step sizes, the errors are independent stochastic variables and they are not correlated in length:

(4) - The probability density of the norms of the error vectors is assumed to be Gaussian:
where ɛi is the error norm at length slice i. Because the errors are independent, one can also write
(5)
where
(6)  is proportional to
  Equation 6 is the probability density for a trajectory as a function of the sampled errors. With this in mind, it is then possible to obtain a trajectory that maximizes the probability density by minimizing the quantity:
(7)
This quantity is simply called the “action” in analogy to the classical action. The subscript SDEL here stands for “stochastic difference equation with respect to length”.
At this point, it may be relevant to compare SSDEL and an earlier version of the action SSDET (stochastic difference equation with respect to time) (Siva and Elber, 2003). The similarities and differences are summarized in Table 1. In the context of B-Z transition, it is advantageous to obtain the desired trajectory via SSDEL for three reasons. Firstly, the energy, which is an equilibrium property, is easier to estimate compared to the total time of B-Z transition. Secondly, the weight of a single trajectory can be calculated easily as the energy conservation of the trajectory is already built in. Thirdly, large barriers are associated with rapid transitions and consequently, this implies that it is difficult to probe large barriers (if any) in B-Z transition with the SSDET protocol.
TABLE 1.
Comparison between SDET and SDEL
| SDET | SDEL |
|---|---|
| Requires time as an input | Requires total energy as an input |
| High-frequency (ω) components are filtered when time step Δt > π/ω | High-frequency components are also filtered. |
| Points along the path are equally distributed in time. | Points along the path are equally distributed in space |
METHODS
Straightforward molecular dynamics simulations (70 ps) are first performed on canonical B-DNA and Z-DNA structures. Initial and final configurations are obtained by randomly selecting structures in the B-DNA and Z-DNA conformations from their respective MD trajectories. These configurations will be used to generate an ensemble of SDEL trajectories (Arora and Schlick, 2003) by optimizing the gradient norm given by the following target function T:
 |
(8) |
where the variables  from 0 to N + 1 are all the structures along the path, and λ defines the coupling strength of a constraint that maintains the structures equally distributed along the trajectory (second term). The first term of Eq. 8 is in fact an equivalent expression for Eq. 7 with S given by the discrete version of Eq. 1.
The potential energy function used is the AMBER99 force field for DNA. Benchmark computations utilizing this force field have been carried out by Arora and Schlick (2003) on DNA structures and they yield considerable success. Solvation effects are modeled implicitly using the generalized Born solvation model (GBSM) (Ghosh et al., 1998) during MD simulations. As a side note, assumptions of equilibrium condition or reaction coordinates were made in the path calculation in previous simulations of B-Z transitions (Czerminski et al., 1991; Lavery, 1994). In this study of B-Z transition, no such assumption was made. However, this leads to a major obstacle in computation as B-DNA and Z-DNA have rather disparate structures and thereupon very dissimilar energies. One can therefore expect the potential energy variation along the path to be very big. This often causes the action S defined in Eq. 1 to become imaginary and ill-defined (“negative momentum error”) during the optimization when the potential energy U is greater than the constant energy input E.
There are several ways to avoid this problem. The first is to reduce the number of grid points so as to minimize the probability of having U > E (SDEL algorithm uses a discretized version of S). However, this leads to a decrease in resolution of the path. The second method is to increase E to ensure that it always remains larger than the internal energy. Unfortunately, this method introduces unnecessary physical complications as E is often estimated from equilibrium condition. It is the sum of the depth of the minima  one wished to reach and the average thermal energy
  of the system with N degrees of freedom (another widely used definition of E is estimated from the sum of the highest potential point of reaction path and the average thermal energy of
  where N is the total number of particles in the system).
To avoid physical complications, the first method is chosen. After repeated trials, the maximum number of grid points that avoids the negative momentum error is 10. Interestingly, it has been proven that the trajectory obtained using the SDEL approach with a small number of grid points, for that matter, a large step size, is the steepest descent path. Thus, the spatial view provided by SDEL remains a sound approximation to the true trajectory even with a few points. This is another advantage of SDEL.
With this in mind, we can now proceed with the computations of SDEL trajectories. The SDEL module in MOIL (http://cbsu.tc.cornell.edu/software/moil/) is used to compute the SDEL trajectories. Unlike MD simulations, the computation and manipulation of the entire trajectory is required to optimize  instead of calculation of one temporal slice of the trajectory at a time. An initial guess of the trajectory is required as input. Minimum energy paths were calculated and used as initial guesses for the SDEL trajectories. The minimum energy paths were generated using the self-penalty walk (SPW) functional (Czerminski and Elber, 1990) with 10 grid points. These paths were optimized for 20,000 steps.
SPW calculations were further refined by the SDEL formalism using the conjugate gradient algorithm to minimize  It is not possible to use simulated annealing to optimize
  for B-Z transition as it also leads to “negative momentum error”. Solvent effects are modeled implicitly using the generalized Born solvation model. The total energy is estimated from the sum of the potential energy of the Z-DNA conformation and the average thermal energy. A total of 100,000 optimization steps were employed. In total, five SDEL trajectories were produced. One SDEL trajectory is singled out and further optimized using the conjugate gradient algorithm for another 1.1 million optimization steps. The resulting
  is reduced to <20,000. The root mean square distance between sequential structures at the end of the
  calculations is of the order of 1 Å.
With 10 grid points, we are able to derive most of the qualitative features of the B-Z DNA transition. However, to derive more quantitative details of the transition, we need to increase the resolution of the trajectory with 10 grid points. To do so, we first select the canonical B-DNA and Z-DNA structures as starting and ending conformations, respectively, and pick structure 4 and 7 from the original 10 grid points as intermediate structures from which interpolating trajectories with n intermediate points are computed (Table 2). The number of optimization steps for SPW calculations varies and is determined such that  where
where  is the pathlength difference between the n grid points of the refined intermediate trajectory and L is the total pathlength of the corresponding path segment derived from the 10 grid points B-Z trajectory. From the SPW path, we selected the highest potential energy point and added to it the average thermal energy. The resulting total energy that is used to generate SDEL trajectories is 1385.31 kcal/mol. In total, 40,000 simulated annealing optimization steps were employed for each of the three interpolating trajectories. The resulting gradient is <10 kcal/mol Å and the final averaged root mean square distance between sequential structures is ∼1.54 Å. In all the SDEL computations, solvation effects are modeled implicitly using the generalized Born solvation model.
TABLE 2.
Simulation of high-resolution trajectory
| Trajectory | Number of grid points, n |
|---|---|
| B-DNA → Structure 4 | 64 |
| Structure 4 → Structure 7 | 48 |
| Structure 7 → Z-DNA | 56 |
Modeling and simulations are implemented on a Linux cluster in the supercomputing and visualization unit, National University of Singapore, and a 32-CPU IBM supercomputer at the Institute of High Performance Computing, Singapore.
RESULTS AND DISCUSSION
B-Z transition pathway
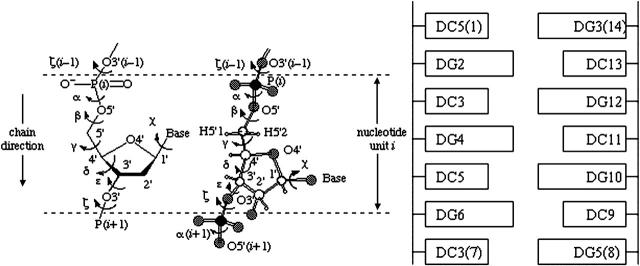
We present the results of the six B-Z DNA trajectories that we computed. We will describe in detail the trajectory whose value of  is reduced to <20,000 and also the refined B-Z trajectory unless otherwise stated; ensemble averages are also presented at appropriate times. To facilitate reading, the abbreviations, labeling of bases, and IUPAC definitions are presented in Fig. 1.
FIGURE 1.
IUPAC definition of torsional angles and labeling of nucleotides in a duplex. (Figure adapted from Abbreviations and Symbols for the Description of Conformations of Polynucleotide Chains (World Wide Web version) by G. P. Moss at http://www.chem.qmul.ac.uk/iupac/misc/pnuc1.html)
The B-Z DNA reaction pathway that we have computed is presented in Fig. 2. The structures are equally distributed in space rather than in time. An obvious feature of the reaction pathway is the stretching of B-DNA as it unwinds, hence the model is known as the stretched intermediate model. Another notable feature is the rupturing of the basepairs. The hydrogen bonds, denoted by black dashed lines, are broken during the transition. This is apparent from the fact that hydrogen bonds are very weak, and vast distortions in the conformation, such as unwinding, during the transition can easily rupture the hydrogen bonds. The motions of the nucleobases, on the other hand, are not immediately obvious and require a more quantitative analysis. The above-mentioned features of the transition pathway provide us with a general outline on the variables to measure and study.
FIGURE 2.
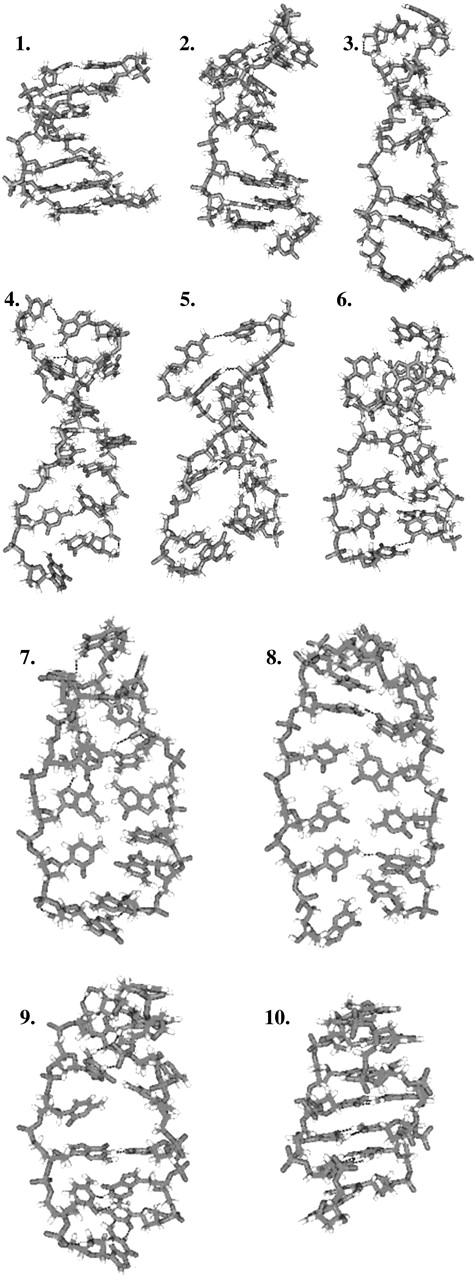
A typical B-Z DNA reaction pathway. Hydrogen bonds (black dashed lines) are broken during the stretching and unwinding of the DNA oligomer. Description of pathway: (1) Initial B-DNA conformation. (2 and 3) Oligomer begins to stretch and unwind. (4–6) Base rotation begins. (7 and 8) The oligomer is almost unwound. (9) The change in the handedness of the helix is noticeable here. (10) Final Z-DNA conformation.
Folding angle
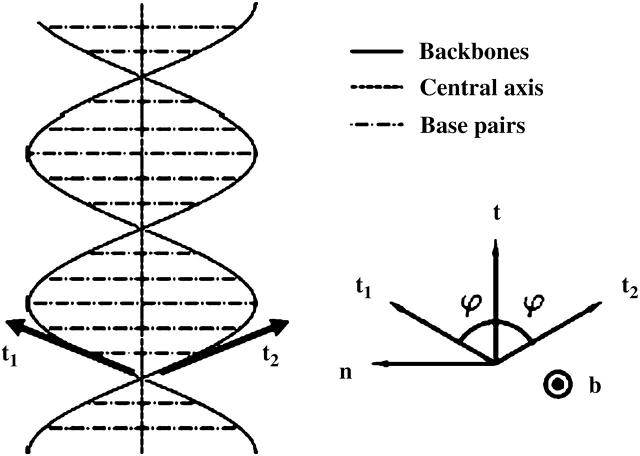
A useful quantity to understand how the DNA oligomer unwinds and rewinds itself during the B-Z transition is known as the folding angle ϕ (Zhou et al., 2000). It is defined as half the rotation angle from  to
to  the tangential vectors of the two backbones (Fig. 3). The backbones in this case are regarded as inextensible wormlike chains. The folding angle is useful as it is related to the concept of twist used by biologists. The twist Tw that describes the integrated rotation of the backbone around the central axis can be expressed in terms of the folding angle as
 |
(9) |
where L is the contour length expressed in terms of R (L → L/R). R is the half-length of the lateral distance between two backbones.
FIGURE 3.
Schematic representation of the DNA model used to describe its elongation and untwisting during the B-Z transition. The right portion of the figure demonstrates the local definition of the folding angle ϕ. t is the tangential vector of the central axis. Each basepair is treated as a rigid rod of length 2R pointing along a direction denoted by b.  (Figure adapted from Zhou et al., 2000.)
Whereas it is easy to define the folding angle on a continuous wormlike chain, the discrete nature of the atomistically detailed backbone structure used in the simulation renders the assignment of the tangential vectors to the backbone difficult. As a result, only an approximate value of the folding angle can be captured.
Folding angles defined at different locations of the backbone are computed and presented in Fig. 4. By convention, a positive ϕ corresponds to a right-handed helix whereas a negative ϕ corresponds to a left-handed helical structure. The folding angles decrease in a nearly linear fashion with respect to the reaction coordinates during the B-Z transition. This observation is particularly useful when used to describe the relative extension of the DNA molecule during the transition as we shall see in the next section.
FIGURE 4.
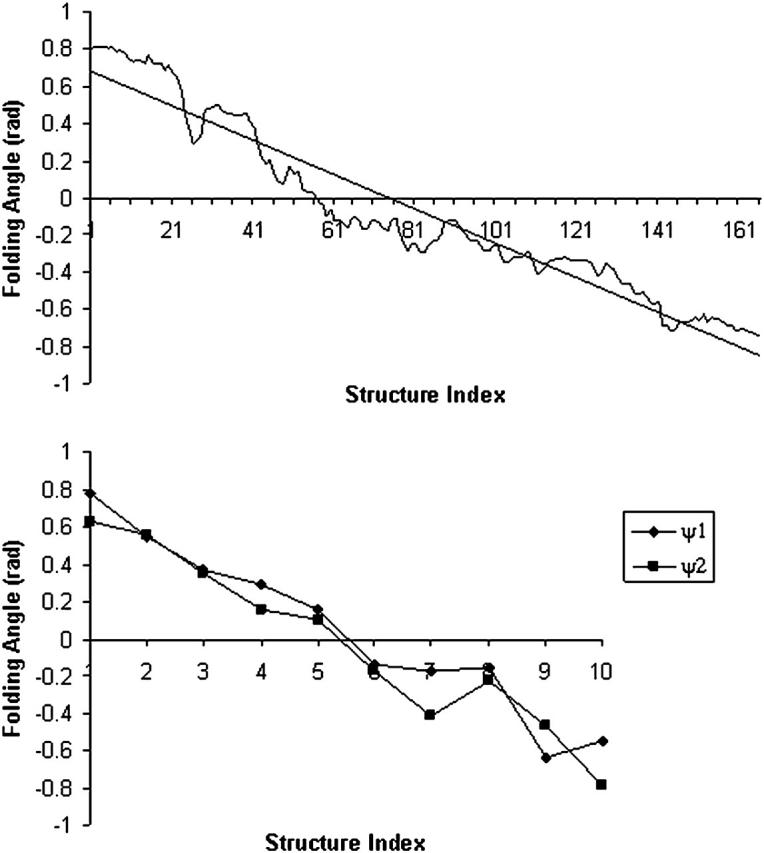
Variation of folding angle with structure index. Choices of  and
and  are as follows: (Top)
  points from the C5′ atom of DC3 to the C5′ atom of DG2,
  points from the C5′ atom of DC13 to the C5′ atom DG3(14). (Bottom) ψ1:
  points from the P atom of DG4 to the P atom of DG2,
  points from the P atom of DG12 to the P atom of DG3(14). ψ2:
  points from the C5′ atom of DC3 to the C5′ atom of DG2,
  points from the C5′ atom of DC13 to the C5′ atom of DG3(14). In all three cases, the folding angle decreases in a nearly linear fashion.
Contour length
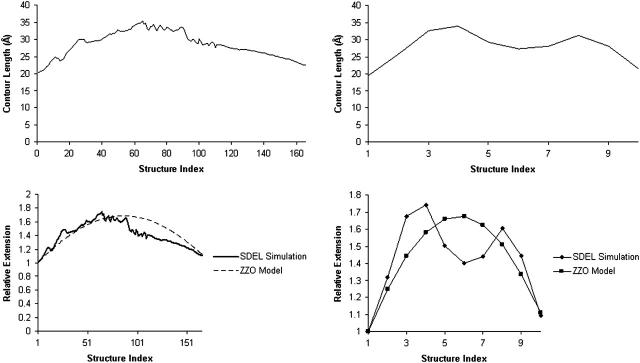
Contour length is often defined as the maximum end-to-end distance of a linear polymer chain (IUPAC, 1974, 1981). However, for a complex polymer such as DNA, only an approximate value of the contour length may be accessible. In this case, we define contour length as the average of the absolute difference in the z-coordinates of O4′ atoms of DC5(1) and DC3(7) and the absolute difference in the z-coordinates of O4′ atoms of DG3(14) and DG5(8).
Fig. 5 shows the variation of the contour length of the oligomer in the stretched intermediate transition model. The oligomer stretches to ∼1.7 times its canonical length but still retains a helical structure. In literature, this type of DNA is known as S-DNA. However, this is where the resemblance ends. The stretched intermediate observed here has ruptured basepairs unlike the ideal S-DNA. We also note a dip in the middle that is probably caused by rearrangement of the sugar-phosphate backbone.
FIGURE 5.
Profiles of DNA contour length and relative extensions in the stretched intermediate model. The discrepancies between the B-Z trajectories of different resolutions with the ZZO model are caused by rearrangement of the sugar-phosphate backbone to accommodate the Z-form.
In force experiments (Lai and Zhou, 2002) that study the elasticity and extensibility of dsDNA, the most common quantity measured is the relative extension, defined as  where Z is the end-to-end distance along the direction of the force and
  is the contour length of the B-form under no force. As a result, instead of contour length, we choose to study the relative extension of the DNA versus the reaction coordinates (Fig. 5) for a typical trajectory. In the case of the B-Z trajectory with 10 grid points, we observe that the relative extension increases to ∼1.6 times the canonical length during the unwinding process before declining to ∼1.3 times. It soon rises to a peak of 1.6 and starts to fall again as the oligomer twists itself to form the left-handed Z-DNA.
To account for the high extensibility of DNA during B-Z transition, we invoke the Zhou, Zhang, and Ou-Yang (ZZO) model (Lai and Zhou, 2003) that was constructed to study the entropic elasticity, cooperative extensibility, and supercoiling properties of DNA. In this model, the bending energy of the sugar-phosphate backbones, base-stacking interactions between adjacent nucleotide basepairs, and their steric effects on DNA axial bending rigidity are considered as follows:
 |
(10) |
The backbone energy is decomposed into the bending energy of the central axis (first term of Eq. 10) and the folding energy of the backbones (second and third terms of Eq. 10). The last term refers to the base-stacking energy density based on the Lennard-Jones-type potential; k reflects the bending rigidity of DNA backbones and s is the backbone arc length. This model indicates that the base-stacking interaction is the main factor in determining the high extensibility and unwinding instability of DNA because it is short ranged and extremely sensitive to the distance between adjacent basepairs, which changes in the presence of a stretching force or a torque. Based on the ZZO model, the relative extension can be shown to be:
 |
(11) |
where the average of a quantity over the strand is given by  and f is the stretching force. The relative extension given by Eq. 11 is dependent on the folding angle that changes during the B-Z transition.
To understand how the ZZO model can predict the variation of relative extension during B-Z transition, several assumptions are made. Firstly, we assume that there is no writhing during the transition so that θ = 0. This is a valid assumption as no writhing is observed during the simulated transition. In the limit of  we can also safely assume that the folding angle of B-DNA is given by
  with
with  and the folding angle of Z-DNA is
  with
with  Finally, based on Fig. 4, we assume that the folding angle decreases linearly with reaction coordinate. This will then produce the curve denoted by the solid squares and bold line in Fig. 5. The ZZO model agrees with the relative extension observed during the simulation except in regions where there are major conformational adjustments in the nucleotides that violate the basic assumptions of the ZZO model.
Backbone torsions
In B-DNA, all the bases are found in the anti-position whereas in Z-DNA, every other base is found in the syn-position. Pyrimidine bases such as deoxycytidine show a preference for the anticonformation and purine bases such as deoxyguanosine have no preference for either conformation. This implies that alternating purine pyrimidine stretches help to facilitate the formation of Z-DNA. To achieve this, the general consensus is that every base must rotate 180°. During this process, deoxycytidine remains in the anti-conformation because both sugar and base rotate whereas only the deoxyguanosine base flips. This major structural transition of the bases has attracted considerable attention and attempts have been made to describe the process.
In general, the simulation shows that the individual base flips are dissimilar and differ in their properties considerably. This can be a result of either the initial guess of the reaction path or an actual physical property of the system as mentioned by Czerminski et al. (1991). The question of why the bases rotate during B-Z transition will be investigated in the next section.
Nonlinear interactions and base rotation
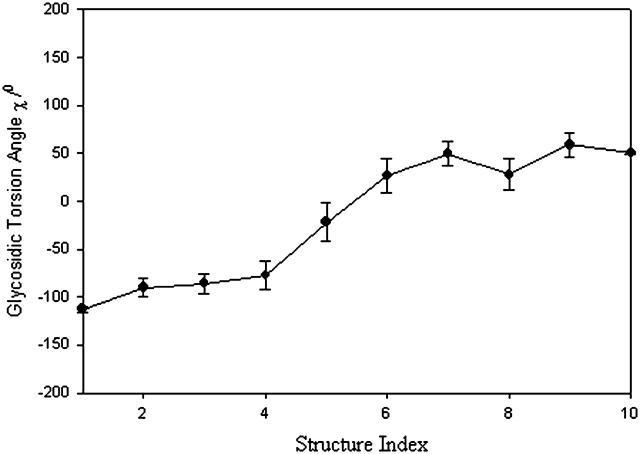
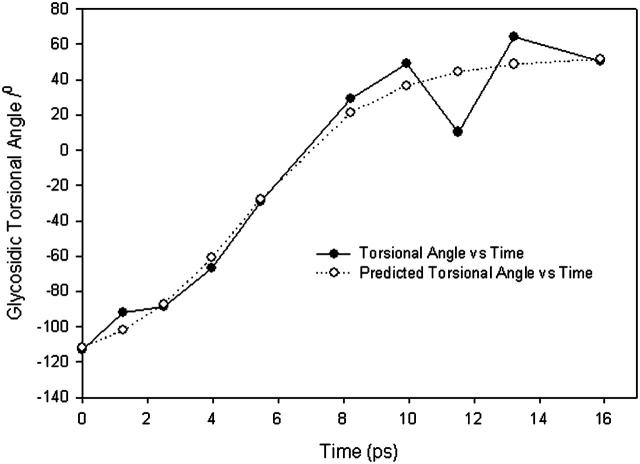
Fig. 6 shows the ensemble average of the glycosidic torsional angle for all the deoxyguanosine bases (in five trajectories). In doing so, we have assumed that the bases rotate at about the same time. This is certainly a valid assumption for a short oligomer. At this point, we may ask ourselves this question: why do the bases flip/rotate 180° during the transition? Whereas there exist biomolecules such as helicases that can unwind the helix (Changela et al., 2003), there appears to be no experimental data that support the existence of any external mechanism to aid the rotation of the bases during B-Z transition. Studies on the base rotation mechanism in B-Z transition are few. As a matter of fact, both the rotation of the cytosine base with its attached sugar and the rotation of guanine base appear to be so torturous that a new left-handed DNA with the same Watson-Crick backbone directions was proposed to replace Z-DNA.
FIGURE 6.
Averaged glycosidic torsional angle for deoxyguanosine. Error bars are ± SE.
On the other hand, we note that nonlinear interactions in DNA can give rise to large amplitude motions of the bases (Gaididei et al., 1998). With this in mind, we seek to understand the large amplitude motions of the bases during B-Z transition from nonlinear interactions.
Firstly, we write the DNA Hamiltonian as
 |
(12) |
where V refers to the coupling between the two complementary strands. During the transition, all the hydrogen bonds between the basepairs are broken, and we can thus consider the coupling of the two strands to be small compared to the first two terms in Eq. 12. We can also assume that the interstrand coupling to change slowly compared to the other potential terms such that it is nearly constant and can be neglected without affecting the overall result.
Let  be the torsional angle about the glycosidic bond of the nth base. This allows us to write
  as
as
 |
(13) |
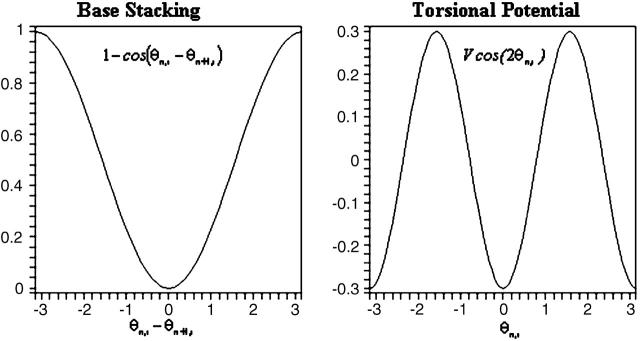
The first term in Eq. 13 is the rotational energy of the nth base. The second and third terms are the potential terms that give rise to the torsional energy (Chen et al., 2000) and base-stacking interactions, respectively (Fig. 7). β and β′ are distance-dependent coupling strengths.
FIGURE 7.
Potential terms used in Eq. 19. Unit of  is radian. V is arbitrarily set to 0.3. Energy unit is also arbitrary.
Introducing the fields of rotational angles in the continuum approximation (Yomosa, 1984) and ignoring the subscript strandi, our Hamiltonian for a single strand can be written alternatively as:
 |
(14) |
where a is the rise. From the Lagrangian corresponding to Eq. 14, we obtain the following Euler-Lagrange equation:
 |
(15) |
with  After making the following substitutions,
 |
(16) |
We arrive at the following equation:
 |
(17) |
This is the Sine-Gordon equation whose solutions are well known (Yakushevich, 1996). In the case of B-Z transition, the kink/antikink solutions are chosen:
 |
(18) |
Rewriting Eq. 18 in terms of θ, t, and z:
 |
(19) |
 is a constant. Equation 19 tells us that the bases flip at different times, but for short DNA oligomers in which the range of z is limited, this time difference can be neglected in plotting Fig. 8.
FIGURE 8.
Variation of averaged glycosidic torsional angle with time (in ps) and a comparison between theory and simulation. The simulation results are based on the averaged glycosidic torsional angle for deoxyguanosine. Fitted theoretical parameters (Appendix) are  and
and  (ignoring units).
The next task is, therefore, to see if Eq. 19 describes the base rotation motion during B-Z transition. To compare, we need to convert the structure index of Fig. 6 into time using statistical refinement techniques because the total time measured in the crude trajectory is too small compared to the actual time. The solution that corresponds to Fig. 6 is expressed in the form of
 |
(20) |
where n is chosen to be 2, and  v, and c are constants to be fitted. What Eq. 20 tells us is essentially this: on one hand, Eq. 19 describes the propagation of a soliton along the DNA chain. On the other hand, by fixing the coordinate z and varying time t in Eq. 19, we are looking at the rotation of a base at a particular location on the DNA chain. This gives us Eq. 20 as a result and it allows us to compare the theoretical solution with simulation results. V is estimated from the variation of the torsional energy during the B-Z transition and is ∼0.04 eV. The moment of inertia of a nucleobase is estimated using
  is the proton mass. This gives us
  which is conveniently set to unity if t is measured in picoseconds. These assumptions do not have a huge impact on the integrity of the comparison.
The comparison is shown in Fig. 8. The fitted value of v gives an indication of how “fast” the bases flip/rotate during the transition. The model proposed, albeit a simple one, yields highly interesting results. The nearly perfect fit (Appendix) supports the idea that nonlinear interactions in DNA play an important role in B-Z transition. To our knowledge, this is also the first time that the kink/antikink solution is observed in an atomistic simulation of DNA. With the encouraging results garnered from Fig. 8, we can develop other models of DNA more intricate than the one described above in a bid to understand the process better (Yakushevich, 1998, 2000). One of the observations we made from the simulation is the correlation among the variations in torsion angles during B-Z transition. Using the Spearman rank order correlation and the Pearson product moment correlation, we observe that the torsion angles χ and ɛ are correlated during B-Z transition. ɛ and ζ are also correlated and the correlation is stronger than that of χ and ɛ. However, further analysis shows that the correlations arise only in deoxyguanosine nucleotides and not deoxycytidine. A good nonlinear DNA model should then be able to provide some insights into the correlations observed in deoxyguanosine nucleotides and explain why cytosine sugar rotates with the base but not the guanine sugar.
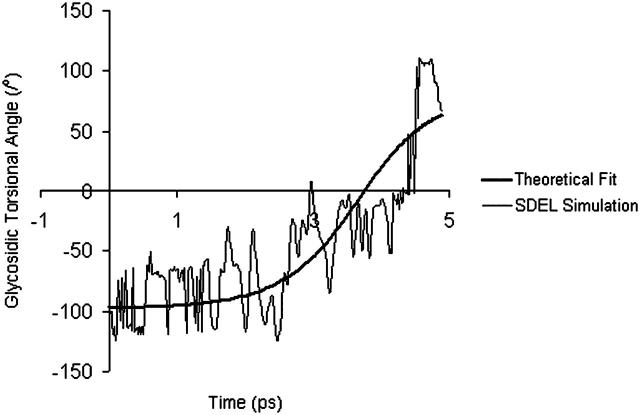
Fig. 9 shows the fitting of Eq. 20 to the averaged variation in glycosidic torsional angle of the deoxyguanosine bases in the high-resolution trajectory. The fact that only one trajectory is considered here gives rise to significant fluctuation in torsional angle. This fluctuation will be reduced if an ensemble of trajectories is taken into account.
FIGURE 9.
Comparison between the high-resolution SDEL simulation and theory. Fitted parameters are  and
and  (ignoring units).
Energetics of B-Z transition
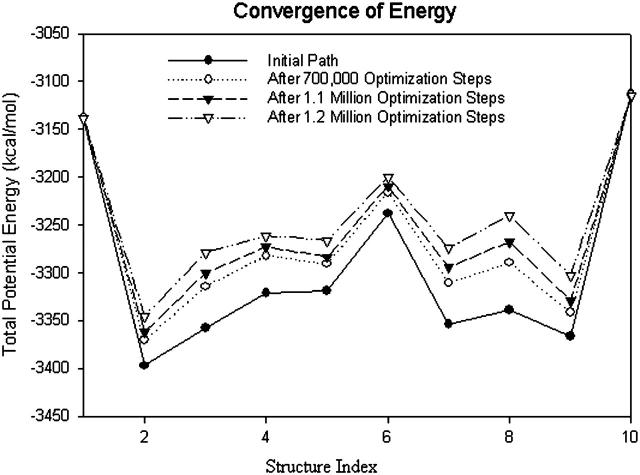
Figs. 10 and 11 show the energy profiles of B-Z transition. A striking feature of these energy profiles is the existence of an intermediate at structure 2 (for both the 10-grid points trajectory as well as the high-resolution trajectory), which is more stable than the B conformer. Based on Figs. 4 and 5, we can identify this intermediate state as a pseudo S-DNA conformation. The appearance of an intermediate state that is more stable than the initial and final conformations may seem to be in stark contrast with many chemical reaction pathways. Fortunately, the ZZO model provides an explanation to the existence of such a structure; we can explain this intriguing result using Eq. 10. We collect the last two terms in Eq. 10 and call it 
 |
(21) |
FIGURE 10.
Plot of potential energy with respect to structure index. The energies of the structures do not change much after another 100,000 optimization steps.
FIGURE 11.
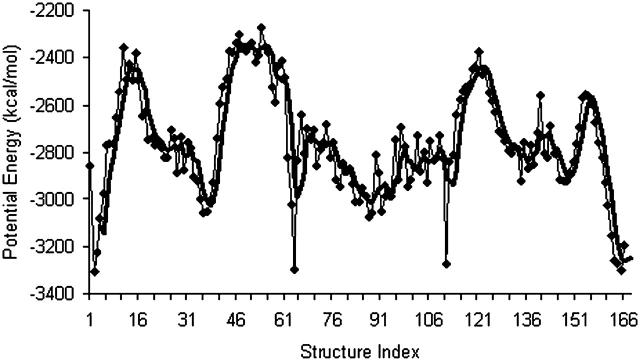
The energy profile for the high-resolution B-Z trajectory. Period 4 moving average energy profile is shown using bold lines. Moving averaging helps to level out the dips caused by the additional boundaries that are not smoothened during optimization. The dips can also be leveled out by sampling alternative trajectories with different fixed points. This will then produce a better energy profile that can be used for quantitative analysis.
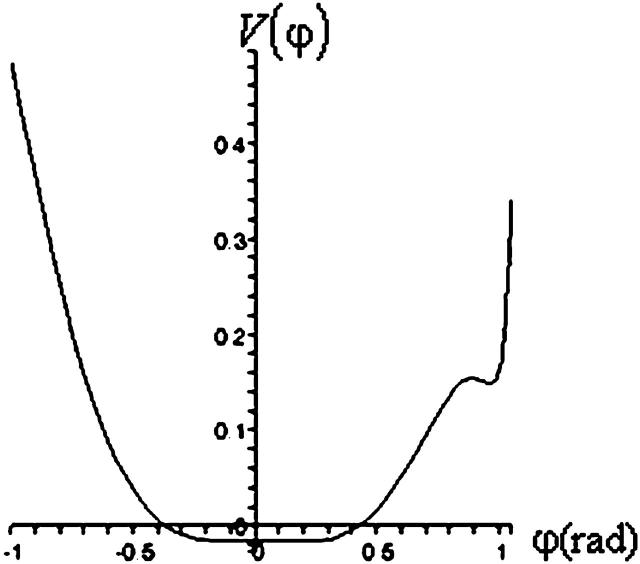
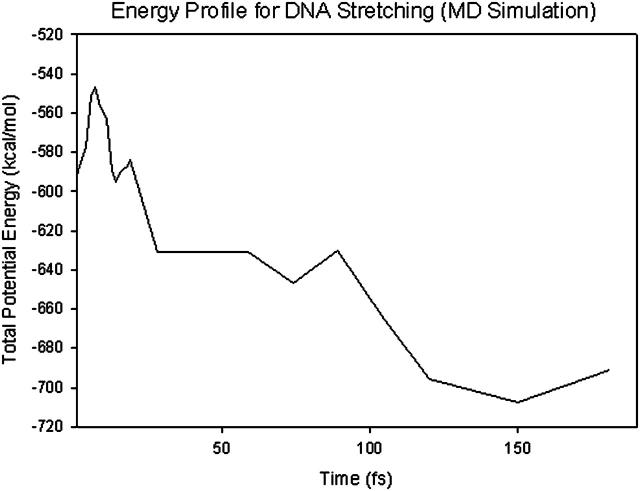
A plot of  in dimensionless units is shown in Fig. 12. The unfolded conformers at ϕ = 0°, 9.36° are practically indistinguishable when thermal fluctuations are taken into account and they possess lower potential energy than the conformer at ϕ = 55.1°, which is separated from the unfolded conformers by a small activation barrier. This barrier is missing from Figs. 10 and 11 and is crucial in preventing B-DNA conformers from converting spontaneously to the stretched intermediate conformation. MD simulation of the stretching of DNA is able to reveal the presence of an activation barrier that prevents B-DNA to convert spontaneously to the S-DNA conformation (Fig. 13). This activation barrier is much smaller in magnitude compared to the barrier at structure 6 (Fig. 10). Based on our current understanding of B-Z conformational transition, the barrier at structure 6 is caused by major structural changes in the sugar-phosphate backbone and nucleobases.
FIGURE 12.
Plot of  has three minima for ϕ at ϕ = 0, 9.36, and 55.1°.
FIGURE 13.
Variation of potential energy with time (in fs) for DNA stretching. The magnitude of the activation barrier is ∼40 kcal/mol. This is the activation energy for B-Z transition. In this model, it is the energy required to overcome base-stacking interactions.
The transition to a stretched intermediate state is crucial in allowing the change in the direction of backbone progressions to proceed smoothly during B-Z DNA transition. A simple argument follows to substantiate this. Essentially, we seek to derive an approximate value to the Gibbs free energy change (Huang, 1987; Haynie, 2001) during the reversal of backbone progressions for our trajectory with 10 grid points and compare it with the change in free energy when the transition to the stretched intermediate state is absent. Gibbs free energy is of enormous importance in determining the direction of processes and positions of equilibrium. A negative free-energy change will imply that the process is spontaneous.
Let us consider the path segment 1 → 6 (numbers refer to structure index) in Fig. 10 (energy profile after 1.2 million optimization steps) because the reversal of backbone progression occurs along this particular segment. At this point, it is worth mentioning some of the features of biological thermochemistry. Most biochemical processes occur under constant pressure conditions. Furthermore, most processes occur in liquids or solids rather than in gases. This allows us to neglect the change in volume to a good approximation and write the Gibbs free energy change as:
 |
(22) |
The change in internal energy  can be determined from the energy profile in Fig. 10, but the change in entropy that takes place during 1 → 2 (we can neglect the entropy change during 2 → 6 because the entropy change due to the transition from B-DNA to S-DNA that takes place during 1 → 2 is the dominant one) has to be computed or approximated by other means. We note that in many instances, the highly cooperative transition of B-DNA to the S-DNA conformation is regarded or interpreted as force-induced DNA melting (Rouzina and Bloomfield, 2001). Thus, we can treat the B-S transition as being equivalent to melting of DNA caused by stretching and write the change in entropy
  as (Williams et al., 2001):
 |
(23) |
Here,  is the change in the DNA heat capacity per basepair upon melting,
  is the DNA melting temperature, and
  is obtained from calorimetric measurements. A number of researchers have attempted to measure the value of
  Unfortunately, the variance in these measurements is rather significant. For the sake of argument, we use a value of 46.2 cal/K mol basepairs (bp) for
  at
at  as obtained by Mrevlishvili et al. (1996). We also select a value of 25 cal/K mol bp for
  based on experimental results obtained by Williams et al. (2001). Substituting these values into Eq. 23 will give us
  cal/K mol bp at 300 K. Thus, we have (for seven basepairs)
 |
(24) |
The change in backbone progression is spontaneous.
On the other hand, without the stretching transition, the change in Gibbs free energy will, to a good approximation, be given by
 |
(25) |
This implies that the change in chain sense does not occur readily. Therefore, with this simple illustration, we show that the stretching transition in this B-Z model allows one to avoid the dilemma of having to identify a mechanism that allows the DNA oligomer to overcome the energy barrier due to chain sense reversal when none has been found experimentally.
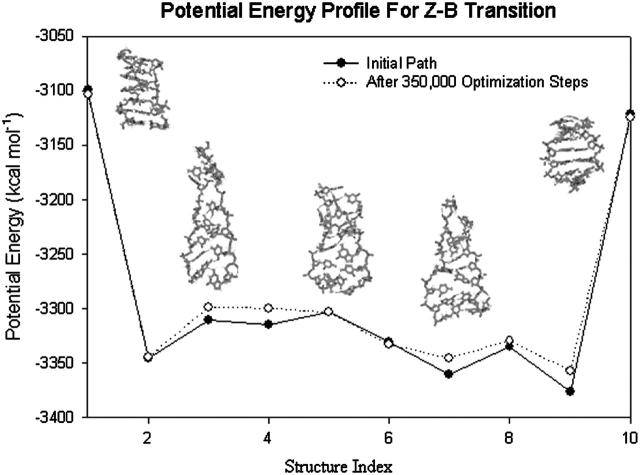
The energy profile of the reverse Z-B transition is presented in Fig. 14. The procedures involved are similar to those for the B-Z transition. The run consists of a total of 350,000 optimization steps and solvent-solute interactions are computed using the GBSM.
FIGURE 14.
Variation in potential energy with structure index for Z-B transition. The structural properties of the Z-B transition appear to be very similar to the B-Z transition. However, the energy profile reveals a very subtle difference between the two transitions; the peak found in the B-Z transition potential energy profile is missing in this plot.
From Fig. 14, we notice many similarities between Z-B transition and B-Z transition. Both transition involves the stable S-DNA intermediate and a consistent change in the twist of the oligomer during the transition. A main difference is the absence of an energy barrier at structure 6 for the Z-B transition. This is attributed to the fact that Watson-Crick chain direction is the preferred chain direction of DNA.
Fig. 14 also confirms the experimental fact that Z-DNA is a transient state of DNA in the absence of high-salt condition and negative supercoiling because the Z-B transition can proceed readily ( ).
).
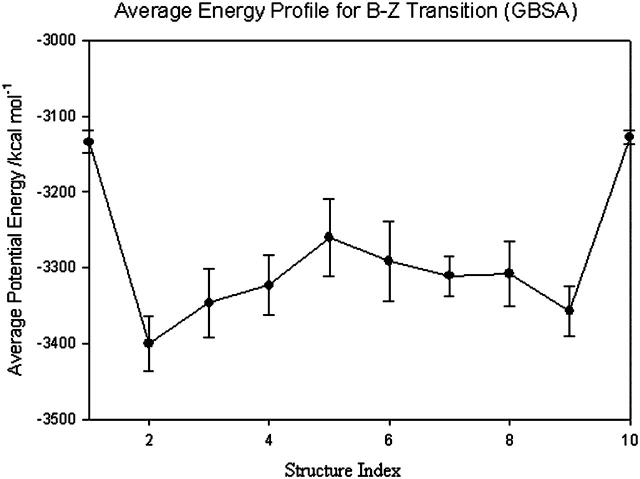
The ensemble average energy as a function of structure index is presented in Fig. 15. Despite having slightly different initial and final conformations, the typical features of the B-Z transition energy profile can be found in all the trajectories computed using the SDEL formalism.
FIGURE 15.
Average potential energy profile of B-Z transition for five trajectories. The error bars are standard deviations.
Torque released during unwinding
At this point, it is relevant to explore the implications of the stretched intermediate model on DNA nanotechnology. In 1999, a group of scientists produced a nanomechanical device based on the B-Z transition of DNA. However, it is not known whether the device can be used to power a nanoscale motor because the structural and dynamic features of the transition are not solved. If the stretched intermediate model is correct, we can actually determine the torque that is released during the B-Z transition using the ZZO model. The amount of untwisting in the large L limit can be estimated using Eq. 9 to give:
 |
(26) |
The decrease in energy across the B-Z transition is given by
 |
(27) |
where the potential given by Eq. 21 is now properly scaled to become dimensionless with 
The mean torque Γ is given by the ratio of  to the amount untwisted. This will give us
 |
(28) |
.
The value given by Eq. 28 is a crude estimation of the torque that will be released if the DNA molecule unwinds during the transition.
Concluding remarks and proposed experimental setup
The Harvey model was originally conceived to explain an intriguing result obtained from NMR experiments that seem to suggest that hydrogen bonds are intact during B-Z transition. According to the Harvey model, this can be possible if DNA does not unwind during the transition because unwinding introduces instabilities to the helical structure. However, the NMR experiments carried out then are not conclusive and are merely suggestive. There are also experiments that suggest that the basepairs open up during B-Z transition (Prohofsky, 1995). Theoretical models of B-Z transition in which the transition is facilitated by thermal fluctuational basepair opening have had considerable success (Chen and Prohofsky, 1994). Coupled with the fact that the Harvey model poses greater steric dilemma as a result of the deliberate rearrangement of the backbone, unwinding of the helix during the transition is likely to be the norm rather than the exception. In fact, the ZZO model that is used to account for the stretching of DNA during B-Z transition can also show that negative torque can stabilize Z-DNA.
The stretched intermediate appears to be a natural consequence of the unwinding of DNA oligomer during the B-Z transition. The ZZO model explains how unwinding can lead to instabilities in base-stacking interactions, thereby causing the helix to extend itself and adopt the S-DNA conformation. Hydrogen bonds are weak, and are therefore ruptured easily during unwinding of DNA.
The stretching of DNA during B-Z transition has several advantages. Firstly, the increase in rise removes the stringent constraints imposed on rise-dependent orientation variables and reduces steric clashes between bases (Mazur et al., 2003). This allows the bases to make large amplitude motion that arises as a consequence of nonlinear interactions. Secondly, stretching of the backbone greatly reduces the backbone energy and this compensates the energy required for major conformational changes in the nucleotides.
The simulations may also provide insights into the formation of a B-Z junction. According to experiments, a B-Z junction can be described as follows:
B-Z junctions can be as small as 3 bp.
At least one basepair has neither the B nor Z conformation.
Hydrogen bonds are intact below 350 K. This is in variance with some authors who claim that B-Z junctions are completely melted.
B-Z junctions are neither strongly bent nor particularly flexible.
The concept of B-Z junction is particularly useful in the zipper model. A high energy nucleation step involves first the formation of the B-Z junction, equivalent to 6–8 unpaired basepairs, followed by the propagation of the junctions in opposite directions along the chain while the original site is converted to the Z-form. If we focus on the nucleation site itself, the transition appears to take place in a similar manner: B-DNA → B-Z junction → Z-DNA as compared to B-DNA → stretched intermediate → Z-DNA. Our stretched intermediate state shares similar structural features with the B-Z junction described above. This is bolstered by the fact that the activation energy to form two B-Z junctions (42 kJ/mol) is rather similar to the amount required to overcome the base-stacking interaction (Fig. 13) and to initiate the B-Z transition in our model. Despite the similarities, one cannot conclude that the stretched intermediate is indeed the B-Z junction as there is no substantial experimental evidence showing that the B-Z junction adopts the S-DNA conformation. The similarities may be merely coincidental. Moreover, there is a possibility that stretching may occur only in short oligomers rather than longer stretches of DNA during B-Z transition because it requires lesser amount of energy to overcome base-stacking interaction in short oligomers as compared to long polymers. The mechanism for B-Z transition may be different for closed circular DNA, which has no free ends unlike the linear DNA model. The proposed model for B-Z transition may, therefore, only apply to short linear double-stranded DNA molecules. The B-Z transition for longer stretches of DNA or closed circular DNA is still under intense investigation.
According to the ZZO model and the simulation results, stretching of the DNA is a good indicator of unwinding. Thus, to determine whether the molecule truly unwinds during the transition, we propose the following experimental setup.
In a highly idealized situation, we can immerse a short DNA oligomer in a channel that is only a few angstroms in width so that the DNA molecule will not bend (Fig. 16). The channel will be filled with a buffer whose salt content can be adjusted. Increasing the salt content will promote B-Z transition. Fluorescent dyes are placed at both ends of the DNA polymer, either attached to a molecule that can be displaced easily by the stretching of DNA or as a standalone molecule. A good choice for the dyes will be the donor-acceptor pair, fluorescein-Cy3, as it exhibits simple, consistent photophysical properties (Jares-Erijman and Jovin, 1996). We expect the distance between them to change when the transition occurs and one method to measure this change is to use fluorescence resonance energy transfer (FRET) spectroscopy. FRET spectroscopy is chosen because the signal in FRET is proportional to the inverse sixth power of the separation of the dyes, sufficient to measure changes of a few angstroms. Thus, if the proposed model is true (i.e., the helix will unwind and stretches during the transition), then we will expect a signal ratio (original signal/final signal) of ∼7.5–16.5 depending on the relative extension of 1.4–1.6. In the absence of stretching, the ratio will be 1.66 because Z-DNA has a larger rise of 3.7 Å.
FIGURE 16.
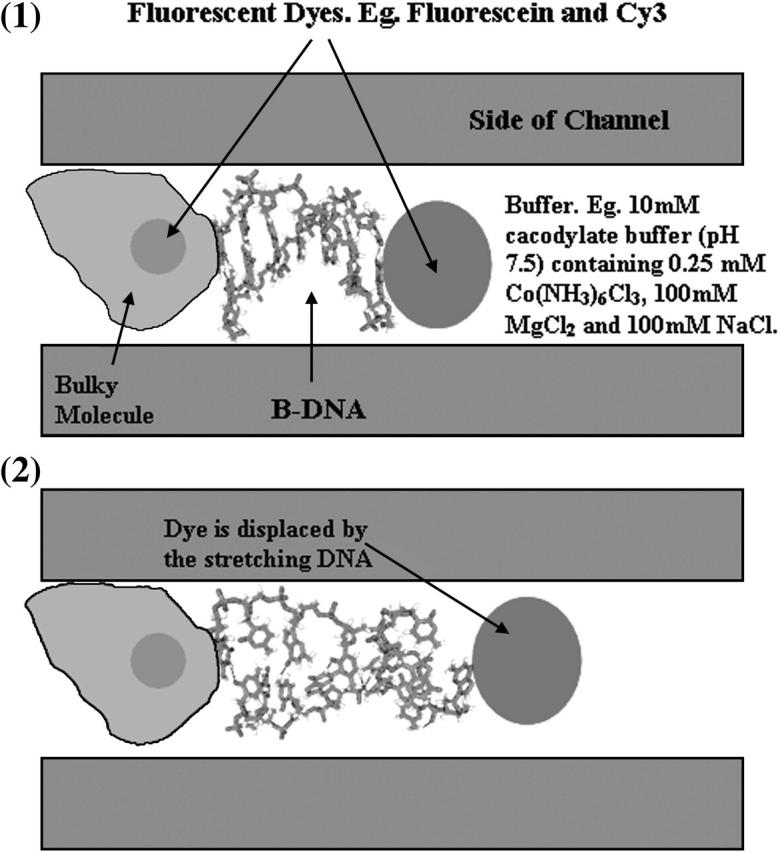
Experiment to verify the stretching of DNA during B-Z transition. The dyes can be attached to bulky molecules or be treated as standalone molecules, depending on the ease of handling.
The exact details of the experiment are, of course, more complicated than the one described above and precautions must be taken to ensure than any change in signal ratio is due to stretching. For instance, oligomers of different lengths must be tested out to ensure consistency. One foreseeable problem will be the net drift velocity acquired by standalone fluorescent dyes. If it is random in nature, then repeated experimentation will minimize this randomness.
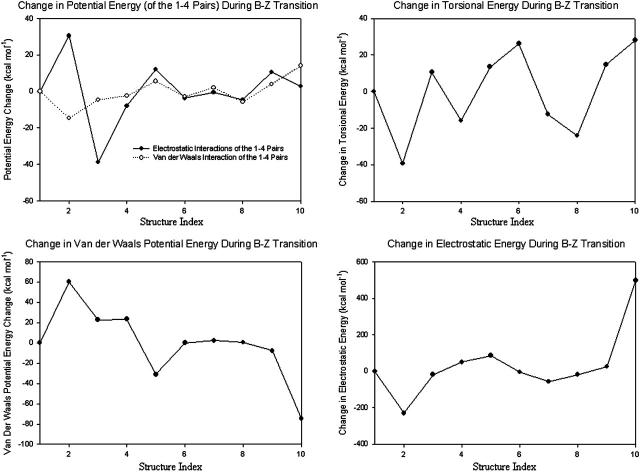
Electrostatic interaction plays a dominant role in B-Z transition (Misra and Honig, 1995). As shown in Fig. 17, the change in the electrostatic potential energy from the pseudo-S-DNA state to Z-DNA is ∼500 kcal/mol. On the other hand, the changes in other energy components are typically <40 kcal/mol. This implies that any external physiological condition that favors the formation of Z-DNA must, therefore, reduce the electrostatic repulsion. This observation is already well known since numerous experiments and theoretical calculations (Gueron et al., 2000) have shown that high-salt condition stabilizes Z-DNA and helps drive the transition in DNA fragments of varying lengths. However, for sake of simplicity, the effects of counterions are neglected in the current stretched intermediate model. One can certainly expect the proposed model to be correct at least qualitatively; and the inclusion of counterions may lead to several quantitative changes such as degree of extension and amplitude of oscillations of bases. As an analogy, we demonstrate how solvation can affect the proposed transition model. Fig. 18 shows two energy profiles of the same trajectory. Fig. 18 a is computed without taking into consideration solvent-solute interaction. Fig. 18 b, on the other hand, is calculated with solvent-solute interactions taken into account using the GBSM.
FIGURE 17.
Energy changes of the various potential terms. Nonbonded interactions should be calculated only between particles that are not bonded (Elber et al., 1995). In empirical molecular mechanics, particles that are separated by more than three bonds are considered unbound and the nonbonded interactions are computed for them in full (electrostatic and Van der Waals energy terms). Particles that are separated by three bonds are considered an intermediate case, in which their interactions are scaled down to reproduce known torsion barriers (electrostatic and Van der Waals energy terms of the 1–4 pairs). The change in electrostatic energy is the largest during B-Z transition.
FIGURE 18.
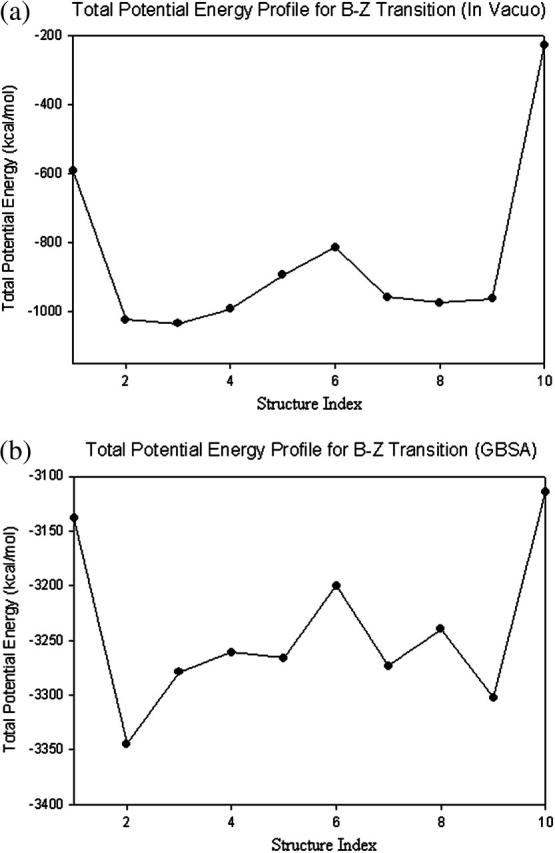
Comparison of potential energy profiles in vacuo and solvent. The potential energy difference between B-DNA and Z-DNA is reduced considerably when modeled in solvent.
The main difference between the two graphs in Fig. 18 lies in the potential energy difference of B-DNA and Z-DNA. In Fig. 18 a, the potential difference between the two conformations is ∼362 kcal/mol, whereas the potential difference between them is reduced to merely 36 kcal/mol in the presence of solute-solvent interactions (Fig. 18 b). Once again, this can be understood from the fact that the negatively charged sugar-phosphate backbones in Z-DNA are much closer spatially compared to the broad B-DNA. Electrostatic repulsion is a major obstacle in the conversion from B-DNA to Z-DNA and such repulsion can be reduced in the presence of water molecules that screen the negatively charged sugar-phosphate backbones. Interestingly, one notes that the initial and final conformational energies are more sensitive to the absence/presence of a solvent than intermediate conformational energy values. We can certainly expect similar effects to occur when counterions are taken into account. These effects will be investigated in future studies.
Acknowledgments
We thank Baohua Wang and Alfredo Cardenas for their insightful discussions on the implementation of MOIL9, and the Supercomputing and Visualization unit of the National University of Singapore for their valuable technical support. Images of DNA in this article were created using gOpenMol.
This work was awarded the Bronze Award in the HPCQuest 2004 competition organized by IBM Singapore and the Institute of High Performance Computing (Singapore).
APPENDIX: NONLINEAR REGRESSION
We present here a portion of the report generated by Sigmaplot 2002 for the curve fitting of the soliton-like solution in Fig. 8:
R = 0.97844953 Rsqr = 0.95736348 Adj Rsqr = 0.94518161.
± SE of estimate = 15.7983.
PRESS = 2978.2293.
Durbin-Watson statistic = 3.0168.
Normality test: K-S statistic = 0.2485. Significance level = 0.5053
Constant variance test: passed (P = 0.6313).
Power of performed test with α = 0.0500:1.0000.
| Coefficient | ± SE | t | P | |
|---|---|---|---|---|
| v | 0.3690 | 0.0606 | 6.0861 | 0.0005 |
| b0 | 1.8671 | 0.3472 | 5.3777 | 0.0010 |
| c | 126.8023 | 8.6039 | 14.7378 | <0.0001 |
| Analysis of variance | DF | SS | MS | F | P |
|---|---|---|---|---|---|
| Regression | 2 | 39229.8385 | 19614.9193 | 78.5892 | <0.0001 |
| Residual | 7 | 1747.1148 | 249.5878 | ||
| Total | 9 | 40976.9534 | 4552.9948 |
References
- Ansevin, A. T., and A. H. Wang. 1990. Evidence for a new Z-type left-handed DNA helix: properties of Z(WC)-DNA. Nucleic Acids Res. 18:6119–6126. [DOI] [PMC free article] [PubMed] [Google Scholar]
- Arora, K., and T. Schlick. 2003. Deoxyadenosine sugar puckering pathway simulated by the stochastic difference equation algorithm. Chem. Phys. Lett. 378:1–6. [Google Scholar]
- Blackburn, G. M., and M. G. Gait. 1995. Nucleic Acids in Chemistry and Biology, 2nd Ed. Oxford, Oxford, UK.
- Changela, A., K. Perry, B. Taneja, and A. Mondragon. 2003. DNA manipulators: caught in the act. Curr. Opin. Struct. Biol. 13:15–22. [DOI] [PubMed] [Google Scholar]
- Chen, Y. Z., and E. W. Prohofsky. 1994. Nonlinear effects and thermal expansion as expressed in self-consistent phonon calculations on the temperature dependence of a phase change: application to the B to Z conformation change in DNA. Phys. Rev. E. 49:3444–3451. [DOI] [PubMed] [Google Scholar]
- Chen, Y. Z., V. Mohan, and R. H. Griffey. 2000. Spontaneous base flipping in DNA and its possible role in methyltransferase binding. Phys. Rev. E. 62:1133–1137. [DOI] [PubMed] [Google Scholar]
- Czerminski, R. A. Roitberg, C. Choi, A. Ulitsky, and R. Elber. 1991. Conformational transitions. In Advances in Biomolecular Simulations. R. Lavery, J. L. Rivail, and J. Smith, editors. AIP Conference Proceeding 239, American Institute of Physics, College Park, MD. 153–172.
- Czerminski, R., and R. Elber. 1990. Self avoiding walk between two fixed points as a tool to calculate reaction paths in large molecular systems. Int. J. Quantum Chem. 24:167–186. [Google Scholar]
- Elber, R., A. Roitberg, C. Simmerling, R. Goldstein, H. Li, G. Verkhivker, C. Keasar, J. Zhang, and A. Ulitsky. 1995. MOIL: a program for simulations of macromolecules. Comput. Phys. Commun. 91:159–189. [Google Scholar]
- Elber, R., A. Ghosh, and A. Cardenas. 2002. Long time dynamics of complex system. Acc. Chem. Res. 35:396–403. [DOI] [PubMed] [Google Scholar]
- Elber, R., A. Cardenas, A. Ghosh, and H. A. Stern. 2003. Bridging the gap between reaction pathways, long time dynamics and calculation of rates. In Advances in Chemical Physics, Vol. 126. I. Prigogine, editor. John Wiley & Sons, Hoboken, NJ. 93–129.
- Elber, R., M. Jaroslaw, and O. Roberto. 1999. Stochastic path approach to compute atomically detailed trajectories: application to the folding of C peptide. J. Phys. Chem. B. 103:899–911. [Google Scholar]
- Gaididei, Y. B., S. F. Mingaleev, P. L. Christiansen, M. Johansson, and K. O. Rasmussen. 1998. Effects of long-range dispersion in nonlinear dynamics of DNA molecules. Proc. of the Adriatico Research Conference, ICTP, Trieste, Italy, August 19–22, 1997. L. Matsson, editor. World Scientific, Singapore. 176–194.
- Ghosh, A., C. S. Rapp, and R. A. Friesner. 1998. A generalized Born model based on a surface integral formulation. J. Phys. Chem. B. 102:10983–10990. [Google Scholar]
- Gruskin, E. A., and A. Rich. 1993. The biology of left-handed Z-DNA. Biochemistry. 32:2167–2176. [DOI] [PubMed] [Google Scholar]
- Gueron, M., J.-P. Demaret, and M. Filoche. 2000. A unified theory of B-Z transition of DNA in high and low concentration of multivalent ions. Biophys. J. 78:1070–1083. [DOI] [PMC free article] [PubMed] [Google Scholar]
- Harvey, S. C. 1983. DNA structural dynamics: longitudinal breathing as a possible mechanism for the B to Z transition. Nucleic Acids Res. 11:4867–4878. [DOI] [PMC free article] [PubMed] [Google Scholar]
- Haynie. Donald T. 2001. Biological Thermodynamics. Cambridge University Press, Cambridge, UK.
- Herbert, A., and A. Rich. 1996. The biology of left-handed Z-DNA. J. Biol. Chem. 271:11595–11598. [DOI] [PubMed] [Google Scholar]
- Herbert, A., and A. Rich. 1999. Left-handed Z-DNA: structure and function. Genetica. 106:37–47. [DOI] [PubMed] [Google Scholar]
- Ho, P. S. 1994. The non-B-DNA structure of d(CA/TG)n does not differ from that of Z-DNA. Proc. Natl. Acad. Sci. USA. 91:9549–9553. [DOI] [PMC free article] [PubMed] [Google Scholar]
- Huang. Kerson. 1987. Statistical Mechanics, 2nd Ed. John Wiley & Sons, Hoboken, NJ.
- IUPAC. 1974. Basic definitions of terms relating to polymers. Pure Appl. Chem. 40:477–491. [Google Scholar]
- IUPAC. 1981. Stereochemical definitions and notations relating to polymers (recommendations 1980). Pure Appl. Chem. 53:733–752. [Google Scholar]
- Jares-Erijman, E. A., and T. M. Jovin. 1996. Determination of DNA helical handedness by fluorescence resonance energy transfer. J. Mol. Biol. 257:597–617. [DOI] [PubMed] [Google Scholar]
- Lai, P.-Y., and Z.-C. Zhou. 2002. Stretching a double-stranded DNA: elongation by untwisting. Chinese Journal of Physics. 40:465–470. [Google Scholar]
- Lai, P.-Y., and Z.-C. Zhou. 2003. Stretching a double-stranded DNA: nature of the B-form to the S-form transition. J. Chem. Phys. 118:11189–11199. [Google Scholar]
- Landau, L. D., and E. M. Lifshitz. 1960. Mechanics: Course of Theoretical Physics, Vol. 1. Pergamon Press, New York, NY.
- Lavery, R. 1994. Chapter 4. In Nonlinear Excitations in Biomolecules. M. Peyrard, editor. Springer, New York, NY.
- Leger, J. F., G. Romano, A. Sarkar, J. Robert, L. Bourdieu, D. Chatenay, and J. F. Marko. 1999. Structural transitions of a twisted and stretched DNA molecule. Phys. Rev. Lett. 83:1066–1069. [Google Scholar]
- Mao, C., W. Sun, Z. Shen, and N. C. Seeman. 1999. A nanomechanical device based on the B-Z transition of DNA. Nature. 397:144–146. [DOI] [PubMed] [Google Scholar]
- Mazur, J., R. L. Jernigan, and A. Sarai. 2003. Conformational effects of DNA stretching. Mol. Biol. 37:277–287. [PubMed] [Google Scholar]
- Misra, V. K., and B. Honig. 1995. The electrostatic contribution to the B to Z transition of DNA. Biochemistry. 35:1115–1124. [DOI] [PubMed] [Google Scholar]
- Mrevlishvili, G. M., G. Z. Razmadze, T. D. Mdzinarashvili, N. O. Metreveli, and G. R. Kakabadze. 1996. Calorimetric investigation of DNA in the native and denatured states. Thermochim. Acta. 274:37–43. [Google Scholar]
- Prohofsky, E. 1995. Statistical Mechanics and Stability of Macromolecules. Cambridge University Press, Cambridge, UK.
- Rich, A., and S. Zhang. 2003. Z-DNA: the long road to biologic function. Nat. Rev. Genet. 4:566–573. [DOI] [PubMed] [Google Scholar]
- Rouzina, I., and V. A. Bloomfield. 2001. Force-induced melting of the DNA double helix. 1. Thermodynamic analysis. Biophys. J. 80:882–893. [DOI] [PMC free article] [PubMed] [Google Scholar]
- Saenger, W., and U. Heinemann. 1989. Raison d'être and structural model for the B-Z transition of poly d(G-C)*poly d(G-C). FEBS Lett. 257:223–227. [DOI] [PubMed] [Google Scholar]
- Seeman, N. C., and A. M. Belcher. 2002. Emulating biology: building nanostructures from the bottom up. Proc. Natl. Acad. Sci. USA. 99:6451–6455. [DOI] [PMC free article] [PubMed] [Google Scholar]
- Siva, K., and R. Elber. 2003. Ion permeation through the gramicidin channel: atomically detailed modeling by the stochastic difference equation. Proteins. 50:63–80. [DOI] [PubMed] [Google Scholar]
- Smith, S. B. 1998. Twisting DNA molecules. Biophys. J. 74:1609–1610. [DOI] [PMC free article] [PubMed] [Google Scholar]
- Wang, H. J., G. J. Quigley, F. J. Kolpak, J. L. Crawford, J. H. van Boom, G. van der Marel, and A. Rich. 1979. Molecular structure of a left-handed double helix DNA fragment at atomic resolution. Nature. 282:680–686. [DOI] [PubMed] [Google Scholar]
- Williams, M. C., J. R. Wenner, I. Rouzina, and V. A. Bloomfield. 2001. Entropy and heat capacity of DNA melting from temperature dependence of single molecule stretching. Biophys. J. 80:1932–1939. [DOI] [PMC free article] [PubMed] [Google Scholar]
- Wolfl. S., W. Vahrson, and A. Herbert, 1995. Chapter 4. In DNA and Nucleoprotein Structure In Vivo, Vol. 1. H. P. Saluz and K. Wiebauer, editors. R.G. Landes, Austin, TX. 137.
- Yakushevich, L. V. 1996. Methods of Theoretical Physics and Their Applications to Biopolymer Science. Nova Science Publishers, Hauppauge, NY.
- Yakushevich, L. V. 1998. Nonlinear Physics of DNA. John Wiley & Sons, Hoboken, NJ.
- Yakushevich, L. V. 2000. Nonlinear dynamics of DNA. In Nonlinear Science at the Dawn of the 21st Century. P. L. Christiansen, M. P. Sorensen, and A. C. Scott, editors. Springer, Berlin. 373–392.
- Yomosa, S. 1984. Solitary excitations in deoxyribonuclei acid (DNA) double helices. Phys. Rev. A. 30:474–480. [Google Scholar]
- Zhou, H., Y. Zhang, and Z.-C. Ou-Yang. 2000. Elastic property of single double-stranded DNA molecules: theoretical study and comparison with experiments. Phys. Rev. E. 62:1045–1058. [DOI] [PubMed] [Google Scholar]


