

Abstract
Recently, experiments have shown that cyclin-dependent kinase (CDK) activity exhibits hysteresis in its response to total cyclin when cyclin is made nondegradable and controlled externally. This observation was taken to support mathematical modeling predictions regarding the underlying dynamics of the cell cycle. However, cell cycle dynamics can also be generated by other nonhysteretic mechanisms. To examine the robustness of the hysteretic response of CDK activity to total cyclin, we simulated various cell cycle signal transduction networks, and correlated the dynamics to the response function of CDK activity versus total cyclin. By randomly searching the parameter space, we assessed robustness by estimating the frequency of hysteretic versus nonhysteretic dynamical mechanisms. When the dynamical instabilities were caused by feedback loops in CDK phosphorylation and dephosphorylation or by feedback between cyclin and the CDK inhibitor, the response function of CDK activity versus total cyclin correlated well with the dynamical instabilities. However, when the dynamical instabilities originated from feedback between cyclin and APC-CDH1 or RB-E2F, the response function did not correlate with dynamical instabilities. Thus, although a hysteretic response is neither necessary nor sufficient, it is in general a much more robust mechanism for generating cell cycle dynamics than nonhysteretic mechanisms.
INTRODUCTION
During the cell cycle, a cell replicates its DNA (G1 and S phases) and then undergoes mitosis (G2 and M phases). These events are controlled by the periodic and ordered activation and inactivation of cyclin-dependent kinases (CDK) (Nasmyth, 1996; Sherr, 1996) regulated by a complex signal transduction network with multiple feedback loops. Using mathematical modeling, Tyson and colleagues proposed that a bistable/hysteretic relationship between CDK activity and a parameter (Chen et al., 2000; Novak et al., 1998; Tyson and Novak, 2001) or total cyclin (Novak and Tyson, 1993; Tyson et al., 2002) caused the periodic oscillation in CDK activity when coupled to negative feedback facilitating cyclin degradation. However, Goldbeter (1991) has proposed a limit cycle oscillation, generated by a steep but nonhysteretic response of CDK activity to cyclin, coupled with a delayed negative feedback loop, as the mechanism of cell cycle dynamics. Earlier experiments in Xenopus laevis extracts by Solomon et al. (1990) showed that a sudden jump in CDK activity occurred when total cyclin reached a critical value (Fig. 1 A), which seems to agree with Goldbeter's theory. Recently, however, Sha et al. (2003) and Pomerning et al. (2003) revisited the experiments done by Solomon et al. and showed that CDK activity suddenly jumped up at one critical total cyclin concentration, but jumped down at a lower critical value, forming a hysteresis loop governed by the dynamics of bistability (Fig. 1 B). Bistability was also observed by Cross et al. (2002) in budding yeast cell cycle. These experiments support the mechanisms proposed by Tyson and colleagues. In interpreting these elegant theoretical and experimental studies, several important questions arise. First, since either a steep sigmoidal response (Goldbeter mechanism) or a bistable response (Tyson mechanism) combined with negative feedback can generate cell cycle dynamics, does the experimentally observed bistable response between CDK activity and total cyclin prove that the bistability mechanism is correct, or merely favor its correctness? Moreover, how does the fact that the experimentally observed hysteresis occurred under conditions in which cyclin was mutated to be nondegradable affect the interpretation? Second, since it is practically important to identify system parameters that are measurable experimentally and can be used to predict cell cycle dynamics, would the lack of a bistable response between CDK activity and total cyclin, if observed experimentally, exclude the bistability mechanism? Finally, which mechanism is intrinsically more robust, i.e., resistant to noise and perturbations? The signal transduction network of the cell cycle is composed of interlinked signaling modules (Fig. 2 A), each containing one or more feedback loops capable of generating dynamics. Do both mechanisms remain valid and robust under these conditions? In this study, we used mathematical modeling and computer simulation to address these questions by randomly searching the parameter space in the presence of various signaling modules. We find that although a hysteretic response is neither necessary nor sufficient, it is in general a much more robust mechanism for generating cell cycle dynamics than other mechanisms.
FIGURE 1.

(A) MPF (maturation promoting factor) activity versus cyclin from Solomon et al. (1990) showing a sudden jump (see arrows) in MPF activity as cyclin reached a critical value. (B) Experiments by Sha et al. (2003) showing that the MPF (or CDC2) activity jumps up at one critical value (•) but jumps down at another value (○), forming a hysteretic loop. The experimental data points fall closely to the bistable curve from a computer simulation.
FIGURE 2.
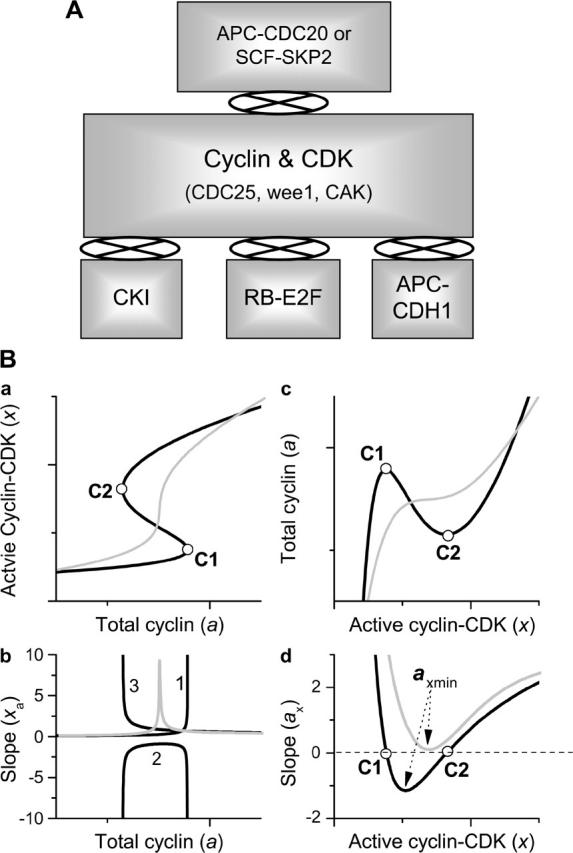
(A) Schematic plots of different signaling pathways and their couplings for cell cycle control to be simulated in this study. (B) Schematic plots of the response curves (a) and their slopes (b), and the inversed response curves (c) and their slopes (d).
METHODS AND RESULTS
Mathematical models and computer simulations
Models of signal transduction network were adopted from previous studies (Hatzimanikatis et al., 1999; Qu et al., 2003a; Tyson and Novak, 2001; Yang et al., 2004). The detailed signaling pathways and the corresponding differential equations are presented in the Supplementary Material for each model. Since the regulation networks for cyclins (E, A, and B) and CDKs (1 and 2) in higher eukaryotes are very similar, here we study a generic network for cell cycle signaling (Qu et al., 2003a; Yang et al., 2004). Fig. 2 A shows the schematic plot of the signaling modules. The module marked “Cyclin & CDK” is the module involving cyclin complexing with CDK, which is phosphorylated and dephosphorylated by CDC25, wee1, and CDK activating kinase. CDC25, wee1, and CDK activating kinase are also activated or inactivated by active cyclin-CDK complex, forming positive feedback loops. These positive feedback loops cause a variety of dynamical instabilities (Qu et al., 2003a; Yang et al., 2004). The module marked “CKI” is the CDK inhibitor regulation module. It couples to the Cyclin & CDK module by binding to the active cyclin-CDK complex. It has been shown (Qu et al., 2003b; Thron, 1999) that the coupling between CKI and the cyclin-CDK complex can also generate dynamical instabilities. The “APC-CDH1” module couples to the Cyclin & CDK module through APC-CDH1, which facilitates cyclin degradation. In addition, APC-CDH1 is inactivated by CDH1 phosphorylation by cyclin-CDK (Morgan, 1999), forming a double negative feedback loop. Tyson and others (Chen et al., 2000; Novak et al., 1998; Tyson and Novak, 2001) showed that the feedback between cyclin and CDH1 caused bistability. The “RB-E2F” module couples to the Cyclin & CDK module as follows: active cyclin-CDK phosphorylates RB, which frees E2F from RB and allows free E2F to promote cyclin transcription, forming a positive feedback (Dyson, 1998), which can also generate dynamical instabilities (Qu et al., 2003b). The negative feedback is facilitated by APC-CDC20 or SCF-SKP2 (the “APC-CDC20 or SCF-SKP2” module in Fig. 2 A). APC-CDC20 or SCF-SKP2 is activated by active cyclin-CDK, and the activated ones cause degradation of cyclin and other cell cycle proteins (Peters, 1998), forming the negative feedback loop. Note that the signaling modules sketched in Fig. 2 A are used for general assessment; some of them may not exist in certain species (e.g., neither “RB-E2F” nor “APC-CDH1” is relevant to Xenopus). Detailed signaling pathways for these signaling modules and the differential equations are presented in the Supplementary Material.
Steady states of the systems were obtained either analytically (if possible) or numerically. The stability of the steady state was analyzed by calculating the eigenvalues or the Lyapunov exponents using standard linear stability analysis (Strogatz, 1994). Differential equations were numerically solved using the fourth-order Runge-Kutta methods. Programs were coded in C language and MATLAB. We usually simulated 100,000 randomly chosen parameter sets for each case. For each parameter set, we analyzed the stability in the cyclin synthesis rate constant (ks,cyc) space. One such assessment takes 72–96 h in CPU time in a 2.5 GHz Dell personal computer.
Linking the CDK activity response curve to dynamical instabilities
We define the response curve as the functional relation between active cyclin-CDK (x) and total cyclin (a). The response curve was obtained either analytically or numerically under the imposed condition of no cyclin synthesis or degradation, with total cyclin as an externally controlled parameter input. The response curve can be either monotonic (e.g., sigmoidal) or nonmonotonic (e.g., bistable) (see Fig. 2 B a), depending on model parameters chosen. When the response curve is sigmoidal, the slope  of the curve increases to a maximum and then decreases. When the response curve is bistable, the slope of the curve (lines marked 1, 2, and 3 in Fig. 2 B b) crosses infinity at the two turning points (labeled as C1 and C2 in Fig. 2 B). To make the slope numerically tractable, we inverted the axes to plot total cyclin (a) versus active cyclin-CDK (x) as in Fig. 2 B c, which we call the inverse response curve. After this change, the slope (
 ) for either sigmoidal or bistable response curve decreases to a minimum then increases. When the response curve is sigmoidal, the slope is always positive, but when it is bistable, a negative segment exists (Fig. 2 B d). Therefore, we can quantitatively describe the response curve by the minimum slope (axmin).
In a simplified two-variable model, we analytically linked the slope ax to the stability of the steady state. In computer simulation of complex models, we first randomly selected a set of parameters and calculated the corresponding inverse response curve and its minimum slope (axmin). Since the total cyclin was externally controlled, cyclin synthesis rate (ks,cyc) and degradation rates did not affect the value of axmin. For the same random set of parameters and axmin, we then calculated the steady state and analyzed its stability versus the cyclin synthesis rate (ks,cyc). If instability was detected in the ks,cyc range we gave, we recorded this case as unstable. The percentage of the unstable cases versus the total cases for the same axmin was calculated.
Analytical study of a two-variable model with only one positive feedback loop
We previously developed a two-variable model for cyclin and CDK regulation (Qu et al., 2003b), i.e.,
 |
(1) |
where y represents the free cyclin concentration, x the active cyclin-CDK concentration, and f(x) represents CDC25 activity as a function of active cyclin-CDK (x). All rate constants have the same meaning as in the previous study (Qu et al., 2003b) except k1 was substituted with ks,cyc for consistency. One widely used tool in nonlinear dynamics is called nullcline in the variable space (Novak and Tyson, 1993; Tyson et al., 2001; Tyson and Novak, 2001). A nullcline is a functional relation between two state variables (e.g., active cyclin-CDK (x) versus free cyclin (y)) when the time-rate-of-change of one variable is zero. By setting  in Eq. 1, we obtain the nullcline of x versus total cyclin A(= x + y) as
 |
(2) |
The steady-state solution ( ) is an intersection of the two nullclines (both
  and
and  in Eq. 1), which can be obtained from the two nullcline equations
 |
(3) |
Under the condition that cyclin is nondegradable and is exogenously controlled ((k2 = k7 = ks,cyc = 0), we obtain the following response relation between the total cyclin (a) and the active cyclin-CDK (x) from Eq. 1 as
 |
(4) |
which is slightly different from the nullcline A(x). To link the response curve to the stability of the steady state, we analyzed stability of the steady state of Eq. 1, and obtained the two eigenvalues, λ1 and λ2, as
 |
(5) |
where α and β are
 |
(6) |
where  When the real part of one or both of the two eigenvalues becomes positive, the steady state is unstable. According to Eq. 5, if β < 0, one of the two eigenvalues is positive and the other negative, which indicates that the steady state is a saddle point originated from the saddle-node bifurcation. If α < 0, for any β, the real part of one or both eigenvalues becomes positive. Therefore, when either α < 0 or β < 0, the steady state is unstable. To link the stability of the steady state to the slope of the response curve, we calculated the derivative of a(x) with respect to x in Eq. 4, i.e.,
 |
(7) |
Substituting fx by ax in Eq. 6 using Eq. 7, we obtain:
 |
(8) |
for α < 0, and
 |
(9) |
for β < 0. According to Eqs. 8 and 9, for the steady state to be unstable ax has to be at least smaller than one. In other words, the response curve must be a steep sigmoidal function (xa = 1/ax > 1) or hysteretic (xa = 1/ax < 0) for instability to occur leading to bistability and limit cycle. Depending on the choice of parameters, a hysteretic response may not always lead to bistability or limit cycle in the original system. For example, if k2 ≪ k7, i.e., the degradation rate of cyclin bound to CDK is much larger than that of free cyclin, and bistability will not occur until ax reaches a larger negative number as indicated by Eq. 9. But if k2 ≫ k7, bistability can occur even when the response curve is sigmoidal (ax > 0).
When dynamical instabilities are caused by CDK phosphorylation and dephosphorylation with multiple positive feedback loops
The ability of CDK phosphorylation and dephosphorylation systems to generate various dynamics (Aguda, 1999; Novak and Tyson, 1993; Qu et al., 2003a,b; Tyson, 1991; Yang et al., 2004) has been well-studied. Here we address the issue of how the response curve is related to the dynamics generated by CDK phosphorylation and dephosphorylation. According to the mathematical analysis above, a sigmoidal response curve can lead to bistable dynamics, but a hysteretic response curve may not always lead to bistable dynamics. Fig. 3 shows three cases from the simplified model (see Fig. S3 in the Supplementary Material). The left panels in Fig. 3 show the response curves a(x) (black solid line), the nullclines A(x) when no negative feedback was present (shaded solid line), and limit cycle trajectories (dashed line) when the negative feedback was present. Note that the total cyclin is an externally controlled parameter when measuring the response curve, but a state variable in the actual system. When cyclin in the active cyclin-CDK complex was nondegradable, the response curve was identical to the x nullcline (Fig. 3 A), but when cyclin in the active cyclin-CDK complex was degradable, the x nullcline was shifted to the right of the response curve (Fig. 3, B and C). The right panels in Fig. 3 show the bifurcation versus the cyclin synthesis rate (ks,cyc) with or without negative feedback. The bistable dynamics result from a saddle-node bifurcation (marked by SN1 and SN2 in Fig. 3), whereas the limit cycle dynamics result from a Hopf bifurcation (marked by H1 and H2 in Fig. 3). Fig. 3 A shows a case in which a sigmoidal response curve leads to bistable dynamics when no negative feedback was present, but converted to limit cycle dynamics when negative feedback was present. This case occurred when the degradation rate of cyclin in the active complex was much smaller than the degradation of free cyclin. Fig. 3 B shows a case in which a bistable response curve leads to bistable dynamics when no negative feedback was present, but limit cycle dynamics when strong negative feedback was present. The limit cycle goes around the bistable x nullcline, similar to a hysteretic cycle. Fig. 3 C shows a case in which a bistable response curve leads to only limit cycle dynamics, either with or without negative feedback. This case occurred when the degradation rate of cyclin in the active complex was much larger than the degradation of free cyclin.
FIGURE 3.
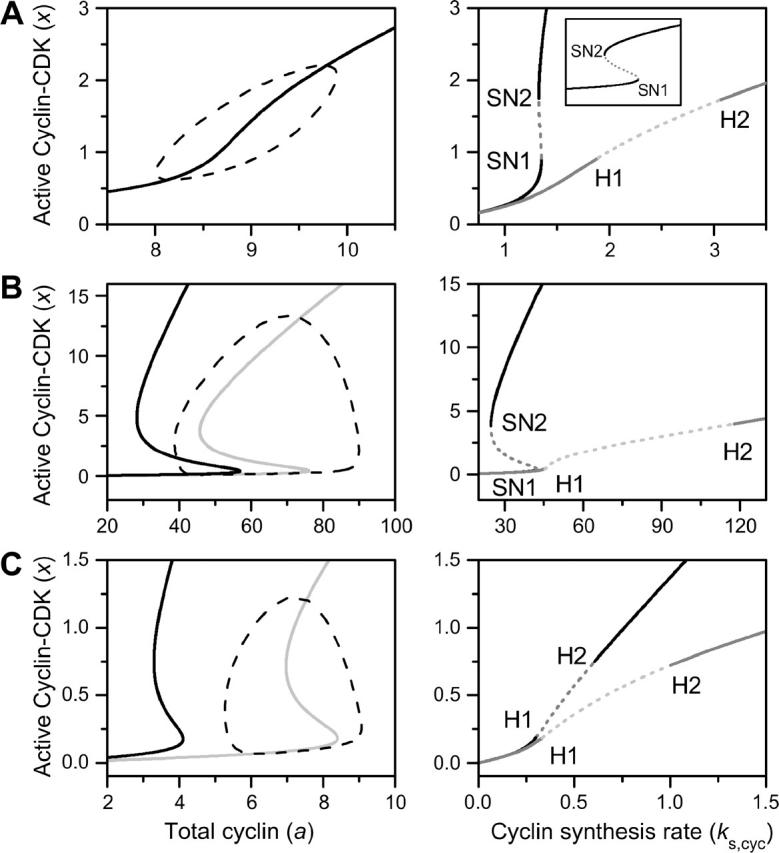
Dynamics of a simplified network model. (Left panels) Response curves (black solid lines), nullclines of active cyclin-CDK versus total cyclin (shaded solid lines), and typical trajectories of limit cycle (dashed lines). (Right panels) Steady state of active cyclin-CDK versus cyclin synthesis rate ks,cyc with (shaded lines) or without (black lines) negative feedback. The dashed portion of the lines is the unstable steady state, which is either a saddle point (due to saddle-node bifurcation) or an unstable focus (due to Hopf bifurcation). SN1 and SN2 mark the two saddle-node bifurcation points and H1 and H2 mark the two Hopf bifurcation points. (A) Sigmoidal response curve leads to bistable and limit cycle dynamics. (B) Bistable response curve leads to bistable and limit cycle dynamics. (C) Bistable curve leads only to limit cycle dynamics.
Unlike the simple two-variable model, network models of the cell cycle are high dimensional—it is impossible to study stability analytically. In addition, most of the rate constants are unknown, and may differ substantially between species. To assess the relation of the response curve to dynamical instability in the network models, we used a numerical approach in which we randomly searched the parameter space. For the same axmin, we calculated the percentage for the cases exhibiting steady-state instability versus the total cases. In a previous study (Yang et al., 2004), we showed a simplified scheme of CDK regulation, which was first proposed by Solomon and colleagues (Solomon et al., 1990; Solomon and Kaldis, 1998); it represents well the dynamics of the complex scheme (see Fig. S1 in the Supplementary Material). Here, we use both the simplified and the complex scheme to assess the role of the response curve. Fig. 4 A shows the results for the simplified model. Without the negative feedback, we detected instabilities (mostly through saddle-node bifurcation) in almost 100% of the cases when a(x) was a bistable function (axmin < 0). When a(x) was a sigmoidal function, however, instabilities occurred only in a portion of the cases. The maximum slope at which instabilities occurred was 1, which agrees with the analytical results in Eqs. 8 and 9. Adding the negative feedback into the system reduced the percentage of the unstable cases but a bistable response curve is critical (shaded line in Fig. 4 A). In this case, the negative feedback converts the bistability into a limit cycle, as we showed previously (Qu et al., 2003a; Yang et al., 2004). In the parameter range studied, 95% of the instabilities were limit cycle oscillations, and only 5% were bistability. The incidence of limit cycles versus bistability increased as the strength of negative feedback increased. The numerical analysis of the complex model with the negative feedback presence is shown in Fig. 4 B, and yielded similar results to the simplified model.
FIGURE 4.

(A) Percentage of cases that dynamical instabilities are detectable in the parameter space of cyclin synthesis rate ks,cyc. The percentage was calculated by the total cases that have dynamical instabilities in a bin of axmin divided by the total cases analyzed in the same bin. The black line (by connecting the height of the bins) is the case with no negative feedback and the shaded line is the case with negative feedback. (B) The same as in A but for a complex CDK phosphorylation and dephosphorylation network model. (C) The x value at the first critical point (C1 in Fig. 2) of the response curve versus the x value of the first bifurcation point that instability begins, such as the SN1 or H1 in Fig. 3. Black dots are for the case of no negative feedback and shaded circles are for the case with negative feedback.
Fig. 4 C shows the first critical point for instability ( , the x value at the points marked as either SN1 or H1 in Fig. 3) versus the first critical point (
 , the x value at the point marked as C1 in Fig. 2 B) in the response curve without the negative feedback (black points) and with the negative feedback (shaded circles). With no negative feedback, the data points distribute around the diagonal line with a least-square fit of slope 1. When the negative feedback is present, the data points still distribute around the diagonal line but are more scattered. These data show that the threshold point (C1) in the measured response curve corresponds to the first bifurcation point of instability, which serves as a checkpoint for cell cycle transitions.
When dynamical instabilities are caused by the interaction between cyclin-CDK and CKI
The interaction between cyclin-CDK and CKI can generate dynamical instabilities (Qu et al., 2003b; Thron, 1999), and CKI also suppresses dynamics generated by the CDK phosphorylation and dephosphorylation (Qu et al., 2003b). Here we investigate whether the response curve still correlates with the dynamical instabilities in the presence of CKI (the detailed network model is shown in Fig. S4 in the Supplementary Material). Fig. 5 A shows the percentage cases that exhibited dynamical instabilities when the dynamics were mainly generated by the CDK phosphorylation and dephosphorylation. CKI suppressed the dynamical instabilities at a smaller negative slope of the response curve, but promoted instabilities at larger negative slopes. We also assessed the case that the dynamical instabilities are caused by positive feedback between cyclin-CDK and CKI. In this case, the positive feedbacks in the Cyclin & CDK module were removed and the kinase activities of CDC25 and wee1 were substituted by a constant. Fig. 5 B shows the percentage unstable case versus axmin, illustrating a similar distribution as when the dynamics were generated by the feedback loops in CDK phosphorylation and dephosphorylation. This explains why CKI promoted instabilities at a larger negative slope of the response curve in Fig. 5 A.
FIGURE 5.

Percentage of cases that exhibit dynamical instabilities versus axmin when the CKI module was coupled to the Cyclin & CDK module. (A) The dynamical instabilities were primarily due to the CDK phosphorylation and dephosphorylation. The shaded line is the replot of the case with negative feedback in Fig. 3 A. (B) The dynamical instabilities were due to the feedback between cyclin-CDK and CKI alone.
When dynamical instabilities are caused by the feedbacks between cyclin and APC-CDH1 or RB-E2F
In addition to the positive feedbacks in CDK activation and CKI regulation, other positive feedback loops can also cause dynamical instabilities: APC complexes with two proteins, CDC20 and CDH1. APC-CDC20 is activated by active cyclin-CDK phosphorylation and APC-CDH1 is inactivated by active cyclin-CDK phosphorylation (Morgan, 1999; Peters, 1998). Tyson and colleagues proposed that the feedback facilitated by APC-CDH1 causes bistability, and cell growth and negative feedback by APC-CDC20 results in hysteretic cycling in their yeast cell cycle models (Novak et al., 1998; Tyson and Novak, 2001). We and others (Hatzimanikatis et al., 1999; Qu et al., 2003b) have shown that the positive feedback between cyclin and RB-E2F can also generate bistable and limit cycle dynamics. However, the hysteresis observed in experiments (Pomerening et al., 2003; Sha et al., 2003) occurred under the artificial condition in which cyclin was nondegradable and the total cyclin was externally controlled. Since there was no cyclin synthesis or degradation, both APC-CDH1 (which promotes cyclin ubiquitination and degradation) and E2F (which promotes cyclin synthesis) cannot play any role in the response relation in these experiments. In other words, the hysteresis observed in those experiments could not have resulted from feedback loops facilitated by APC-CDH1 or RB-E2F. To gain more insights on how APC-CDH1 or RB-E2F may generate dynamical instabilities, we analyzed two simple models, similar to the model of Eq. 1.
To study how APC-CDH1 generates dynamical instabilities, we made the following assumptions: 1), CDC25 activity was constant as k5, instead of [k5 + f(x)] as in Eq. 1; 2), the activity of APC-CDH1 was a function (g(x)) of active cyclin-CDK (x) and decreased as x increased, since APC-CDH1 was inactivated after phosphorylation by active cyclin-CDK; and 3), APC-CDH1 facilitated ubiquitination of cyclin in both free and bounded forms. Then we obtained the following differential equations based on Eq. 1:
 |
(10) |
By linear stability analysis of the steady state, we found that g(x) must decrease steeply with x in order for bistability to occur, i.e.,
 |
(11) |
Bistability could occur when APC-CDH1 caused cyclin degradation in either free form or bounded form or both, as long as g(x) was a steep descending function of x. The nullcline for the total cyclin and x obtained from the differential equation for x is
 |
(12) |
If cyclin was nondegradable and total cyclin was controlled externally (k7 = k8 = k9 = ks,cyc =0), the response relation between total cyclin and active cyclin-CDK was
 |
(13) |
which increased linearly with x in a slope  In this case, the response relation a(x) differs substantially with nullcline A(x). Since the nonlinearity comes from the regulation of APD-CDH1, the response relation Eq. 13 has no relation with the dynamics generated by APC-CDH1. Instead of showing hysteresis in CDK activity versus total cyclin in their yeast cell cycle models, Tyson and colleagues (Novak et al., 1998; Tyson and Novak, 2001) showed hysteresis in CDK activity for one or a combination of system parameters. However, it is not clear how to design experiments to demonstrate such hysteretic responses. An indirect method proposed by Angeli et al. (2004) may be able to detect such bistabilities.
To analyze the effects of RB-E2F, we assumed that active cyclin-CDK phosphorylated RB in multiple steps to free E2F, so that the free E2F was a function (e(x)) of active cyclin-CDK (x). Cyclin synthesis was proportional to free E2F. Similar to the case of APC-CDH1, we have the following differential equations:
 |
(14) |
For bistability to occur, the slope of e(x) has to be steep, i.e.,
 |
(15) |
The nullcline for total cyclin and x is
 |
(16) |
The same response relation as produced by Eq. 13 will be measured. Again, since the nonlinearity comes from cyclin synthesis, the response curve has no relation to the dynamics caused by E2F.
A full model with all feedback loops present
The signal network for cell cycle control includes multiple feedback loops and signaling modules. To investigate the relation between the response curve of CDK activity to total cyclin and dynamical instabilities when these feedback loops and signaling modules were coupled together, we carried out simulation of the full model as shown in Fig. 2 A. We first show the percentage cases of instability versus the minimum slope of the inversed response curve detected in the models that has only one positive feedback loop facilitated either by APC-CDH1 (see Fig. S5 in the Supplementary Material) or by RB-E2F (see Fig. S6 in the Supplementary Material). When the dynamical instabilities were generated by the feedback between cyclin and APC-CDH1, 10% of the cases exhibited dynamical instabilities (Fig. 6 A) in the parameter range we chose. When the dynamical instabilities were generated by the feedback between cyclin and RB-E2F, 5% of the cases exhibited dynamical instabilities (Fig. 6 B) in the parameter range we chose. As we discussed above, the response curve is a linear function of active cyclin-CDK; the slope is always positive. Fig. 6 C shows the percentage cases exhibiting dynamical instabilities versus the minimum slope for the full model. When the response curve was bistable (axmin < 0), instabilities were detected in a very high percentage of cases. When the response curve was sigmoidal (axmin > 0), a significant percentage of cases showed instabilities. In fact, this percentage was roughly the summation of those shown in Fig. 6, A and B, indicating that APC-CDH1 and RB-E2F were generating the dynamical instabilities for positive slopes.
FIGURE 6.

Percentage of cases that exhibit dynamical instabilities versus axmin in various cases. (A) The dynamics was caused by feedback between cyclin and APC-CDH1 alone. (B) The dynamics was caused by feedback between cyclin and RB-E2F alone. (C) A full model as in Fig. 2 A with the parameters being set so that each feedback alone in the model can generate dynamical instabilities.
To further investigate how APC-CDH1 or RB-E2F affected the dynamics generated by CDK or CKI regulation, we chose the parameters so that neither module generated dynamical instabilities when acting alone. In this case, no dynamical instabilities were detected when the response curve was sigmoidal, similar to the cases without APC-CDH1 and RB-E2F present. Therefore, the response curve still correlates with the network dynamics as long as the APC-CDH1 or RB-E2F alone did not generate dynamical instabilities.
DISCUSSION
In this study, we investigated the relationship between dynamical instabilities and the response curve of CDK activity to total cyclin, under conditions in which cyclin is nondegradable, to address the questions posed in the Introduction. We found that when dynamical instabilities were primarily generated by CDK phosphorylation and dephosphorylation, or by feedback between cyclin-CDK and CKI, dynamical instabilities occurred in a high percentage of cases when the response curve showed hysteresis, but only in a small portion when the response curve was sigmoidal. Thus, according to our analysis in this study and earlier studies (Novak and Tyson, 1993), it is statistically very likely, although not definitive proof, that CDK phosphorylation and dephosphorylation are the cause for the bistable response seen in the Xenopus experiments.
Not surprisingly, however, if the dynamical instabilities were primarily generated by feedback between cyclin and APC-CDH1 or by feedback between cyclin and RB-E2F, the measured response curve of CDK activity versus total cyclin bore no relation to the dynamical instabilities generated by these feedbacks. In these cases, however, a bistable relation usually existed between CDK activity and a system parameter or a combination of parameters other than total cyclin, since dynamical instabilities were still produced much more commonly by hysteretic responses than by sigmoidal responses in the subcircuit responsible for generating the dynamics. In budding yeast, Chen et al. (2004, 2000) proposed that hysteresis driven by feedback between cyclin and APC-CDH1 caused cell cycle dynamics, and their prediction of bistability was confirmed by Cross et al. (2002). This may be a species-related difference, or because different phases of the cell cycle use different subcircuits to generate dynamics. The hysteresis in CDK activity in the experiments of Sha et al. (2003) and Pomerening et al. (2003) was observed at the G2-to-M transition, based on the model predictions of Novak and Tyson (1993, 1995). It is possible that hysteretic responses caused by APC-CDH1 or RB-E2F may be important at the G1-to-S transition (Chen et al., 2000; Novak and Tyson, 1997; Qu et al., 2003b). However, in higher eukaryotes, the regulation of binding of cyclins E and A to CDK2 at the G1-to-S transition is very similar to the regulation of binding of cyclin B to CDK1 at the G2-to-M transition (Ciliberto et al., 2003; Morgan, 1995, 1997; Novak and Tyson, 2004; Qu et al., 2003a,b). Experiments at the G1-to-S transition, analogous to those performed at the G2-to-M transition (Pomerening et al., 2003; Sha et al., 2003), will be critical to resolve whether the cell uses the same biological mechanism at both transitions. We predict that if CDK2 activity exhibits a hysteretic response to total cyclins E or A at the G1-to-S transition, then CDK2 phosphorylation and dephosphorylation, or feedback between cyclin-CDK2 and CKI, are likely to be the primary cause of G1-to-S dynamics. Otherwise, RB-E2F or APC-CDH1 subcircuits may be the primary cause.
Perhaps the most important finding in this study is that, in general, a hysteretic response is a much more robust mechanism for generating oscillatory cell cycle dynamics than a sigmoidal (or ultrasensitive) response. That is, if a subcircuit exhibits a hysteretic response, the probability that a negative feedback loop can convert bistability to limit cycle dynamics is much higher than if the subcircuit exhibits a sigmoidal response. Thus, when dynamics are based on a hysteretic response, a cell has a better chance of carrying out its biological functions without making errors in the face of much larger random parameter fluctuations. This may be the reason why hysteretic responses exist widely in many biological signal transduction systems (Gardner et al., 2000; Huang and Ferrell, 1996; Ozbudak et al., 2004; Xiong and Ferrell, 2003). Multiple subcircuits exhibiting the same dynamics may be an additional mechanism by which complex signaling networks create redundancy to ensure robustness (Kitano, 2002). As an experimental strategy, identifying and characterizing hysteretic relationships in subcircuits of complex signaling networks (Kohn, 1999) is a promising approach, as these relationships are likely to play key roles in network dynamics.
SUPPLEMENTARY MATERIAL
An online supplement to this article can be found by visiting BJ Online at http://www.biophysj.org.
Supplementary Material
Acknowledgments
This work was supported by funds from the University of California, Los Angeles, Department of Medicine and by the Kawata and Laubisch Endowments.
References
- Aguda, B. D. 1999. Instabilities in phosphorylation-dephosphorylation cascades and cell cycle checkpoints. Oncogene. 18:2846–2851. [DOI] [PubMed] [Google Scholar]
- Angeli, D., J. E. Ferrell Jr., and E. D. Sontag. 2004. Detection of multistability, bifurcations, and hysteresis in a large class of biological positive-feedback systems. Proc. Natl. Acad. Sci. USA. 101:1822–1827. [DOI] [PMC free article] [PubMed] [Google Scholar]
- Chen, K. C., L. Calzone, A. Csikasz-Nagy, F. R. Cross, B. Novak, and J. J. Tyson. 2004. Integrative analysis of cell cycle control in budding yeast. Mol. Biol. Cell. 15:3841–3862. [DOI] [PMC free article] [PubMed] [Google Scholar]
- Chen, K. C., A. Csikasz-Nagy, B. Gyorffy, J. Val, B. Novak, and J. J. Tyson. 2000. Kinetic analysis of a molecular model of the budding yeast cell cycle. Mol. Biol. Cell. 11:369–391. [DOI] [PMC free article] [PubMed] [Google Scholar]
- Ciliberto, A., M. J. Petrus, J. J. Tyson, and J. C. Sible. 2003. A kinetic model of the cyclin E/Cdk2 developmental timer in Xenopus laevis embryos. Biophys. Chem. 104:573–589. [DOI] [PubMed] [Google Scholar]
- Cross, F. R., V. Archambault, M. Miller, and M. Klovstad. 2002. Testing a mathematical model of the yeast cell cycle. Mol. Biol. Cell. 13:52–70. [DOI] [PMC free article] [PubMed] [Google Scholar]
- Dyson, N. 1998. The regulation of E2F by pRB-family proteins. Genes Dev. 12:2245–2262. [DOI] [PubMed] [Google Scholar]
- Gardner, T. S., C. R. Cantor, and J. J. Collins. 2000. Construction of a genetic toggle switch in Escherichia coli. Nature. 403:339–342. [DOI] [PubMed] [Google Scholar]
- Goldbeter, A. 1991. A minimal cascade model for the mitotic oscillator involving cyclin and cdc2 kinase. Proc. Natl. Acad. Sci. USA. 88:9107–9111. [DOI] [PMC free article] [PubMed] [Google Scholar]
- Hatzimanikatis, V., K. H. Lee, and J. E. Bailey. 1999. A mathematical description of regulation of the G1-S transition of the mammalian cell cycle. Biotechnol. Bioeng. 65:631–637. [DOI] [PubMed] [Google Scholar]
- Huang, C. Y. F., and J. E. Ferrell. 1996. Ultrasensitivity in the mitogen-activated protein kinase cascade. Proc. Natl. Acad. Sci. USA. 93:10078–10083. [DOI] [PMC free article] [PubMed] [Google Scholar]
- Kitano, H. 2002. Computational systems biology. Nature. 420:206–210. [DOI] [PubMed] [Google Scholar]
- Kohn, K. W. 1999. Molecular interaction map of the mammalian cell cycle control and DNA repair systems. Mol. Biol. Cell. 10:2703–2734. [DOI] [PMC free article] [PubMed] [Google Scholar]
- Morgan, D. O. 1995. Principles of CDK regulation. Nature. 374:131–134. [DOI] [PubMed] [Google Scholar]
- Morgan, D. O. 1997. Cyclin-dependent kinases: engines, clocks, and microprocessors. Annu. Rev. Cell Dev. Biol. 13:261–291. [DOI] [PubMed] [Google Scholar]
- Morgan, D. O. 1999. Regulation of the APC and the exit from mitosis. Nat. Cell Biol. 1:E47–E53. [DOI] [PubMed] [Google Scholar]
- Nasmyth, K. 1996. At the heart of the budding yeast cell cycle. Trends Genet. 12:405–412. [DOI] [PubMed] [Google Scholar]
- Novak, B., A. Csikasz-Nagy, B. Gyorffy, K. Nasmyth, and J. J. Tyson. 1998. Model scenarios for evolution of the eukaryotic cell cycle. Philos. Trans. R. Soc. Lond. B Biol. Sci. 353:2063–2076. [DOI] [PMC free article] [PubMed] [Google Scholar]
- Novak, B., and J. J. Tyson. 1993. Numerical analysis of a comprehensive model of M-phase control in Xenopus oocyte extracts and intact embryos. J. Cell Sci. 106:1153–1168. [DOI] [PubMed] [Google Scholar]
- Novak, B., and J. J. Tyson. 1995. Quantitative analysis of a molecular model of mitotic control in fission yeast. J. Theor. Biol. 173:283–305. [Google Scholar]
- Novak, B., and J. J. Tyson. 1997. Modeling the control of DNA replication in fission yeast. Proc. Natl. Acad. Sci. USA. 94:9147–9152. [DOI] [PMC free article] [PubMed] [Google Scholar]
- Novak, B., and J. J. Tyson. 2004. A model for restriction point control of the mammalian cell cycle. J. Theor. Biol. 230:563–579. [DOI] [PubMed] [Google Scholar]
- Ozbudak, E. M., M. Thattai, H. N. Lim, B. I. Shraiman, and A. Van Oudenaarden. 2004. Multistability in the lactose utilization network of Escherichia coli. Nature. 427:737–740. [DOI] [PubMed] [Google Scholar]
- Peters, J. M. 1998. SCF and APC: the Yin and Yang of cell cycle regulated proteolysis. Curr. Opin. Cell Biol. 10:759–768. [DOI] [PubMed] [Google Scholar]
- Pomerening, J. R., E. D. Sontag, and J. E. Ferrell Jr. 2003. Building a cell cycle oscillator: hysteresis and bistability in the activation of Cdc2. Nat. Cell Biol. 5:346–351. [DOI] [PubMed] [Google Scholar]
- Qu, Z., W. R. MacLellan, and J. N. Weiss. 2003a. Dynamics of the cell cycle: checkpoints, sizers, and timers. Biophys. J. 85:3600–3611. [DOI] [PMC free article] [PubMed] [Google Scholar]
- Qu, Z., J. N. Weiss, and W. R. MacLellan. 2003b. Regulation of the mammalian cell cycle: a model of the G1-to-S transition. Am. J. Physiol. Cell Physiol. 284:C349–C364. [DOI] [PubMed] [Google Scholar]
- Sha, W., J. Moore, K. Chen, A. D. Lassaletta, C. S. Yi, J. J. Tyson, and J. C. Sible. 2003. Hysteresis drives cell-cycle transitions in Xenopus laevis egg extracts. Proc. Natl. Acad. Sci. USA. 100:975–980. [DOI] [PMC free article] [PubMed] [Google Scholar]
- Sherr, C. J. 1996. Cancer cell cycles. Science. 274:1672–1677. [DOI] [PubMed] [Google Scholar]
- Solomon, M. J., M. Glotzer, T. H. Lee, M. Philippe, and M. W. Kirschner. 1990. Cyclin activation of p34cdc2. Cell. 63:1013–1024. [DOI] [PubMed] [Google Scholar]
- Solomon, M. J., and P. Kaldis. 1998. Regulation of CDKs by phosphorylation. In Cell Cycle Control. M. Pagano, editor. Springer, Berlin. 79–109. [DOI] [PubMed]
- Strogatz, S. H. 1994. Nonlinear Dynamics and Chaos: With Applications to Physics, Biology, Chemistry, and Engineering. Addison-Wesley, Reading, MA.
- Thron, C. D. 1999. Mathematical analysis of binary activation of a cell cycle kinase which down-regulates its own inhibitor. Biophys. Chem. 79:95–106. [DOI] [PubMed] [Google Scholar]
- Tyson, J. J. 1991. Modeling the cell division cycle: cdc2 and cyclin interactions. Proc. Natl. Acad. Sci. USA. 88:7328–7332. [DOI] [PMC free article] [PubMed] [Google Scholar]
- Tyson, J. J., K. Chen, and B. Novak. 2001. Network dynamics and cell physiology. Nat. Rev. Mol. Cell Biol. 2:908–916. [DOI] [PubMed] [Google Scholar]
- Tyson, J. J., A. Csikasz-Nagy, and B. Novak. 2002. The dynamics of cell cycle regulation. Bioessays. 24:1095–1109. [DOI] [PubMed] [Google Scholar]
- Tyson, J. J., and B. Novak. 2001. Regulation of the eukaryotic cell cycle: molecular antagonism, hysteresis, and irreversible transitions. J. Theor. Biol. 210:249–263. [DOI] [PubMed] [Google Scholar]
- Xiong, W., and J. E. Ferrell Jr. 2003. A positive-feedback-based bistable ‘memory module’ that governs a cell fate decision. Nature. 426:460–465. [DOI] [PubMed] [Google Scholar]
- Yang, L., W. R. MacLellan, Z. Han, J. N. Weiss, and Z. Qu. 2004. Multi-site phosphorylation and network dynamics of cyclin-dependent kinase signaling in the eukaryotic cell cycle. Biophys. J. 86:3432–3443. [DOI] [PMC free article] [PubMed] [Google Scholar]
Associated Data
This section collects any data citations, data availability statements, or supplementary materials included in this article.