

Abstract
The heat-shock response in humans and other eukaryotes is a highly conserved genetic network that coordinates the cellular response to protein damage and is essential for adaptation and survival of the stressed cell. It involves an immediate and transient activation of heat-shock transcription factor-1 (HSF1) which results in the elevated expression of genes encoding proteins important for protein homeostasis including molecular chaperones and components of the protein degradative machinery. We have developed a mathematical model of the critical steps in the regulation of HSF1 activity to understand how chronic exposure to a stress signal is converted into specific molecular events for activation and feedback regulated attenuation of HSF1. The model is utilized to identify the most sensitive steps in HSF1 activation and to evaluate how these steps affect the expression of molecular chaperones. This analysis allows the formulation of hypotheses about the differences between the heat-shock responses in yeast and humans and generates a model with predictive abilities relevant to diseases associated with the accumulation of damaged and aggregated proteins including cancer and neurodegenerative diseases.
INTRODUCTION
The heat-shock response is a ubiquitous molecular response to proteotoxicity resulting from the appearance of non-native and damaged proteins (Morimoto, 1993). The accumulation of misfolded species can result in the generation of protein aggregates, which are associated with neurodegenerative diseases including Alzheimer's, Parkinson's, Amyotrophic Lateral Sclerosis, and Huntington's disease (Bates, 2003; Masters et al., 1985; Scherzinger et al., 1997). To ameliorate the effects of protein misfolding, cells have evolved a highly conserved stress response mechanism that is capable of exerting protein quality control on misfolded intracellular proteins. The central elements of this process are the heat-shock proteins (HSPs) that function as molecular chaperones. Upon sensing a stress signal, such as elevated temperatures, small toxic molecules, oxidants, or heavy metals, cells transiently overexpress chaperones to high levels to meet the stress demand (Lindquist, 1992; Morimoto, 1998; Parsell and Lindquist, 1993). Chaperones recognize and associate with exposed hydrophobic patches on unfolded polypeptides and conformational intermediates and sequester them until they reach their native confirmation by providing an environment for proper refolding, or act as an escort to the proteosomes for orderly degradation (Bukau and Horwich, 1998; Cyr et al., 2002; Wickner et al., 1999).
Heat-shock transcription factor-1 (HSF1) regulates the expression of the major HSPs (Kingston et al., 1987; Morimoto et al., 1992). HSF1 is constitutively expressed in human cells in an inert monomeric state, which homotrimerizes immediately upon exposure to stress conditions to achieve a DNA-binding competent state (Baler et al., 1993; Mosser et al., 1988; Pirkkala et al., 2001; Wu, 1995), and binds to a promoter site known as the heat-shock element (HSE) (Holmgren et al., 1981; Pelham, 1982). HSF1 binding to DNA, however, is insufficient to induce transcription and complete transcriptional activity requires hyperphosphorylation of HSF1 (Holmberg et al., 2002). Consistent with the importance of the heat-shock response in diverse biological processes, HSF1 is a target for a number of stress-induced signal transduction cascades for both negative and positive regulation (Holmberg et al., 2001, 2002). Once the synthesis of HSPs is induced, they are capable of autorepressing their expression through interactions with HSF1 (Abravaya et al., 1991b; Shi et al., 1998). The exact mechanism of transcriptional repression of heat-shock genes remains unclear, as is the mechanism by which transcriptionally active HSF1 is dephosphorylated and converted to its inert state.
Regulation of gene expression through phosphorylation of a transcription factor is not unique to the heat-shock response of eukaryotes and represents a feature common to many genetic pathways. Phosphorylation offers a versatile method for repression (or activation) of nuclear translocation, for acquisition or loss of DNA binding, and transactivation of transcription factors (Hunter and Karin, 1992; Jackson, 1992). A mechanistic understanding of the dynamics of HSF1 activation and repression, therefore, could provide insights into effective regulation of similar transcription factors that rely on phosphorylation to modulate transactivation.
To gain a better understanding of the dynamics of HSP expression through HSF1 regulation under stress, we developed a mathematical model of the nuclear events of the eukaryotic heat-shock response, based on the conceptual molecular models that have been developed through extensive molecular studies carried out principally in HeLa cells and other mammalian tissue culture cells (Abravaya et al., 1991a,b; Kline and Morimoto, 1997; Shi et al., 1998). Despite the importance of this system, it has been the subject of a relatively small number of mathematical modeling studies. Peper et al. (1998) considered the eukaryotic heat-shock response in the context of misfolded proteins without considering the regulation of transcription in detail. Mathematical modeling studies of the transcriptional regulation of stress response have considered only prokaryotic systems (El-Samad et al., 2002; Kurata et al., 2001; Srivastava et al., 2001). The mathematical model introduced here fills this gap and focuses on the critical molecular events associated with the activation, and repression of heat-shock gene transcription to identify the steps where significant regulatory control resides.
MATERIALS AND METHODS
Model formulation
The mathematical model considers the nuclear events during the heat-shock response (Fig. 1). Heat-shock is simulated through a stimulus signal that switches the stress kinase from its inactive (S) to its active state (S*). Thus, temperature, or stress in general, is proportional to the relative catalytic activity of the kinase that activates the stress kinase, S, over the catalytic activity of the phosphatase that inactivates its active form, S*. Consistent with experimental observations, HSF1 is assumed to translocate to the nucleus and trimerize immediately upon reception of a stress signal, thus these steps are not explicitly accounted for in the model as they are assumed to occur on a timescale far faster than the transcriptional response (Baler et al., 1993). Once bound to the HSE the transcription of hsp70 mRNA requires the binding and phosphorylation of HSF1 (Cotto et al., 1996; Holmberg et al., 2001). In this model, it was assumed that S* binds to the inactive, but DNA bound HSF1 and phosphorylates the transcription factor to its active state (P:HSF:HSE). The phosphorylation of HSF1 results in elevated transcription of hsp mRNAs and subsequent translation of HSPs. The HSP species in the model represents any inducible molecular chaperone (principally Hsp70 and Hsp90) whose expression is regulated by the phosphorylated HSF complex, and is capable of participating in protein refolding and/or regulation of its own expression. This regulation is accomplished through three molecular events. HSPs can bind to the active transcription complex, which converts HSF to a transcriptionally inert state that is subject to dephosphorylation (Shi et al., 1998). HSPs can also sequester free HSF, preventing HSF from binding to the HSEs and initiating transcriptional activation (Zou et al., 1998). A third mode of regulatory action is HSP-independent and involves an increase in the stability of the mRNA transcript due to stress (Theodorakis and Morimoto, 1987). The order of events during the regulation or attenuation of the heat-shock response is less well-characterized experimentally than the activation steps. In the model, the phosphorylated form of HSF does not dissociate from the DNA, until dephosphorylated by the phosphatase. This assumption is in accordance with experimentally observed timescales of changes in the phosphorylated state of HSF1 versus DNA bound state, and conceptual models developed from collections of experiments on the regulation of HSF1 (Kline and Morimoto, 1997; Morimoto, 1998).
FIGURE 1.

Minimal model of HSP expression and regulation. X:Y denotes X bound to Y. Solid lines indicate mass flow or chemical reactions, and dashed lines indicate regulatory interactions. The circled numbers correlate each step in the molecular mechanism with its description below and the associated kinetic and thermodynamic parameters in Tables 2, 4, and 5. Heat-shock, or temperature (T), enters the model through switching the stress-dependent kinase (S) from its inactive to active form (S*) (1). The stress kinase is inactivated by dephosphorylation back to its inactive form (2). The transcription factor (HSF) binds to the promoter site (HSE) (3), where it is bound by the active stress kinase (4) and is phosphorylated to its active form (P:HSF:HSE) (5), that induces transcription (6) and translation (7). HSP binds to the active form, repressing transcription (8). The inactive form is subject to binding (9) dephosphorylation (10) by the inactivating phosphatase (I). HSP also binds HSF on the HSE, before it is phosphorylated (11), or off the DNA HSP binds and sequesters HSF in solution (HSF:HSP) (12, 13). The mRNA is assumed to be stabilized by S* (14), but mRNA and HSP still turn over via first-order decay (15, 16).
Dimensionless species and parameter estimation
The model of Fig. 1 involves 14 species, with four conserved quantities:
 |
(1) |
 |
(2) |
 |
(3) |
 |
(4) |
The concentrations of species in Fig. 1 were converted into dimensionless quantities using the appropriate reference species (Table 1).
TABLE 1.
Species and their dimensionless scalings
| Species | Comments | Dimensionless scaling |
|---|---|---|
| HSF | Free HSF1. |  |
| HSE | Free promoter site on the DNA. |  |
| HSF:HSE | HSF1 bound to the promoter site; inactive. |  |
| S*:HSF:HSE | Active stress kinase, S*, bound to HSF on the promoter site. |  |
| P:HSF:HSE | Phosphorylated HSF1 on the promoter site; active transcription complex. |  |
| HSP:P:HSF:HSE | Heat-shock protein bound to phosphorylated HSF1 on the promoter site. |  |
| I:HSP:P:HSF:HSE | Phosphatase, I, bound to the HSP, phosphorylated HSF1 complex, on the promoter site. |  |
| HSP:HSF:HSE | HSP bound to unphosphorylated HSF1 on the promoter site. |  |
| HSP:HSF | HSP bound to HSF off the DNA. |  |
| mRNA | Chaperone mRNA. |  |
| HSP | Free heat-shock protein unbound to any other species. |  |
| S* | Free, active stress kinase, unbound to any other species. |  |
| I | Free stress phosphatase, unbound to any other species. |  |
| S | Free, inactive stress kinase, unbound to any other species. | Determined algebraically from conservation of [Stot]. |
| P | Free phosphate. | Assumed in excess, not treated as a variable. |
Simulation of the model required the quantification of 25 kinetic and thermodynamic parameters (Table 2), and the total concentration of four conserved species: HSFtot, HSEtot, Stot, and Itot. After scaling, these 29 inputs were reduced to 27 dimensionless parameters. The 27 dimensionless parameters include seven reversible rate constants, five irreversible rate constants, seven equilibrium constants, three characteristic ratios, four parameters associated with activation of the stress kinase, and one coupling constant for the stress stabilization (Table 3). Experimental observations led us to the formulation of the following assumptions:
Assumption 1. Reversible reactions operate near-equilibrium. This implies that the slowest reversible step should be at least 10 times faster than the fastest irreversible reaction (Reich, 1974).
Assumption 2. HSF1 has a very low binding affinity to the hsp70 promoter under nonstressed conditions (Abravaya et al., 1991a)
Assumption 3. The hsp70 mRNA is very stable, i.e., its half-life is longer than the characteristic timescale of most of the reactions (Theodorakis and Morimoto, 1987).
Assumption 4. The HSPs are highly stable proteins, i.e., their half-life is longer than characteristic timescale of the rest of the reactions, including hsp70 mRNA half-life.
Assumption 5. HSF1 is present in excess compared to the HSEs ([HSFtot] ≫ [HSEtot]) (Sarge et al., 1993).
Assumption 6. The total stress kinase, Stot, is present in concentrations similar to other signaling molecules, such as MAPKs (Ferrell, 1996).
Assumption 7. The rates of transcription and translation are comparable and therefore their first-order rate constants are assumed equal to each other.
Assumption 8. The phosphatase is assumed present in a concentration equivalent to the concentration of HSEtot.
Assumption 9. The kinase cascade should behave as an ultrasensitive module (Goldbeter and Koshland, 1981) with a Hill coefficient roughly equivalent to experimental observations on MAPK cascades (∼5) (Ferrell, 1996, 1997; Huang and Ferrell, 1996).
Based on the above assumptions, 18 of the 27 parameters were estimated. Two of the remaining parameters are involved in activation of the heat-shock response (see Simulating Heat-Shock and Varying Temperatures, below). Therefore, seven parameters needed to be estimated based on the system response characteristics, and sensitivity analysis coupled with experimental observations. The following constraints were placed on the performance of the model:
Constraint 1. At the peak of the heat-shock response, the majority of HSEs are occupied by phosphorylated HSF.
Constraint 2. Attenuation of total bound species occurs at long times.
Constraint 3. Attenuation of phosphorylated species occurs at long times.
Constraint 4. Attenuation of the transcription rate occurs at long times.
Constraint 5. Significant HSP production near time of attenuation.
Constraint 6. Time from induction to peak is ∼1/8th–1/10th the time from peak to attenuation (asymmetric response).
TABLE 2.
Dimensional model parameters
| Parameter | Comments | |
|---|---|---|
| Vm,k | Maximal velocity of S to S* conversion. | (1) |
| Km,k | Michaelis-Menten constant of S to S* conversion. | (1) |
| Vm,p | Maximal velocity of S* to S conversion. | (2) |
| Km,p | Michaelis-Menten constant of S* to S conversion. | (2) |
| k1,d | Disassociation rate constant of HSF:HSE → HSF + HSE. | (3) |
 |
Equilibrium constant: 
|
(3) |
| k2,d | Disassociation rate constant of S*:HSF:HSE → S* + HSF:HSE. | (4) |
 |
Equilibrium constant: 
|
(4) |
| kS | Rate constant of phosphorylation of HSF:HSE. | (5) |
| ktr | Rate constant of mRNA synthesis rate. | (6) |
| kta | Rate constant of protein synthesis rate. | (7) |
| k3,d | Disassociation rate constant of HSP:P:HSF:HSE → HSP + P:HSF:HSE. | (8) |
 |
Equilibrium constant: 
|
(8) |
| k4,d | Disassociation rate constant of I:HSP:P:HSF:HSE → I + HSP:P:HSF:HSE. | (9) |
 |
Equilibrium constant: 
|
(9) |
| kI | Rate constant of HSP:P:HSF:HSE dephosphorylation. | (10) |
| k5,d | Disassociation rate constant of HSP:HSF:HSE → HSP + HSF:HSE. | (11) |
 |
Equilibrium constant: 
|
(11) |
| k6,d | Disassociation rate constant of HSP:HSF:HSE → HSE + HSP:HSF. | (12) |
 |
Equilibrium constant: 
|
(12) |
| k7,d | Disassociation rate constant of HSP:HSF → HSP + HSF. | (13) |
 |
Equilibrium constant: 
|
(13) |
| CS | Inhibition or coupling constant for S* to mRNA degradation. | (14) |
| kd,m | Rate constant of mRNA degradation rate. | (15) |
| kd,p | Rate constant of HSP degradation rate. | (16) |
Numbers in (parentheses) correspond to the associated mechanistic step in Fig. 1.
TABLE 3.
Dimensionless parameters and numerical values
| Parameter | Scaling | Assumptions (A) or constraints (C) | Numerical value |
|---|---|---|---|
| βm,k |  |
Activation mechanism | Varies* |
| Γm,k |  |
A9 | 5 × 10⁻² |
| βm,p |  |
Deactivation mechanism | 1 × 10³ |
| Γm,p |  |
A9 | 5 × 10⁻² |
| κ1 | k1,d/kd,m | A1 | 9.8 × 10⁵ |
| κ2 | k2,d/kd,m | A1 | 3 × 10³ |
| κS | kS/kd,m | A3, A7, C6 | 3 × 10² |
| κtr | ktr/kd,m | A3, A7, C5 | 1.2 × 101 |
| κta | kta/kd,m | A3, C5 | 1.2 × 101 |
| κ3 | k3,d/kd,m | A1 | 5.9 × 10⁵ |
| κ4 | k4,d/kd,m | A1 | 3 × 10³ |
| κI | kI/kd,m | A3, C6 | 6 × 101 |
| κ5 | k5,d/kd,m | A1 | 3 × 10⁶ |
| κ6 | k6,d/kd,m | A1 | 5.9 × 10⁶ |
| κ7 | k7,d/kd,m | A1 | 4 × 10⁴ |
| Γ1 |
 [HSFtot] [HSFtot] |
A2 | 3 × 10⁻³ |
| Γ2 |
 [Stot] [Stot] |
C2 | 5 × 101 |
| Γ3 |
 ·[HSEtot] ·[HSEtot] |
C3 | 5 × 10⁻³ |
| Γ4 |
 ·[Itot] ·[Itot] |
C3 | 5 × 100 |
| Γ5 |
 ·[HSEtot] ·[HSEtot] |
C6 | 1 × 10⁻³ |
| Γ6 |
 ·[HSFtot] ·[HSFtot] |
C2 | 5 × 10⁻⁴ |
| Γ7 |
 [HSEtot] [HSEtot] |
C6 | 7.5 × 10⁻² |
| Γs |  |
C3 | 2 × 10⁻¹ |
| κd,p | kd,p/kd,m | A4 | 3 × 10⁻³ |
| ρE |  |
A5 | 1 × 10² |
| ρS |  |
A6 | 1 × 10⁴ |
| ρI |  |
A8 | 1 × 100 |
| τ | kd,mt | Dimensionless time | — |
Value for βm,k is stress (temperature)-dependent. See Simulating Heat-Shock and Varying Temperatures.
Time was initially scaled by the degradation constant of unstressed mRNA and it was rescaled to dimensional (minutes) using the experimentally determined unstressed half-life of hsp70 mRNA of 54 min (Theodorakis and Morimoto, 1987), which corresponds to a degradation rate constant, kd,m, of 1.3 × 10⁻² min−1.
The mathematical model was formulated using primarily mass action kinetics for every step in the model. Mass action kinetics are extensively utilized in modeling biological systems (Asthagiri and Lauffenburger, 2001) and they make no assumption about the timescales of the various reactions and complex formations and the relative concentration of the species in the network. Such a priori assumptions could lead to nonlinear kinetics that might lose important system dynamics (Palsson, 1987; Segel and Slemrod, 1989). However, the regulation of the stress kinase and stress-stabilization of the mRNA were modeled using Michaelis-Menten kinetics, following the modeling framework introduced by Goldbeter and Koshland (1981), which can satisfactorily describe signal transduction pathways in the presence of uncertainty about the exact mechanism of action; it is described next.
Simulating heat-shock and varying temperatures
The model contains a basic kinase module akin to an ultrasensitive cascade found in MAPK cascades (Goldbeter and Koshland, 1981; Huang and Ferrell, 1996). This module, if isolated from the full system, is modeled using hyperbolic kinetics as
 |
(5) |
where [S*] is the concentration of active kinase, [Stot] is the total concentration of the kinase (inactive and active forms), Vm,k and Vm,p are the maximal rates of phosphorylation and dephosphorylation of S*, and Km,k and Km,p are the binding affinities of the enzymatic step (Table 2). The ratio of  was previously shown to control a sigmoidal switching between inactive to active states of the kinase (Goldbeter and Koshland, 1981). Thus, the value
  determines the level of activation and it was used to quantify the level of stress the system is experiencing. Values of
  used to simulate temperatures of 37°C, 41°C, 42°C, and 43°C were chosen based solely on the activation responses of the kinase module. 37°C is represented by a stress value to the left of the sharp S to S* transition; similarly, 43°C lies to the right of the transition (full activation), and 41°C, 42°C represent intermediate values of activation. The numerical values for
  at these temperatures were 6 × 10⁻⁶, 1 × 10⁻¹, 8.2 × 10⁻¹, and 1.0 × 101, respectively.
Stress-stabilization of hsp70 mRNA
The model contains a control loop from the stabilization of hsp mRNA by the level of stress on the system. Absent mechanistic knowledge of the stress-stabilization mechanism, the stabilization is modeled using inhibition kinetics,
 |
(6) |
where Vd,m is the flux to mRNA degradation, CS is a coupling constant between the stress stabilization and degradation flux (Table 2), [S*] is the concentration of active stress kinase, and [mRNA] is the concentration of hsp mRNA.
Model equations
Equations 7–19 are the dimensionless model equations:
 |
(7) |
 |
(8) |
 |
(9) |
 |
(10) |
 |
(11) |
 |
(12) |
 |
(13) |
 |
(14) |
 |
(15) |
 |
(16) |
 |
(17) |
 |
(18) |
 |
(19) |
We calculated the three key experimental observables of the heat-shock response according to Eqs. 20–22:
 |
(20) |
 |
(21) |
 |
(22) |
Sensitivity analysis
We calculated dynamic sensitivity coefficients according to the methodology of Turanyi (1990) and Varma et al. (1999),
 |
(23) |
where Sj is a vector of sensitivity coefficients for each variable with respect to a single parameter in the system  J is the Jacobian matrix
  and ξj is
  Thus, if nx is the number of species and np is the number of parameters in our system, we needed to integrate nx × np equations simultaneously with the nx equations of the model.
After integration, we scaled each sensitivity coefficient by the value of the species at the same time as the sensitivity coefficient and the appropriate parameter value:
 |
(24) |
RESULTS
Dynamics of the heat-shock response in HeLa cells
Experimental observations have shown that shifting HeLa cells from 37°C to 42°C, and maintaining them at the elevated temperature, induces a rapid and transient increase of HSF binding to the HSE, hyperphosphorylation of HSF, and elevated transcription rate of the hsp70 gene. This induction is followed by an attenuation phase during which the HSF:HSE complex returns to its basal activity level, even during continued heat-shock exposure (Kline and Morimoto, 1997) (Fig. 2 A). Studies in HeLa cells represents the bulk of mechanistic studies on the transcription of heat-shock genes and given the high degree of conservation of the eukaryotic heat-shock response, we would expect that these studies offer a reasonable guide to the regulation of the human heat-shock response.
FIGURE 2.
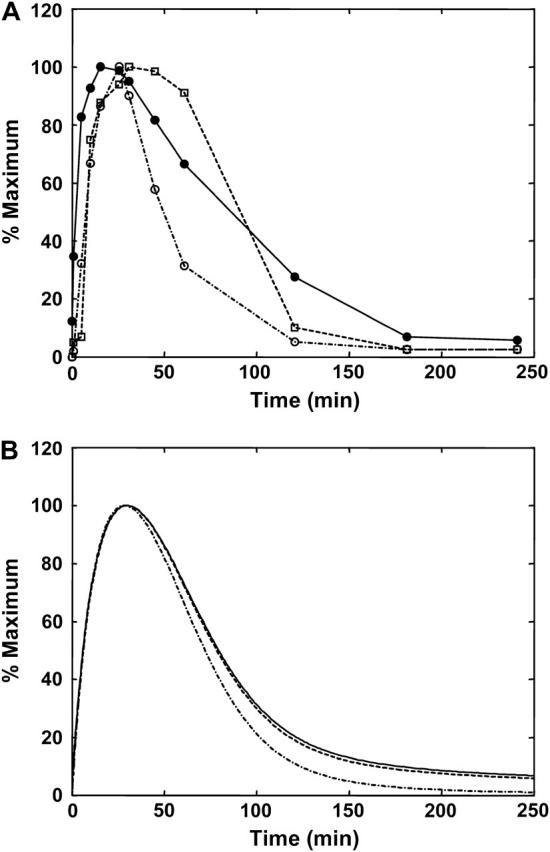
Dynamics of the human heat-shock response experimental results and model simulation. (A) Experimental study by Kline and Morimoto (1997) of heat-shock of HeLa cells at 42°C for 250 min. The phosphorylation of the HSF (dashed line), binding of HSF to the DNA (solid line), and transcription rate of hsp70 mRNA (dash-dotted line) are all observed to rapidly activate between t = 0–35 min, then attenuate back to their basal level over the next ∼200 min. See reference for original materials and methods. (B) Model simulation of the Kline and Morimoto (1997) results. Plotted are the same three variables as for the experiments in A: phosphorylation, total binding of HSF to the HSE, and transcription rate of hsp70 mRNA. All variables in A and B were rescaled as a percentage of their maximum value (peak).
These key experimental observations were used to estimate the values of the unknown parameters. These parameter values were initially set equal to one to avoid introducing any bias, and the mathematical model displayed the induction response, but failed to capture the observed attenuation. We then used sensitivity analysis (Turanyi, 1990) to identify the direction needed to vary these parameters, i.e., > or <1, so that the observable variables would attenuate at longer timescales without failing to capture the initial induction of the heat-shock response. This approach avoids a strict parameter fitting and aims at capturing the observed trends and characteristic timescales of the system. Additionally, this methodology avoids overfitting the model to experimental data since only the minimum numbers of parameters necessary to meet the constraints and capture experimental data are subject to change following the guidance from sensitivity analysis.
Simulation of the mathematical model captured the characteristic attenuating response of the heat-shock network, as well as the key kinetic parameters such as the relative time from stress induction to peak of the response and from peak to attenuation (Fig. 2 B). We estimated the values of the dimensional kinetic parameters based on comparison of the characteristic timescale between the experimental and the simulation results. The agreement between the experimental and the simulated results provided confidence that the model in Fig. 1 is consistent with the experimental data and is capable of capturing the important dynamic and regulatory features of the heat-shock response.
Model prediction of transient dynamics experiments
Abravaya et al. (1991a) studied the dynamics of the heat-shock response in HeLa cells by elevating the temperature from 37°C to 42°C followed by a return to 37°C when the cells reached the point of maximal heat-shock gene transcription. We simulated these experiments, without any adjustment in the values of kinetic or thermodynamic parameters, by shifting the stress signal back to its basal level at the peak of the response. The simulated results (Fig. 3 A) predicted that after removal of the stress signal, transcription rate attenuates more rapidly (after ∼100 min) versus the 250 min under constant heat-shock. These simulated results are in excellent agreement with the experimentally observed response (Fig. 3 B). Similar results were observed for the phosphorylation of HSF, which are also in agreement with the original experimental observations (data not shown). Thus, the model captures the dynamic responses and the characteristic timescale of the experimental attenuation.
FIGURE 3.

Model prediction and experimental validation for stress and recovery at different temperatures. (A) Model simulation of the dynamics of the transcription rate of hsp70 mRNA if the cells were heat-shocked at 42°C for 250 min (solid lines) or shifted back to 37°C at the peak of the heat-shock response (dashed lines). (B) Experimental validation of A, from Abravaya et al. (1991a). Lines are the same as in A. See original reference for materials and methods. All variables in A and B were rescaled as a percentage of their maximum value (peak). (C) Model simulation of the dynamics of phosphorylated HSF (scaled by total HSE concentration) at three different heat-shock temperatures, 37°C to 41°C (dashed line), 42°C (dash-dot line), or 43°C (solid line), and maintained there for 300 min. (D) Experimental results for heat-shock of HeLa cells at varying temperatures from Abravaya et al. (1991a). See original reference for materials and methods.
We further investigated the effects of stress (temperature) levels on the response of the heat-shock network. We simulated the network response to three different temperature stresses corresponding to 41°C, 42°C, and 43°C. Experimental results (Fig. 3 C) had indicated previously that the heat-shock response is not activated at 41°C, induced transiently at 42°C, and activated but not attenuated at 43°C (Abravaya et al., 1991a). The results of the simulated responses (Fig. 3 D) agreed qualitatively with experimental observations, obtained by Abravaya et al. and showed that increasing the heat-shock temperature resulted in a shorter initial response time, a higher maximal concentration of phosphorylated HSF, and a slower attenuation phase. At 43°C, the model prediction of the attenuation phase of the heat-shock response is not in perfect agreement with the experimental observations. These differences can likely be attributed to secondary effects from the inhibition of translation through regulation of the eukaryotic initiation factors at heat-shock temperatures (Duncan and Hershey, 1984; Duncan and Song, 1999). If HSPs are not efficiently translated at elevated temperatures, they will not participate in autoregulation of their expression. Reducing the rate constant of translation (κta) in the model in response to the 43°C heat-shock results in no changes to the timescales of induction or the peak, but significantly reduces the attenuation of phosphorylated HSF, as predicted by the experiments (see Supplementary Material). Therefore, the model's predictive ability at longer times and under 43°C is limited; suggesting that whereas the core mechanism of the model is consistent with most experimental data, future modeling work must consider the translational machinery in more detail. In addition, other phenomena such as the sequestration of chaperones by misfolded substrates should be considered for a more detailed understanding of long-time exposure to heat stress.
HSP feedback affects different phases of the transcriptional response
A critical function of the heat-shock network is to prevent the appearance and persistence of protein aggregates through regulation of the concentration of molecular chaperones. We utilized sensitivity analysis to identify the key parameters that underlie the regulation of HSP levels. Table 4 summarizes the most sensitive parameters at 250 min, which was chosen as a characteristic time for examining the sensitivity of the HSP levels since it is the point in the heat-shock response when transcription is repressed (Fig. 2), whereas the cell still requires functional HSP activity. As expected, the rate constants for transcription and translation (κtr and κta) are the two most important parameters that regulate HSP expression levels. However, sensitivity analysis also identified the binding of HSP to phosphorylated HSF (Γ3) as another key parameter for regulating long-term HSP levels. In addition, the affinity of the HSPs for the free HSF was also identified as an important parameter for HSP levels (Table 4). According to the molecular mechanism, these two steps are important for the feedback regulatory mechanisms of HSP on HSF function. To test the effect of loss of HSP regulation on the heat-shock response we individually disrupted the two points of chaperone feedback (Γ3 and Γ7). In Fig. 4 A, the affinity of HSPs for bound, phosphorylated HSF (Γ3) is altered. As sensitivity analysis predicted, reduced binding affinity leads to increased HSP levels. The HSP levels increased 1.4-fold when the binding affinity between HSF and HSPs was reduced by 0.25-fold, compared to the baseline case. This increase in HSP levels at 250 min can be understood by examining the transcriptional response (Fig. 4 B). The effect of varying the binding affinity is a change in the maximum occupancy of the HSEs by phosphorylated HSF. These changes affect the activity of transcription, which in turn results in changes in HSP levels at 250 min.
TABLE 4.
The most sensitive parameters for dimensionless HSP levels after 250 min of heat-shock
| Description | Dimensionless parameter* (process number†) | Sensitivity 
|
|
|---|---|---|---|
| Rate constant of translation. | κta | (7) | 0.6 |
| Rate constant of transcription. | κtr | (6) | 0.6 |
| Affinity for HSP binding to phosphorylated HSF (P:HSF:HSE). | Γ3 | (8) | −0.3 |
| Affinity of I binding to HSP:P:HSF:HSE. | Γ4 | (9) | −0.3 |
| Total I concentration. | −0.3 | ||
| Total S concentration. | 0.2 | ||
| Affinity of S* for HSF:HSE. | Γ2 | (4) | 0.2 |
| Rate constant of S* activity (catalytic phosphorylation of HSF:HSE). | κS | (5) | 0.2 |
| Affinity of HSF for binding to HSEs. | Γ1 | (3) | 0.2 |
| Rate constant of I activity (catalytic dephosphorylation of HSP:P:HSF:HSE). | κI | (10) | −0.2 |
| Total HSF concentration. | — | — | 0.2 |
| Affinity of HSP binding to free HSF. | Γ7 | (13) | 0.2 |
FIGURE 4.

Role of HSP feedback in regulation of the heat-shock response. (A) Dynamics of HSP and (B) phosphorylated HSF versus time at 42°C with varying binding affinity of HSP for P:HSF:HSE. The binding affinity was changed by 0.25 (dotted line), 1 (solid line), and 4 (dashed line) fold. (C) Dynamics of HSP and (D) phosphorylated HSF versus time at 42°C with varying binding affinity of HSP for HSF. The binding affinity was changed by 0.1 (dotted line), 1 (solid line), and 10 (dashed line) fold.
Varying the binding affinity of HSP for free HSF binding affinity (Γ7) also affects the production of HSPs (Table 4). After 250 min of 42°C heat-shock, the HSP levels were decreased by 0.7-fold under a 0.1-fold reduction in binding affinity, and increased 1.3-fold under a 10-fold increase (Fig. 4 C). Similar to disruption of HSP interaction with phosphorylated HSF, the effect of changing the HSP to free HSF binding affinity alters the maximum level of phosphorylated HSF, during stress (Fig. 4 D). An additional consequence of changing this binding affinity, however, is a change in the timescale of transcriptional activity. The transcriptional response is repressed more rapidly (after a 150-min heat-shock) when the binding affinity is increased 10-fold and the transcriptional response persists past 250 min when the binding affinity is reduced by 0.1-fold (Fig. 4 D). These results reveal that the affinity of interactions between HSF and HSPs are likely to have significant regulatory consequences on the kinetics of the heat-shock response.
Stress stabilization is important for posttranscriptional regulation of HSP production
In addition to HSP feedback, the model contains another control loop from the stabilization of hsp mRNA by the level of stress on the system. Fig. 5 A shows the effect of reducing the coupling (Γs) on the production of HSPs. After a 250-min heat-shock, the dimensionless HSP level is reduced by 0.4-fold in the completely unstabilized case, compared to the stress-stabilized system. Unlike disruption of the HSP feedback steps, however, the change in HSP levels is not due to a change in the transcriptional response. The transcriptional response, measured by the maximum occupancy of HSEs by phosphorylated HSF and attenuation of phosphorylated HSF, actually increases slightly when stress stabilization is disrupted (Fig. 5 B). The increase in HSP levels at 250 min in the stress-stabilized case is, therefore, due to the slower turnover of hsp mRNA (Fig. 5 C). Each mRNA copy is translated more times in the stress-stabilized case than without the stabilization, resulting in overall higher levels of HSP.
FIGURE 5.
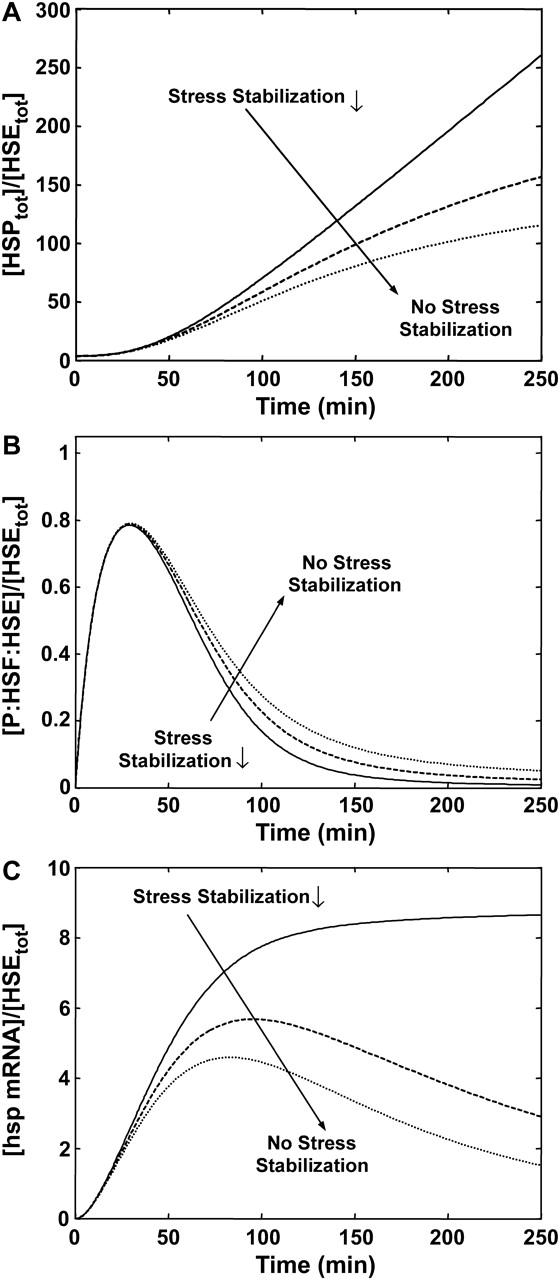
Role of stress stabilization of mRNA in regulation of the heat-shock response. (A) Dynamics of HSP, (B) phosphorylated HSF, and (C) hsp mRNA versus time at 42°C with varying coupling between S* and degradation of mRNA. The stress stabilization is varied from baseline (solid line), to an intermediate value (dashed line), to no stress stabilization (dotted line).
HSF concentration controls both the level and threshold of stress response
In addition to the kinase/phosphatase-related parameters (see Supplementary Material), and the affinity of HSPs for phosphorylated HSF, another important parameter in the regulation of HSP production is the total concentration of HSF (Table 4), despite the fact that HSF is in excess relative to HSEs. We tested the effect of under- and overexpression of HSF on the concentration of HSPs by varying the concentration of HSF pre-stress, and allowing the system to equilibrate; we then induced a wide range of stress levels, and compared the concentration of HSP, relative to the invariant total HSE concentration, at each stress level and at 250 min (Fig. 6). As discussed earlier, for stress levels that correspond to temperatures ≥43°C, the predictions of HSP levels at 250 min after the induction of the stress are an overestimate.
FIGURE 6.

Effect of an increase or decrease in HSF concentration on HSP concentration at varying stress levels. Stress is the relative catalytic activity of the kinase of S to the phosphatase of S*  The dimensionless HSF concentration was varied by 0.25 (dash-dot line), 1 (dotted line), 4 (dashed line), and 10 (solid line) fold. For each stress and HSF concentration, the concentration of HSP (scaled by the concentration of HSEs) is plotted after a 250-min heat-shock. For reference, the stresses that correspond to 37°C, 41°C, 42°C, and 43°C are shown.
Reducing the HSF concentration to one-fourth its baseline concentration led to underexpression of HSPs; similarly, a 4- or 10-fold increase in HSF leads to a 4.3- or 10-fold increase, respectively, in the concentrations of HSPs at 37°C. Additionally, the threshold stress where cells increased their production of HSPs was shifted to either a lower or a higher stress depending on the fold change in HSF concentration. These observations of increased HSP expression for a broad range of stress levels, when HSF is overexpressed, agree with the experimental observations of a constitutively active heat-shock response in Caenorhabditis elegans or mammalian cells with overexpressed HSF (Morley and Morimoto, 2004; Sarge et al., 1993).
Identifying key parameters for the heat-shock response in Saccharomyces cerevisiae
The results of the sensitivity analysis (Table 4) also suggested that another important parameter is the binding affinity of HSF for the HSEs. This parameter has the potential for regulation of the pre-stress occupancy of the HSEs. Contrary to human HSEs, the HSEs of yeast are highly occupied pre-stress by HSF (Jakobsen and Pelham, 1988; Sorger et al., 1987). The binding affinity of HSF for HSE, therefore, represents a mechanistic distinction between yeast and human cells for heat-shock networks. To initially simulate the heat-shock response in yeast, the binding affinity of HSF for the HSEs was increased to ensure high (>90%) occupancy of HSEs, pre-stress. To account for differences in half-lives of proteins in yeast versus human cells, the half-life of hsp70 mRNA was reduced by half. With these changes alone, the model exhibited a more rapid induction phase, in agreement with experimental results on the yeast heat-shock response; however, the model failed to attenuate the phosphorylated species of HSF on the observed timescales for yeast where the phosphorylated HSF peaks near 15 min and attenuates near its basal level ∼120 min (Gasch et al., 2001; Liu and Thiele, 1996). Sensitivity analysis on the initial yeast model was subsequently used to identify the parameters that were likely responsible for the attenuation and the most important additional differences between the yeast and human heat-shock response (Table 5). Similar to the human heat-shock response, the stress kinase-associated parameters are among the most important for regulating the long-time phosphorylated HSF levels in the yeast model (Table 5). Reduction of the stress kinase binding affinity for HSF (Γ2) allowed the model to capture the experimental timescales of both induction and attenuation (Fig. 7 A). Reduction of the stress-kinase's affinity for HSF aids attenuation through shifting the balance of HSF from transcriptional activation to repression. Initially, HSF is highly bound in the yeast system, leading to the rapid activation of transcription and faster production of HSPs than the human response. Once the concentration of HSPs begins to rise, however, the balance between phosphorylation of HSF and sequestration of HSF by the newly synthesized HSPs is skewed toward sequestration, due to the weak affinity of the stress-kinase. This trend leads to attenuation on a faster timescale than the human response.
TABLE 5.
The most sensitive parameters for dimensionless, phosphorylation HSF levels after 250 min of heat-shock, in the yeast model
| Description | Dimensionless parameter* (process number†) | Sensitivity‡
|
Sensitivity§
|
|
|---|---|---|---|---|
| Rate constant of I activity (catalytic dephosphorylation of HSP:P:HSF:HSE). | κI | (10) | −0.2 | −0.6 |
| Rate constant of S* activity (catalytic phosphorylation of HSF:HSE). | κS | (5) | 0.2 | 0.5 |
| Rate constant of translation. | κta | (7) | −0.1 | −0.8 |
| Rate constant of transcription. | κtr | (6) | −0.1 | −0.8 |
| Affinity of HSP binding to free HSF. | Γ7 | (13) | −0.1 | −0.9 |
| Affinity of S* for HSF:HSE. | Γ2 | (4) | 0.1 | 0.5 |
| Total S concentration. | — | — | 0.1 | 0.5 |
Sensitivity is the log(sensitivity) coefficient for this parameter. The log(sensitivity) coefficient quantifies the percentage change in dimensionless phosphorylated HSF levels for a 1% change in a parameter.
From Table 3, when appropriate.
From Fig. 1, when appropriate.
After increasing the binding affinity of HSF for HSE (Γ1).
After increasing the binding affinity of HSF for HSE (Γ1), and reducing stress kinase affinity (Γ3).
FIGURE 7.
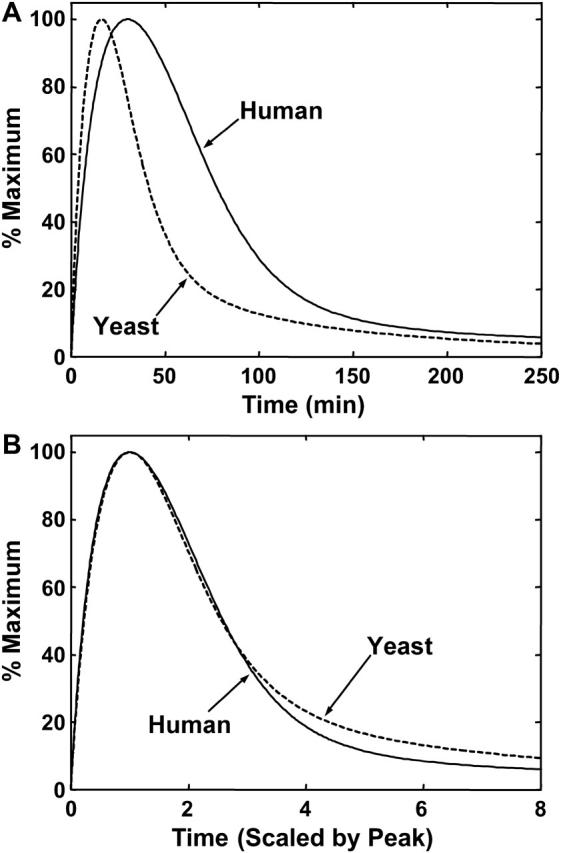
Comparison of the dynamics of the heat-shock response in yeast versus humans with and without time rescaling. (A) Dynamics of phosphorylated HSF in humans (solid line) and yeast (dashed line) versus time at 42°C, or equivalent temperature in yeast. (B) Same as A, but the timescale of each species' heat-shock response has been scaled by its time to peak in A.
With changes in two parameters, the yeast heat-shock response is faster in every phase of response, compared to the human response. These timescales are in good agreement with experiments on the dynamics of the yeast heat-shock response (Gasch et al., 2001; Liu and Thiele, 1996). Proper comparisons of the dynamics of the heat-shock response between the two organisms was performed in dimensionless timescales as well as normalized units of measurement. If the timescale of the yeast and human heat-shock response are rescaled by their respective times to the peak of phosphorylated HSF1 (15 min and 30 min, respectively) the two responses appear to coincide (Fig. 7 B). This demonstrates the similarities between the heat-shock responses of human and yeast cells, and how the objective of stress tolerance can be achieved in two different organisms using the same mechanism with different kinetic and thermodynamic properties, i.e., fast activation-fast attenuation versus longer timescales.
DISCUSSION
The heat-shock response is an essential and ancient adaptation and survival response whose principal function is to ensure protein quality control and homeostasis. Through the transcriptional induction of genes encoding chaperones and protein degradation machineries, the cell efficiently manages misfolded and damaged proteins from persisting as proteotoxic species, aggregates, and inclusions. Computational analysis of a mathematical model of the heat-shock network, presented here, led to the identification of the elementary steps that may represent key determinants of network performance.
The interaction of chaperones with HSF is known to be important for regulating the attenuation of the heat-shock response. However, our analysis shows that these interactions also have a crucial role in regulating the overall level of the transcriptional response. Both the peak of response and the attenuation can be regulated independently through two separate points of HSP feedback. Additionally, our analysis suggests a broader systemic role of these interactions on the production of HSPs. Sensitivity analysis of the mathematical model identified that disruption of these interactions might be one of the most important targets for raising the poststress level of molecular chaperones in the system.
Varying the transcriptional response, however, is not the only way to regulate the long-term HSP levels. Disruption of the stress stabilization step results in a relatively small increase of transcription response, but in a significant reduction of the HSP production. These results identify a unique, posttranscriptional, role for the stress-stabilization control loop.
The interactions of the stress kinases and phosphatases with HSF1 may represent some of the important steps that govern the levels of HSPs. The kinases that directly phosphorylate HSF1 have been studied in vitro and in vivo (Holmberg et al., 2001, 2002). However, relatively little is known about the signaling cascades that lead to the activation of these kinases. Analysis of the mathematical model suggests that a more thorough understanding of these cascades is essential for the systemic understanding of the origins of failure of the heat-shock response. In addition, the parameters associated with the stress phosphatases appear to be just as important as the stress kinase-associated parameters. However, the stress phosphatases and the mechanism through which they inactivate HSF1 are currently unidentified. A more detailed mechanism for HSF1 inactivation will allow future models and experiments to identify the targets for regulating HSP expression.
The results of sensitivity analysis and direct calculation have both shown that overexpression of HSF1 is a potential mechanism for recovering the heat-shock response when other components of the system fail. However, the model also predicts that overexpression of HSF1 beyond a critical level might lead to high levels of HSP even under unstressed or low stress conditions. Chronic high level expression of HSPs could prove detrimental to cells, as molecular chaperones interact with numerous signaling pathways and inhibit cell growth (Nollen and Morimoto, 2002). A predictive model, therefore, provides a means of finding the proper balance between increased protection against the appearance of misfolded and aggregated proteins and possible detrimental effects on cellular function and organism viability.
All mathematical models have to be considered in the context of their underlying constraints and assumptions. The model presented here attempts to distill the detailed experimental observations to identify the most essential elements for transcriptional activation and regulation of the eukaryotic heat-shock response. The success of the model in reproducing key aspects of experimental behavior indicates that our mathematical representation offers an excellent framework for studying a regulatory module of the heat-shock response. This is reflected by the rapid activation and attenuation during continued stress exposure and immediate recovery of the response upon return to control temperatures. All three experimentally observed events associated with transcriptional activation of heat-shock genes (HSF1-DNA binding, HSF1 hyperphosphorylation, and transcriptional activation) exhibit coordinate behaviors as observed experimentally. However, other important aspects of the heat-shock response not addressed here include the trimerization of HSF1 before DNA binding, multiple phosphorylation events on the HSF1 trimer, sequestration of chaperones by misfolded substrates (cytoplasmic events), the time of assembly of the transcriptional/translational machinery, and the kinetic spacing of these events due to rates of transcription and translation (Monk, 2003). The model presented here, however, offers a framework for all of these detailed processes to be included in future models of the eukaryotic heat-shock response.
SUPPLEMENTARY MATERIAL
An online supplement to this article can be found by visiting BJ Online at http://www.biophysj.org.
Supplementary Material
Acknowledgments
We thank G. Matsumoto and members of the Morimoto lab for invaluable discussion; we also thank J. González and S.D. Westerheide for comments, and suggestions on the manuscript. The authors thank the two anonymous reviewers for their many constructive comments. We thank Cold Spring Harbor Press and American Society for Microbiology for permission to reproduce data previously published in Abravaya et al. (1991a) and Kline and Morimoto (1997), respectively.
This research has been supported in part by the National Science Foundation-Integrative Graduate Education and Research Traineeship program “Dynamics of Complex Systems in Science and Engineering” (DGE-9987577), and grants to R.I.M. from the National Institutes of Health (GM38109), Huntington Disease Society of America, Coalition for the Cure, the Amyotrophic Lateral Sclerosis Association, and the Daniel F. and Ada L. Rice Foundation.
References
- Abravaya, K., B. Phillips, and R. I. Morimoto. 1991a. Attenuation of the heat-shock response in Hela-cells is mediated by the release of bound heat-shock transcription factor and is modulated by changes in growth and in heat-shock temperatures. Genes Dev. 5:2117–2127. [DOI] [PubMed] [Google Scholar]
- Abravaya, K., B. Phillips, and R. I. Morimoto. 1991b. Heat-shock-induced interactions of heat-shock transcription factor and the human hsp70 promoter examined by in vivo footprinting. Mol. Cell. Biol. 11:586–592. [DOI] [PMC free article] [PubMed] [Google Scholar]
- Asthagiri, A. R., and D. A. Lauffenburger. 2001. A computational study of feedback effects on signal dynamics in a mitogen-activated protein kinase (MAPK) pathway model. Biotechnol. Prog. 17:227–239. [DOI] [PubMed] [Google Scholar]
- Baler, R., G. Dahl, and R. Voellmy. 1993. Activation of human heat-shock genes is accompanied by oligomerization, modification, and rapid translocation of heat-shock transcription factor HSF1. Mol. Cell. Biol. 13:2486–2496. [DOI] [PMC free article] [PubMed] [Google Scholar]
- Bates, G. 2003. Huntingtin aggregation and toxicity in Huntington's disease. Lancet. 361:1642–1644. [DOI] [PubMed] [Google Scholar]
- Bukau, B., and A. L. Horwich. 1998. The Hsp70 and Hsp60 chaperone machines. Cell. 92:351–366. [DOI] [PubMed] [Google Scholar]
- Cotto, J. J., M. Kline, and R. I. Morimoto. 1996. Activation of heat-shock factor 1 DNA binding precedes stress-induced serine phosphorylation. Evidence for a multistep pathway of regulation. J. Biol. Chem. 271:3355–3358. [DOI] [PubMed] [Google Scholar]
- Cyr, D. M., J. Hohfeld, and C. Patterson. 2002. Protein quality control: U-box-containing E3 ubiquitin ligases join the fold. Trends Biochem. Sci. 27:368–375. [DOI] [PubMed] [Google Scholar]
- Duncan, R., and J. W. Hershey. 1984. Heat-shock-induced translational alterations in HeLa cells. Initiation factor modifications and the inhibition of translation. J. Biol. Chem. 259:11882–11889. [PubMed] [Google Scholar]
- Duncan, R. F., and H. J. Song. 1999. Striking multiplicity of eIF4E–BP1 phosphorylated isoforms identified by 2D gel electrophoresis regulation by heat-shock. Eur. J. Biochem. 265:728–743. [DOI] [PubMed] [Google Scholar]
- El-Samad, H., M. Khammash, H. Kurata, and J. Doyle. 2002. Robustness analysis of the heat-shock response in E. coli. Proc. Am. Control Conf. 1742–1747.
- Ferrell, J. E., Jr. 1996. Tripping the switch fantastic: how a protein kinase cascade can convert graded inputs into switch-like outputs. Trends Biochem. Sci. 21:460–466. [DOI] [PubMed] [Google Scholar]
- Ferrell, J. E., Jr. 1997. How responses get more switch-like as you move down a protein kinase cascade. Trends Biochem. Sci. 22:288–289. [DOI] [PubMed] [Google Scholar]
- Gasch, A. P., M. Huang, S. Metzner, D. Botstein, S. J. Elledge, and P. O. Brown. 2001. Genomic expression responses to DNA-damaging agents and the regulatory role of the yeast ATR homolog Mec1p. Mol. Biol. Cell. 12:2987–3003. [DOI] [PMC free article] [PubMed] [Google Scholar]
- Goldbeter, A., and D. E. Koshland, Jr. 1981. An amplified sensitivity arising from covalent modification in biological systems. Proc. Natl. Acad. Sci. USA. 78:6840–6844. [DOI] [PMC free article] [PubMed] [Google Scholar]
- Holmberg, C. I., V. Hietakangas, A. Mikhailov, J. O. Rantanen, M. Kallio, A. Meinander, J. Hellman, N. Morrice, C. MacKintosh, R. I. Morimoto, J. E. Eriksson, and L. Sistonen. 2001. Phosphorylation of serine 230 promotes inducible transcriptional activity of heat-shock factor 1. EMBO J. 20:3800–3810. [DOI] [PMC free article] [PubMed] [Google Scholar]
- Holmberg, C. I., S. E. Tran, J. E. Eriksson, and L. Sistonen. 2002. Multisite phosphorylation provides sophisticated regulation of transcription factors. Trends Biochem. Sci. 27:619–627. [DOI] [PubMed] [Google Scholar]
- Holmgren, R., V. Corces, R. Morimoto, R. Blackman, and M. Meselson. 1981. Sequence homologies in the 5′ regions of four Drosophila heat-shock genes. Proc. Natl. Acad. Sci. USA. 78:3775–3778. [DOI] [PMC free article] [PubMed] [Google Scholar]
- Huang, C. Y., and J. E. Ferrell, Jr. 1996. Ultrasensitivity in the mitogen-activated protein kinase cascade. Proc. Natl. Acad. Sci. USA. 93:10078–10083. [DOI] [PMC free article] [PubMed] [Google Scholar]
- Hunter, T., and M. Karin. 1992. The regulation of transcription by phosphorylation. Cell. 70:375–387. [DOI] [PubMed] [Google Scholar]
- Jackson, S. P. 1992. Regulating transcription factor activity by phosphorylation. Trends Cell Biol. 2:104–108. [DOI] [PubMed] [Google Scholar]
- Jakobsen, B. K., and H. R. Pelham. 1988. Constitutive binding of yeast heat-shock factor to DNA in vivo. Mol. Cell. Biol. 8:5040–5042. [DOI] [PMC free article] [PubMed] [Google Scholar]
- Kingston, R. E., T. J. Schuetz, and Z. Larin. 1987. Heat-inducible human factor that binds to a human hsp70 promoter. Mol. Cell. Biol. 7:1530–1534. [DOI] [PMC free article] [PubMed] [Google Scholar]
- Kline, M. P., and R. I. Morimoto. 1997. Repression of the heat-shock factor 1 transcriptional activation domain is modulated by constitutive phosphorylation. Mol. Cell. Biol. 17:2107–2115. [DOI] [PMC free article] [PubMed] [Google Scholar]
- Kurata, H., H. El-Samad, T. Yi, M. Khammash, and J. Doyle. 2001. Feedback regulation of the heat-shock response in E. coli. Proc. 40th IEEE Conf. Dec. Control. 837–842.
- Lindquist, S. 1992. Heat-shock proteins and stress tolerance in microorganisms. Curr. Opin. Genet. Dev. 2:748–755. [DOI] [PubMed] [Google Scholar]
- Liu, X. D., and D. J. Thiele. 1996. Oxidative stress induced heat-shock factor phosphorylation and HSF-dependent activation of yeast metallothionein gene transcription. Genes Dev. 10:592–603. [DOI] [PubMed] [Google Scholar]
- Masters, C. L., G. Simms, N. A. Weinman, G. Multhaup, B. L. McDonald, and K. Beyreuther. 1985. Amyloid plaque core protein in Alzheimer disease and Down syndrome. Proc. Natl. Acad. Sci. USA. 82:4245–4249. [DOI] [PMC free article] [PubMed] [Google Scholar]
- Monk, N. A. 2003. Oscillatory expression of Hes1, p53, and NF-κB driven by transcriptional time delays. Curr. Biol. 13:1409–1413. [DOI] [PubMed] [Google Scholar]
- Morimoto, R. I. 1993. Cells in stress—transcriptional activation of heat-shock genes. Science. 259:1409–1410. [DOI] [PubMed] [Google Scholar]
- Morimoto, R. I. 1998. Regulation of the heat-shock transcriptional response: cross talk between a family of heat-shock factors, molecular chaperones, and negative regulators. Genes Dev. 12:3788–3796. [DOI] [PubMed] [Google Scholar]
- Morimoto, R. I., K. D. Sarge, and K. Abravaya. 1992. Transcriptional regulation of heat-shock genes. A paradigm for inducible genomic responses. J. Biol. Chem. 267:21987–21990. [PubMed] [Google Scholar]
- Morley, J. F., and R. I. Morimoto. 2004. Regulation of longevity in Caenorhabditis elegans by heat-shock factor and molecular chaperones. Mol. Biol. Cell. 15:657–664. [DOI] [PMC free article] [PubMed] [Google Scholar]
- Mosser, D. D., N. G. Theodorakis, and R. I. Morimoto. 1988. Coordinate changes in heat-shock element-binding activity and hsp70 gene transcription rates in human cells. Mol. Cell. Biol. 8:4736–4744. [DOI] [PMC free article] [PubMed] [Google Scholar]
- Nollen, E. A., and R. I. Morimoto. 2002. Chaperoning signaling pathways: molecular chaperones as stress-sensing “heat-shock” proteins. J. Cell Sci. 115:2809–2816. [DOI] [PubMed] [Google Scholar]
- Palsson, B. O. 1987. On the dynamics of the irreversible Michaelis-Menten reaction mechanism. Chem. Eng. Sci. 42:447–458. [Google Scholar]
- Parsell, D. A., and S. Lindquist. 1993. The function of heat-shock proteins in stress tolerance: degradation and reactivation of damaged proteins. Annu. Rev. Genet. 27:437–496. [DOI] [PubMed] [Google Scholar]
- Pelham, H. R. 1982. A regulatory upstream promoter element in the Drosophila hsp70 heat-shock gene. Cell. 30:517–528. [DOI] [PubMed] [Google Scholar]
- Peper, A., C. A. Grimbergen, J. A. E. Spaan, J. E. M. Souren, and R. Van Wijk. 1998. A mathematical model of the hsp70 regulation in the cell. Int. J. Hyperthermia. 14:97–124. [DOI] [PubMed] [Google Scholar]
- Pirkkala, L., P. Nykanen, and L. Sistonen. 2001. Roles of the heat-shock transcription factors in regulation of the heat-shock response and beyond. FASEB J. 15:1118–1131. [DOI] [PubMed] [Google Scholar]
- Reich, J. G. 1974. Near-equilibrium reaction and the regulation of pathways. Symp. Biolog. Hungarica. 18:159–171. [Google Scholar]
- Sarge, K. D., S. P. Murphy, and R. I. Morimoto. 1993. Activation of heat-shock gene transcription by heat-shock factor 1 involves oligomerization, acquisition of DNA-binding activity, and nuclear localization and can occur in the absence of stress. Mol. Cell. Biol. 13:1392–1407. [DOI] [PMC free article] [PubMed] [Google Scholar]
- Scherzinger, E., R. Lurz, M. Turmaine, L. Mangiarini, B. Hollenbach, R. Hasenbank, G. P. Bates, S. W. Davies, H. Lehrach, and E. E. Wanker. 1997. Huntingtin-encoded polyglutamine expansions form amyloid-like protein aggregates in vitro and in vivo. Cell. 90:549–558. [DOI] [PubMed] [Google Scholar]
- Segel, L. A., and M. Slemrod. 1989. The quasi-steady-state assumption—a case-study in perturbation. SIAM Rev. 31:446–477. [Google Scholar]
- Shi, Y., D. D. Mosser, and R. I. Morimoto. 1998. Molecular chaperones as HSF1-specific transcriptional repressors. Genes Dev. 12:654–666. [DOI] [PMC free article] [PubMed] [Google Scholar]
- Sorger, P. K., M. J. Lewis, and H. R. B. Pelham. 1987. Heat-shock factor is regulated differently in yeast and HeLa cells. Nature. 329:81–84. [DOI] [PubMed] [Google Scholar]
- Srivastava, R., M. S. Peterson, and W. E. Bentley. 2001. Stochastic kinetic analysis of the Escherichia coli stress circuit using σ32-targeted antisense. Biotechnol. Bioeng. 75:120–129. [DOI] [PubMed] [Google Scholar]
- Theodorakis, N. G., and R. I. Morimoto. 1987. Posttranscriptional regulation of hsp70 expression in human cells—effects of heat-shock, inhibition of protein synthesis, and Adenovirus infection on translation and messenger-RNA stability. Mol. Cell. Biol. 7:4357–4368. [DOI] [PMC free article] [PubMed] [Google Scholar]
- Turanyi, T. 1990. Sensitivity analysis of complex kinetic systems—tools and applications. J. Math. Chem. 5:203–248. [Google Scholar]
- Varma, A., M. Morbidelli, and H. Wu. 1999. Parametric Sensitivity in Chemical Systems. A. Varma, editor. Cambridge University Press, Cambridge, UK.
- Wickner, S., M. R. Maurizi, and S. Gottesman. 1999. Posttranslational quality control: folding, refolding, and degrading proteins. Science. 286:1888–1893. [DOI] [PubMed] [Google Scholar]
- Wu, C. 1995. Heat-shock transcription factors: structure and regulation. Annu. Rev. Cell Dev. Biol. 11:441–469. [DOI] [PubMed] [Google Scholar]
- Zou, J., Y. Guo, T. Guettouche, D. F. Smith, and R. Voellmy. 1998. Repression of heat-shock transcription factor HSF1 activation by HSP90 (HSP90 complex) that forms a stress-sensitive complex with HSF1. Cell. 94:471–480. [DOI] [PubMed] [Google Scholar]
Associated Data
This section collects any data citations, data availability statements, or supplementary materials included in this article.