Abstract
We have studied the effect of ergosterol, an important component of fungal plasma membranes, on the physical properties of dipalmitoylphosphatidylcholine (DPPC) multibilayers using deuterium nuclear magnetic resonance (2H NMR) and differential scanning calorimetry (DSC). For the 2H NMR experiments the sn-1 chain of DPPC was perdeuterated and NMR spectra were taken as a function of temperature and ergosterol concentration. The phase diagram, constructed from the NMR spectra and the DSC thermograms, exhibits both solid-ordered (so) + liquid-ordered (lo) and liquid-disordered (ld) + lo phase coexistence regions with a clear three-phase line. This is the first demonstration that lo domains exist in liquid crystalline membranes containing ergosterol. The domain sizes in the ld+lo phase coexistence region were estimated by analyzing the exchange of labeled DPPC between the two regions, and depend on ergosterol concentration. The DPPC-ergosterol phase diagram is similar to that of the DPPC-cholesterol multibilayer system except that the so+lo and ld+lo phase coexistence regions are considerably broader.
INTRODUCTION
Sterols are essential components of eukaryotic cells both as structural membrane components and as initiators and regulators of biological processes. In particular, cholesterol is ubiquitous in mammalian cells and ergosterol is the major sterol in certain fungi and protozoans, where it fulfills several important functions. In the unicellular eukaryote, Saccharomyces cerevisiae, Rodriguez et al. (1985) have identified four of these functions, which include growth (sparking) and bulk requirements, the latter related to maintaining membrane integrity under physiological conditions. Recently Kuebler et al. (1996) found evidence for the presence of Triton X-100 insoluble fractions in S. cerevisiae plasma membrane lipids, which implied the existence of “rafts” in the plasma membrane. Bagnat et al. (2000) showed that the major components of rafts in the plasma membrane of S. cerevisiae are phosphoinositol-based sphingolipids and ergosterol. The same authors found that, in contrast to mammalian rafts, the assembly of rafts in S. cerevisiae starts in the endoplasmic reticulum (ER) and that glycophosphatidylinositol anchored proteins associate with rafts in the ER. Bagnat et al. (2001) found that the major yeast plasma membrane protein, plasma membrane ATPase (Pma1p), needs to be associated with rafts for delivery to the plasma membrane. In vitro studies by Xu et al. (2001) using ternary lipid mixtures containing ergosterol support the presence of rafts in yeast.
The lipid composition of the S. cerevisiae plasma membrane has been studied extensively (Longley et al., 1968; Bottema et al., 1985; Patton and Lester, 1991, Zinser et al., 1991, 1993; Tuller et al., 1999). Until recently, however, most investigations reported on the fatty acid and polar head moieties of the lipid molecules and the detailed composition of individual lipid molecules was not known. Schneiter et al. (1999) identified the specific lipid molecules of both the plasma membrane and the membranes of the organelles of the X2180-1F wild-type strain of S. cerevisiae using electrospray ionization tandem mass spectrometry. The results for the plasma membrane are as follows. Phosphoinositol-based sphingolipids form 30% of the total phospholipid content of the plasma membrane, the other 70% being composed of glycerophospholipids (GPLs) in agreement with the results of Patton and Lester (1991). Interestingly, the amide-linked chain of the sphingolipids is highly saturated and unusually long (C26:0) and free ceramide with the same chain length is also present in abundance. (It is not known, however, whether the ceramide is present as a precursor of the sphingolipids or whether it has a specific function in the plasma membrane.) In this context, the results of Eisenkolb et al. (2002) indicate that the (26:0) chains of the sphingolipids are vital for the establishment of raft association by Pma1p and the stability of this protein at the cell surface of yeast. These authors also established that the presence of ergosterol rather than cholesterol is a structural requirement for this association. The S. cerevisiae plasma membrane GPLs are chiefly composed of a saturated acyl chain (e.g., C16:0 or C18:0) and a monounsaturated acyl chain (e.g., C16:1). In contrast to the case of higher eukaryotic cells neither glycolipids nor GPLs with polyunsaturated acyl chains were found.
The range of polar heads of the GPLs had already been analyzed by Zinser et al. (1991, 1993) for the same strain of S. cerevisiae in the same growth medium. The major GPL species were found to be phosphatidylcholine (PC), phosphatidylinositol, phosphatidylserine, and phosphatidylethanolamine. The concentration of ergosterol in the S. cerevisiae plasma membrane has been somewhat controversial. For example, Patton and Lester (1991) reported a 1:1 molar ratio of ergosterol/phospholipid whereas Zinser at al. (1991, 1993) found an ergosterol/phospholipid ratio of 3.5:1. More recently, Schneiter et al. (1999) found an ergosterol/phospholipid ratio of 0.46:1, which is, as they point out, comparable to the cholesterol/phospholipid ratio of 0.35:0.53 obtained for higher eukaryotic cells.
Here we study the properties and phase behavior of multilamellar dispersions of dipalmitoylphosphatidylcholine (DPPC) and ergosterol. Saturated PCs are known to have very similar physical chemical behavior to that of saturated-chain sphingomyelins (Ohvo-Rekilä et al., 2002). Furthermore, sphingolipids with deuterated acyl chains are not available commercially at present. Therefore, because the presence of rafts in yeast membranes is conjectured to result from the interaction between ergosterol and lipid molecules with high melting temperatures, DPPC-ergosterol is a good model in which to study phase behavior in a comprehensive way. In this context, it is usually assumed that rafts are in a tightly packed liquid-ordered (lo) phase where the sterols order the chains of the high melting lipids but the rafts retain their lateral fluidity. It is of interest to note that Xu et al. (2001) have found that ergosterol promotes the formation of raft-like domains more strongly than cholesterol. Indeed Urbina et al. (1995) have shown that 30 mol% ergosterol orders the acyl chains of dimyristoylphosphatidylcholine (DMPC) more strongly than cholesterol. Endress et al. (2002) compare the effect of cholesterol and ergosterol on the mechanical properties of DPPC bilayers. These authors find that the area compressibility modulus of DPPC bilayers containing 40 mol% ergosterol at 10°C is a factor of 1.5 higher than in the case of cholesterol. This fits well with the 2H NMR results of Urbina et al. (1995) for DMPC-sterol multibilayers.
The experimental methods used here to study DPPC-ergosterol membranes are 2H NMR spectroscopy and DSC. Aqueous multilamellar dispersions (MLDs) of ergosterol and sn-1 chain perdeuterated DPPC were used to obtain the chain order parameter as a function of temperature, T, and ergosterol mol fraction, x. Analysis based on and extended from that of Vist and Davis (1990) was applied to both the 2H NMR spectra and the DSC thermograms to determine the T-x phase diagram. The phases making up this phase diagram are the same as those found by Vist and Davis (1990) and the notation due to Ipsen et al. (1987) is used to characterize them in this study. The gel phase of pure phospholipid bilayers is referred to as the solid-ordered (so) phase, the liquid crystalline phase of pure lipid bilayers is referred to as the liquid-disordered (ld) phase, and the β-phase of Vist and Davis (1990), which is found at higher cholesterol concentrations, is referred to as the liquid-ordered (lo) phase. The terms solid and liquid are used to characterize the nature of the phase whereas the words ordered and disordered indicate the conformational nature of the lipid acyl chains.
MATERIALS AND METHODS
DPPC-d31 and DPPC were obtained from Avanti Polar Lipids (Alabaster, AL). Ergosterol and cholesterol were obtained from Sigma-Aldrich Canada (Oakville, ON). Deuterium-depleted water was from Sigma-Aldrich Canada.
2H NMR spectroscopy
DPPC-d31/ergosterol multilamellar dispersions were prepared for ergosterol concentrations of 0, 5, 10, 13, 16, 20, 25, 27.5, 30, 35, and 42 mol%. DPPC-d31 and ergosterol were mixed in the appropriate quantities, dissolved in benzene/methanol, 4:1 (v/v), and then freeze-dried. Samples were hydrated using a pH 7.4 buffer prepared in deuterium-depleted water containing 50 mM HEPES, 150 mM NaCl, 4 mM EDTA. Hydration was performed by freeze-thaw-vortex cycling five times between liquid nitrogen temperature and 50°C. 2H NMR experiments were performed on a locally built spectrometer at 46.8 MHz using the quadrupolar echo technique (Davis et al., 1976). The typical spectrum resulted from 10,000–15,000 repetitions of the two-pulse sequence with 90° pulse lengths of 3.95 μs, interpulse spacing of 40 μs, and dwell time 2 μs. The delay between acquisitions was 300 ms and data were collected in quadrature with Cyclops eight-cycle phase cycling. The spectra were depaked using the procedure described by Lafleur et al. (1989). The spin-spin relaxation time, T2e, was measured by varying the interpulse spacing from 40 to 100 μs and taking the initial slope of the echo peak signal versus echo time. The sample was heated from 15 to 60°C. At each temperature, the sample was allowed to equilibrate for 20 min before a measurement. The first moment, M1, was calculated using
 |
where ω is the frequency shift from the central (Larmor) frequency, f(ω) is the spectral intensity, and  .
.
The boundaries of the so+lo coexistence region are determined by the spectral subtraction method (Vist and Davis, 1990; Thewalt and Bloom, 1992). Within the two-phase region, the 2H NMR spectrum S is a superposition of the weighted so and lo spectra:
 |
(1) |
 |
(2) |
where xA and xB are the ergosterol concentrations of two DPPC-d31/ergosterol MLDs, xs and xf are the ergosterol concentrations at the so and lo phase boundary, fA and fB are the fractions of lo phospholipid in the two samples, and Ss and Sf are the end-point spectra characteristic of so- and lo-phase domains, respectively, at the so and lo phase boundaries. Given two area-normalized 2H NMR spectra  and
and  the so (or lo) spectrum can be obtained by subtracting a fraction K (or K′) of one spectrum from the other. K is the ratio of lo-phase phospholipid fractions in the two samples, fA/fB, and K′ is the ratio of so phase phospholipid fractions in the two samples (1 − fB)/(1 − fA). Using the K and K′ values determined from the spectral subtraction, the phase boundaries, xs and xf, can then be calculated:
 |
(3) |
 |
(4) |
The spectral subtraction method is valid as long as certain assumptions hold. The spectra of the two phases, Ss and Sf, have to be sufficiently different that one can easily distinguish and carry out the subtraction procedure. The exchange of labeled lipid between two kinds of domains must be slow on the NMR timescale so that it can be neglected. In addition, the domain must be sufficiently large, so that the signal from the lipid on the boundary of the domains is negligible. Also, this method assumes that both phases have the same relaxation time T2e, which is not true in this case. We found that the lo phase has a T2e one to six times larger than the so phase T2e (depending on the temperature), hence the so component decays with time faster than the lo component ( ). Thus, at any given quadrupolar echo time 2τ, the 2H NMR spectrum will contain a smaller so component Ss than is representative of the sample. fA and fB in Eqs. 1 and 2, which should be denoted as fA(t = 2τ) and fB(t = 2τ), do not reflect the actual fraction of fluid phospholipid in the samples due to this T2e effect. Thus, the K and K′ (which should be denoted as K(t = 2τ) and K′(t = 2τ), respectively) determined from the spectral subtraction will not be correct, leading to a deviation of xs and xf from the actual values. To eliminate this T2e effect, corrected fA and fB values (i.e., fA(t = 0) and fB(t = 0)) are calculated by extrapolating the height of the respective echo signal back to t = 0 using the measured T2e for a given temperature, and then the corrected K and K′ values (i.e., K(t = 0) and K′(t = 0)) can be derived and expressed in terms of the experimentally determined K, K′ (i.e., K(t = 2τ), K′(t = 2τ)), and T2es. Using Eqs. 3 and 4 with these corrected K and K′ values, the T2e-corrected values of xs and xf are obtained.
Differential scanning calorimetry
DSC measurements were performed on DPPC/ergosterol MLDs at ergosterol concentration of 0, 5, 10, 13, 20, 25, 30, and 40 mol%. Suspensions of multilamellar liposomes (5 mM) were prepared. After weighing, the dry lipids were cosolubilized in a chloroform/methanol 2:1 mixture (or hydrated immediately in the case of pure DPPC). Chloroform/methanol was driven off by a stream of nitrogen, and the samples were stored under low pressure for at least 72 h. The resulting dry lipid films were then dispersed in pure water. The temperature was kept at 60°C for 1 h during which the suspensions were shaken vigorously several times. The DSC scans were made using a DSC Nanocal (Calorimetry Science, Provo, UT). No baseline correction was applied to the data.
RESULTS AND DISCUSSION
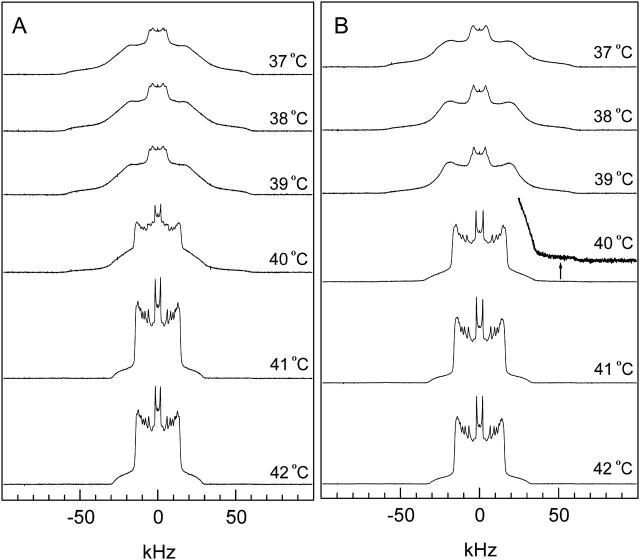
2H NMR spectra were collected from 15 to 60°C. Fig. 1 A shows that pure DPPC-d31 MLDs undergo a gel (so) to liquid-disordered (ld) phase transition near 40°C (Tm) as the temperature is raised. The spectra obtained above 41°C display pure ld phases. The spectrum is a superposition of Pake doublets, indicating that the membrane is in the ld phase where the acyl chain undergoes rapid, axially symmetric reorientation about the bilayer normal. The spectra obtained below 39°C are characteristic of a pure so phase membrane. Deuterons in so membranes do not undergo axially symmetric motion on the NMR timescale because the acyl chains are closely packed. The spectrum obtained at 40°C is composed of both so and ld components. The spectrum of the 95:5 DPPC-d31/ergosterol MLD at 40°C also displays both so and ld components (Fig. 1 B), but with the ld component dominating. The residual gel component can be observed by magnifying the tail of the spectrum, which extends beyond 50 kHz (see arrow in Fig. 1 B). This indicates that the so to ld transition occurs at a lower temperature in the presence of 5 mol% ergosterol.
FIGURE 1.
2H NMR spectra of (A) pure DPPC-d31 and (B) 95:5 DPPC-d31/ergosterol as a function of temperature.
Adding ergosterol affects DPPC-d31 membranes in both the ld and so states. Fig. 2 shows the spectrum of DPPC-d31/ergosterol dispersions at 42°C (i.e., above Tm) as a function of ergosterol concentration. DPPC-d31 MLDs with up to 5 mol% ergosterol display pure ld phase spectra. With increasing ergosterol concentration the average spectral width increases and the individual peaks broaden. At 27.5 mol% ergosterol, the individual peaks become sharper and remain sharp at higher ergosterol concentration. These spectra are the typical pure lo phase spectra: a superposition of Pake doublets having an average spectral width (e.g., 107,000 s−1 for 27.5 mol% ergosterol) nearly twice that of the ld phase (e.g., 56,000 s−1 for pure DPPC-d31) due to the highly conformationally ordered lipid chains. For ergosterol concentrations between 10 and 25 mol%, the broadening of the individual doublets in the spectrum suggests an ld+lo phase coexistence. Therefore, ergosterol induces lo-phase domains in DPPC-d31 bilayers.
FIGURE 2.
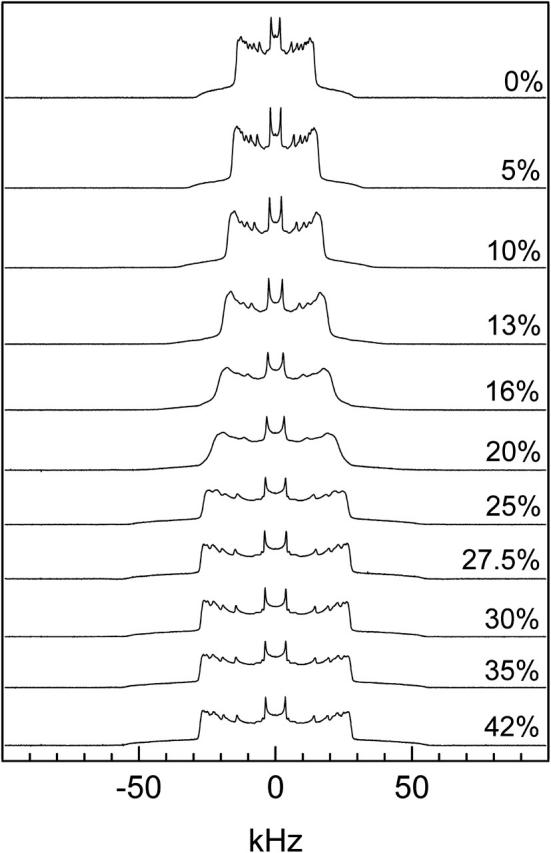
2H NMR spectra of DPPC-d31/ergosterol as a function of ergosterol concentration at T = 42°C.
Fig. 3 shows the spectrum of DPPC-d31/ergosterol as a function of ergosterol concentration at 38°C (i.e., below Tm). The 0 mol% ergosterol and 5 mol% ergosterol samples display so phase spectra. For the 10 mol% ergosterol sample, a small lo component appears in addition to the so spectrum, as indicated by the emergence of “peaks” near ±15 and ±20 kHz. The coexistence of so and lo phases indicates that ergosterol induces lo domains in the DPPC-d31 bilayers. The proportion of lo component increases as the ergosterol concentration increases (see spectra at 13, 16, and 20 mol%). Concurrently, the proportion of so component decreases. Therefore, adding ergosterol decreases the propensity of DPPC-d31 membranes to form the so phase. As the ergosterol concentration reaches 25 mol% and higher, the DPPC-d31 membranes are entirely in the lo phase and exhibit lo phase spectra.
FIGURE 3.
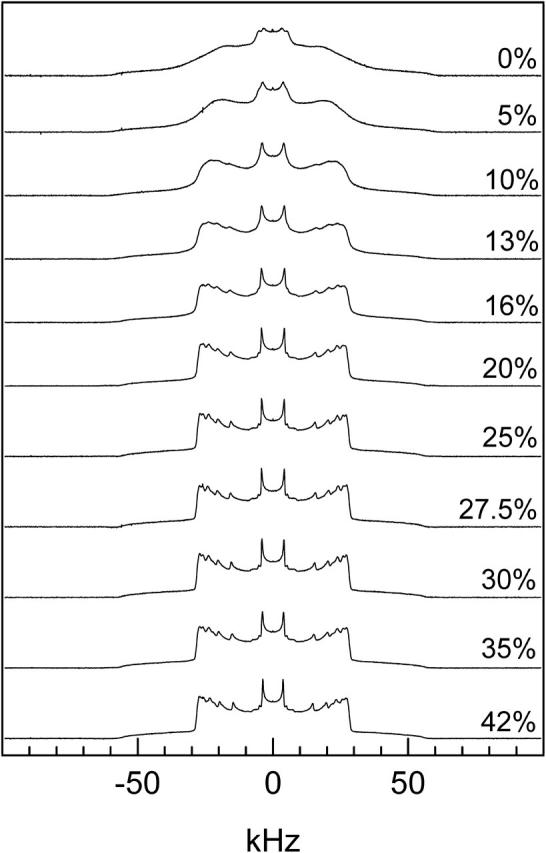
2H NMR spectra of DPPC-d31/ergosterol as a function of ergosterol concentration at T = 38°C.
The spectra as a function of temperature for 84:16 DPPC-d31/ergosterol are shown in Fig. 4. The spectra of 26, 30, 34, and 38°C show that there is so+lo phase coexistence in the DPPC/ergosterol membrane. At 26°C, the spectrum consists mostly of the so component with a very small amount of the lo component as indicated by the emergence of Pake doublet peaks within the central part of the spectrum (±20 kHz). These Pake doublet peaks become more prominent as temperature increases and the so component is reduced. At 38°C, the lo component dominates the spectrum. At 42, 46, and 50°C, lo+ld phase coexistence is observed. This is found by examining the individual peaks of the depaked spectra. These peaks are broadened, indicating the coexistence of ld and lo components (see discussion of Fig. 7 below). At 55 and 60°C, a pure liquid crystalline phase is observed, where the individual peaks of the depaked spectra become sharp.
FIGURE 4.
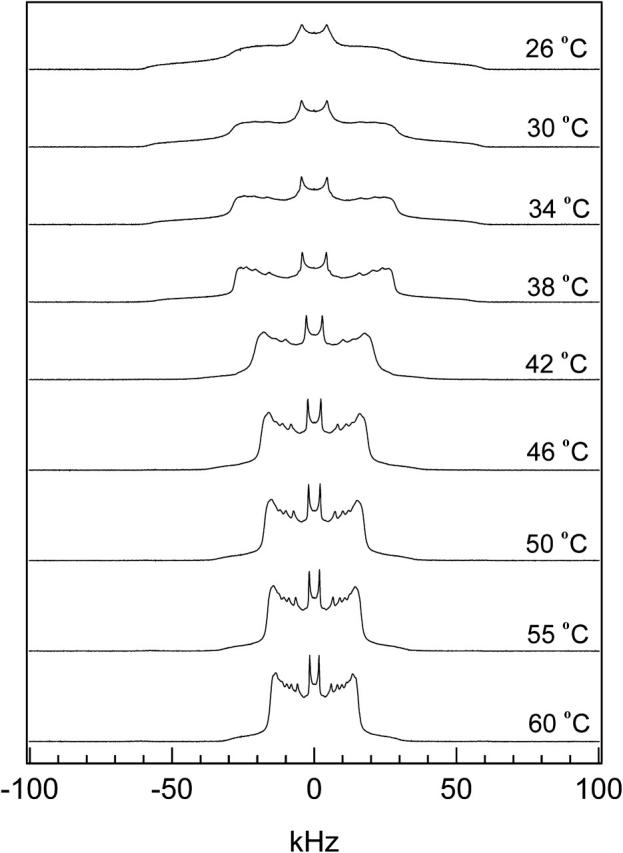
2H NMR spectra as a function of temperature for 84:16 DPPC-d31/ergosterol.
FIGURE 7.
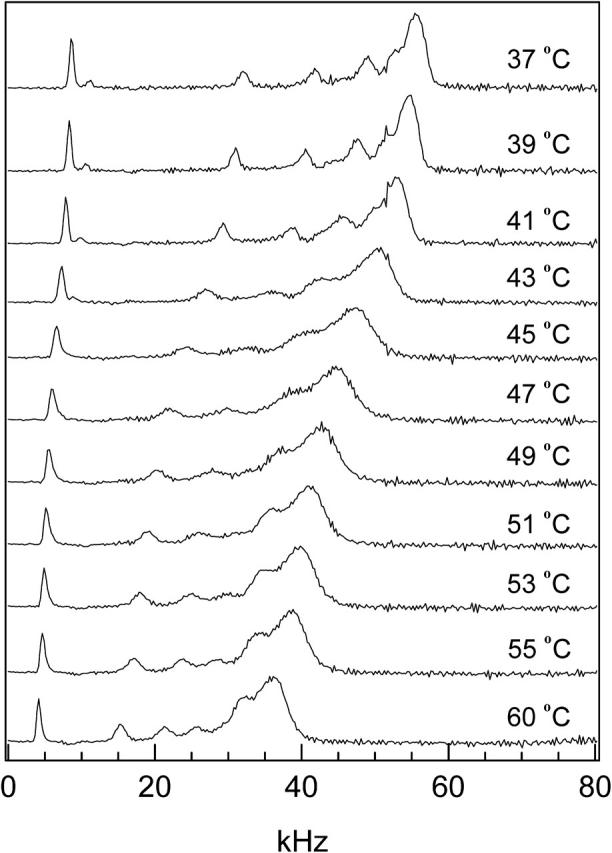
The depaked spectra of 75:25 DPPC-d31/ergosterol as a function of temperature. Because the spectra are symmetrical, we show only the high-frequency half of each.
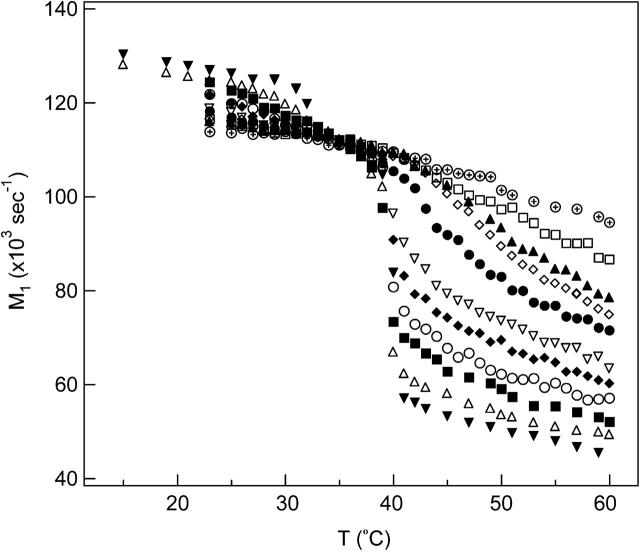
The first moment, M1, measures the average spectral width. Each phase state has a distinct 2H NMR spectrum and thus a distinct M1 value. A large variation of M1 with temperature can be used to pinpoint phase transition temperatures in the membrane. Fig. 5 shows M1 as a function of temperature for all DPPC-d31/ergosterol MLDs. Pure DPPC-d31 undergoes a pretransition at 31°C from the Lβ′ phase to the Pβ′ phase and a main transition at 40°C from the Pβ′ phase to the Lα phase as the temperature is raised. Note that the Lβ′ phase and the Pβ′ phase are so phases and the Lα phase is synonymous with the ld phase. The M1(T) curve plunges less dramatically at Tm as more ergosterol is added: below Tm M1(T) decreases with increasing ergosterol concentration, whereas above Tm M1(T) increases with increasing ergosterol concentration. M1 is proportional to the average order parameter in the liquid crystalline phase. Therefore, adding ergosterol increases the DPPC-d31 chain ordering above Tm. The so to ld transition for DPPC-d31/ergosterol MLDs containing 10–20 mol% ergosterol occurs at a constant temperature, Tm = 39.5 ± 0.5°C, implying the existence of a three-phase line in the phase diagram. For DPPC-d31/ergosterol MLDs containing ergosterol concentrations of 25 mol% and above, the so to ld phase transition is absent.
FIGURE 5.
The temperature dependence of M1 for DPPC-d31/ergosterol at various ergosterol concentrations: 0 mol% (▾); 5 mol% (▵); 10 mol% (▪); 13 mol% (○); 16 mol% (♦); 20 mol% (∇); 25 mol% (•); 27.5 mol% (⋄); 30 mol% (▴); 35 mol% (□); 42 mol% (⊕).
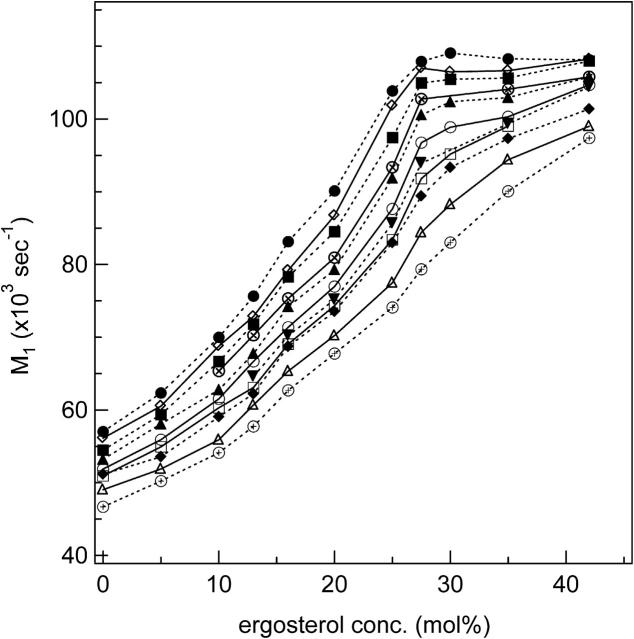
To further explore the phase behavior of DPPC-d31/ergosterol MLDs in the liquid crystalline phase, we have plotted M1 as a function of ergosterol concentration at various temperatures above Tm (Fig. 6). Because M1 is proportional to the average order parameter, each curve in Fig. 6 displays the progression of the average order parameter with increasing ergosterol concentration at a given temperature. The average order parameter of MLDs containing coexisting lo and ld phases is expected to be most sensitive to increasing ergosterol concentration because a proportion of ld phase will be converted to the much more ordered lo phase upon ergosterol addition. For lo-phase MLDs the effect of added ergosterol will be more modest. The M1(ergosterol) curves, except at 57°C, exhibit two distinct ergosterol concentration-dependent behaviors: below 27.5 mol% ergosterol the average order parameter increases rapidly as ergosterol concentration increases, whereas above 27.5 mol% ergosterol the average order parameter increases slowly or levels off as ergosterol concentration increases. The NMR spectra suggest that at these temperatures the 75:25 DPPC-d31/ergosterol MLD has coexisting ld+lo phases whereas the 70:30 DPPC-d31/ergosterol MLD is in the lo phase. Therefore, the changes of slope in the M1(ergosterol) curve suggests a ld+lo/lo boundary near 27.5 mol% ergosterol. To determine this boundary, we drew a line through the points for 20 and 25 mol% ergosterol (or 25 and 27.5 mol%) and fitted another line to the points between 27 and 42 mol% ergosterol (or 30 and 42 mol%). The ld+lo/lo boundary is then obtained from the intercept of the two lines. In principle there should be a similar change in slope at low ergosterol concentrations, reflecting crossing the ld/ld+lo phase boundary. However, these slope changes are less obvious than those at the ld+lo/lo boundary. Thus, the ld/ld+lo phase boundary has instead been determined by direct examination of the spectra (see discussion of Fig. 8).
FIGURE 6.
M1 as a function of ergosterol concentration for DPPC-d31/ergosterol at: 41°C (•); 42°C (⋄); 43°C (▪); 44°C (⊗); 45°C (▴); 47°C (○); 48°C (▾); 49°C (□); 50°C (♦); 53°C (▵); 57°C (⊕). The lines are guides to the eye.
FIGURE 8.
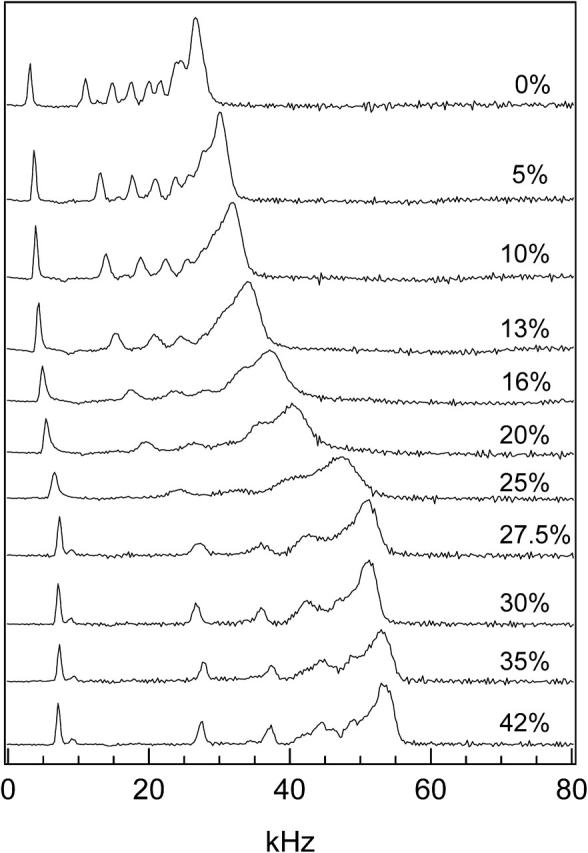
The depaked spectra of DPPC-d31/ergosterol as a function of ergosterol concentration at T = 45°C.
The T = 41°C curve in Fig. 6 levels off at an ergosterol concentration of ∼27.5 mol%, implying that at 41°C the labeled DPPC chain has reached its maximum sterol-enhanced order. As noted above, the T = 57°C curve behaves differently from the others; in particular the value of M1 increases steadily with increasing ergosterol concentration all the way to 42 mol% ergosterol, implying no crossing of the phase boundary.
Another approach to determining the ld+lo/lo boundary is by examining the temperature-dependent variation in width of individual Pake doublet peaks. This is best done using depaked spectra. Fig. 7 shows the depaked spectra of 25 mol% ergosterol from 37°C, where the membrane is in the lo phase, to 60°C, where the membrane is in the ld phase. There is a slow decrease in the quadrupolar splittings from T = 37–41°C. The individual peaks in the spectrum remain sharp. Above 41°C, the individual peaks broaden significantly and the quadrupolar splittings decrease faster as a function of temperature, indicating membrane heterogeneity in the form of ld+lo phase coexistence. Lipids diffusing between ld and lo domains with a rate faster than the NMR timescale will yield spectra having broadened individual peaks. As this MLD is heated, a phase boundary reflecting the onset of ld+lo phase coexistence occurs around 41°C. The broad individual peaks persist at higher temperatures until at 53°C the individual peaks become narrow again, implying that the membrane no longer displays ld+lo phase coexistence. The individual peaks remain narrow at higher temperatures and the rate of decrease in the quadrupolar splittings as a function of temperature slows down. Thus, a second phase boundary (from ld+lo to a single liquid crystalline phase) occurs around 53°C. Similar analysis of the 72.5:27.5 DPPC-d31/ergosterol MLD's spectra yielded phase boundaries for the ld+lo coexistence region at 43 and 50°C.
More insight into the ld+lo phase coexistence region is gained by examining the depaked spectra as a function of ergosterol concentration at a temperature above Tm. An example of the variations in spectral width and sharpness of individual peaks at 45°C is given in Fig. 8. At low ergosterol concentrations (≤10 mol%) the spectral lines are sharp. They blur from 13 to 27.5 mol% ergosterol (and the spectral width also increases rapidly for this concentration range) and are sharp again at ergosterol concentrations ≥30 mol%. These “blurry” spectra are further analyzed below. Thus, the ld/ld+lo phase boundary lies between 10 and 13 mol% ergosterol and the ld+lo/lo phase boundary between 27.5 and 30 mol% ergosterol.
Fig. 9 shows the DSC scans of DPPC/ergosterol membranes. Pure DPPC displays a sharp main transition (so to ld transition) near 41.5°C. At 5 mol% ergosterol, the main transition becomes broadened and shifts toward lower temperature. The DSC behavior of the 0 and 5 mol% ergosterol MLDs are consistent with the NMR data discussed in the previous paragraph. The broad transition in the 5 mol% ergosterol membrane indicates a so and ld phase coexistence region. As ergosterol concentration increases from 10 to 20 mol%, the intensity of the main peak decreases, but the peak position seems to remain unchanged. A broad shoulder appears on the high-temperature side of the sharp peak, suggesting a two-phase region. We obtained the ld+lo/ld phase boundary by finding the temperatures where the broad peak ends (Vist and Davis, 1990). At concentrations of ergosterol at 30 mol% and above a very broad residual endotherm is observed, similar to that seen in DPPC/cholesterol MLDs.
FIGURE 9.
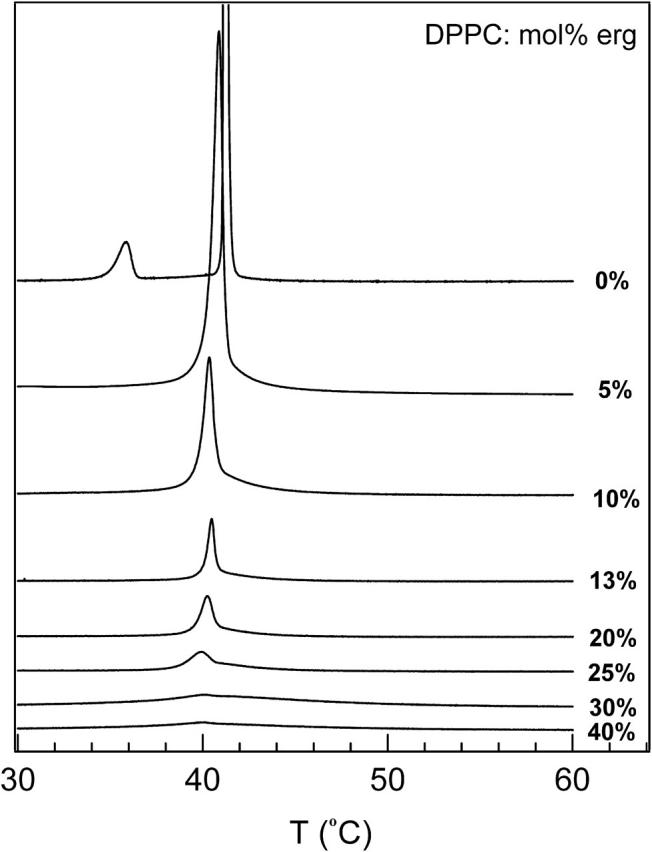
DSC scans of DPPC/ergosterol. Note that to compare DSC with NMR data one must shift the DSC temperature by −2°C, given the fact that DPPC chain deuteration reduces the transition temperature by 2°C.
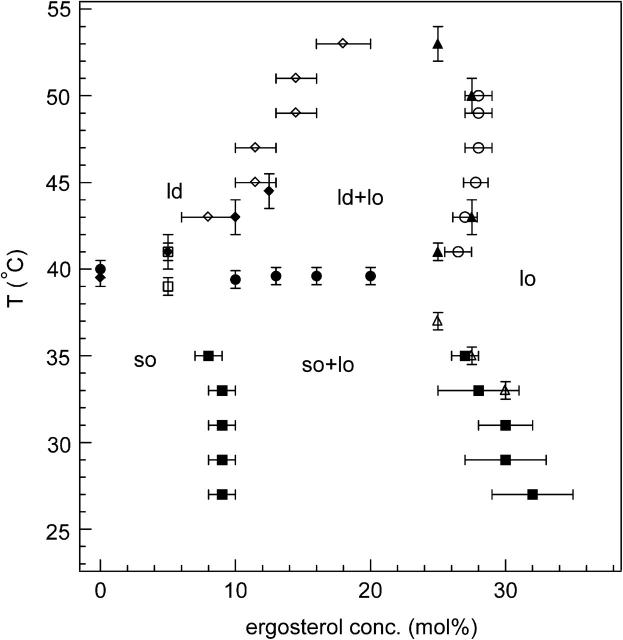
The partial phase diagram for DPPC-d31/ergosterol determined from the characteristic phase transition temperatures and the corresponding lipid compositions as discussed above is shown in Fig. 10. The ld/ld+lo boundary (open diamonds), determined from the spectral changes described in Fig. 8 is consistent with that obtained from the DSC data (solid diamonds). The ld+lo/lo boundary in Fig. 10 is determined from the changes of slope in the M1 versus ergosterol concentration curves (Fig. 6), as well as by examining the temperature-dependent changes in the depaked spectra of 25 and 27.5 mol% ergosterol as discussed earlier (Fig. 7). These two sets of data are quite consistent and agree with the boundary obtained by examining the changes in the ergosterol-dependent depaked spectra discussed in Fig. 8. The boundaries of the so+lo phase coexistence region (solid squares) are obtained using the well-established spectral subtraction method, described in detail in Materials and Methods. The open triangles, obtained from the onset of the transition in the M1(T) curves MLDs having high ergosterol concentrations in Fig. 5, define the so+lo/lo boundary, consistent with the data obtained from spectral subtraction.
FIGURE 10.
Partial phase diagram of the DPPC/ergosterol membrane. Midpoint of the transition from M1(T) curves (Fig. 5) (•); onset or end of transition in M1(T) curves (□); obtained by inspection of the depaked spectra versus ergosterol concentration (Fig. 8) (⋄); end of transition in DSC data (shifted by −2°C) (♦); obtained by inspection of the depaked spectra versus temperature (Fig. 7) (▴); obtained from M1(ergosterol) curves (Fig. 6) (○); obtained from spectral subtraction (▪); the onset of transition in M1(T) curves for MLDs having ergosterol concentrations of 25, 27.5, or 30 mol% (▵).
We have identified three two-phase regions and a three-phase line in the DPPC/ergosterol partial phase diagram, as shown in Fig. 10. There is a so+ld phase coexistence region at ∼40°C between 0 and ∼9 mol% ergosterol. There is a so+lo phase coexistence region below 39.5°C between ∼9 mol% ergosterol and 25–32 mol% ergosterol and a ld+lo phase coexistence region above 39.5°C between 10–15 mol% ergosterol and 25–28 mol% ergosterol. The upper bound of the ld+lo phase coexistence region lies in the neighborhood of 53°C, consistent with the discussion regarding Fig. 6. The boundary separating the so+lo and ld+lo regions is a so+ld+lo three-phase coexistence line at 39.5°C.
We compare the partial phase diagram of DPPC-d31/ergosterol with that of DPPC-d62/cholesterol by Vist and Davis (1990). Both diagrams contain a three-phase line and three two-phase regions. (Note that Huang et al., 1993 used 13C-NMR and DSC data to construct a similar phase diagram for PC-cholesterol but with a different interpretation for the phase behavior in terms of microdomain formation and continuous phase transitions.) The so/so+lo boundary lies close to 9 mol% for DPPC-d31/ergosterol and around 7 mol% for DPPC-d62/cholesterol, which are consistent within error. However, the so+lo/lo boundaries are quite different. The so+lo/lo boundary of DPPC-d62/cholesterol occurs around 22.5 mol% and is nearly vertical. The boundary of the so+lo/lo two-phase region characterizes the composition of lo domains within the two-phase region. A nearly vertical boundary indicates that the composition of lo domains depends only slightly on temperature. On the other hand, because the so+lo/lo boundary of DPPC-d31/ergosterol slopes from 25 mol% near Tm toward 32 mol% at 27°C, the composition of lo domains depends strongly on temperature. The ergosterol concentration required to form lo-phase domains in the DPPC-d31/ergosterol membrane is greater than the cholesterol concentration required to form lo-phase domains in the DPPC-d62/cholesterol membrane, i.e., more ergosterol than cholesterol is needed to obtain the lo phase. Thus, per molecule, ergosterol is less effective than cholesterol in promoting the lo phase in so-phase DPPC bilayers.
The ld+lo phase coexistence region in DPPC/ergosterol is larger than that in DPPC/cholesterol. The ld+lo/lo boundary of DPPC/ergosterol is located around 27.5 mol%, whereas that of DPPC/cholesterol lies around 22.5 mol%, implying that more ergosterol than cholesterol is needed to obtain lo-phase domains in the ld-phase DPPC bilayers. Thus ergosterol is less effective than cholesterol in promoting the lo phase in the ld-phase DPPC bilayers. Our observation of spectral line broadening in the ld+lo phase coexistence region of DPPC-d31/ergosterol (Fig. 8) indicates that the diffusing labeled lipids sample a heterogeneous membrane on the 2H NMR timescale (τ ≅ 10 μs). Taking the translational diffusion coefficient to be ∼10−11 m2/s (based on measurements in DMPC/cholesterol by Filippov et al., 2003) the root mean squared displacement of the DPPC, calculated from
 |
(5) |
in this time is 20 nm. This rough estimate implies nanoscale separation between sterol-rich and sterol-poor regions, as was proposed for cell membranes by Varma and Mayor (1998). Such small length scales are consistent with the lack of observation of micron-sized phase-separated domains in binary phospholipid/cholesterol giant unilamellar vesicles (Veatch and Keller, 2003).
We now estimate the size of the domains involved in this ld+lo nanoscale phase coexistence by applying the method commonly used to understand A↔B chemical exchange, replacing chemical shifts by quadrupole splittings. The lipid exchange time is
 |
(6) |
where k−1 is the rate constant characterizing lipid exchange between lo and ld domains (k−1 is assumed to be equal to k). This rate constant is obtained from
 |
(7) |
(Carrington and McLachlan, 1967), where fA and fB are fractions of spins in the lo and ld domains, respectively, ΔδAB = ΔδA − ΔδB is the difference of the quadrupolar splittings in the two states, and T2, obs, T2A, and T2B can be obtained from the linewidths Δν of individual peaks (1/T2 = π Δν). We chose the C15 peaks for this calculation because they are well resolved. Thus,
 |
(8) |
where ΔνQ, lo and ΔνQ, ld are the quadrupole splittings of the C15 doublets for the pure lo (30 mol% ergosterol) and pure ld (10 mol% ergosterol) spectra, respectively. For T = 45°C, ΔδAB = 26,730 − 13,920 = 12,810 Hz. The rate constants T2, obs, T2A, and T2B are calculated below:
 |
(9a) |
 |
(9b) |
 |
(9c) |
where Δνlo+ld, Δνlo, and Δνld are the widths at half maximum height of the individual C15 peaks in the depaked lo+ld spectra (13, 16, 20, and 25 mol% ergosterol), pure lo spectrum(30 mol% ergosterol), and pure ld spectrum (10 mol% ergosterol), respectively. Thus, for T = 45°C
 |
(10a) |
 |
(10b) |
and Table 1 lists the results of these calculations for lo+ld membranes.
TABLE 1.
A list of Δνlo+ld, fA, fB values and calculated results τ, (〈Δx2〉)1/2
| Mol% ergosterol | Δνlo+ld (Hz) | fA (i.e., flo) | fB (i.e., fld) | τ (s) | (〈Δx2〉)1/2 (m) |
|---|---|---|---|---|---|
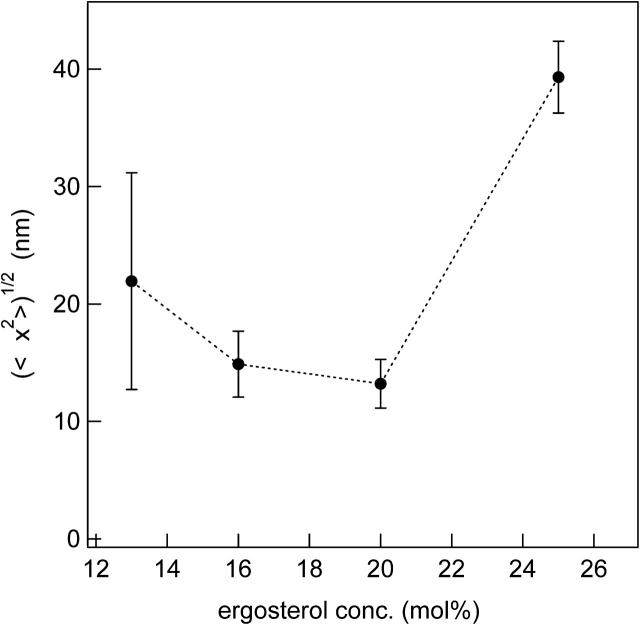
| 13 | 1380 | 0.09 | 0.91 | 1.20 × 10⁻⁵ | 2.2 × 10⁻⁸ |
| 16 | 2010 | 0.28 | 0.72 | 5.53 × 10⁻⁶ | 1.5 × 10⁻⁸ |
| 20 | 2250 | 0.52 | 0.48 | 4.36 × 10⁻⁶ | 1.3 × 10⁻⁸ |
| 25 | 4360 | 0.83 | 0.17 | 3.86 × 10⁻⁵ | 3.9 × 10⁻⁸ |
The root mean squared distance (〈Δx2〉)1/2 traveled by DPPC-d31 before it senses lo/ld heterogeneity is plotted as a function of ergosterol concentration in Fig. 11. It is roughly U-shaped, which is reasonable given the likelihood of fewer lo/ld interfaces being found for membrane compositions near the boundaries of the lo+ld coexistence region of the phase diagram. Note that if a more detailed estimate of the mean lateral diffusion coefficient had been used in the final calculation of (〈Δx2〉)1/2 the fact that the diffusion constant in the ld phase is greater than the diffusion constant in the lo phase would result in a larger root mean squared displacement for lower ergosterol concentrations and a more symmetric U-shape. The length scale characterizing the domains is estimated to be twice (〈Δx2〉)1/2, i.e., 30–80 nm, depending on sterol content. We have no information on domain shape, however, and because a highly convoluted domain is possible if the energy associated with interfacial lipids is negligible, we cannot estimate the number of lipids constituting a domain. Interestingly, Veatch et al. (2004) estimated domain sizes of ∼80 nm in dioleoylphosphatidylcholine/DPPC (1:1) + 30 mol% cholesterol membranes displaying liquid/liquid coexistence at 25°C.
FIGURE 11.
The root mean squared distance (〈Δx2〉)1/2 diffused by DPPC-d31 as a function of ergosterol concentration at T = 45°C. The lines are guides to the eye.
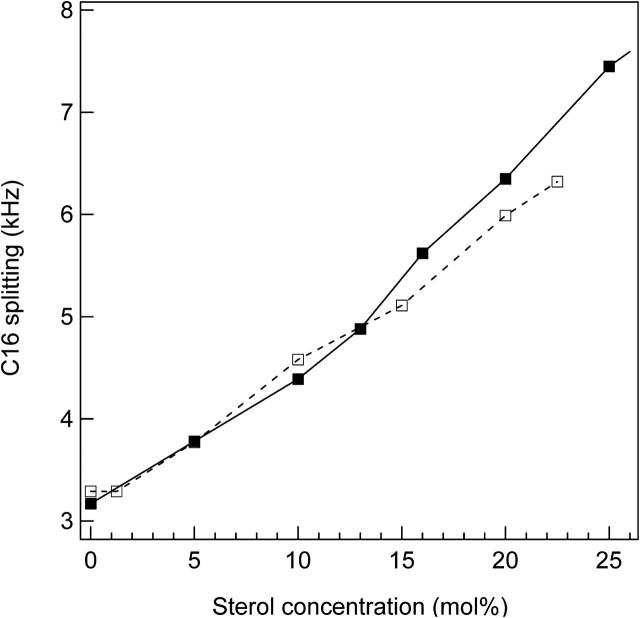
We now compare the effect of ergosterol and cholesterol on the acyl chain order parameter of liquid phase DPPC. This was accomplished by measuring the CD3 (C16) splitting of DPPC-d31/ergosterol and DPPC-d62/cholesterol. Fig. 12 shows that below 13 mol% sterol, where the membranes are in the ld phase, there is no difference in the ordering of the two DPPC/sterol membranes. This is consistent with the simulation results of Smondyrev and Berkowitz (2001) at 11 mol % sterol. On the other hand, at sterol concentrations >13 mol%, the C16 splitting of DPPC-d31/ergosterol is greater than that of DPPC-d62/cholesterol. This indicates that the chain ordering of ergosterol-containing membranes is larger than that of cholesterol-containing membranes; the ergosterol structure inhibits DPPC chain conformational freedom even more than does cholesterol. Therefore, in the ld+lo phase coexistence and the lo phase states, ergosterol orders DPPC chains more effectively than cholesterol. This result is consistent with the findings of Urbina et al. (1995) using 70:30 DMPC/sterol.
FIGURE 12.
The quadrupolar splitting of the CD3 doublet as a function of sterol concentration. DPPC-d31/ergosterol at 42°C (▪); DPPC-d62/cholesterol at 40°C (□). The lines are guides to the eye.
CONCLUSIONS
Similar to cholesterol, adding ergosterol to DPPC increases the average lipid chain order in the liquid crystalline phase and interferes with the membrane's ability to form the so (or gel) phase below Tm. In the ld phase, ergosterol is no more effective than cholesterol in ordering DPPC chains. In regions of ld+lo phase coexistence and in the lo phase, ergosterol orders DPPC chains more effectively than cholesterol. On the other hand, ergosterol is less effective than cholesterol in promoting lo-phase domains in ld (and so) DPPC bilayers. Therefore, compared to cholesterol, ergosterol is more effective in inducing chain conformational order although less effective in promoting lateral packing order in the liquid phase. It is of interest that the sterols affect conformational and lateral packing order differently; the interaction between sterol and lipid molecules is of dual nature.
A partial phase diagram was obtained from the NMR spectra and the DSC thermograms. It exhibits both so+lo and ld+lo coexistence regions with a clear three-phase line separating them. In contrast to earlier NMR phase diagram determinations, we have been able in this study to definitively locate and characterize the ld+lo phase coexistence region. Our observation of ld+lo phase coexistence provides evidence that two liquid crystalline phases can coexist even in model membranes containing no proteins. Thus, rafts in cell membranes may be strongly influenced by lipid/lipid interactions. Distances between ld/lo domain interfaces of 30–80 nm are typical of DPPC/ergosterol membranes. Such dimensions are also typical of “rafts” in cell membranes (Kusumi et al., 2004).
Acknowledgments
We are grateful to Markus Vist and Jim Davis for sending us their unpublished DPPC-d62/cholesterol data and to Ole Mouritsen for “domain” discussions. M.J.Z. is most grateful for discussions with Kevin Barrow, Hans Coster, and Milan Hoefer; important correspondence from Guenther Daum; and both discussions and detailed correspondence related to earlier research from Till Boecking. J.T. thanks Chris Beh for his input on yeast membranes.
This work was supported by research grants from the Natural Sciences and Engineering Research Council of Canada. MEMPHYS-Center for Biomembrane Physics is supported by the Danish National Research Foundation.
Ya-Wei Hsueh's present address is Dept. of Physics, National Central University, Chungli 320, Taiwan.
Kyle Gilbert's present address is Dept. of Physics, University of Western Ontario, London, Ontario, Canada N6A 5B8.
References
- Bagnat, M., A. Chang, and K. Simons. 2001. Plasma membrane proton ATPase Pma1p requires raft association for surface delivery in yeast. Mol. Biol. Cell. 12:4129–4138. [DOI] [PMC free article] [PubMed] [Google Scholar]
- Bagnat, M., S. Keranen, A. Shevchenko, and K. Simons. 2000. Lipid rafts function in biosynthetic delivery of proteins to the cell surface in yeast. Proc. Nat. Acad. Sci. USA 97:3254–3259. [DOI] [PMC free article] [PubMed] [Google Scholar]
- Bottema, C. D. K., R. J. Rodriguez, and L. W. Parks. 1985. Influence of sterol structure on yeast plasma membrane properties. Biochim. Biophys. Acta. 813:313–320. [DOI] [PubMed] [Google Scholar]
- Carrington, A., and A. D. McLachlan. 1967. Introduction to Magnetic Resonance. Harper & Row, New York, NY.
- Davis, J. H., K. R. Jeffrey, M. Bloom, M. I. Valic, and T. P. Higgs. 1976. Quadrupolar echo deuteron magnetic resonance spectroscopy in ordered hydrocarbon chains. Chem. Phys. Lett. 42:390–394. [Google Scholar]
- Eisenkolb, M., C. Zenzmaier, E. Leitner, and R. Schneiter. 2002. A specific structural requirement for ergosterol in long chain fatty acid synthesis mutants important for maintaining raft domains in yeast. Mol. Biol. Cell. 13:4414–4428. [DOI] [PMC free article] [PubMed] [Google Scholar]
- Endress, E., S. Bayerl, K. Prechtel, C. Maier, R. Merkel, and T. M. Bayerl. 2002. The effect of cholesterol, lanosterol, and ergosterol on lecithin bilayer mechanical properties at molecular and microscopic dimensions: a solid-state NMR and micropipet study. Langmuir. 18:3293–3299. [Google Scholar]
- Filippov, A., G. Orädd, and G. Lindblom. 2003. The effect of cholesterol on the lateral diffusion of phospholipids in oriented bilayers. Biophys. J. 84:3079–3086. [DOI] [PMC free article] [PubMed] [Google Scholar]
- Huang, T. H., C. W. Lee, S. K. Das Gupta, A. Blume, and R. G. A. Griffin. 1993. A 13C and 2H nuclear magnetic resonance study of phosphatidylcholine/cholesterol interactions: characterization of liquid-gel phases. Biochemistry. 32:13277–13287. [DOI] [PubMed] [Google Scholar]
- Ipsen, J. H., G. Karlstrom, O. G. Mouritsen, H. Wennerstrom, and M. J. Zuckermann. 1987. Phase-equilibria in the phosphatidylcholine-cholesterol system. Biochim. Biophys. Acta. 905:162–172. [DOI] [PubMed] [Google Scholar]
- Kuebler, E., H. G. Dohlman, and M. P. Lisanti. 1996. Identification of Triton X-100 insoluble membrane domains in the yeast Saccharomyces cerevisiae. J. Biol. Chem. 271:32975–32980. [DOI] [PubMed] [Google Scholar]
- Kusumi, A., I. Koyama-Honda, and K. Suzuki. 2004. Molecular dynamics and interactions for creation of stimulation-induced stabilized rafts from small unstable steady-state rafts. Traffic. 5:213–230. [DOI] [PubMed] [Google Scholar]
- Lafleur, M., B. Fine, E. Sternin, P. R. Cullis, and M. Bloom. 1989. Smoothed orientational order profile of lipid bilayers by 2H-nuclear magnetic resonance. Biophys. J. 56:1037–1041. [DOI] [PMC free article] [PubMed] [Google Scholar]
- Longley, R. P., A. H. Rose, and B. A. Knights. 1968. Composition of the protoplast membrane from Saccharomyces cerevisiae. Biochem. J. 108:401–412. [DOI] [PMC free article] [PubMed] [Google Scholar]
- Ohvo-Rekilä, H., B. Ramstedt, P. Leppimäki, and J. P. Slotte. 2002. Cholesterol interactions with phospholipids in membranes. Prog. Lipid Res. 41:66–97. [DOI] [PubMed] [Google Scholar]
- Patton, J. L., and R. L. Lester. 1991. The phosphoinositol sphingolipids of Saccharomyces cerevisiae are highly localized in the plasma membrane. J. Bacteriol. 173:3101–3108. [DOI] [PMC free article] [PubMed] [Google Scholar]
- Rodriguez, R. J., C. Low, C. D. Bottema, and L. W. Parks. 1985. Multiple functions for sterols in Saccharomyces cerevisiae. Biochim. Biophys. Acta. 837:336–343. [DOI] [PubMed] [Google Scholar]
- Schneiter, R., B. Brügger, R. Sandhoff, G. Zellnig, A. Leber, M. Lampl, K. Athenstaedt, C. Hrastnik, S. Eder, G. Daum, F. Paltauf, F. T. Wieland, and S. D. Kohlwein. 1999. Electrospray ionization tandem mass spectrometry (ESI-MS/MS) analysis of the lipid molecular species composition of yeast subcellular membranes reveals acyl chain-based sorting/remodeling of distinct molecular species en route to the plasma membrane. J. Cell Biol. 146:741–754. [DOI] [PMC free article] [PubMed] [Google Scholar]
- Smondyrev, A. M., and M. L. Berkowitz. 2001. Molecular dynamics simulation of the structure of dimyristoylphosphatidylcholine bilayers with cholesterol, ergosterol, and lanosterol. Biophys. J. 80:1649–1658. [DOI] [PMC free article] [PubMed] [Google Scholar]
- Thewalt, J. L., and M. Bloom. 1992. Phosphatidylcholine: cholesterol phase diagrams. Biophys. J. 63:1176–1181. [DOI] [PMC free article] [PubMed] [Google Scholar]
- Tuller, G., T. Nemec, C. Hrastnik, and G. Daum. 1999. Lipid composition of subcellular membranes of an FY1679-derived haploid yeast wild-type strain grown on different carbon sources. Yeast. 15:1555–1564. [DOI] [PubMed] [Google Scholar]
- Urbina, J. A., S. Pekerar, H. B. Le, J. Patterson, B. Montez, and E. Oldfield. 1995. Molecular order and dynamics of phosphatidylcholine bilayer membranes in the presence of cholesterol, ergosterol and lanosterol: a comparative study using 2H-, 13C- and 31P-NMR spectroscopy. Biochim. Biophys. Acta. 1238:163–176. [DOI] [PubMed] [Google Scholar]
- Varma, R., and S. Mayor. 1998. GPI-anchored proteins are organized in submicron domains at the cell surface. Nature. 394:798–801. [DOI] [PubMed] [Google Scholar]
- Veatch, S., and S. Keller. 2003. Separation of liquid phases in giant vesicles of ternary mixtures of phospholipids and cholesterol. Biophys. J. 85:3074–3083. [DOI] [PMC free article] [PubMed] [Google Scholar]
- Veatch, S. L., I. V. Polozov, K. Gawrisch, and S. L. Keller. 2004. Liquid domains in vesicles investigated by NMR and fluorescence microscopy. Biophys. J. 86:2910–2922. [DOI] [PMC free article] [PubMed] [Google Scholar]
- Vist, M., and J. H. Davis. 1990. Phase equilibria of cholesterol/dipalmitoylphosphatidylcholine mixtures: 2H nuclear magnetic resonance and differential scanning calorimetry. Biochemistry. 29:451–464. [DOI] [PubMed] [Google Scholar]
- Xu, X., R. Bittman, G. Duportail, D. Heissler, C. Vilcheze, and E. London. 2001. Effect of the structure of natural sterols and sphingolipids on the formation of ordered sphingolipid/sterol domains (rafts). Comparison of cholesterol to plant, fungal, and disease-associated sterols and comparison of sphingomyelin, cerebrosides, and ceramide. J. Biol. Chem. 276:33540–33546. [DOI] [PubMed] [Google Scholar]
- Zinser, E., F. Paltauf, and G. Daum. 1993. Sterol composition of yeast organelle membranes and subcellular distribution of enzymes involved in sterol metabolism. J. Bacteriol. 175:2853–2858. [DOI] [PMC free article] [PubMed] [Google Scholar]
- Zinser, E., C. D. Sperka-Gottlieb, E. V. Fasch, S. D. Kohlwein, F. Paltauf, and G. Daum. 1991. Phospholipid synthesis and lipid composition of subcellular membranes in the unicellular eukaryote Saccharomyces cerevisiae. J. Bacteriol. 173:2026–2034. [DOI] [PMC free article] [PubMed] [Google Scholar]


