

Abstract
Obstructed long-range lateral diffusion of phospholipids (TRITC-DHPE) and membrane proteins (bacteriorhodopsin) in a planar polymer-tethered 1-stearoyl-2-oleoyl-sn-glycero-3-phosphocholine bilayer is studied using wide-field single molecule fluorescence microscopy. The obstacles are well-controlled concentrations of hydrophobic lipid-mimicking dioctadecylamine moieties in the polymer-exposed monolayer of the model membrane. Diffusion of both types of tracer molecules is well described by a percolating system with different percolation thresholds for lipids and proteins. Data analysis using a free area model of obstructed lipid diffusion indicates that phospholipids and tethered lipids interact via hard-core repulsion. A comparison to Monte Carlo lattice calculations reveals that tethered lipids act as immobile obstacles, are randomly distributed, and do not self-assemble into large-scale aggregates for low to moderate tethering concentrations. A procedure is presented to identify anomalous subdiffusion from tracking data at a single time lag. From the analysis of the cumulative distribution function of the square displacements, it was found that TRITC-DHPE and W80i show normal diffusion at lower concentrations of tethered lipids and anomalous diffusion at higher ones. This study may help improve our understanding of how lipids and proteins in biomembranes may be obstructed by very small obstacles comprising only one or very few molecules.
INTRODUCTION
The fluid mosaic model describes a plasma membrane as a fluid lipid matrix with embedded membrane proteins (Singer and Nicholson, 1972). Since 1972 our view of a biomembrane has shifted significantly to that of a highly complex, compartmentalized system with a broad range of dynamic processes (Sako and Kusumi, 1994; Jacobson et al., 1995; Sheets et al., 1995; Edidin et al., 1991; Feder et al., 1996; Kusumi et al., 1998). The heterogeneous membrane structure and the resulting dynamics critically impact several important biological functions in cells including signal transduction, cell-cell recognition, and caveolar transport processes (Edidin, 1997, 2001; Verkade and Simons, 1997; Maxfield, 2002). Consequently, there has been much effort to derive general biophysical principles that link the organization, dynamics, and functionality of biomembranes.
The exploration of the hindered diffusion of lipids and proteins in membranes is a crucial step in this process. The diffusion coefficient in biomembranes is reduced by 1–2 orders of magnitude compared with model membrane systems (Webb et al., 1981; Edidin, 1996). This discrepancy is due to multiple processes acting in parallel to modify diffusion, including hydrodynamic interactions, lipid viscosity, aggregate formation, binding to the cytoskeleton, and obstruction (Saxton, 1999). In fact, cellular studies allowed a qualitative analysis concerning the hindrance of lipid and protein diffusion caused by the cytoskeleton (Sheetz et al., 1980; Tsuji and Ohnishi, 1986; Sako and Kusumi, 1995; Fujiwara et al., 2002) and extracellular matrix (Livneh et al., 1986; Zhang et al., 1991; Jacobson et al., 1997).
The hindrance of diffusion of lipids and proteins by small obstacles embedded in the lipid bilayer is more difficult to address. Such obstacles may be created by binding of membrane proteins and lipids to the cytoskeleton or extracellular matrix, by small lipid domains, or by crowding of mobile membrane proteins. The main experimental problem is that the area fraction of obstacles in cellular membranes is not known. To overcome this limitation, experimental studies have been mainly focusing on model membrane systems characterized by well-controlled area fractions of obstacles. Two types of model systems have been used to study obstructed diffusion, i.e., two-phase lipid systems (Almeida et al., 1992a,b; Ratto and Longo, 2002) and mobile proteins in lipids (Peters and Cherry, 1982; Tank et al., 1982; Blackwell and Whitmarsh, 1990).
Theoretical models of obstructed diffusion have been studied extensively (Pink et al., 1986; Saxton, 1987, 1993a, b; Scalletar and Abney, 1991). The models assume that tracers and obstacles interact either via hard-core repulsion or via hard-core plus soft repulsions. In the case of hard-core repulsion, several theoretical approaches have been pursued, including Monte Carlo calculations (Saxton, 1987, 1993a, b), free-volume models (Almeida et al., 1992a; Tocanne et al., 1994; Schram et al., 1996), and hydrodynamic models (Bussell et al., 1995; Dodd et al., 1995). With the exception of very small proteins, such as the 2-kDa gramicidin (Blackwell and Whitmarsh, 1990), the agreement between these hard-core repulsion-based theories and experimental data in model systems is rather poor. To overcome these discrepancies, Almeida et al. (1992b) introduced a modified free-volume model which adds to the hard-core potential a soft repulsive component due to a layer of ordered lipids surrounding obstacles (Almeida et al., 1992b). Such boundary layers have been discussed by other groups as well (Sperotto and Mouritsen, 1991; Jaehnig, 1981). Though the additional model parameter led to a better agreement between theory and experiment, there are still open questions. In particular, reported values on the thickness of the boundary layer vary among different types of obstacles (Almeida et al., 1992b; Blackwell and Whitmarsh, 1990; Ratto and Longo, 2002).
Here we present for the first time an experimental comparison to theoretical predictions concerning the lateral diffusion of lipids and proteins obstructed by very small obstacles of polymer-tethered lipids, which consist of either individual lipids or small aggregates of just a few lipids. We hypothesize that glycolipids, GPI-anchored proteins, and membrane proteins with a single membrane-spanning α-helical structure may obstruct membrane lateral mobility in the plasma membrane similarly via coupling to the glycocalyx, extracellular matrix, or cytoskeleton. Therefore, this study may shed light into the biophysical mechanisms of obstructed diffusion caused by tethering.
MATERIALS AND METHODS
The lipopolymer dioctadecylamine [poly(ethyloxazoline) 8988] (DODA-E85) was synthesized following a procedure described recently (Lehmann, 1999). The phospholipid, 1-stearoyl-2-oleoyl-sn-glycero-3-phosphocholine (SOPC) and the fluorescently labeled phospholipid, N-(6-tetramethylrhodaminethiocarbamoyl)-1,2-dihexadecanoyl-sn-glycero-3-phosphoethanolamine, triethylammonium salt (TRITC-DHPE), were purchased from Avanti Polar Lipids (Alabaster, AL) and Molecular Probes (Eugene, OR), respectively. Two forms of bacteriorhodopsin (BR) were employed in this study, wild-type BR and the BR mutant W80i. The mutant was chosen because it is less prone to aggregation (Haupts et al., 1999). Protein purification was conducted on a sucrose gradient following standard procedures (Oesterhelt and Stoeckenius, 1974). Chloroform (HPLC grade, Fisher Scientific, Pittsburgh, PA) was used as a spreading solvent for preparing SOPC and SOPC/DODA-E85 monolayers at the air-water interface and Milli-Q water (pH = 5.5, 18 MΩ-cm resistivity; Milli-Q, Millpore, Billerica, MA) was used as a subphase material for all experiments.
A detailed description of the preparation of a polymer-tethered phospholipid bilayer, which is illustrated in Fig. 1, was recently provided elsewhere (Naumann et al., 2002). In short, microscopy coverslips were cleaned by baking at 515°C in a kiln for 1 h followed by sonication for 30 min each in the following solutions: 1% SDS, methanol saturated with NaOH, and 0.1% HCl using a bath sonicator. After each step, the coverslips were rinsed with Milli-Q water. To assure the removal of all non-aqueous components, the last Milli-Q rinsing step was very extensive. Cleaned glass slides were stored in Milli-Q water until used. Accurate control of the tethering density at the polymer-lipid interface was achieved by preparing SOPC/DODA-E85 mixed monolayers of specific lipopolymer molecular concentrations at the air-water interface. By using a film balance with dipper (Labcon, Darlington, UK), the films could be transferred from the air-water interface to the glass substrate using Langmuir-Blodgett film deposition. Note that, in contrast to previous experiments, where photo-crosslinker molecules were used to covalently link the polymer film to the solid substrate (Naumann et al., 2002), polymers in this study are physisorbed to the glass substrate. The film pressure was adjusted at ∼30 mN/m to obtain an average area per lipid of Alipid = 65 Å2. A constant value of Alipid for all tethering concentrations investigated is essential because the lateral diffusion of phospholipids is described by a free area model, which predicts a change in D for different values of Alipid (Traeuble and Sackmann, 1972; Galla et al., 1979). The polymer-tethered phospholipid bilayer was completed by transferring an SOPC monolayer at Alipid = 65 Å2 from the air-water interface to the Langmuir-Blodgett monolayer using Schaefer transfer technique or by fusing small unilamellar vesicles (either SOPC vesicles or bacteriorhodopsin-containing SOPC proteosomes) to the SOPC/DODA-E85 Langmuir-Blodgett film. To form small unilamellar vesicles, SOPC vesicles were sonicated with a rod sonifier (Branson Ultrasonics, Danbury, CT) until the sample was opalescent. To remove titanium dust, the sonicated sample was centrifuged at 2000 rpm for 5 min using a tabletop centrifuge. Bacteriorhodopsin-containing proteosomes were formed via spontaneous incorporation of bacteriorhodopsin into preformed vesicles (Scotto and Gompper, 1990). In this case, BR molecules (wild-type or W80i) were incorporated into SOPC vesicles by adding the membrane preparation of W80i or wild-type BR to the vesicle solution under quick vortexing. BR-containing proteosomes were fused on the SOPC/DODA-E85 Langmuir-Blodgett film within 30 min. Finally, the sample was rinsed extensively to remove excess proteosomes that did not fuse.
FIGURE 1.

Schematic illustration of the polymer-tethered phospholipid bilayer consisting of glass substrate, polymer cushion, and covalently tethered phospholipid bilayer. The covalent tethering at the polymer-bilayer interface is achieved via lipopolymer molecules. In the current study phospholipids and lipopolymers used are 1-stearoyl-2-oleoyl-3-glycero-phosphorylcholine (SOPC) and dioctadecylamine [poly(ethyloxazoline) 8988] (DODA-E85), respectively.
Our single-molecule fluorescence imaging setup was used as previously described (Ke and Naumann, 2001a,b). In short, a 200-mW frequency-doubled Nd:YAG laser (wavelength: 532 nm) was used as an excitation source. The laser beam was spatially filtered and delivered to the EPI port of an inverted microscope (Zeiss Axiovert S100TV, Zeiss, Oberkochen, Germany). Then the beam was reflected by a dichroic mirror (Omega XF1051, Omega Optical, Brattleboro, VT) and focused by a microscope objective (Zeiss, oil immersion, 100× NA = 1.3). The optical power was set so that the light intensity at the focus of the microscope objective was ∼1.6 kW/cm2. To control photobleaching of the sample irradiated by the laser beam, a Uniblitz shutter (VMM-D1) of 3-mm open aperture was used. The fluorescence signal, centered at 566 nm, was passed through a 2.5× magnification lens and refocused to an intensified charge-coupled device camera (iPentaMAX 512EFT, Princeton Instruments, Roper Scientific, Trenton, NJ) mounted at the TV port of the microscope. The excitation light was blocked out by the combination of a Raman filter (Omega 540ELP) and the dichroic mirror. The temperature and the gain of the camera were set at −22°C and 95.0, respectively. The exposure time and the frame rate of the charge-coupled device camera were chosen to be 10 ms and 16.7 frames/s while synchronized with the Uniblitz shutter.
Image recording and single molecule tracking were acquired using Isee imaging software (Isee Imaging Systems, Raleigh, NC) running on a Linux platform. The mean-square displacement, 〈r2〉, for individual phospholipid molecules can be calculated as a function of time lag tlag, as described previously (Kusumi et al., 1993; Schmidt et al., 1995),
 |
(1) |
where  and
and  are the position vectors of the tracer molecule at times ti and tj, respectively. For Brownian diffusion, the lateral diffusion coefficient D can be obtained from the average value of the individual displacements 〈r2〉 with
 |
(2) |
For our experiment, the positional change of individual molecules was analyzed for each successive frame separately using a constant time lag of tlag = 50 ms. The time lag was set by the time of closed shutters between successive exposures (open shutters). To assure statistical significance, each sample was analyzed using 150 time steps of the same tlag = 50 ms. This approach was chosen because photobleaching of the label limits the number of position measurements per label. In addition, one cannot measure longer time lags just by increasing the time interval between measurements because this risks losing the track due to on-off blinking of single dyes. To evaluate the experimental error from our tracking analysis, we repeated the tracking analysis on identical samples and compared the resulting square displacement, r2, histograms. These repeating studies revealed an average r2 uncertainty per single histogram bar of ∼10% and a deviation in 〈r2〉 of 1.5%. CdSe quantum dots with a fluorescence emission maximum at 570 nm, which readily immobilize on a blank glass substrate, were analyzed using single particle tracking to evaluate the mechanical stability of our experimental setup and to determine a lower limit for the displacement  which was found to be
  The determination of
  allowed us to define a threshold for potentially immobile molecules characterized by
  thus providing a conservative estimate for the immobile fraction IF.
To further analyze the data, the cumulative distribution function (CDF) was obtained from the individual trajectories by counting the number of r2 with values ≤r2 and normalizing by the total number of tracks used (Schuetz et al., 1997). Each CDF was analyzed assuming normal diffusion, for which the CDF is (Schuetz et al., 1997)
 |
(3) |
where 〈r2(tlag)〉 is the mean-square displacement and tlag = 50 ms. To analyze for anomalous subdiffusion, we could not use the time-dependent diffusion coefficient of Feder et al. (1996) because the time lag was constant. Instead we used results of O'Shaughnessy and Procaccia (1985a,b) for diffusion on a Sierpinski gasket. As shown in the Appendix, the CDF is then
 |
(4) |
where γ(a,brc) and Γ(a) are the incomplete and complete gamma functions and a, b, and c are constants. Though this approach gives only limited information about P(r2,t), it is sufficient to distinguish normal from anomalous diffusion. We also analyzed the data assuming two distinct populations of diffusing species with different diffusion coefficients, as in the fluorescence correlation spectroscopy experiments of Schwille et al. (1999a,b). Here the CDF is of the form of Eq. 3 but with two exponential terms (Schuetz et al., 1997),
 |
(5) |
where  and
and  represent the mean-square displacements of the two populations. Note that the data can be analyzed in terms of the probability density function (Anderson et al., 1992) or the CDF (Schuetz et al., 1997). The advantage of using the CDF is that there is no need to impose bin sizes, and the summation integrates out much of the noise.
Single molecule fluorescence tracking of lipids in the inner leaflet of the polymer-tethered bilayer was accomplished by adding small amounts (10−8 mol %) of the fluorescently labeled lipid TRITC-DHPE to the spreading solution of SOPC/DODA-E85 before Langmuir-Blodgett transfer. A representative image with intensity profile from similar sample geometry (TRITC-DHPE in a phospholipid monolayer at the air-water interface) was already shown elsewhere (Ke and Naumann, 2001a). The observed on-off blinking, a single molecule-specific phenomenon (Dickson et al., 1997), ensured that single molecules were tracked. It is reasonable to assume that TRITC-DHPE and SOPC show the same lateral diffusion within the polymer-tethered bilayer, even though they are characterized by a mismatch of their acyl-chain lengths. This is because lipid diffusion is described by a two-dimensional free-area model that predicts no dependence of lateral diffusion on acyl-chain length, as verified experimentally (Vaz et al., 1985; Balcom and Petersen, 1993). The BR experiments did not require an external fluorescence label because the autofluorescence from the retinal of each BR molecule could be detected using our imaging system. Even though the quantum yield of the retinal is one order-of-magnitude lower than that of a typical organic fluorescence dye, the number of emitted photons for a given exposure time is similar because the lifetime of the excited singlet state is approximately one order-of-magnitude shorter as well (Du and Fleming, 1993). It has been shown that BR molecules exist as monomers if the lipid/protein ratio reaches ≥80 (Ashikawa et al., 1994), which is certainly given in our experiment where a lipid/protein ratio of ∼107 was utilized. In addition, no aggregation of BR is expected in the current study, because experiments were conducted using the monomeric BR-mutant W80i, which is less prone to aggregation (Haupts et al., 1999). The BR molar concentration with respect to SOPC was estimated from the average distribution of individual W80i molecules on fluorescence micrographs.
RESULTS AND DISCUSSION
We tracked individual TRITC-DHPE molecules in the tethered lipid-containing inner leaflet of the SOPC bilayer at different molar concentrations of tethered lipids, ctether, of 0, 5, 10, 15, 20, 30, and 40 mol %. Note that ctether is defined as the molar concentration of tethered lipids with respect to the molar concentration of SOPC in the same (only the inner) leaflet of the bilayer, cSOPC! Fig. 2 shows representative r2 histograms from those studies. The center of the histogram shifts to smaller r2 values as the concentration of tethered lipids increases, consistent with Table 1, which gives the diffusion coefficient Dlipid and the immobile fraction IF for various values of ctether. As mentioned earlier, the average area per phospholipid was kept constant at Alipid = 65 Å2 for all tethering concentrations. Under these conditions, the observed differences in lipid lateral mobility are not caused by changes in free area described by a free-area model (Traeuble and Sackmann, 1972; Galla et al., 1979), but are associated with the presence of tethered lipids. For ctether > 10 mol %, the observed qualitative trend between 〈r2〉 and ctether in Fig. 2 and Table 1 is in good agreement with fluorescence recovery after photobleaching (FRAP) and single molecule fluorescence microscopy studies on polymer-tethered phospholipid monolayers at the air-water interface reported previously (Naumann et al., 2001; Ke and Naumann, 2001b). A similar comparison with appropriate bilayer systems is more problematic because the available experiments were limited by either the concentration range of tethered lipids of 0 < ctether ≤ 10 mol % (Wagner and Tamm, 2000) or the experimental conditions employed (Naumann et al., 2002). In the latter case, FRAP was conducted via relatively slow bleaching of a large spot using the mercury lamp of the microscope.
FIGURE 2.

Representative histograms of the square displacement r2 of TRITC-DHPE incorporated into the inner leaflet of the polymer-tethered SOPC bilayer at varying molar concentrations of tethered lipids of 2, 10, 30, and 40 mol %. For comparison, the scale of the r2-axis is kept constant.
TABLE 1.
Diffusion coefficients Dlipid and immobile fractions IF listed at different molar concentrations of tethered lipids ctether
| ctether [mol %] | Dlipid [μm2/s] | IF [%] |
|---|---|---|
| 0 | 2.1 | 0.7 |
| 5 | 1.8 | 0 |
| 10 | 1.6 | 0.7 |
| 15 | 1.3 | 0 |
| 20 | 0.9 | 2 |
| 30 | 0.6 | 4.7 |
| 40 | 0.03 | 26 |
Fig. 3 shows the rapid increase of the immobile fraction IF near ctether ∼ 40 mol %, consistent with a percolation threshold. As expected for a percolating system, the plot verifies that there is only a notable immobile fraction of IF = 25% at ctether ∼ 40 mol %, which is very close to the percolation threshold. The IF values in the current study are notably lower than those previously determined on a very similar model membrane system, a polymer-tethered phospholipid bilayer covalently attached to a glass substrate via silane groups (Wagner and Tamm, 2000). This FRAP-based work reported IF values of 22–50% over a tethering concentration range of 0 ≤ ctether ≤ 10 mol %. The discrepancy is likely to be the result of the different length scales in the two types of measurements, although differences in the chemistry of the samples may also contribute.
FIGURE 3.

Fraction of immobile tracks IF obtained from the single molecule tracking of fluorescently labeled phospholipid TRITC-DHPE incorporated into the inner leaflet of the polymer-tethered SOPC bilayer plotted versus ctether. This plot shows the typical feature of a percolating system—almost all molecules are mobile below the percolation threshold with a sudden increase in the immobile fraction very close to the percolation point. The dashed line is no model fit, but only highlights the strongly asymptotic behavior.
To further analyze the obstructed diffusion of TRITC-DHPE, Fig. 4 shows experimental data and model fits of the relative diffusion coefficient Drel as a function of the area fraction of obstacles (tethered lipids), c = ctether/(ctether + cSOPC). This definition of c assumes that the average area per phospholipid Alipid is equal to the average area occupied by a tethered lipid Atether. Drel is normalized by the value for the unobstructed case. The data curve illustrates that Drel decreases almost linearly with c and that lipid lateral diffusion is blocked at a percolation threshold c ∼ 0.4. The solid line in Fig. 4 shows the best-fitting result using the modified free-area model for obstructed lipid diffusion of Almeida et al. (1992b). In addition to hard-core repulsion, this model includes a soft-core repulsion due to partial ordering of lipids near a gel domain with a characteristic coherence length ξ. Solved numerically, the model provides a relationship among the relative diffusion coefficient Drel, the area fraction of obstacles c, the average radius of obstacles R, and the coherence length ξ, with (Almeida et al., 1992b):
 |
(6) |
 |
(7) |
 |
(8) |
Using Eqs. 6–8 and assuming that Atether = Alipid = 65 Å2, the solid fitting curve in Fig. 4 results in a percolation threshold of c = 0.41 and a coherence length of ξ = 2.3 ± 0.1 Å. Because this ξ-value is smaller than the diameter of a single phospholipid of dlipid ∼ 9 Å, the interaction potential between tethered lipids and TRITC-DHPE in the polymer-tethered phospholipid bilayer lacks a significant soft repulsive component. This finding also implies that the polymer moiety of lipopolymers does not interact with nearby lipids to immobilize them.
FIGURE 4.

Normalized diffusion coefficient, Drel = Dlipid(c)/Dlipid (c = 0), of TRITC-DHPE plotted versus the area fraction of obstacles, c = ctether/(ctether + cSOPC). Here cSOPC is the molar concentration of SOPC in the inner leaflet of the bilayer. The solid curve shows the best fit using the free area model of obstructed diffusion developed by Almeida et al. (1992b). Using a radius per obstacle of R = 4.5 Å and applying Eqs. 6–8, we obtain a coherence length of ξ = 2.3 Å. This small coherence length indicates that tracer molecules (TRITC-DHPE) and obstacles (tethered lipids) mainly interact via hard-core repulsion. The dashed line is included to illustrate how linear the fitted curve is. The error margin of Δcrel = ±0.01 describes the uncertainty concerning relative changes in c, which determines the linearity of the data curve. The absolute error in c, which is mostly caused by the uncertainty of Atether, is not shown because it does not influence the linearity of the curve.
The above result justifies the analysis of our experimental data using Monte Carlo calculations for a hard-core repulsive potential. These models provide additional information about the mobility and geometry of obstacles in the bilayer (Saxton, 1987, 1993a). For example, Monte Carlo lattice calculations predict that immobile obstacles show a percolation threshold accompanied by an almost linear relationship between Drel and c, whereas mobile obstacles lack a percolation threshold and are characterized by a nonlinear relationship between Drel and c (Pink, 1985; Saxton, 1987). Obviously, the presence of the percolation threshold at c = 0.41 and the almost linear relationship between Drel and c in Fig. 4 indicate that the tethered lipids in the inner leaflet of the polymer-tethered bilayer act as immobile obstacles on the experimental timescale chosen. Although Monte Carlo lattice calculations also provide predictions for the size and geometry of obstacles on the basis of percolation thresholds (Saxton, 1993a), a direct comparison of our experimental data with theoretical predicted percolation values is not very practical. This is because the estimated error in Atether is ±20 Å2 and because the theoretical percolation thresholds depend on the size and geometry of the obstacles, which both depend on Atether.
The area of a tethered polymer Apoly is a function of the polymer density, as shown by standard scaling laws for end-grafted polymers (de Gennes, 1976, 1980; Alexander, 1977). The aggregation behavior of tethered lipids can be addressed on the basis of these scaling laws of polymer physics and by utilizing simple steric and thermodynamic considerations. The general concept is that the thermodynamically favorable aggregation of tethered lipids in the bilayer is hindered due to their covalent linkage to entropic spring-forming polymer chains. As a result, the aggregation of tethered lipids becomes less likely if the ratio of area per polymer and area per tethered lipid Apoly/Atether increases. Scaling concepts of end-grafted polymers provide a reasonable estimate of how Apoly will depend on ctether (de Gennes, 1976, 1980; Alexander, 1977). Following these scaling arguments, at low tethering concentrations, the polymer chain of lipopolymers can be approximated by a half-sphere with a radius comparable to the Flory radius RF of an end-grafted polymer coil (mushroom) under good solvent conditions (Flory, 1953; de Gennes, 1980). With an assumed length per ethyloxazoline monomer of a = 3.5 Å and an average number of monomer segments per poly(ethyloxazoline) chain of N = 85, one can calculate the equilibrium value of Apoly in the high dilution limit (very low ctether) using Eqs. 9 and 10,
 |
(9) |
 |
(10) |
which leads to a value of Apoly ∼7950 Å2. This verifies that Apoly ≫ Atether for low ctether, thus preventing aggregation of tethered lipids. The flexible polymer chains will, however, deviate from the mushroom configuration if the average distance among tethered lipids σ is σ <2RF. In this case, scaling arguments show that the polymer chains are forced into the more stretched configuration of a polymer brush where the thickness of the polymer layer dpoly can be written as a function of RF and σ with (Jones and Richards, 1999)
 |
(11) |
A consequence of Eq. 11 is that Apoly and Apoly/Atether will decrease with increasing values of ctether if polymer chains of lipopolymers are in a brush configuration. This trend is clearly illustrated in Table 2, which lists estimated values of the average number of SOPC molecules per tethered lipid, Nlipid, and the area ratio Apoly/Atether for different values of ctether. The parameters in Table 2 were determined on the basis of the known SOPC/lipopolymer molar ratio, assuming an average area of tethered lipids and SOPC molecules of Atether = Alipid = 65 Å2, via the equations
 |
(12) |
 |
(13) |
TABLE 2.
Average number of SOPC molecules per tethered lipid Nlipid, average area per polymer moiety of the lipopolymer Apoly and ratio of Apoly and the average area per tethered lipid Atether listed at different values of ctether using Eqs. 12 and 13
| ctether [mol %] | Nlipid | Apoly [Å2] | Apoly/Atether |
|---|---|---|---|
| 5 | 19 | 1300 | 20 |
| 10 | 9 | 650 | 10 |
| 15 | 5.6 | 433 | 6.7 |
| 20 | 4 | 325 | 5 |
| 30 | 2.3 | 201 | 3.1 |
| 40 | 1.5 | 147 | 2.3 |
Based on the arguments concerning steric hindrance of end-grafted polymers made above, we do not expect any significant aggregation of tethered lipids for Apoly/Atether ≥ 10 (ctether ≤ 10 mol %), but notable aggregation for Apoly/Atether ≤ 5 (ctether ≥ 20 mol %). For the intermediate case of 5 < Apoly/Atether < 10 (10 < ctether ≥ 20 mol %), the partial formation of smaller aggregates seems to be the most likely scenario.
At the percolation threshold, diffusion is known to be anomalous at all length scales (ben-Avraham and Havlin, 2000). In contrast, diffusion in the absence of obstacles is normal. Therefore, we expect the nature of the diffusion will vary with ctether. To study this variation in more detail, we analyzed the cumulative distribution function P(r2,tlag) from the lipid tracking data using CDFs for normal (Eq. 3) and anomalous (Eq. 4) diffusion. Fig. 5 reveals that the experimental CDF for ctether ≤ 10 mol % are described reasonably well by the observed mean diffusion coefficient from Eq. 2 and the theoretical CDF for normal diffusion, Eq. 3 (dashed line). In contrast, the CDFs for ctether ≥ 20 mol % are best described by the CDF for anomalous diffusion on the basis of an incomplete gamma function, Eq. 4 (solid line), whereas ctether = 15 mol % represents an intermediate case. In agreement with findings from fluorescence correlation spectroscopy studies on lipid probes in cells (Schwille et al., 1999a,b), CDFs well-characterized by Eq. 4 are also well described by the CDF of Eq. 5 assuming a two-component model (not shown). As stated above, however, there are better theoretical arguments for anomalous diffusion than a two-component approach to describe diffusion in a percolating system. Interestingly, there is a correlation between the degree of aggregation of tethered lipids, as derived from scaling arguments of polymer physics, and the nature of the diffusion process in the bilayer, as obtained from CDFs. This correlation indicates that normal diffusion occurs if tethered lipids show no aggregation and are randomly distributed (ctether ≤ 10 mol %). In contrast, anomalous diffusion or two-component diffusion is observed if the aggregation among tethered lipids is likely to occur (ctether > 10 mol %).
FIGURE 5.

Normalized cumulative distribution function of TRITC-DHPE in a polymer-tethered SOPC bilayer of different molar concentrations of tethered lipids ctether: 0 mol % (unobstructed diffusion), 10 mol %, 15 mol %, 20 mol %, and 30 mol %. Also included are fitting curves using the single exponential function of Eq. 3 (dashed line) and the incomplete gamma function of Eq. 4 (solid line). The data indicate normal diffusion for ctether ≤ 10 mol % and anomalous diffusion at ctether ≥ 20 mol %.
We also studied the obstructed lateral diffusion of bacteriorhodopsin in a polymer-tethered phospholipid bilayer. Bacteriorhodopsin was chosen because its diameter of 3.5 nm and area per molecule of ABR = 962 Å2 (Peters and Cherry, 1982) are significantly larger than the diameter and area per fluorescently labeled phospholipid TRITC-DHPE of 0.9 nm and Alipid = 65 Å2, respectively. This membrane-spanning protein is not expected to protrude significantly out of the lipid bilayer, thus keeping the frictional coupling to the polymer cushion relatively small. To assure that only BR monomers (and not trimers) were studied, we mainly investigated the lateral mobility of the BR mutant W80i which is less prone to aggregation than the BR wild-type (Haupts et al., 1999).
Fig. 6 shows r2 histograms of W80i at different molar concentrations of tethered lipids of 5, 10, 15, and 20 mol %. As observed for the obstructed diffusion of phospholipids, the center of the histograms shifts to smaller r2 values as the concentration of tethered lipids in the bilayer increases. Corresponding W80i lateral diffusion coefficients, DBR, and immobile fractions, IF, from these tracking data are summarized in Table 3. For ctether = 5 mol %, Table 3 reveals almost identical diffusion properties for W80i and wild-type BR. This result supports the argument made above that both forms of BR should exist as monomers in the bilayer for the very low BR/lipid ratio of 10−7 employed in this study (Ashikawa et al., 1994). The immobile fractions listed in Table 3 reveal a similar qualitative behavior, as observed for the obstructed diffusion of phospholipids. Similar to results on TRITC-DHPE, there is only a notable immobile fraction very close to the percolation threshold. Interestingly, TRITC-DHPE and W80i show a similar IF at a given value of ctether for ctether ≤ 15 mol %. We should emphasize again that such low immobile fractions are unlikely to be observed by FRAP for similar systems, as, for example, previously reported diffusion data on cytochrome b5 in a similar model membrane system have shown (Wagner and Tamm, 2000).
FIGURE 6.

Histograms of the square displacement of the monomeric bacteriorhodopsin mutant W80i incorporated into the polymer-tethered SOPC bilayer at varying molar concentrations of tethered lipids of 5, 10, 15, and 20 mol %. For comparison, the scale of the r2-axis is kept constant.
TABLE 3.
Diffusion coefficients DBR and immobile fractions IF of W80i listed at different molar concentrations of tethered lipids ctether
| ctether [mol %] | DBR [μm2/s] | IF [%] |
|---|---|---|
| 5 | 0.71 | 0.7 |
| 5* | 0.70 | 0 |
| 10 | 0.65 | 0.7 |
| 15 | 0.23 | 3.3 |
| 20 | 0.02 | 38 |
The corresponding values of DBR and IF from tracking experiments on wild-type BR at ctether = 5 mol % are listed for comparison.
Fig. 7 a depicts plots of DBR versus ctether and Drel = DBR/DBR (c = 0) versus the area fraction of tethered lipids, in Fig. 7 b: c = ctether/(ctether + cSOPC). In both cases, the corresponding lipid diffusion data are included as a reference. Fig. 7 a shows that there is a linear relationship between DBR and ctether, which has the same slope as the corresponding curve obtained from the tracking of TRITC-DHPE. At low values of ctether, Dlipid ∼ 2DBR, in good agreement with the results of Peters and Cherry (1982) determined by FRAP in vesicles. Fig. 7, a and b, also show that the percolation threshold for BR is less than the threshold for phospholipids. This important result shows that the obstructed diffusion in a polymer-tethered phospholipid bilayer is dependent on tracer size, thus supporting the idea that tethered lipids do not form larger aggregates in the polymer-tethered phospholipid bilayer for low to moderate tethering concentrations. By assuming that the W80i diffusion is described by the diffusion of a hexagon in a triangular lattice and by keeping in mind that ABR/Alipid ∼ 20, we can estimate that the radius of the hexagon representing the W80i tracer should be ∼2. For random point obstacles and hexagonal tracers of radius 2 in a triangular lattice, Monte Carlo calculations predict a percolation threshold of c = 0.048 (Saxton, 1993a), which is notably lower than the value of c = 0.2 observed experimentally. This discrepancy between theory and experiment could have several reasons. One reason could be related to the error margin of Atether, which is ΔAtether ∼ ±20 Å2. Deviation from the random distribution of obstacles, which will shift the value of the percolation threshold, could be another reason. Finally, due to its larger mass, BR may be less affected by tethered lipids than phospholipids are.
FIGURE 7.
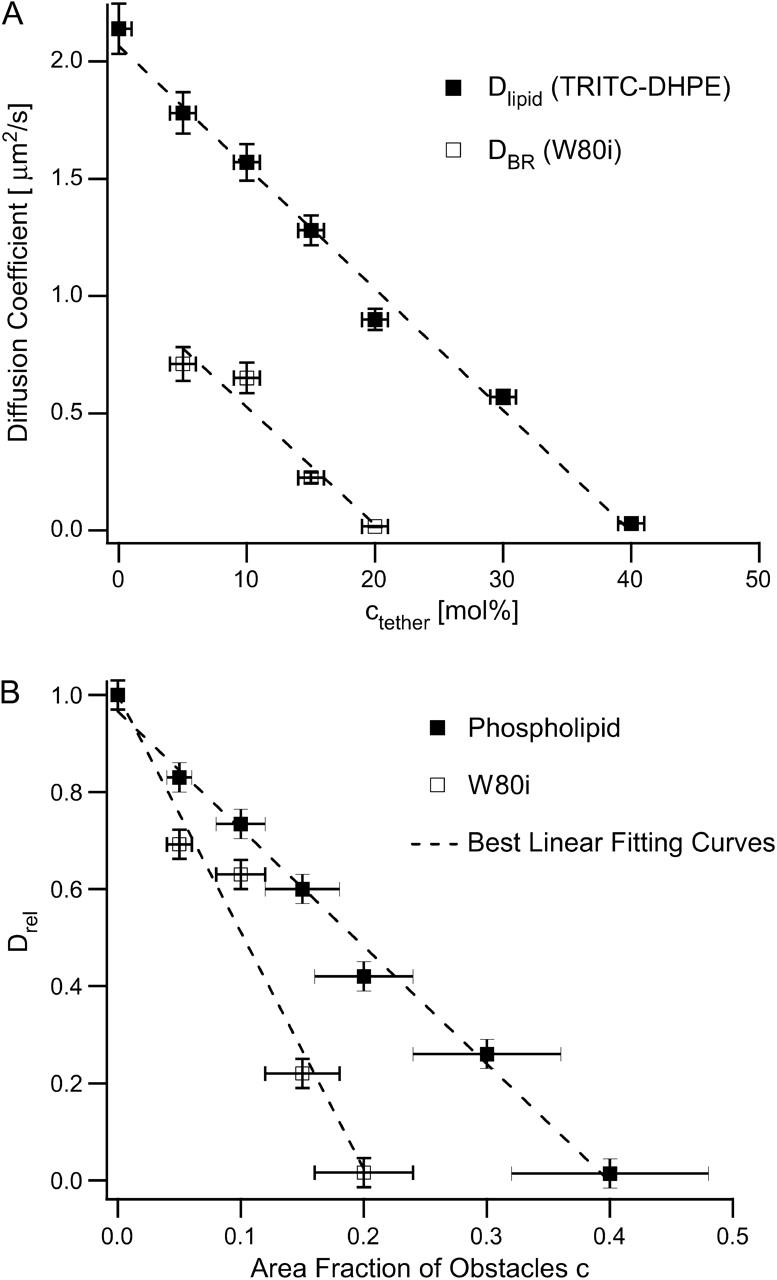
Diffusion coefficients DBR and Dlipid representing the lateral mobility of W80i and TRITC-DHPE plotted versus the molar concentration of tethered lipids ctether (a) and corresponding normalized W80i and TRITC-DHPE lateral mobility depicted as a function of the area fraction of obstacles (b). Both plots clearly reveal that the larger size of W80i not only reduces the lateral diffusion, but also results in a lower percolation threshold. The relatively large error margin for c of Δc ∼20% is due to the fact that the true area occupied per tethered lipid is not exactly known. As a consequence, the absolute percolation thresholds should be interpreted with caution, but the relative difference between both thresholds is provided very accurately.
To explore the variation in protein diffusion as a function of ctether, we also analyzed the W80i tracking data using theoretical CDFs for normal and anomalous diffusion. Fig. 8 shows the P–r2 plots for different values of ctether together with corresponding CDF fitting curves using Eqs. 3 and 4. Whereas the W80i diffusion at tethering concentrations of 5 and 10 mol % is well described by the single exponential function of Eq. 3 (dashed line), the incomplete gamma function of Eq. 4 represents a notably improved fit over Eq. 3 for 15 and 20 mol % (solid line). This indicates that diffusion is normal for ctether ≤ 10 mol %, but above ctether = 15 mol %, the CDFs are inconsistent with normal diffusion and more consistent with anomalous or two-component diffusion. Again, the qualitative change from normal to anomalous or two-component diffusion coincides with the transition from non-aggregated to partially aggregated tethered lipids derived from scaling arguments of polymer physics, thus indicating a link between distribution and organization of tethered lipids and bilayer lateral diffusion.
FIGURE 8.

Normalized cumulative distribution function for square displacements (N = 150, tlag = 50 ms), of W80i in a polymer-tethered SOPC bilayer of different molar concentrations of tethered lipids ctether: 5 mol %, 10 mol %, 15 mol %, and 20 mol %. Also included are fitting curves using the single exponential function of Eq. 3 (dashed line) and the incomplete gamma function of Eq. 4 (solid line). The data indicate normal diffusion for ctether ≤ 10 mol % and anomalous diffusion at ctether ≥ 15 mol %, thus supporting tracking results on TRITC-DHPE shown in Fig. 5.
CONCLUSION
Previous experimental models of obstructed diffusion used gel domains (Almeida et al., 1992a,b; Ratto and Longo, 2002) or varying concentrations of reconstituted mobile membrane proteins (Peters and Cherry, 1982; Tank et al., 1982; Blackwell and Whitmarsh, 1990) as obstacles. In the model system used here, diffusion processes are obstructed by very small obstacles consisting of only one or very few lipid molecules tethered to an underlying polymer layer. Our lipid and protein tracking experiments address one important objective, the characterization of the distribution of obstacles and their mobility and flexibility. The presence of percolation thresholds verified the rigid nature of obstacles in the bilayer. Simple steric arguments and the analysis of the probability distribution revealed that tethered lipids exist as randomly distributed obstacles of individual molecules for ctether ≤ 10 mol %, whereas obstacles consist of smaller aggregates of tethered lipids for ctether > 10 mol %. The chosen lipid and protein tracer molecules were found to show normal diffusion for ctether ≤ 10 mol % and anomalous or two-component diffusion for ctether > 10 mol %, thus indicating a link between the aggregation behavior of tethered lipids and the nature of the diffusion process in the polymer-tethered bilayer. Our study revealed, furthermore, that the obstructed diffusion of lipids in such a model membrane system is well described by existing hard-core repulsion-based theories of obstructed diffusion. Our current findings will help us understand how the membrane lateral mobility is obstructed by lipids and membrane proteins, such as GPI-anchored proteins and glycolipids. In that sense, this study may help obtain a more detailed molecular understanding of how such molecules may obstruct the bilayer lateral mobility in cellular membranes.
Acknowledgments
We thank D. Oesterhelt for support and helpful discussions on the bacteriorhodopsin-related experiments.
This research was supported in part by National Science Foundation grants No. INT-0089604 and MCB-0416779 and the Purdue School of Science at Indiana University-Purdue University Indianapolis. M.J.S. acknowledges funding from National Institutes of Health grant No. GM38133. E.S. received support from Sonderforschungsbereich 533 and Deutscher Akademischer Austauschdienst, Referat 315 PPP.
APPENDIX
The propagator (or Green's function, or probability density function) is the probability that if a diffusing particle is initially at the origin, it is at position r at time t. The propagator for normal diffusion is well known and the cumulative probability distribution P(r2,t) is easily obtained (Schuetz et al., 1997). We show an alternative derivation. The propagator is
 |
(A1) |
where D0 is the diffusion coefficient. From a standard result in probability theory (Stuart and Ord, 1994), if r is distributed according to p(r)2πrdr, then y = r2 is distributed according to
 |
(A2) |
so that
 |
(A3) |
and
 |
(A4) |
as required.
Several forms have been proposed for the propagator for anomalous subdiffusion; they are conveniently summarized by Schulzky et al. (2000). See also the review of Metzler and Klafter (2000). Note that these propagators are applicable to diffusion at the percolation threshold, where diffusion is purely anomalous, but the experimental results are not at the threshold. A least-square fit to a propagator therefore yields effective parameters that reflect the approach of the system to the percolation threshold. A similar approach was used by Argyrakis and Kopelman (1984) to describe the spectral dimension as a function of concentration.
The simplest approximation is to use the propagator for normal diffusion and replace the time-independent diffusion coefficient D0 with the time-dependent form
 |
(A5) |
where Γ and α are constants (Feder et al., 1996). This approximation worked well in describing the effect of anomalous subdiffusion on simulated fluorescence photobleaching recovery curves (Saxton, 2001), but is useless here because the measurements are at only one time lag. We therefore use the next simplest form, an approximate propagator proposed by O'Shaughnessy and Procaccia (1985a,b) for diffusion on a Sierpinski gasket, a standard geometrically regular fractal. We use this in the form given by Schulzky et al. (2000),
 |
(A6) |
where df is the fractal dimension of the substrate, dw is the fractal dimension of the walk,  and Γ is the gamma function. The mean-square displacement is then
 |
(A7) |
Normal two-dimensional diffusion corresponds to df = dw = 2, and Eq. A6 then reduces to Eq. A1. Eq. A5 uses a nonintegral exponent of r to describe anomalous subdiffusion; in fact both nonintegral exponents may be required. Eq. A6 looks formidable, bristling with fractal dimensions, but its basic structure is simply a stretched Gaussian exp(−brc) with b = 1/K0t and c = dw. The rest of Eq. A6 is merely the time-dependent normalization factor appropriate for a fractal substrate of dimension df. In the derivation, then, we can ignore all the factors not depending on r, integrate over r, and then normalize the integral at the end. The element of volume in df dimensions is (Prudnikov et al., 1986)
 |
(A8) |
Proceeding as for normal diffusion, we have
 |
(A9) |
and
 |
(A10) |
We transform the integral using  to obtain
 |
(A11) |
where γ(a,x) is the incomplete gamma function (Abramowitz and Stegun, 1964, Eq. 6.5.2). To normalize this, we use the fact that in the limit x → ∞, the incomplete gamma function reduces to the usual complete gamma function (Abramowitz and Stegun, 1964, Eqs. 6.5.2 and 6.1.1). So the normalized distribution function is
 |
(A12) |
which reduces to Eq. A4 in the limit df = dw = 2. This normalized form is a standard function in MATLAB and Mathematica. Here df/dw = ds/2 where ds is the spectral dimension. The spectral dimension is of interest in chemical kinetics because it describes the number of distinct sites SN visited by a diffusing particle in N time steps:  For the two-dimensional percolation cluster, df = 91/48, dw = 2.878 ± 0.001, and ds = 1.318 ± 0.001 (ben-Avraham and Havlin, 2000).
For diffusion on a Sierpinski gasket or a percolating cluster at the threshold, the actual form of p(r,t) is more complicated (Havlin et al., 1985; Klafter et al, 1991; Roman, 1995), but these complications have no effect on the least-squares fitting. If
 |
(A13) |
with a, b, c1, and c2 constant, the nonintegral power of t has no effect because here t = tlag = const. The factor ra simply changes the power of y in Eq. A10 and thus the parameter corresponding to df/dw in Eqs. A11 and A12. The least-squares fit is to the same functional form; all that is changed is the interpretation of the fitting parameters.
Here we have used the simplest applicable form of p(r,t) for diffusion on a fractal substrate, a form that uses standard special functions. More advanced forms from the physics literature use much more complicated functions. Later work will examine these other forms, which can distinguish the simplest fractal model from a percolation cluster. This comparison is better done using Monte Carlo calculations which can generate very large data sets of p(r,t) as a function of both r and t, with no experimental uncertainties in the positions.
Nonlinear least-squares fitting to an incomplete gamma function may be problematic. It was useful to calculate the sums of the residuals for a multidimensional grid of parameter values, and use the best set of parameters as the starting point in the MATLAB curve-fitting toolbox.
References
- Abramowitz, M., and I. A. Stegun. 1964. Handbook of Mathematical Functions, National Bureau of Standards, Washington, DC.
- Alexander, S. 1977. Adsorption of chain molecules with a polar head scaling description. J. Phys. (Fr.). 38:983–987. [Google Scholar]
- Almeida, P. F. F., W. L. C. Vaz, and T. E. Thompson. 1992a. Lateral diffusion in the liquid phases of dimyristoylphosphatidylcholine cholesterol lipid bilayers: a free area volume analysis. Biochemistry. 31:6739–6747. [DOI] [PubMed] [Google Scholar]
- Almeida, P. F. F., W. L. C. Vaz, and T. E. Thompson. 1992b. Lateral diffusion and percolation in two-component, two-phase lipid bilayers. Topology of the solid-phase domains in-plane and across the lipid bilayer. Biochemistry. 31:7198–7210. [DOI] [PubMed] [Google Scholar]
- Anderson, C. M., G. N. Georgiou, I. E. Morrison, G. V. Stevenson, and R. J. Cherry. 1992. Tracking of cell surface receptors by fluorescence digital imaging microscopy using a charge-coupled device camera. Low-density lipoprotein and Influenza virus receptor mobility at 4°C. J. Cell Sci. 101:415–425. [DOI] [PubMed] [Google Scholar]
- Argyrakis, P., and R. Kopelman. 1984. Fractal to Euclidean crossover and scaling for random walkers on percolation clusters. J. Chem. Phys. 81:1015–1018. [Google Scholar]
- Ashikawa, I., J.-J. Yin, W. K. Subczynski, T. Kouyama, J. S. Hyde, and A. Kusumi. 1994. Molecular organization and dynamics in bacteriorhodopsin-rich reconstituted membranes: discrimination of lipid environments by oxygen transport parameter using a pulse ESR spin-labeling technique. Biochemistry. 33:4947–4952. [DOI] [PubMed] [Google Scholar]
- Balcom, B. J., and N. O. Petersen. 1993. Lateral diffusion in model membranes is independent of the size of the hydrophobic region of molecules. Biophys. J. 65:630–637. [DOI] [PMC free article] [PubMed] [Google Scholar]
- ben-Avraham, D., and S. Havlin. 2000. Diffusion and Reactions in Fractals and Disordered Systems. Cambridge University Press, Cambridge, UK.
- Blackwell, M. F., and J. Whitmarsh. 1990. Effect of integral membrane proteins on the lateral mobility of plastoquinone in phosphatidylcholine proteoliposomes. Biophys. J. 58:1259–1271. [DOI] [PMC free article] [PubMed] [Google Scholar]
- Bussell, S. J., D. L. Koch, and D. A. Hammer. 1995. Effect of hydrodynamic interactions on the diffusion of integral membrane proteins: tracer diffusion in organelle and reconstituted membranes. Biophys. J. 68:1828–1835. [DOI] [PMC free article] [PubMed] [Google Scholar]
- de Gennes, P. G. 1976. Scaling theory of polymer adsorption. J. Phys. (Fr.). 37:1445–1452. [Google Scholar]
- de Gennes, P. G. 1980. Conformations of polymers attached to an interface. Macromolecules. 13:1069–1075. [Google Scholar]
- Dickson, R. M., A. B. Cubitt, R. Y. Tsien, and W. E. Moerner. 1997. On/off blinking and switching behaviour of single molecules of green fluorescent protein. Nature. 388:355–358. [DOI] [PubMed] [Google Scholar]
- Dodd, T. L., D. A. Hammer, A. S. Sangani, and D. L. Koch. 1995. Numerical simulations of the effect of hydrodynamic interactions on diffusivities of integral membrane proteins. J. Fluid Mech. 293:147–180. [Google Scholar]
- Du, M., and G. R. Fleming. 1993. Femtosecond time-resolved fluorescence spectroscopy of bacteriorhodopsin: Direct observation of excited state dynamics in the primary step of the proton pump cycle. Biophys. Chem. 48:1001–1111. [Google Scholar]
- Edidin, M., S. C. Kuo, and M. P. Sheetz. 1991. Lateral movements of membrane glycoproteins restricted by dynamic cytoplasmic barriers. Science. 254:1379–1382. [DOI] [PubMed] [Google Scholar]
- Edidin, M. 1996. Getting there is only half the fun. Curr. Topics Membr. 43:1–13. [Google Scholar]
- Edidin, M. 1997. Lipid microdomains in cell surface membranes. Curr. Opin. Struct. Biol. 7:528–532. [DOI] [PubMed] [Google Scholar]
- Edidin, M. 2001. Shrinking patches and slippery rafts: scales of domains in the plasma membrane. Trends Cell Biol. 11:492–496. [DOI] [PubMed] [Google Scholar]
- Feder, T. J., I. Brustmascher, J. P. Slattery, B. Baird, and W. W. Webb. 1996. Constrained diffusion or immobile fraction on cell surfaces: a new interpretation. Biophys. J. 70:2767–2773. [DOI] [PMC free article] [PubMed] [Google Scholar]
- Flory, P. J. 1953. Principles of Polymer Chemistry. Cornell University Press, Ithaca, NY.
- Fujiwara, T., K. Ritchie, H. Murakoshi, K. Jacobson, and A. Kusumi. 2002. Phospholipids undergo hop diffusion in compartmentalized cell membrane. J. Cell Biol. 157:1071–1081. [DOI] [PMC free article] [PubMed] [Google Scholar]
- Galla, H. J., W. Hartmann, U. Theilen, and E. Sackmann. 1979. On two-dimensional passive random walk in lipid bilayers and fluid pathways in biomembranes. J. Membr. Biol. 48:215–236. [DOI] [PubMed] [Google Scholar]
- Havlin, S., D. Movshovitz, B. Trus, and G. H. Weiss. 1985. Probability densities for the displacement of random walks on percolation clusters. J. Phys. A. 18:L719–L722. [Google Scholar]
- Haupts, U., J. Tittor, and D. Oesterhelt. 1999. Closing in on bacteriorhodopsin: progress in understanding the molecule. Annu. Rev. Biophys. Biomol. Struct. 28:367–399. [DOI] [PubMed] [Google Scholar]
- Jacobson, K., E. D. Sheetz, and R. Simson. 1995. Revisiting the fluid mosaic model of membranes. Science. 268:1441–1442. [DOI] [PubMed] [Google Scholar]
- Jacobson, K., S. E. Moore, B. Yang, P. Doherty, G. W. Gordon, and F. S. Walsh. 1997. Cellular determinants of the lateral mobility of neural cell adhesion molecules. Biochim. Biophys. Acta. 1330:138–144. [DOI] [PubMed] [Google Scholar]
- Jaehnig, F. 1981. Critical effects from lipid-protein interaction in membranes. I. Theoretical description. Biophys. J. 36:329–345. [DOI] [PMC free article] [PubMed] [Google Scholar]
- Jones, R. A. L., and R. W. Richards. 1999. Polymers at Surfaces and Interfaces. Cambridge University Press, Cambridge, UK.
- Ke, P. C., and C. A. Naumann. 2001a. Single molecule fluorescence imaging of phospholipid monolayers at the air-water interface. Langmuir. 17:3727–3733. [Google Scholar]
- Ke, P. C., and C. A. Naumann. 2001b. Hindered diffusion in polymer-tethered phospholipid monolayers at the air-water interface: a single molecule fluorescence imaging study. Langmuir. 17:5076–5081. [Google Scholar]
- Klafter, J., G. Zumofen, and A. Blumen. 1991. On the propagator of Sierpinski gaskets. J. Phys. A. 24:4835–4842. [Google Scholar]
- Kusumi, A. Y., T. Sako, and M. Yamamoto. 1993. Confined lateral diffusion of membrane receptors as studied by single particle tracking (nanovid microscopy). Effects of calcium-induced differentiation in cultured epithelial cells. Biophys. J. 65:2021–2040. [DOI] [PMC free article] [PubMed] [Google Scholar]
- Kusumi, A., Y. Sako, T. Fujiwara, and M. Tomishige. 1998. Application of laser tweezers to studies of the fences and tethers of the membrane skeleton that regulate the movements of plasma membrane proteins. Methods Cell Biol. 55:173–194. [DOI] [PubMed] [Google Scholar]
- Lehmann, T. 1999. Synthese von kovalent an Oberflächen fixierten Polyethyloxazolinfilmen zum Aufbau polymergestützter Biomembran-Modelle. (PhD Thesis). University of Mainz, Mainz, Germany.
- Livneh, E., M. Benveniste, R. Prywes, S. Felder, Z. Kam, and J. Schlessinger. 1986. Large depletions in the cytoplasmic kinase domain of the epidermal growth factor receptor do not affect its lateral mobility. J. Cell Biol. 103:327–331. [DOI] [PMC free article] [PubMed] [Google Scholar]
- Maxfield, F. P. 2002. Plasma membrane microdomains. Curr. Opin. Cell Biol. 14:483–487. [DOI] [PubMed] [Google Scholar]
- Metzler, R., and J. Klafter. 2000. The random walk's guide to anomalous diffusion: a fractional dynamics approach. Phys. Rep. 339:1–77. [Google Scholar]
- Naumann, C. A., W. Knoll, and C. W. Frank. 2001. Hindered diffusion in polymer-tethered membranes: a monolayer study at the air-water interface. Biomacromolecules. 2:1097–1103. [DOI] [PubMed] [Google Scholar]
- Naumann, C. A., O. Prucker, T. Lehmann, J. Ruehe, W. Knoll, and C. W. Frank. 2002. The polymer-supported phospholipid bilayer: tethering as a new approach toward substrate-membrane stabilization. Biomacromolecules. 3:27–35. [DOI] [PubMed] [Google Scholar]
- Oesterhelt, D., and W. Stoeckenius. 1974. Isolation of the cell membrane of Halobacterium halobium and its fractionation into red and purple membrane. Methods Enzymol. 31:667–678. [DOI] [PubMed] [Google Scholar]
- O'Shaughnessy, B., and I. Procaccia. 1985a. Analytical solutions for diffusion on fractal objects. Phys. Rev. Lett. 54:455–458. [DOI] [PubMed] [Google Scholar]
- O'Shaughnessy, B., and I. Procaccia. 1985b. Diffusion on fractals. Phys. Rev. A. 32:3073–3083. [DOI] [PubMed] [Google Scholar]
- Peters, R., and R. J. Cherry. 1982. Lateral and rotational diffusion of bacteriorhodopsin in lipid bilayers: experimental test of the Saffman-Delbrück equations. Proc. Natl. Acad. Sci. USA. 79:4317–4321. [DOI] [PMC free article] [PubMed] [Google Scholar]
- Pink, D. A. 1985. Protein lateral movement in lipid bilayers. Simulation studies of its dependence upon protein concentration. Biochim. Biophys. Acta. 818:200–204. [Google Scholar]
- Pink, D. A., D. J. Laidlaw, and D. M. Chrisholm. 1986. Protein lateral movement in lipid bilayers: Monte Carlo simulation studies of its dependence upon attractive protein-protein interactions. Biochim. Biophys. Acta. 863:9–17. [Google Scholar]
- Prudnikov, A. P., Yu. A. Brychkov, and O. I. Marichev. 1986. Integrals and Series, Vol. 1. Elementary Functions. Gordon and Breach, New York.
- Ratto, T. V., and M. L. Longo. 2002. Obstructed diffusion in phase-separated supported bilayers: a combined atomic force microscopy and fluorescence recovery after photobleaching approach. Biophys. J. 83:3380–3392. [DOI] [PMC free article] [PubMed] [Google Scholar]
- Roman, H. E. 1995. Structure of random fractals and the probability distribution of random walks. Phys. Rev. E. 51:5422–5425. [DOI] [PubMed] [Google Scholar]
- Sako, Y., and A. Kusumi. 1994. Compartmentalized structure of the plasma membrane for receptor movements as revealed by nanometer-level motion analysis. J. Cell Biol. 125:1251–1264. [DOI] [PMC free article] [PubMed] [Google Scholar]
- Sako, Y., and A. Kusumi. 1995. Barriers for lateral diffusion of transferrin receptor in the plasma membrane as characterized by receptor dragging by laser tweezers: fence versus tether. J. Cell Biol. 129:1559–1574. [DOI] [PMC free article] [PubMed] [Google Scholar]
- Saxton, M. J. 1987. Lateral diffusion in an archipelago: effect of mobile obstacles. Biophys. J. 52:989–997. [DOI] [PMC free article] [PubMed] [Google Scholar]
- Saxton, M. J. 1993a. Lateral diffusion in an archipelago: dependence on tracer size. Biophys. J. 64:1053–1062. [DOI] [PMC free article] [PubMed] [Google Scholar]
- Saxton, M. J. 1993b. Anomalous diffusion due to obstacles: a Monte Carlo study. Biophys. J. 66:394–401. [DOI] [PMC free article] [PubMed] [Google Scholar]
- Saxton, M. J. 1999. Lateral diffusion of lipids and proteins. Curr. Topics Membr. 48:229–282. [Google Scholar]
- Saxton, M. J. 2001. Anomalous subdiffusion in fluorescence photobleaching recovery: a Monte Carlo study. Biophys. J. 81:2226–2240. [DOI] [PMC free article] [PubMed] [Google Scholar]
- Scalletar, B. A., and J. R. Abney. 1991. Molecular crowding and protein diffusion in biological membranes. Comm. Mol. Cell Biophys. 7:79–107. [Google Scholar]
- Schmidt, T., G. J. Schuetz, W. Baumgartner, H. J. Gruber, and H. Schindler. 1995. Charcterization of photophysics and mobilitiy of single molecules in a fluid lipid membrane. J. Phys. Chem. 99:17662–17668. [Google Scholar]
- Schram, V., H. N. Lin, and T. E. Thompson. 1996. Topology of gel-phase domains and lipid mixing properties in phase-separated two-component phosphatidylcholine bilayers. Biophys. J. 71:1811–1822. [DOI] [PMC free article] [PubMed] [Google Scholar]
- Schuetz, G. J., H. Schindler, and T. Schmidt. 1997. Single-molecule microscopy on model membranes reveals anomalous diffusion. Biophys. J. 73:1073–1080. [DOI] [PMC free article] [PubMed] [Google Scholar]
- Schulzky, C., C. Essex, M. Davison, A. Franz, and K. H. Hoffmann. 2000. The similarity group and anomalous diffusion equations. J. Phys. A. 33:5501–5511. [Google Scholar]
- Schwille, P., J. Korlach, and W. W. Webb. 1999a. Fluorescence correlation spectroscopy with single-molecule sensitivity on cell and model membranes. Cytometry. 36:176–182. [DOI] [PubMed] [Google Scholar]
- Schwille, P., U. Haupts, S. Maiti, and W. W. Webb. 1999b. Molecular dynamics in living cells observed by fluorescence correlation spectroscopy with one- and two-photon excitation. Biophys. J. 77:2251–2265. [DOI] [PMC free article] [PubMed] [Google Scholar]
- Scotto, A. W., and M. E. Gompper. 1990. Spontaneous incorporation of bacteriorhodopsin into large preformed vesicles. Biochemistry. 7:7244–7251. [DOI] [PubMed] [Google Scholar]
- Sheets, E. D., R. Simson, and K. Jacobson. 1995. New insights into the membrane dynamics from the analysis of cell surface interactions by physical methods. Curr. Opin. Cell Biol. 7:707–714. [DOI] [PubMed] [Google Scholar]
- Sheetz, M. P., M. Schindler, and D. E. Koppel. 1980. Lateral mobility of integral membrane proteins is increased in spherocytic erythrocytes. Nature. 285:510–511. [DOI] [PubMed] [Google Scholar]
- Singer, S. J., and G. L. Nicholson. 1972. The fluid mosaic model of the structure of cell membranes. Science. 175:720–731. [DOI] [PubMed] [Google Scholar]
- Sperotto, M. M., and O. G. Mouritsen. 1991. Monte Carlo simulation studies of lipid order parameter profiles near integral membrane proteins. Biophys. J. 59:261–270. [DOI] [PMC free article] [PubMed] [Google Scholar]
- Stuart, A., and K. Ord. 1994. Kendall's Advanced Theory of Statistics. Vol. I, Distribution Theory, 6th Ed. Edward Arnold, London, UK.
- Tank, D., E.-S. Wu, P. R. Meers, and W. W. Webb. 1982. Lateral diffusion of Gramicidin C in phospholipid multibilayers. Effects of cholesterol and high Gramicidin concentration. Biophys. J. 40:129–135. [DOI] [PMC free article] [PubMed] [Google Scholar]
- Tocanne, J. F., L. Cezanne, A. Lopez, B. Piknova, V. Schram, J. F. Tournier, and M. Welby. 1994. Lipid domains and lipid protein interactions in biological membranes. Chem. Phys. Lipids. 73:139–158. [DOI] [PubMed] [Google Scholar]
- Traeuble, H., and E. Sackmann. 1972. Studies of the crystalline-liquid phase transition of lipid model membranes. III. Structure of a steroid-lecithin system below and above the lipid phase transition. J. Am. Chem. Soc. 94:4499–4510. [DOI] [PubMed] [Google Scholar]
- Tsuji, A., and S. Ohnishi. 1986. Restriction of the lateral motion of band 3 in the erythrocyte membrane by the cytoskeletal network: dependence on spectrin association state. Biochemistry. 25:6133–6139. [DOI] [PubMed] [Google Scholar]
- Vaz, W. L. C., R. M. Clegg, and D. Hallmann. 1985. Translational diffusion of lipids in liquid crystalline phase phosphatidylcholine multibilayers. A comparison of experiment with theory. Biochemistry. 24:781–786. [DOI] [PubMed] [Google Scholar]
- Verkade, P., and K. Simons. 1997. Lipid microdomains and membrane trafficking in mammalian cells. Histochem. Cell Biol. 108:211–220. [DOI] [PubMed] [Google Scholar]
- Wagner, M. L., and L. K. Tamm. 2000. Tethered polymer-supported planar lipid bilayers for reconstitution of integral membrane proteins: silane-polyethyleneglycol-lipid as a cushion and covalent linker. Biophys. J. 79:1400–1414. [DOI] [PMC free article] [PubMed] [Google Scholar]
- Webb, W. W., L. S. Barak, D. W. Tank, and E.-S. Wu. 1981. Molecular mobility on the cell surface. Biochem. Soc. Symp. 46:191–205. [PubMed] [Google Scholar]
- Zhang, F., B. Crise, B. Su, Y. Hou, J. K. Rose, A. Bothwell, and K. Jacobson. 1991. Lateral diffusion of membrane-spanning and glycosylphosphatidylinositol-linked proteins: toward establishing rules governing the lateral mobility of membrane proteins. J. Cell Biol. 115:75–84. [DOI] [PMC free article] [PubMed] [Google Scholar]