Abstract
The importance of understanding the dynamics of DNA condensation is inherent in the biological significance of DNA packaging in cell nuclei, as well as for gene therapy applications. Specifically, the role of ligand hydrophobicity in DNA condensation has received little attention. Considering that only multivalent cations can induce true DNA condensation, previous studies exploring monovalent lipids have been unable to address this question. In this study we have elucidated the contribution of the hydrophobic effect to multivalent cation- and cationic lipid-DNA binding and DNA collapse by studying the thermodynamics of cobalt hexammine-, spermine-, and lipospermine-plasmid DNA binding at different temperatures. Comparable molar heat capacity changes (ΔCp) associated with cobalt hexammine- and spermine-DNA binding (−23.39 cal/mol K and −17.98 cal/mol K, respectively) suggest that upon binding to DNA, there are insignificant changes in the hydration state of the methylene groups in spermine. In contrast, the acyl chain contribution to the ΔCp of lipospermine-DNA binding (ΔCp φ = ΔCp lipospermine − ΔCp spermine) is significant (−220.94 cal/mol K). Although lipopermine induces DNA ordering into “tubular” suprastructures, such structures do not assume toroidal dimensions as observed for spermine-DNA complexes. We postulate that a steric barrier posed by the acyl chains in lipospermine precludes packaging of DNA into dimensions comparable to those found in nature.
INTRODUCTION
The various forces driving cation-DNA binding, and subsequent dramatic reduction in the hydrodynamic volume of DNA, to the order of 106-fold, have been postulated to include favorable hydration (Rau and Parsegian, 1992, attractive electrostatic interactions between fluctuating counterions (Marquet and Houssier, 1991 Ray and Manning, 1997), and acyl chainhydrophobicity (Matulis et al., 2002). It is biologically relevant to study the contribution of these forces to DNA condensation since it is in the condensed form that DNA is packaged in sperm cells (Hud et al., 1993), in bacteriophages by smaller polyamines (Earnshaw and Harrison, 1977, and in the fundamental unit of chromatin, the nucleosome, by histones (Anselmi et al., 1999; Luger et al., 1997; Richmond et al., 1984). Thus, DNA condensation and decondensation are important in regulation of genetic information in organisms ranging from viruses to higher eukaryotes (van Holde, 1989. Additionally, interest in mechanistic and structural aspects of complex formation of DNA with lipids (Gustafsson et al., 1995; Simberg et al., 2001), peptides (Keller et al., 2002), and polyamines (Böttcher et al., 1998; Fang and Hoh, 1998 has vastly increased in recent years due to developments in nonviral gene therapies. In this regard, it has been shown that the transfection efficiency of such complexes is correlated to their hydrophobicity (Niidome et al., 1997) and the mode of DNA packing in the condensed phase (Radler et al., 1997; Simberg et al., 2001). Despite various proposed mechanisms for DNA condensation, systematic studies estimating the contribution of the hydrophobic effect to nonspecific ligand-DNA binding and condensation have received little attention.
Thermodynamics of lipid-DNA binding has been studied extensively by titration calorimetry (Barreleiro et al., 2000; Lobo et al., 2001; Matulis et al., 2002; Pozharski and MacDonald, 2002; Spink and Chaires, 1997). Analysis of isotherms ofcobalt hexammine and spermidine binding to DNA has demonstrated the use of this technique to discern the DNA collapsing character of these ligands (Matulis et al., 2000). Other studies have described the thermodynamics of polyamine induced DNA condensation using light scattering (Porschke, 1984), affinity capillary electrophoresis (Ouameur and Tajmir-Riahi, 2004, and under dry conditions by fluorescence microscopy (Mel'nikov et al., 1995; Yoshikawa et al., 1996). It is known that binding of cations to phosphates on the polynucleotide backbone of DNA is driven by the release of water, i.e., entropically driven and opposed by the binding enthalpy (Lobo et al., 2001; Matulis et al., 2000; Record et al., 1991). In addition to electrostatic binding, the presence of long hydrocarbon chains on alkylammonium cations enable binding cooperativity via the hydrophobic effect, owing to the tendency of adjacent chains to minimize area of exposure to water, upon binding to DNA (Matulis et al., 2002; Spink and Chaires, 1997. A role for this phenomenon in nonspecific ligand-DNA binding, as well as in DNA condensation, has been indirectly suggested in several reports, e.g., tetramethylammonium ions bind to DNA with a higher affinity than to polyphosphate (Strauss et al., 1967); hydrophobicity of complexes resulting from spermine-uranyl binding to DNA has been suggested to be important for packaging DNA into multimeric toroids (Böttcher et al., 1998); varying the methylene bridge size in polyamines, such as spermine, causes differential condensation of DNA (Vijayanathan et al., 2001); each methylene group in monovalent lipid alkyl chains increases the lipid-DNA binding constant ∼4-fold (Matulis et al., 2002). To the best of our knowledge, only monovalent lipids have been used in lipid-DNA thermodynamic studies reported in the literature. Since mono- and divalent ions are unable to condense DNA (Bloomfield, 1991), it is not surprising that monovalent lipids do not truly condense DNA. In contrast, the study of multivalent cationic lipid-DNA interactions allows the measurement of the contribution of hydrophobicity to lipid-DNA binding and potentially to DNA collapse/condensation, due to the true condensing character of a multivalent cation (Bloomfield, 1991). The corresponding complex sizes and structures, monitored by light scattering and electron microscopy, respectively, have allowed us to extend the understanding of structural differences in multivalent cation and cationic lipid induced DNA collapse. This issue is especially relevant considering the predominant use of cationic lipids in gene delivery.
In this study, a comparison of the changes in heat capacities of binding of the multivalent ligands, spermine, and lipospermine to DNA has enabled us to test the hypothesis that the hydrophobic effect is partly responsible for DNA collapse. This comparison is made feasible due to the presence of a spermine headgroup (a condensing moiety) in lipospermine and enables estimation of the direct contribution of the diacyl chain to lipospermine-DNA binding. Additionally, by comparing the heat capacities of binding of cobalt hexammine and spermine to DNA, the possibility that burial of the spermine methylene groups in DNA bases, and also among other methylene groups upon forming bridges between DNA helices (Schellman and Parthasarathy, 1984, favors DNA binding and collapse has been tested in this study. To correlate binding thermodynamics with suprastructural changes, the calorimetric data have been compared with hydrodynamic sizes and microscopic structures of complexes formed at different ligand concentrations. This study has been used to resolve whether the inclusion of hydrophobic acyl chains on a spermine molecule (lipospermine) could facilitate DNA collapse and to characterize the collapsed state induced by multivalent cationic lipids.
MATERIALS AND METHODS
Plasmid DNA encoding vascular endothelial growth factor was a kind gift from Valentis (Burlingame, CA). DNA was precipitated with ethanol and 2 M NaCl before use. HEPES, cobalt hexammine (III) chloride, and spermine tetrachloride were purchased from Sigma Chemical (St. Louis, MO) in powder form and used without further purification. Lipospermine (DOGS; Fig. 1 B) was obtained in the lyophilized form as a trifluoroacetate salt from Promega (Madison, WI). Lipospermine (1 mg) was dissolved in 800 μl absolute ethanol, of which 200 μl was taken to dryness under a stream of nitrogen and suspended by sonication in 800 μl of 5 mM HEPES, pH 6, to achieve a final concentration of 0.5 mM. Uranyl acetate used in electron microscopy (EM) staining was purchased from Mallinckrodt Chemical Works (St. Louis, MO).
FIGURE 1.
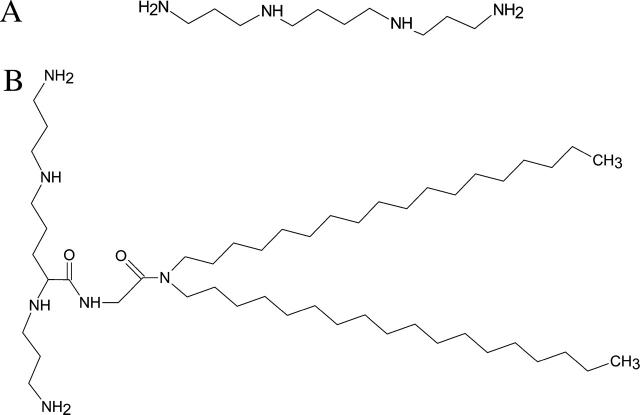
Chemical structures of (A) spermine, and (B) lipospermine (dioctadecylamidoglycyl spermine).
Isothermal titration calorimetry
Sample preparation
HEPES buffer (5 mM, pH 6) was prepared and filtered through a 0.22 μm pore size filter. After ethanol precipitation, the DNA pellet was resuspended in the buffer solution and extensively dialyzed against the same buffer for 24 h, with two buffer changes of 1 L each. The final dialysate was used to prepare the cobalt hexammine, spermine, and lipospermine samples. This greatly reduces any differences in the pH of the ligand and DNA solutions, thus negating any contributions from artifacts arising from buffer-buffer interactions. Concentration of DNA stock solution (9.68 mM phosphate) was measured with the use of a Hitachi (San Jose, CA) V-VIS spectrophotometer by monitoring absorbance at 260 nm, where 1 AU = 50 μg/ml ≈ 0.15 mM phosphate. The concentrations of all ligand solutions were determined by gravimetry. The sample concentrations used were 2 mM cobalt hexammine titrated into 0.5 mM DNA  for
for  -DNA titrations, 1 mM spermine titrated into 0.5 mM DNA
  for spermine-DNA titrations, and 0.5 mM lipospermine titrated into 0.1 mM DNA
  for lipospermine-DNA titrations. All samples were degassed before use by application of vacuum with simultaneous stirring on a magnetic stir plate.
Instrumentation
An Omega isothermal titration calorimetry (ITC) (Microcal; Northampton, MA) was employed for the calorimetric measurements. Before titrations, baseline stability was ascertained by ensuring that the root mean-square (RMS) noise and baseline drift were <0.005 μcal/s and 0.025 μcal/s per 30 min, respectively. For all titrations, the DNA solution was held in the sample cell and the reference cell was filled with deionized, filtered, and degassed water. In all experiments, 18 injections of 15 μl each of the condensing agent, either cobalt hexammine, spermine, or lipospermine, filled in a 250 μl syringe, were made into the 1.32 ml thermally insulated cell filled with DNA solution or buffer. A stir speed of 400 rpm was utilized, and an interval of 240 s was sufficient between injections for the heat signal to return to the baseline, indicative of system equilibration. Using the same injection parameters, the heats of ligand dilution were determined by titration of each ligand into buffer and were subtracted from the heats obtained from ligand-DNA titrations to obtain the actual heat of binding.
Estimation of thermodynamic parameters
Raw titration data were integrated using the software to get the heats of binding and dilution. The enthalpy of binding/(mole of ligand) (ΔH) was calculated by normalizing the difference between the heats of binding and dilution to the moles of ligand introduced in each injection and averaging ΔH values from the initial part of the binding isotherm before the heat of binding begins to decrease, i.e., pretransition ΔH values. To minimize any error arising from one-to-one subtraction of the heats of dilution, multiple ligand into buffer titrations were performed, and the obtained heats were averaged and then subtracted from ligand-DNA titration heats. The model-free ΔH values thus estimated were used for initialization of the fitting procedure to obtain the apparent binding constant (Kapp) and the binding stoichiometry (N). The binding free energy change and the entropy change associated with binding were calculated from the equations
 |
(1) |
and
 |
(2) |
respectively.
Model fitting
Origin 2.9 software provided by Microcal was used to achieve best fits of the binding isotherms to the Wiseman model for a single-site case (Indyk and Fisher, 1998 according to the equation
 |
(3) |
by nonlinear least-squares fitting. (dq/dLT) is the derivative of the heat of binding at a given stage with respect to LT, the total ligand concentration injected until that stage; XR is the molar ratio of the incremental ligand concentration to the DNA  concentration in the cell, i.e., LT/MT; r = 1/(KbMT); and V is the calorimeter cell volume.
Analyses of the spermine- and lipospermine-DNA binding isotherms proved less straightforward than that of the cobalt hexammine-DNA isotherm. In the case of spermine, the deviation present in the transition region of the binding isotherm (see Fig. 4 B), presumably due to DNA collapse, can potentially give rise to two curves based on two different assumptions: i), the datum at molar ratio 0.15 (see Fig. 4 A) represents DNA collapse, causing deviation from the sigmoidal shape of the curve and is therefore manually excluded from the profile before fitting the data; and ii), the datum at molar ratio 0.2 and the two subsequent data points represent DNA collapse. Thus, these points are manually excluded from the second profile (data not shown). Although fittings of the model to the resulting curves yield significantly different parameters than what we report, there is no reason—based on the available data and our understanding of the mechanism of DNA condensation—to select either one of these scenarios over the other. The solid curve in Fig. 4 A is an optimal fit to all the data points in the isotherm; the inverse of the ligand concentration at the midpoint of this curve yields the apparent binding constant (Kapp).
FIGURE 4.
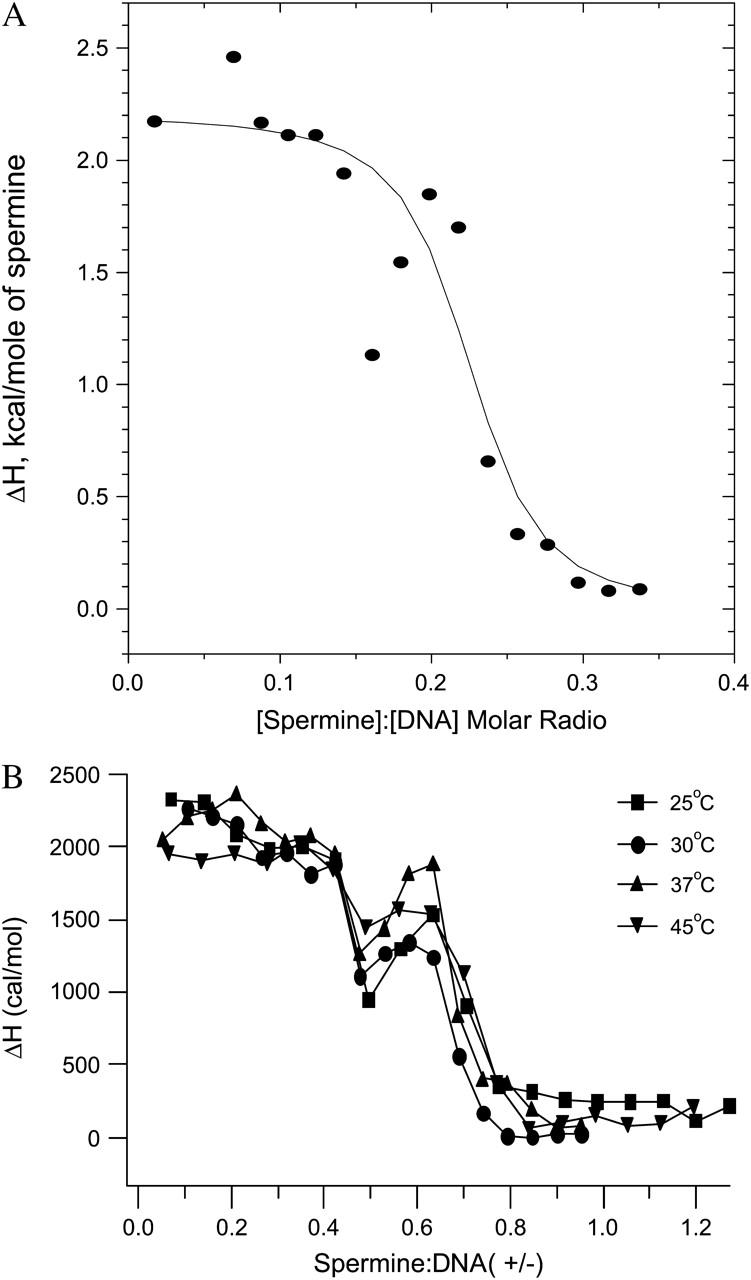
(A) Best nonlinear least-squares fit of the single-site binding model (solid curve) to the spermine-DNA binding isotherm (data points), at 25°C; χ2 = 8.7 × 10⁴. Note: abscissa represents [spermine]/[DNA] molar ratio. (B) ITC isotherms for spermine-DNA binding isotherms at different temperatures. Binding progresses in two stages: i), a pretransition binding phase, and ii), a second endothermic peak suggesting DNA collapse. n = 3; average standard errors are 5.5% for 25°C, 5.6% for 30°C, 5.4% for 37°C, and 19% for 45°C. Note: abscissa represents spermine/DNA (+/−) charge ratio.
Since the model assumes complete saturation at the end of a titration, the nonzero heats observed in the posttransition region of the lipospermine-DNA binding curve (see Fig. 5 B) gave rise to complexities in the fitting procedure of this curve. This yielded considerably poor fits of the model to the binding data. In an attempt to circumvent this problem, the average values of the posttransition heats were subtracted from all data points to normalize the binding enthalpies to a postsaturation baseline (see Fig. 5 A). The molar binding enthalpy used for initiating the fitting procedure was calculated from multiple titrations of subsaturating lipospermine concentrations, where all of the injected lipid binds to the DNA. As we have seen above, the association constant in this model (Kb) depends on the derivative of the heat of binding with respect to the total accumulated ligand concentration, i.e., the profile of the binding curve, rather than its absolute value (Eq. 3). Hence, this modification of the binding curve yields mathematically valid estimates of the apparent binding constant.
FIGURE 5.
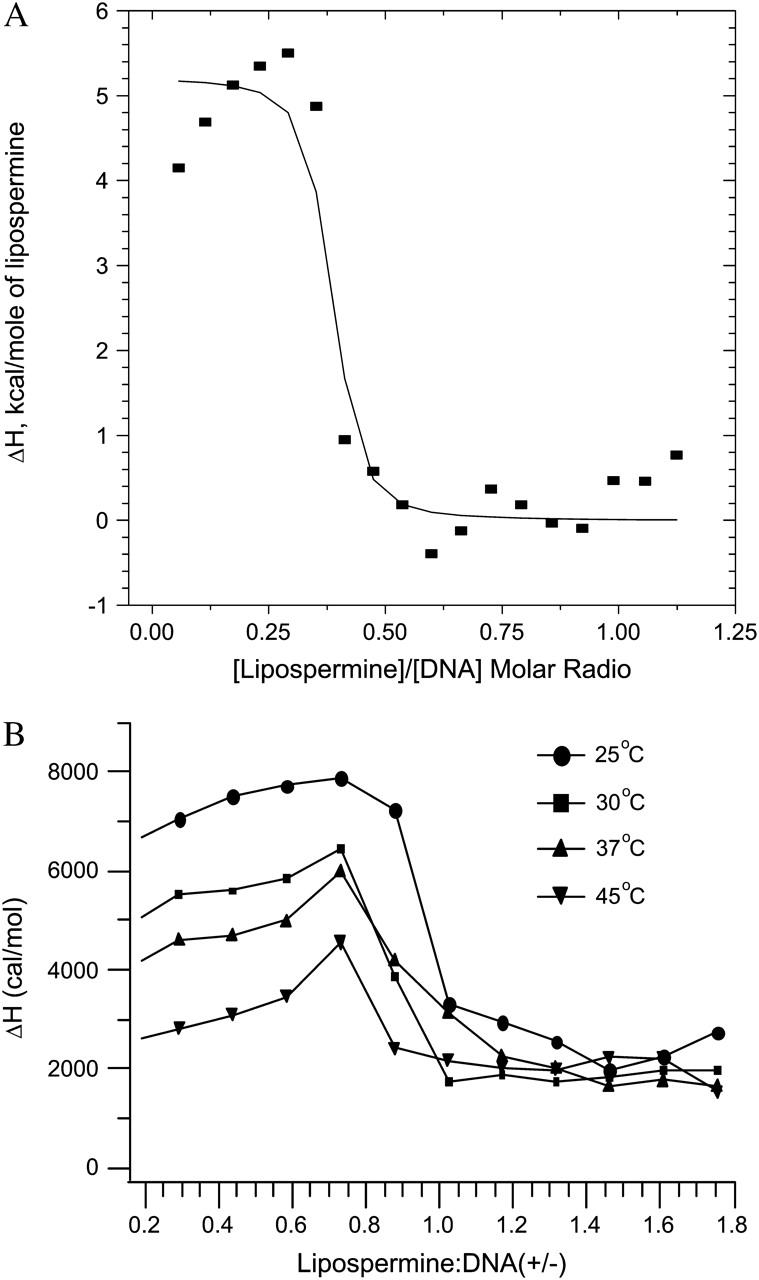
(A) Best nonlinear least-squares fit of the single-site binding model (solid curve) to the lipospermine-DNA binding isotherm (data points), at 25°C; χ2 = 2.99 × 10⁵. Note: abscissa represents [lipospermine]/[DNA] molar ratio. (B) ITC isotherms for lipospermine-DNA binding at different temperatures. The absence of a second endothermic peak suggests that lipospermine does not truly condense DNA. All isotherms yield a nonzero posttransition enthalpy even after subtraction of the dilution heats, suggesting additional interactions between lipospermine and previously formed complexes. The initial increase in the ΔH of binding before DNA saturation at all temperatures is suggestive of positive cooperativity in lipospermine-DNA binding. n = 3; average standard errors are: 8.2% for 25°C, 6% for 30°C, 6% for 37°C, and 9.8% for 45°C. Note: abscissa represents lipospermine/DNA (+/−) charge ratio.
It must be remembered that this model does not take into account molecular details such as the considerable changes in DNA tertiary structure that occur upon spermine induced DNA collapse and positive cooperativity in lipid-DNA binding (Matulis et al., 2002; Spink and Chaires, 1997. Thus, even though the thermodynamic parameters determined from curve fitting are qualitatively sound (see below), their values should be used as a first approximation.
Heat capacity change measurements
The enthalpies of ligand-DNA binding were determined at temperatures from 25°C to 45°C, using the injection parameters reported above. Buffer pH was adjusted at each temperature by addition of HCl or NaOH, and the buffer was used for preparation of all ligand samples. Concentrations of DNA solutions were determined by UV absorbance after all pH adjustments. An Accumet micro pH electrode (Fisher Scientific (Houston, TX) was utilized for pH adjustments of small volumes of lipospermine solutions (800 μl). Heats of dilution for the ligands were determined at all temperatures studied and subtracted from the corresponding ligand-DNA titration heats. Heat capacities associated with ligand-DNA binding were determined from the temperature differential of the ΔH of binding according to the equation
 |
(4) |
It was observed that lipospermine-DNA complexes were prone to aggregation once charge neutrality was reached in the sample cell. This resulted in a baseline shift and dramatically increased the noise for heats of dilution in the posttransition part, especially at higher temperatures. Moreover since the ΔH of binding was found to decrease with increasing temperature, thus considerably reducing the signal/noise ratio, it was not possible to achieve valid fits of the lipospermine binding data at elevated temperatures for determination of parameters other than ΔH.
Dynamic light scattering
Hydrodynamic sizes of spermine-DNA and lipospermine-DNA complexes were determined with the aid of a dynamic light scattering (DLS) instrument—PSS.NICOMP 380 ZLS particle sizer (Santa Barbara, CA). Scattering intensity was detected at 90° at a wavelength of 632.8 nm, using a helium-neon laser. All experiments were carried out at 25°C. DNA and ligand solutions were prepared in 0.22 μm Millipore iltered 5 mM HEPES buffer (pH 6). A total solution volume of 0.5 ml was used for each measurement, wherein DNA concentrations were equal to those used in the ITC experiments—165 μg/ml for spermine-DNA and 33 μg/ml for lipospermine-DNA complexes. To further simulate ITC conditions, complexes were prepared by titration of ligand into the same DNA sample instead of preparing individual samples for each charge ratio. Instead of a 4 min interval between successive ligand injections as used in ITC experiments, a 10 min interval was employed to allow complexes to equilibrate in the absence of stirring. The basis for the choice of this time period was stabilization of the intensity-, volume-, and number-weighted particle sizes. Data are reported as means of three such separate titrations. At pH 6, charge values of +4 and +3 for spermine and lipospermine, respectively, were used to calculate the overall charge ratio (see Results). The sizes are reported as mean number-weighted diameters and could be described well, and with a high reproducibility, as a Gaussian (unimodal) distribution.
Electron microscopy
Distilled water passed through 0.22 μm Millipore filters was used for preparation of all samples. Buffer was not used for EM sample preparations to reduce background contribution from trace levels of salts. Spermine-DNA or lipospermine-DNA samples were prepared by simple mixing of appropriate volumes of condensing agent and DNA solutions to achieve the desired charge ratio and a final volume of 500 μl with a DNA concentration of 1 μg/ml, i.e., 3.03 μM in phosphates. Samples with calculated charge ratios (+/−) ranging from 0.25 to 2 were prepared. After mixing, samples were incubated for 2 h before they were loaded onto EM grids. DNA condensates have been shown to achieve stability within this period (Arscott et al., 1995; He et al., 2000).
Carbon-coated copper grids, pretreated with glow discharge, were floated face down for 3 min on a drop of sample pipetted onto a glass slide. This was repeated to ensure a sufficient sample load. Excess sample was dried off by gently touching the edge with a piece of filter paper, followed by staining with a drop of 1% uranyl acetate for 5 min. Uranyl acetate solutions were freshly prepared with filtered water before each experiment. Samples were examined and photographed at magnifications of 52,000× and 73,000×, as deemed suitable, in a Philips CM10 electron microscope operated at 80 kV. The final pictures were obtained by a further magnification of 2×.
All ΔH and heat capacity change (ΔCp) measurements in this study have been made at a stage of ligand-DNA binding where there is minimum contribution from DNA aggregation; this was confirmed from ΔHs of binding estimated from 4–5 injections of each ligand into different DNA concentrations (data not shown) and also by DLS. Since no conclusions have been drawn from quantitative comparisons between ITC and EM data, artifacts arising from differences in DNA concentrations used in these experiments are minimized.
In describing the structural changes in DNA associated with binding thermodynamics and those observed with electron microscopy, we use the terms defined by Post and Zimm (1982. The term “condensation” is used to refer to monomolecular compaction as well as to multimolecular agglomeration causing DNA to assume toroidal dimensions. The term “collapse” has been used to denote a precondensation stage and refers to the large reduction in DNA volume, which arises due to neutralization of a critical fraction of DNA phosphates as described by Manning (1978). Post and Zimm (1982 have used the latter term to refer to a reduction in monomolecular DNA volume for which very low DNA concentrations are a prerequisite. Since DNA concentrations used in ITC experiments are much higher, we use the term to include a multimolecular phenomenon.
RESULTS
Isothermal titration calorimetry
Charge states of spermine and lipospermine at pH 6
Each spermine molecule possesses two primary and two secondary amines (Fig. 1 A) with pKas ∼10.9, 10.1, 8.9, and 8.1 (Geall et al., 2000; Hirschman et al., 1967). Using the Henderson-Hasselbalch equation, pH = pKa + log [(base)/(acid)], the net charge carried by a spermine molecule at pH 6 is ∼4, i.e., spermine is completely protonated under the experimental conditions. Thus, the observed ΔH at pH 6 has insignificant contributions from heats of spermine protonation or buffer ionization. In lipospermine (Fig. 1 B), the pKas of the two terminal primary amines and the secondary amine distant from the acyl chains are similar to those in spermine—10.5, 9.5, and 8.4. However, the presence of a carbonyl group on the side chain stabilizes the uncharged form of the closest secondary amine, reducing its pKa to 5.5 (Behr, 1994; Remy et al., 1994). Thus, each lipospermine molecule carries only ∼3.25 charges at pH 6. A possible contribution of this difference between the charged states of spermine and lipospermine to the energetics of binding to DNA is included in the discussion section.
Enthalpy of binding is a function of charge on spermine
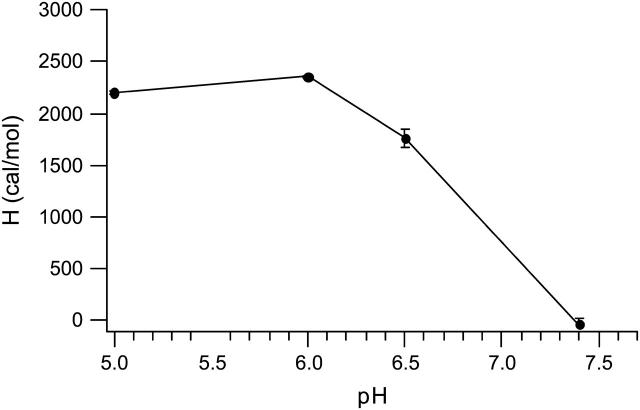
The enthalpy of binding, calculated as described in the methods section, can potentially have contributions from heats of ionization of the buffer and/or ligand, depending on the pKa of the titratable groups present and the experimental pH (Lobo et al., 2001, 2003). Since the amine groups on spermine are titratable (Geall et al., 2000; Hirschman et al., 1967), the enthalpies of spermine-DNA binding were measured at different pH values to determine the pH where contributions from the heat of ionization of ligand could be eliminated (Fig. 2). The increase in ΔH represents an increase in molecular charge as the environmental pH gets more acidic and a plateau in the ΔH can be seen at pH 6 and below, indicative of maximum charge on spermine at these pH values (Fig. 2). This observation explains the reported absence of a heat of interaction between DNA and spermine at pH 7.0 (Ross and Shapiro, 1974. A pH value of 6 was chosen for all thermodynamic measurements involving spermine and lipospermine.
FIGURE 2.
Plot of spermine-DNA binding enthalpies obtained from ITC as a function of buffer pH. Spermine is fully charged at pH 6, as indicated by the maximum ΔH of binding. n = 3; error bars represent standard deviations from average values.
Cobalt hexammine-DNA binding
Fig. 3 A shows a representative binding isotherm, which is fit to a single-site binding model to obtain the apparent binding constant, the free energy change (Eq. 1) and entropy change (Eq. 2) associated with binding. The biphasic nature of the cobalt hexammine-DNA binding profile is apparent from a second endothermic peak which appears above charge neutrality at all temperatures (Fig. 3 B). As the cobalt hexammine begins to saturate the DNA, the binding enthalpy decreases and reaches a zero value at a charge ratio of ∼1.2. This represents the first phase of binding. The unfavorable enthalpy change (ΔH) measured at 25°C in the first phase of binding, +1.613 ± 0.16 kcal/mol (Table 1), is comparable to that reported by Matulis et al. (2000), +1.24 ± 0.1 kcal/mol. Also, the estimated free energy change of binding (ΔG), −7.06 ± 0.27 kcal/mol, the binding constant (K), 1.6 × 10⁵ ± 6.2 × 10⁴ M−1, and the favorable entropy change (ΔS), 29.7 ± 0.36 eu, are in significant agreement with those reported by Matulis et al. (2000), 7.31 ± 0.25 kcal/mol, 2.3 × 10⁵ ± 8 × 10⁴ M−1, and 28.7 ± 1.2 eu, respectively.
FIGURE 3.
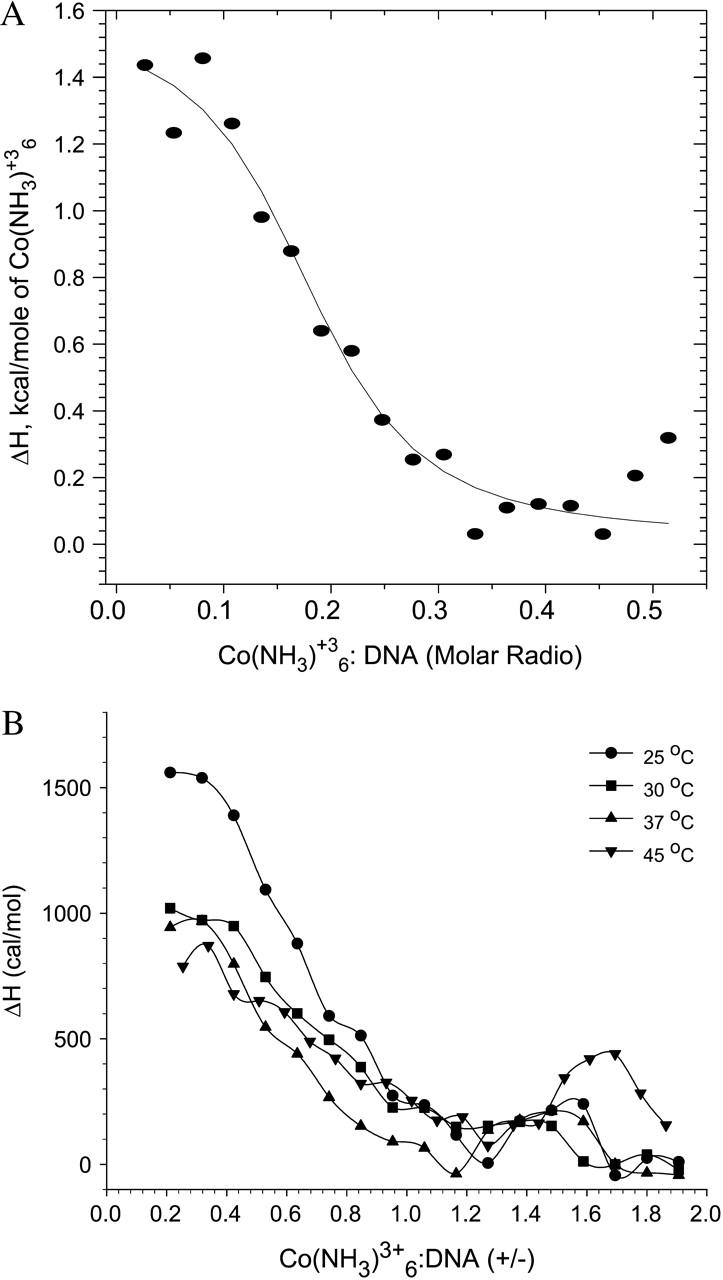
(A) Best nonlinear least-squares fit of the single-site binding model (solid curve) to the cobalt hexammine-DNA binding isotherm (data points) at 25°C; χ2 = 1.5 × 10⁴. Note: abscissa represents [cobalt hexammine]/[DNA] molar ratio. (B) ITC isotherms for cobalt hexammine binding to DNA at different temperatures. Binding proceeds in two stages: i), the pretransition stage yields the ΔH of binding, and ii), the second stage involves an additional enthalpic peak due to DNA collapse. n = 3; average standard errors are 16.3% for 25°C, 24.7% for 30°C, 25.4% for 37°C, and 22.6% for 45°C. Note: abscissa represents cobalt hexammine/DNA (+/−) charge ratio.
TABLE 1.
Thermodynamic parameters for cobalt hexammine, spermine, and lipospermine binding to DNA at 25°C; Kapp, ΔG, ΔS, and N have been estimated by fitting a single-site model to the binding curve
| Ligand | ΔH (kcal/mol) | ΔS (cal/mol K) | ΔG (kcal/mol) | Kapp (M−1) | ΔCp (cal/mol K) | N |
|---|---|---|---|---|---|---|
 |
1.613 ± 0.16 | 29.7 ± 0.36 | −7.06 ± 0.27 | 1.6 × 10⁵ ± 6.2 × 10⁴ | −23.39 | 0.18 ± 0.02 |
| Spermine | 2.393 ± 0.009 | 32.81 ± 1.01 | −7.55 ± 0.12 | 3.5 × 10⁵ ± 7 × 10⁴ | −17.98 | 0.214 ± 0.02 |
| Lipospermine | 7.2 ± 0.55 | 54.23 ± 1.76 | −8.96 ± 0.52 | 4.5 × 10⁶ ± 3.5 × 10⁶ | −238.92 | 0.4 ± 0 |
N = number of moles of ligand/mole of nucleotide.
n = 3.
The second phase of binding is characterized by an additional posttransition, endothermic heat at a charge ratio of ∼1.5, which has been suggested to represent DNA collapse (Matulis et al., 2000). This peak appears at the same charge ratio (∼1.5) at 25°C, 30°C, and 37°C; however, this charge ratio is shifted to a higher value (∼1.7) at 45°C, and the associated endothermic peak appears larger in magnitude. Since a continuous trend in the charge ratio shift is absent, we did not attribute any physical meaning to the deviation in the second endothermic peak observed at 45°C.
It must be noted that the binding parameters from the Matulis et al. (2000) study were determined in the presence of 10 mM NaCl, whereas no salt was used in our study. By DNA charge screening, and hence competitive binding, the critical concentration of cobalt hexammine required to induce DNA collapse should be increased in the presence of NaCl (Manning, 1978; Matulis et al., 2000). Thus, a shift of the second endothermic peak to lower charge ratios would be expected in our study. On the contrary, whereas the second phase of binding in their study was observed at a (+/−) charge ratio of ∼1, we did not detect it until a (+/−) charge ratio of 1.5. We have not further investigated the reason for this discrepancy.
Spermine-DNA binding
Similar to cobalt hexammine, spermine binding to DNA can be viewed as a two stage process (Fig. 4): i), Complete binding of the ligand to isolated sites on the polynucleotide lattice in the pretransition part of the isotherm, which yields an unfavorable ΔH of binding (+2.393 ± 0.009 kcal/mol; Table 1). It must be noted that at this stage the spermine concentration is not high enough to induce substantial suprastructural rearrangements in DNA (see Fig. 8, B and C), hence the ΔH is unlikely to have any significant contributions from changes in tertiary conformation of DNA. And ii), A second endothermic peak is observed at a charge ratio of ∼0.5. A similar biphasic profile is observed upon binding of spermidine to DNA although, as would be expected for a smaller polyamine, the second enthalpic peak is observed at a higher (+/−) charge ratio (Matulis et al., 2000).
FIGURE 8.
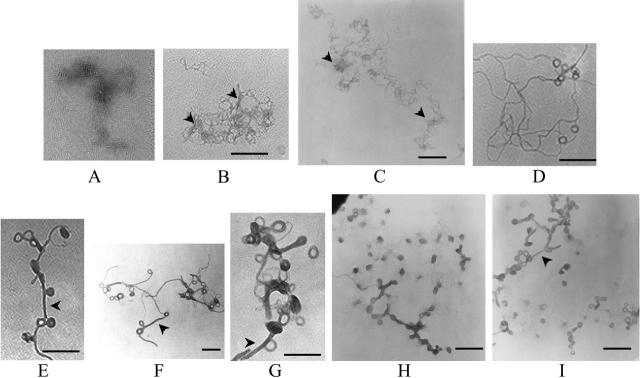
Electron micrographs of spermine-DNA complexes at different (+/−) charge ratios: (A) naked DNA, (B) 0.5, (C) 1, (D) 1.25, (E and F) 1.5, (G) 1.75, and (H and I) 2. Theoretical charge ratios are calculated using +4 for spermine and +1 for DNA phosphate. Arrowheads in B and C: local DNA clustering due to partial charge neutralization; arrowheads in E, F, G, and I: condensed DNA forming networks between toroids. [DNA] = 1 μg/ml. Bars ∼200 μm.
As expected for electrostatic interactions, a compensating, favorable entropy change (ΔS) is observed (+33.38 ± 0.37 cal/mol K), which drives the Gibbs free energy change (ΔG; −7.55 ± 0.12 kcal/mol) for complex formation, with an estimated binding stoichiometry (N) of 0.214 ± 0.02 defined as moles of ligand/polynucleotide phosphate, or 4.67 phosphates/(mol of spermine). This value is in significant agreement with a previously reported site size of 4.46 phosphates/(mol of spermine) for the binding of spermine to plasmid DNA (Watanabe et al., 1991). The calculated apparent binding constant of 3.5 × 10⁵ ± 7 × 10⁴ M−1 (Table 1) agrees well with that reported by Ouameur and Tajmir-Riahi (2004 2.3 × 10⁵ M−1). However, there is a discrepancy when these values are compared to those in other reports: 7.14 × 10³ M−1 (Hirschman et al., 1967) and 9.09 × 10³ M−1 (Shapiro et al., 1969) to 5.9 × 10⁸ M−1 (Porschke, 1984).
There is a relatively small change in the ΔH of spermine-DNA binding with increasing temperatures (see Fig. 6). This is also true for the spermine concentration required to induce DNA collapse, i.e., the charge ratio at which the second endothermic peak is observed remains constant throughout the studied temperature range. Closer inspection reveals a progressive increase in the magnitude of the ΔH value at charge ratio 0.5, with increasing temperatures (Fig. 4 B). However, a corresponding trend is not seen in the second endothermic ΔH peak value, at charge ratio 0.6 (Fig. 4 B).
FIGURE 6.
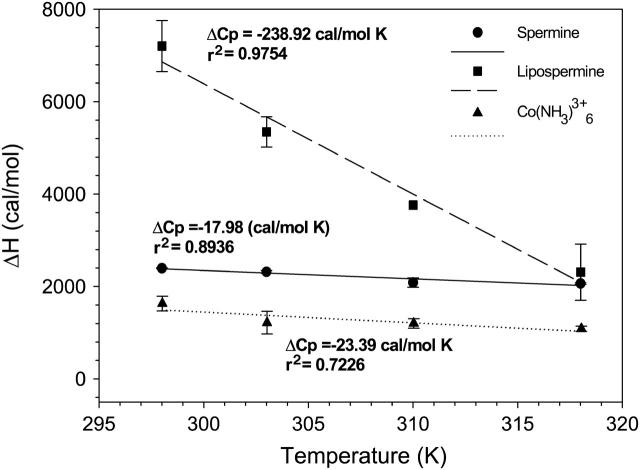
Plots of molar enthalpies of binding of cobalt hexammine (triangles), spermine (circles), and lipospermine (squares) to DNA as a function of temperature. The slope of each plot yields the respective ΔCp of binding. n = 3; error bars represent standard deviations from average values.
Lipospermine-DNA binding
Despite the presence of multiple charges on lipospermine, the second endothermic peak was not observed in the lipospermine-DNA binding profile (Fig. 5), suggesting the absence of true DNA collapse. This postulation is supported by the similarity of the binding profile, in this aspect, to those reported for binding of DNA to monovalent, noncondensing lipids (Lobo et al., 2001; Matulis et al., 2000; Pozharski and MacDonald, 2002 Spink and Chaires, 1997) and by the absence ofcondensed toruses in the lipospermine-DNA electron micrographs (see Fig. 9). The enthalpy for lipospermine-DNA binding (7.2 ± 0.5 kcal/mol) is 3 times larger at 25°C than that measured for spermine-DNA binding (2.393 ± 0.009 kcal/mol; Table 1). This increase in unfavorable enthalpy is compensated by a larger entropy change for lipospermine-DNA binding (54.23 ± 1.76 cal/mol K; Table 1) that contributes to a larger binding affinity (4.5 × 10⁶ ± 3.5 × 10⁶ M−1) as compared to spermine (3.5 × 10⁵ ± 7 × 10⁴ M−1). This larger binding constant is likely due to the positive cooperativity of lipid-DNA binding (Spink and Chaires, 1997, which is suggested by the slightly positive slope of the pretransition part of the lipospermine-DNA binding isotherms at all temperatures (Fig. 5).
FIGURE 9.
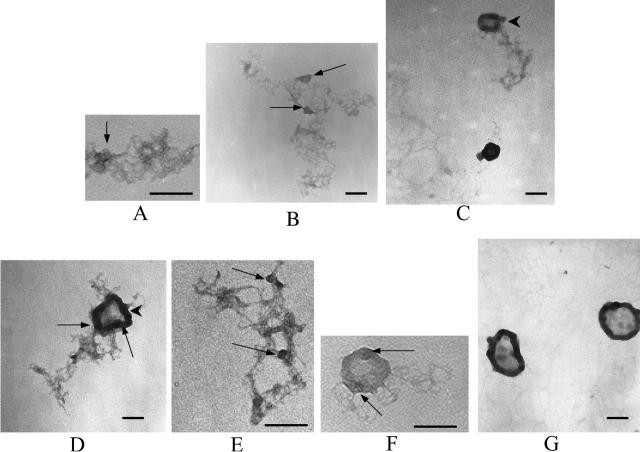
Electron micrographs of lipospermine-DNA complexes at different (+/−) charge ratios: (A) 0.375, (B) 0.5, (C) 1, (D) 1.25, (E) 1.25, (F) 1.5, and (G) 2. Theoretical charge ratios are calculated using +3 for lipospermine and +1 for DNA phosphate. Arrowheads in C and D: collapsed DNA ordered as “tubular” structures; arrows in A, B, D, E, and F: dense regions in the lipospermine-DNA network that persist even at higher [lipospermine]. [DNA] = 1 μg/ml. Bars ∼200 μm.
The exothermic posttransition, i.e., after phosphate saturation, heats in lipospermine-DNA binding experiments were smaller in magnitude than the heat of dilution of lipospermine giving rise to an endothermic, nonzero posttransition ΔH of binding after subtraction of the heat of dilution (Fig. 5). That this heat ( +2 kcal/mol) could not be the heat of micelle formation due to buildup of free lipospermine in solution after DNA saturation is suggested by the observation that the critical micellar concentration of lipospermine is >300 μM (as determined by surface tension measurements; data not shown), which is considerably greater than the highest concentration achieved in the ITC cell at the end of any titration (∼100 μM). Thus, we speculate that even after phosphate saturation, there is some hydrophobic interaction between injected lipospermine molecules and the lipospermine-DNA complexes, which gives rise to this ΔH difference.
Hydrodynamic particle size
To simulate the conditions used in ITC experiments, light scattering titration studies were carried out with the same DNA and ligand concentrations. However, due to nonavailability of a stirring apparatus in the light scattering instrument, complex aggregation was observed at high charge ratios (≥1), both for spermine- and lipospermine-DNA complexes. As a result, particle sizes for these charge ratios could not be obtained. No such aggregation is observed at the end of ITC titrations.
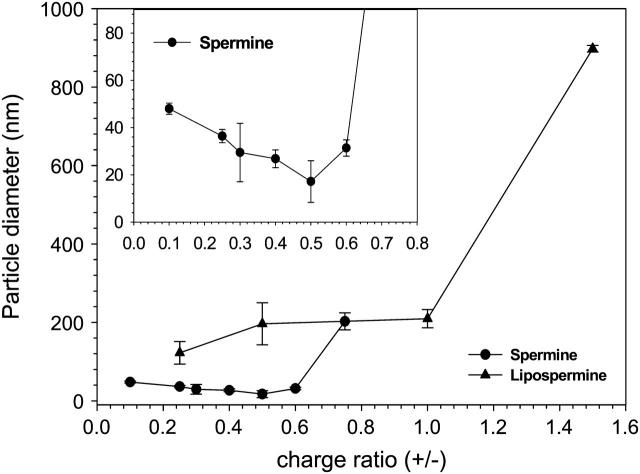
There is a marked differentiation between the hydrodynamic diameters of spermine-DNA and lipospermine-DNA complexes (Fig. 7). At charge ratios below 0.6, spermine-DNA complexes were comparatively small (≤50 nm), with particle diameter decreasing as spermine concentration is increased, and the lowest average size is observed at a charge ratio of 0.5. Upon analysis of the spermine-DNA particle sizing data using an intensity-weighted bimodal distribution, similar sizes are obtained for the predominant species in the population. There also exists a smaller fraction of larger sized complexes (400–800 nm), the percentage of which increases above (+/−) 0.5 (data not shown).
FIGURE 7.
Hydrodynamic particle sizes of spermine-DNA (circles) and lipospermine-DNA (triangles) complexes at different complex charge ratios as determined by DLS. n = 3; error bars represent standard deviations from average values. (Inset) Expanded axes for spermine-DNA complex particle sizes.
Until a charge ratio of 1, lipospermine-DNA complexes exhibit rather constant sizes (∼200 nm). These sizes are consistent with those obtained from electron microscopy studies (see below). The smallest size for lipospermine-DNA complexes is observed at a (+/−) of 0.25 (∼120 nm). Above a charge ratio of 1, visible aggregates could be seen in the cuvette, invalidating further measurements.
Electron microscopy
Spermine-DNA
In the absence of spermine, we found it difficult to obtain sharp images of DNA. These diffuse structures appear in various shapes and sizes, suggesting that the larger structures contain more than one plasmid (Fig. 8 A). Spermine-DNA complexes without any defined structure are seen up to a charge ratio of 1 (Fig. 8, B and C), and it is not until a charge ratio of 1.25 is reached that significant numbers of compact toroidal structure become apparent (Fig. 8 D). Toroids are more prevalent at higher spermine concentrations, but not all of the DNA is present in toroidal form, as is suggested by the presence of DNA helices emanating from these toroids (Fig. 8, D–H). This is true for all charge ratios where toroids are observed, i.e., (+/−) = 1.25 and above (Fig. 8, D–I). The majority of the toroids are observed in clusters, either with other toroids or among nontoroidal DNA helices, depending on spermine concentration (Fig. 8, F and I). The average outer diameter (∼50 nm) measured in this study is more consistent with that reported for cobalt hexammine-DNA toroids (∼40 nm; Arscott et al., 1995) than that for other ligands such as spermidine (>100 nm; Allison et al., 1981; Wilson and Bloomfield, 1979.
Lipospermine-DNA
Interestingly, very few isolated DNA helices, i.e., not present in networks, are seen below charge neutrality, whereas relatively larger numbers of these are seen for spermine-DNA complexes (arrowhead in Fig. 8 B). Even though there is a condensing element in lipospermine (Fig. 1 B), the resulting structures do not assume toroidal dimensions (Fig. 9, C–G). At charge ratios ≥1, the average lipospermine-DNA complex seems to be ∼4 times larger in size (∼200 nm) than the spermine-DNA toroids. Determination of representative values for the diameter of lipospermine-DNA complexes is difficult due to the lack of consistent dimensions in these structures. Although a toroidal structure is not apparent at any charge ratio, larger aggregates resembling thick “tubes” begin to appear at (+/−) charge ratios 1 and 1.25 (arrowheads in Fig. 9, C and D). However, DNA helices that have not collapsed to form tubes can still be seen at 1.25 (Fig. 9 E). The tubular structures appear more frequently at higher lipospermine concentrations, where a circular tube with a dense periphery and a “webbed” interior is a common feature (Fig. 9, D and G). Unlike toroids (Fig. 8, E–G), the interiors of these structures are darker than the background (Fig. 9, E and F), suggesting the encircling of DNA and/or lipospermine by the tubular structure. At charge ratios ≤1.5, DNA helices can be seen radiating outwards from the tubes in a manner analogous to that seen for toroids. At a charge ratio of 2, very few such helices could be seen, although the sizes of the tubes varied considerably and were larger than those at lower charge ratios (Fig. 9 G).
DISCUSSION
Heat capacity changes
An advantage offered by estimation of heat capacity changes (ΔCp) associated with ligand-macromolecule binding is that changes in hydrophobic and polar hydration can be differentiated (Spolar et al., 1992). Unlike other thermodynamic parameters which have contributions from various sources, ΔCp is believed to arise purely from molecular solvation or desolvation associated with binding (Baldwin, 1986 Murphy and Gill, 1990 Spolar et al., 1992) and hence this parameter can be utilized to estimate the extent of burial or exposure to water of polar and nonpolar groups upon macromolecular binding. It should be noted that calorimetric ΔHs of ligand-DNA binding calculated from the pretransition part of the binding profiles at all temperatures bear no structural assumptions. Hence the ΔCp values are not derived from any model-dependant parameters.
The estimation of a slightly negative ΔCp seems unusual for cobalt hexammine and spermine binding to DNA (Table 1); binding of these molecules to DNA would be expected to yield a positive ΔCp due to burial of polar groups (0.14 cal/mol K Å2; Spolar et al., 1992). However, we feel that this discrepancy is likely due to the inherent variability in determining ΔCp values as reported by Matulis et al. (2000) for cobalt hexammine-DNA binding (values range from 20 to 50 cal/mol K). Regardless, comparable ΔCp values for cobalt hexammine- and spermine-DNA binding (Table 1) suggest that there is minimal contribution from changes in the hydration state of the CH2 groups in spermine to the net binding energetics. The absence of hydrophobic interactions between CH2 groups in spermine seems more likely when one takes into account that i), the difference between the ΔCp values for spermine (−17.98 cal/mol K) and cobalt hexammine (−23.39 cal/mol K) binding to DNA is 5.41 cal/mol K (Table 1), and ii), the heat capacity change upon burial of a methylene group is −13.38 cal/mol K (Heerklotz and Epand, 2001.
The contribution from electrostatic interactions to enthalpy of cation binding to DNA can be calculated from Matulis et al. (2000):
 |
(5) |
where υ is the experimentally determined parameter for the temperature dependence of the dielectric constant of water, and z is the ligand valence. The theoretical electrostatic enthalpies, based on this relationship, are 0.71 kcal/mol for cobalt hexammine- and lipospermine-, and 0.947 kcal/mol for spermine-DNA binding (Table 2). Based on the discussion presented above, the differences in theoretical and measured enthalpies for cobalt hexammine and spermine binding to DNA may arise due to interactions between the ammonium ions and groups present in DNA bases (Egli et al., 1991; Tari and Secco, 1991. Indeed, amine groups in spermine have been postulated to interact with different sites in the major groove (Gessner et al., 1989; Tari and Secco, 1991 as well as in the minor groove (Bancroft et al., 1994; Schmid and Behr, 1991. Release of water molecules associated with such binding events may account for the nonelectrostatic, unfavorable ΔH of binding. We suggest that the large nonelectrostatic component of lipospermine-DNA binding enthalpy at 25°C (Table 2) arises as a result of burial of acyl chains upon binding to DNA that becomes relatively more favorable at higher temperatures (Fig. 5).
TABLE 2.
Electrostatic and nonelectrostatic enthalpies of binding of cobalt hexammine, spermine, and lipospermine to DNA
| Ligand | ΔHelec (kcal/mol) | ΔHnonelec (kcal/mol) |
|---|---|---|
 |
+ 0.71 | + 0.903 |
| Spermine | + 0.947 | + 1.446 |
| Lipospermine | + 0.77 | + 6.43 |
Changes in lipid hydration state upon lipospermine-DNA binding
Before DNA collapse, all changes in the hydration state of spermine and the headgroup in lipospermine would be similar upon binding to DNA. Hence, subtraction of the heat capacity change of spermine-DNA binding (ΔCp spermine) from that of lipospermine-DNA binding (ΔCp lipospermine) should provide an estimate for the contribution of lipospermine acyl chain burial (ΔCpφ) upon binding to DNA. The difference between the number of charges carried by spermine (+4) and lipospermine (+3) at pH 6 was not accounted for while estimating ΔCpφ because the incremental heat capacity change per charge for spermine-DNA binding is small (−4.5 cal/mol K) and most likely within the error of measurement of the ΔCp for lipospermine-DNA binding. Furthermore, it is quite unlikely that electrostatics would make a significant contribution to the net heat capacity change, since the overall heat capacity of lipospermine-DNA binding is relatively large (Gallagher and Sharp, 1998.
For saturated hydrocarbon chains, the buried hydrophobic surface area can be expressed as the heat capacity change per buried methylene group, −13.38 cal/mol K (Heerklotz and Epand, 2001. Thus, the calculated ΔCpφ, −220.94 cal/mol K indicates that ∼17 CH2 groups are buried, i.e., only ∼50% of the CH2 groups undergo changes in solvent exposure upon binding to DNA. It has been shown that in diacyl amphiphiles, each chain partially buries the other in water, covering 20% of the total surface (Tanford, 1980), which suggests that after binding ∼30% of the two acyl chains on a lipospermine molecule remain hydrated, i.e., ∼11 CH2 groups. This is consistent with a model presented by Matulis et al. (2002) for dodecylammonium-DNA complexes. Presumably, this level of hydration is due to the large ratio of the cross-sectional surface area of the lipospermine head group to that of the hydrocarbon chains, which may hinder their efficient packing around DNA. Moreover, the linker region between the head group and the acyl chains in lipospermine contains two carbonyl groups which can readily form hydrogen bonds with water molecules. This would introduce more water molecules in the vicinity of the first methylene group on each chain and that of DNA. This is not surprising considering the maintenance of DNA in the B-form upon lipospermine/DNA complex formation (as determined by CD spectroscopy; data not shown).
Dynamics of spermine induced DNA collapse
For spermine-DNA binding, the heat of collapse is represented by the second enthalpic peak observed at charge ratio 0.6 (Fig. 4). At charge ratio 0.5, the reduction in ΔH of binding would arise as a collective result of i), decreased accessibility of binding sites to spermine molecules due to partial saturation of DNA helices, and ii), dipole-dipole interactions between water molecules oriented favorably on adjacent DNA helices (Rau and Parsegian, 1992 Strey et al., 1998). It is difficult to differentiate between these two phenomena since DNA concentrations required for ITC experiments are high enough so that saturation of individual DNA helices is not a prerequisite for a multimolecular collapse (Post and Zimm, 1982. At this stage, sufficient spermine molecules have bound to DNA to reduce the large repulsive electrostatic interactions between adjacent DNA phosphates, on the same as well as on neighboring helices (Fig. 10 B). This would not only allow a single strand to bend upon itself but would also facilitate neutralized regions from two or more helices to approach each other. The latter event is made favorable by intermolecular bridging by spermine (Neidle, 1999; Schellman and Parthasarathy, 1984 Fig. 10 C) as well as by hydration forces due to water dipole-dipole interactions between helices (Rau and Parsegian, 1992. We speculate that these events result in DNA collapse as indicated by the coalescence of two or more partially saturated DNA helices into thicker “cord”like structures, the initiation of which is represented by the second calorimetric endothermic peak, and also suggested by the appearance of thicker regions at charge ratios lower than 1 in spermine-DNA networks (arrowheads in Fig. 8, B and C). Such collapsed regions eventually lead to toroid formation and also to links between toroids at higher charge ratios (arrowheads in Fig. 8, E, F, G, and I).
FIGURE 10.
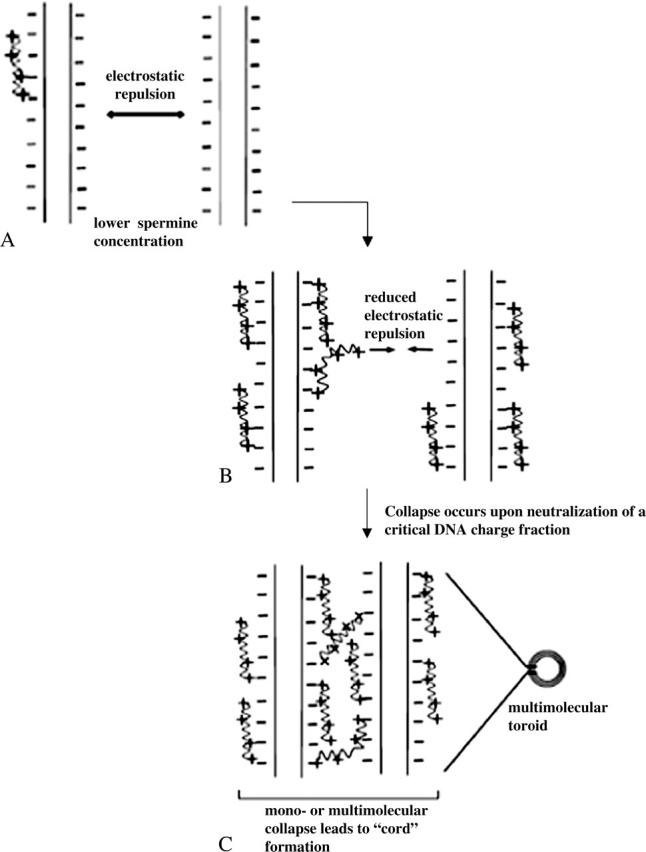
Pictorial representation of spermine-DNA binding and collapse. (A) Electrostatic repulsion between helices is predominant at lower spermine concentrations, which prevents close approach of multiple plasmids, (B) a partially bound spermine molecule can bring 2 or more helices into close contact by reducing this repulsion and forming intermolecular bridges, and (C) at higher spermine concentrations, multiple helices collapse together. Such collapsed helices then form multimolecular “cords” packed with spermine molecules, which are then recruited into toroids.
It is difficult to comment on whether the particle sizes determined from light scattering and toroid diameters calculated from EM can be correlated. First, the minimum size obtained from DLS experiments (17 ± 8.8 nm) is significantly smaller than toroid diameters calculated from EM (54 ± 8 nm). This is surprising, considering that aggregation related artifacts are known to cause increased light scattering which can be falsely interpreted to mean that larger particle sizes are present (Arscott et al., 1995). The difference can be reconciled by noting that drying of samples in EM might introduce concentration-related artifacts; this would explain the observation of agglomerates at lower charge ratios in EM (Fig. 8, B and C) when no aggregated complex sizes are suggested by the light scattering data (Fig. 7). Second, toroids are not seen until a charge ratio of 1.25, whereas the minimum spermine-DNA particle size from the light scattering studies is observed at a much lower ligand concentration (∼0.5; Fig. 7). Although no toroids could be detected with EM at (+/−) 0.5 (Fig. 8 B), the DNA concentrations used for these experiments were 165 times lower than those used in light scattering studies. Electron micrographs at the higher DNA concentration were characterized by drying induced aggregation. It must be remembered that toroid formation is not the only structural definition of DNA condensation, and that the cordlike network between toroids (Fig. 8, E–I) is also a form of condensed DNA consisting of multiple DNA strands (Arscott et al., 1995; Sitko et al., 2003).
Interestingly, there is a significant qualitative correlation between the ITC and light scattering data in that the particle size attains a minimum (17 ± 8.8 nm) in the same charge ratio range where the enthalpy of spermine-DNA binding displays a second endothermic peak, i.e., 0.5–0.6. This is a significant observation and supports the contention that the latter might represent DNA collapse. To the best of our knowledge, such a correlation between the calorimetric second endothermic peak and structural aspects of DNA condensation has not been established. However, the relationship, if any, between DNA collapse/condensation and toroid formation remains to be studied.
After the collapse of partially saturated DNA, subsequently injected spermine molecules continue to bind to DNA as evidenced by the rise in ΔH of binding before it decreases due to phosphate saturation (Fig. 4). Indeed, it has been theorized that a higher binding affinity of ligand to the collapsed form of DNA is a prerequisite for ligand induced DNA collapse and condensation (Lando and Teif, 2002. This is consistent with a previous study showing that the increase in ΔH above charge ratio 0.5 is accompanied by a favorable entropy (Matulis et al., 2000). It is possible that, upon collapse, in addition to spermine-DNA binding the favorable entropy arises from considerable changes in the tertiary conformation of DNA, i.e., initiation of cord formation.
Ligand-specific effects on DNA binding and collapse
For cobalt hexammine, the second phase of ligand-DNA binding is not observed until the charge ratio >1 (Fig. 3; Matulis et al., 2000), whereas it is observed at approximately half that value, i.e., 0.6, for spermine (Fig. 4). Even though the number of charges on these ligands suggests that the saturated charge fractions of DNA, calculated from the counterion condensation theory (Manning, 1978) are sufficient for DNA collapse (Bloomfield, 1991 Manning, 1978), 0.92 and 0.94, respectively, the charge ratios where these ligands induce collapse are significantly different. This discrepancy presumably arises because the theory treats all charges as point charges and does not take molecular details of the ligand into account. Indeed the longer length of the spermine molecule has been shown to facilitate interplasmid bridging (Neidle, 1999; Schellman and Parthasarathy, 1984 and likely favors simultaneous collapse of neighboring DNA helices at less than stoichiometric concentrations, whereas a higher cobalt hexammine concentration is required for DNA collapse.
The absence of a second endothermic peak in the lipospermine-DNA binding isotherm suggests that lipospermine does not induce true DNA collapse. Considering that hydration forces are active at interaxial distances of ∼3 nm (Strey et al., 1998), which is approximately equal to the acyl chain length of a single lipospermine molecule, a possible reason for the absence of collapse is the steric barrier posed by the acyl chains to DNA collapse (Fig. 11). Thus, if two lipospermine molecules are considered to be bound to DNA with acyl chains aligned perpendicular to the axes of two helices, the acyl chains would prevent the close approach of DNA helices that is required for a multimolecular collapse (Fig. 11, B and C). This contention combined with the absence of a second endothermic peak in lipospermine-DNA binding leads us to suggest that, as opposed to spermine-DNA binding, a partially collapsed structure is not formed in this case.
FIGURE 11.
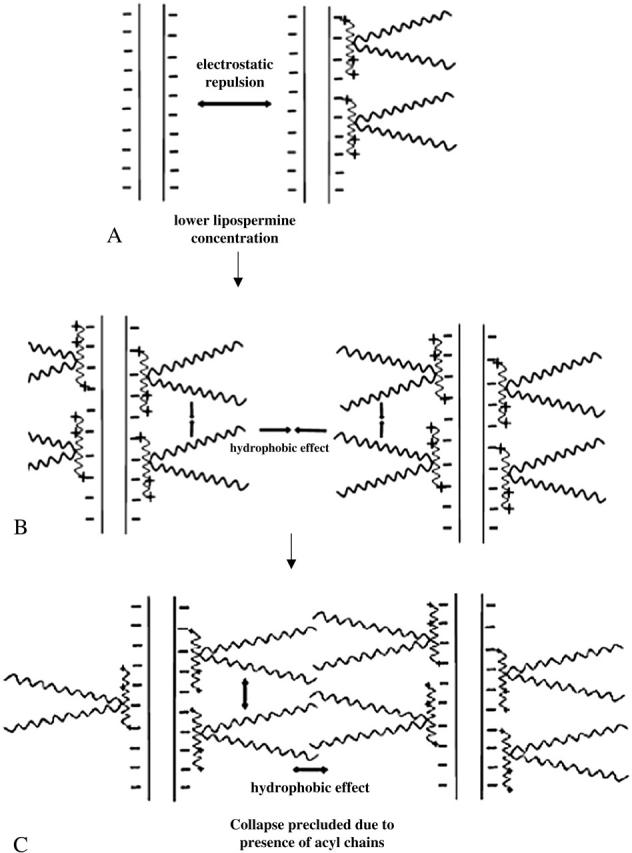
Pictorial representation of lipospermine-DNA binding. (A) Helices are separated due to electrostatic repulsion, (B) as more lipospermine molecules bind to DNA, the acyl chains bound on the same as well as on neighboring helices coalesce together owing to the hydrophobic effect, thereby bringing multiple plasmids together, and (C) despite such a multimolecular coalescence of DNA helices, tight packaging of DNA is precluded due to the steric barrier posed by the acyl chains.
Owing to the presence of a condensing element in lipospermine, it was anticipated that the resulting complexes would be more compact than monovalent lipid-DNA complexes, which are ∼200–300 nm in diameter (Gustafsson et al., 1995; Kennedy et al., 2000; Simberg et al., 2001), if not as compact as toroids. However, the EM pictures show that the sizes of the resulting structures (∼200 nm and larger; Fig. 9, D and G) are consistent with those of monovalent cationic lipid-DNA complexes. As suggested above, this is likely due to the presence of the acyl chains in lipospermine (Fig. 11 C). Even though these sizes are in significant agreement with those obtained from light scattering studies (Fig. 7), the tubular structures could not be seen until a charge ratio of 1 (Fig. 9 C), whereas light scattering suggests that structures of ∼200 nm diameter are present even at lower charge ratios. Contrary to spermine-DNA complexes, areas with local DNA clustering below charge neutrality appear denser in the lipospermine-DNA network (arrows in Fig. 9, A and B). Based on the observation that these dense regions persist in the complexes even after formation of the large tubular structures is complete (arrows in Fig. 9, D and F), we propose that these regions act as nucleating sites around which subsequent DNA helices are assembled into the final tubular structures. A similar observation has been used to make an analogous suggestion in an earlier study, where structures of lipospermine-DNA complexes were studied by scanning force microscopy (Dunlap et al., 1997). This mode of complex formation supports the notion of positive cooperativity in lipospermine-DNA binding.
CONCLUSIONS
In summary, there seems to be no significant contribution from hydrophobicity to spermine-DNA binding. Even though the higher hydrophobicity of lipospermine yields a larger DNA binding affinity, it precludes true DNA condensation as defined by compaction into toroidal dimensions. This is suggested by measurements made under dry as well as solution conditions. Based on these findings, we postulate that even though hydrophobicity of multivalent cationic lipids may drive DNA binding and a multimolecular coalescence, it would contribute minimally to the actual event of DNA packaging into dimensions comparable to those observed in viral heads and sperm cells. Although the less efficient DNA packaging induced by cationic lipids hampers cellular uptake, the consistent observation that these agents facilitate gene delivery suggests that hydrophobicity is important for other steps in the transfection process, e.g., membrane fusion. Moreover, the tendency of hydrophobic groups to remain isolated from a polar environment presumably renders the bound DNA less accessible to degrading nucleases.
Acknowledgments
We highly appreciate the valuable inputs provided by Dr. Brian Lobo (Genentech, San Francisco, CA) regarding the ITC experiments; and the help provided by Dot Dill with electron microscopy. We are also thankful to Dr. David Bain and Dr. Carlos Catalano (University of Colorado Health Sciences Center) for their perceptive comments, which have helped us in preparing this manuscript.
References
- Allison, S. A., J. C. Herr, and J. M. Schurr. 1981. Structure of viral psi-29 DNA condensed by simple triamines—a light scattering and electron-microscopy study. Biopolymers. 20:469–488. [DOI] [PubMed] [Google Scholar]
- Anselmi, C., G. Bocchinfuso, P. De Santis, M. Savino, and A. Scipioni. 1999. Dual role of DNA intrinsic curvature and flexibility in determining nucleosome stability. J. Mol. Biol. 286:1293–1301. [DOI] [PubMed] [Google Scholar]
- Arscott, P. G., C. Ma, J. R. Wenner, and V. A. Bloomfield. 1995. DNA condensation by cobalt-hexaammine (III) in alcohol-water mixtures: dielectric constant and other solvent effects. Biopolymers. 36:345–364. [DOI] [PubMed] [Google Scholar]
- Baldwin, R. L. 1986. Temperature dependence of the hydrophobic interaction in protein folding. Proc. Natl. Acad. Sci. USA. 83:8069–8072. [DOI] [PMC free article] [PubMed] [Google Scholar]
- Bancroft, D., L. D. Williams, A. Rich, and M. Egli. 1994. The low-temperature crystal structure of the pure-spermine form of Z-DNA reveals binding of a spermine molecule in the minor groove. Biochemistry. 33:1073–1086. [DOI] [PubMed] [Google Scholar]
- Barreleiro, P. C. A., G. Olofsson, and P. Alexandridis. 2000. Interaction of DNA with cationic vesicles: a calorimetric study. J. Phys. Chem. B. 104:7795–7802. [Google Scholar]
- Behr, J. P. 1994. Gene transfer with synthetic cationic amphiphiles: prospects for gene therapy. Bioconjug Chem. 5:382–389. [DOI] [PubMed] [Google Scholar]
- Bloomfield, V. A. 1991. DNA condensation by multivalent cations—considerations on mechanism. Biopolymers. 31:1471–1481. [DOI] [PubMed] [Google Scholar]
- Böttcher, C., C. Endisch, J.-H. Fuhrhop, C. Catterball, and M. Eaton. 1998. High-yield preparation of oligomeric C-type DNA toroids and their characterization by cryoelectron microscopy. J. Am. Chem. Soc. 120:12–17. [Google Scholar]
- Dunlap, D. D., A. Maggi, M. R. Soria, and L. Monaco. 1997. Nanoscopic structure of DNA condensed for gene delivery. Nucleic Acids Res. 25:3095–3101. [DOI] [PMC free article] [PubMed] [Google Scholar]
- Earnshaw, W. C., and S. C. Harrison. 1977. DNA arrangement in isometric phage heads. Nature. 268:598–602. [DOI] [PubMed] [Google Scholar]
- Egli, M., L. D. Williams, Q. Gao, and A. Rich. 1991. Structure of the pure-spermine form of Z-DNA (magnesium free) at 1-A resolution. Biochemistry. 30:11388–11402. [DOI] [PubMed] [Google Scholar]
- Fang, Y., and J. H. Hoh. 1998. Early intermediates in spermidine-induced DNA condensation on the surface of mica. J. Am. Chem. Soc. 120:8903–8909. [Google Scholar]
- Gallagher, K., and K. Sharp. 1998. Electrostatic contributions to heat capacity changes of DNA-ligand binding. Biophys. J. 75:769–776. [DOI] [PMC free article] [PubMed] [Google Scholar]
- Geall, A. J., R. J. Taylor, M. E. Earll, M. A. W. Eaton, and I. S. Blagbrough. 2000. Synthesis of cholesteryl polyamine carbamates: pKa studies and condensation of calf thymus DNA. Bioconjug. Chem. 11:314–326. [DOI] [PubMed] [Google Scholar]
- Gessner, R. V., C. A. Frederick, G. J. Quigley, A. Rich, and A. H. Wang. 1989. The molecular structure of the left-handed Z-DNA double helix at 1.0-A atomic resolution. Geometry, conformation, and ionic interactions of d(CGCGCG). J. Biol. Chem. 264:7921–7935. [DOI] [PubMed] [Google Scholar]
- Gustafsson, J., G. Arvidson, G. Karlsson, and M. Almgren. 1995. Complexes between cationic liposomes and DNA visualized by cryo-TEM. Biochim. Biophys. Acta. 1235:305–312. [DOI] [PubMed] [Google Scholar]
- He, S., P. G. Arscott, and V. A. Bloomfield. 2000. Condensation of DNA by multivalent cations: experimental studies of condensation kinetics. Biopolymers. 53:329–341. [DOI] [PubMed] [Google Scholar]
- Heerklotz, H., and R. M. Epand. 2001. The enthalpy of acyl chain packing and the apparent water-accessible apolar surface area of phospholipids. Biophys. J. 80:271–279. [DOI] [PMC free article] [PubMed] [Google Scholar]
- Hirschman, S. Z., M. Leng, and G. Felsenfeld. 1967. Interactions of spermine and DNA. Biopolymers. 5:227–233. [DOI] [PubMed] [Google Scholar]
- Hud, N. V., K. H. Downing, and R. Balhorn. 1993. Identification of the elemental packing unit of DNA in mammalian sperm cells by atomic force microscopy. Biochem. Biophys. Res. Commun. 193:1347–1354. [DOI] [PubMed] [Google Scholar]
- Indyk, L., and H. F. Fisher. 1998. Theoretical aspects of isothermal titration calorimetry. Methods Enzymol. 295:350–364. [DOI] [PubMed] [Google Scholar]
- Keller, M., T. Tagawa, M. Preuss, and A. D. Miller. 2002. Biophysical characterization of the DNA binding and condensing properties of adenoviral core peptide μ. Biochemistry. 41:652–659. [DOI] [PubMed] [Google Scholar]
- Kennedy, M. T., E. V. Pozharski, V. A. Rakhmanova, and R. C. MacDonald. 2000. Factors governing the assembly of cationic phospholipid-DNA complexes. Biophys. J. 78:1620–1633. [DOI] [PMC free article] [PubMed] [Google Scholar]
- Lando, D. Y., and V. B. Teif. 2002. Modeling of DNA condensation and decondensation caused by ligand binding. J. Biomol. Struct. Dyn. 20:215–222. [DOI] [PubMed] [Google Scholar]
- Lobo, B. A., A. Davis, G. Koe, J. G. Smith, and C. R. Middaugh. 2001. Isothermal titration calorimetric analysis of the interaction between cationic lipids and plasmid DNA. Arch. Biochem. Biophys. 386:95–105. [DOI] [PubMed] [Google Scholar]
- Lobo, B. A., G. S. Koe, J. G. Koe, and C. R. Middaugh. 2003. Thermodynamic analysis of binding and protonation in DOTAP/DOPE (1:1):DNA complexes using isothermal titration calorimetry. Biophys. Chem. 104:67–78. [DOI] [PubMed] [Google Scholar]
- Luger, K., A. W. Mäder, R. K. Richmond, D. F. Sargent, and T. J. Richmond. 1997. Crystal structure of the nucleosome core particle at 2.8 Å resolution. Nature. 389:251–260. [DOI] [PubMed] [Google Scholar]
- Manning, G. S. 1978. The molecular theory of polyelectrolyte solutions with applications to the electrostatic properties of polynucleotides. Q. Rev. Biophys. 112:179–246. [DOI] [PubMed] [Google Scholar]
- Marquet, R., and C. Houssier. 1991. Thermodynamics of cation-induced DNA condensation. J. Biomol. Struct. Dyn. 9:159–167. [DOI] [PubMed] [Google Scholar]
- Matulis, D., I. Rouzina, and V. A. Bloomfield. 2000. Thermodynamics of DNA binding and condensation: isothermal calorimetry and electrostatic mechanism. J. Mol. Biol. 296:1053–1063. [DOI] [PubMed] [Google Scholar]
- Matulis, D., I. Rouzina, and V. A. Bloomfield. 2002. Thermodynamics of cationic lipid binding to DNA and DNA condensation: roles of electrostatics and hydrophobicity. J. Am. Chem. Soc. 124:7331–7342. [DOI] [PubMed] [Google Scholar]
- Mel'nikov, S. M., V. G. Sergeyev, and K. Yoshikawa. 1995. Transition of double-stranded DNA chains between random coil and compact globule states induced by cooperative binding of cationic surfactant. J. Am. Chem. Soc. 117:9951–9956. [Google Scholar]
- Murphy, K. P., and S. J. Gill. 1990. Group additivity thermodynamics for dissolution of solid cyclic dipeptides into water. Thermochimica Acta. 172:11–20. [Google Scholar]
- Neidle, S. 1999. Oxford Handbook of Nucleic Acid Structure. Oxford University Press, Oxford, UK.
- Niidome, T., N. Ohmori, A. Ichinose, A. Wada, H. Mihara, T. Hirayama, and H. Aoyagi. 1997. Binding of cationic alpha-helical peptides to plasmid DNA and their gene transfer abilities into cells. J. Biol. Chem. 272:15307–15312. [DOI] [PubMed] [Google Scholar]
- Ouameur, A. A., and H. Tajmir-Riahi. 2004. Structural analysis of DNA interactions with biogenic polyamines and cobalt(III)hexamine studied by Fourier transform and capillary electrophoresis. J. Biol. Chem. 279:42041–42054. [DOI] [PubMed] [Google Scholar]
- Porschke, D. 1984. Dynamics of DNA condensation. Biochemistry. 23:4821–4828. [DOI] [PubMed] [Google Scholar]
- Post, C. B., and B. H. Zimm. 1982. Theory of DNA condensation: collapse versus aggregation. Biopolymers. 21:2123–2137. [DOI] [PubMed] [Google Scholar]
- Pozharski, E., and R. C. MacDonald. 2002. Thermodynamics of cationic lipid-DNA complex formation as studied by isothermal titration calorimetry. Biophys. J. 83:556–565. [DOI] [PMC free article] [PubMed] [Google Scholar]
- Radler, J. O., I. Koltover, T. Salditt, and C. R. Safinya. 1997. Structure of DNA-cationic liposome complexes: DNA intercalation in multilamellar membranes in distinct interhelical packing regimes. Science. 275:810–814. [DOI] [PubMed] [Google Scholar]
- Rau, D. C., and V. A. Parsegian. 1992. Direct measurement of the intermolecular forces between counterion-condensed DNA double helices: evidence for long range attractive hydration forces. Biophys. J. 61:246–259. [DOI] [PMC free article] [PubMed] [Google Scholar]
- Ray, J., and G. S. Manning. 1997. Effect of counterion valence and polymer charge density on the pair potential of two polyions. Macromolecules. 30:5739–5744. [Google Scholar]
- Record, M. T. Jr., J. H. Ha, and M. A. Fisher. 1991. Analysis of equilibrium and kinetic measurements to determine thermodynamic origins of stability and specificity and mechanism of formation of site-specific complexes between proteins and helical DNA. Methods Enzymol. 208:291–343. [DOI] [PubMed] [Google Scholar]
- Remy, J.-S., C. Sirlin, P. Vierling, and J.-P. Behr. 1994. Gene therapy with a series of lipophilic DNA-binding molecules. Bioconjug. Chem. 5:647–654. [DOI] [PubMed] [Google Scholar]
- Richmond, T. J., J. T. Finch, B. Rusliton, D. Rhodes, and A. Klug. 1984. Structure of the nucleosome core particle at 7 Å resolution. Nature. 311:532–537. [DOI] [PubMed] [Google Scholar]
- Ross, P. D., and J. T. Shapiro. 1974. Heat of interaction of DNA with polylysine, spermine, and Mg++. Biopolymers. 13:415–416. [DOI] [PubMed] [Google Scholar]
- Schellman, J. A., and N. Parthasarathy. 1984. X-ray diffraction studies on cation-collapsed DNA. J. Mol. Biol. 175:313–329. [DOI] [PubMed] [Google Scholar]
- Schmid, N., and J. P. Behr. 1991. Location of spermine and other polyamines on DNA as revealed by photoaffinity cleavage with polyaminobenzenediazonium salts. Biochemistry. 30:4357–4361. [DOI] [PubMed] [Google Scholar]
- Shapiro, J. T., B. S. Stannard, and G. Felsenfeld. 1969. The binding of small cations to deoxyribonucleic acid. Nucleotide specificity. Biochemistry. 8:3233–3241. [DOI] [PubMed] [Google Scholar]
- Simberg, D., D. Danino, Y. Talmon, A. Minsky, M. E. Ferrari, C. J. Wheeler, and Y. Barenholz. 2001. Phase behavior, DNA ordering, and size instability of cationic lipoplexes. J. Biol. Chem. 276:47453–47459. [DOI] [PubMed] [Google Scholar]
- Sitko, J. C., E. M. Mattescu, and H. G. Hansma. 2003. Sequence-dependant DNA condensation and the electrostatic zipper. Biophys. J. 84:419–431. [DOI] [PMC free article] [PubMed] [Google Scholar]
- Spink, C. H., and J. B. Chaires. 1997. Thermodynamics of the binding of a cationic lipid to DNA. J. Am. Chem. Soc. 119:10920–10928. [Google Scholar]
- Spolar, R. S., J. R. Livingstone, and M. T. Record Jr. 1992. Use of liquid hydrocarbon and amide transfer data to estimate contributions to thermodynamic functions of protein folding from the removal of nonpolar and polar surface from water. Biochemistry. 31:3947–3955. [DOI] [PubMed] [Google Scholar]
- Strauss, U. P., C. Helfgott, and H. Pink. 1967. Interactions of polyelectrolytes with simple electrolytes. II. Donnan equilibria obtained with DNA in solutions of 1–1 electrolytes. J. Phys. Chem. 71:2550–2556. [DOI] [PubMed] [Google Scholar]
- Strey, H. H., R. Podgornik, D. C. Rau, and V. A. Parsegian. 1998. DNA-DNA interactions. Curr. Opin. Struct. Biol. 8:309–313. [DOI] [PubMed] [Google Scholar]
- Tanford, C. 1980. The hydrophobic effect: formation of micelles and biological membranes. John Wiley & Sons, New York.
- Tari, L. W., and A. S. Secco. 1991. Base-pair opening and spermine binding-B-DNA features displayed in the crystal structure of a gal operon fragment: implications for protein-DNA recognition. Nucleic Acids Res. 23:2065–2073. [DOI] [PMC free article] [PubMed] [Google Scholar]
- van Holde, K. E. 1989. Chromatin. Springer Series in Molecular Biology. A. Rich, editor. Springer Verlag, New York.
- Vijayanathan, V., T. Thomas, A. Shirahata, and T. J. Thomas. 2001. DNA condensation by polyamines: a laser light scattering study of structural effects. Biochemistry. 40:13644–13651. [DOI] [PubMed] [Google Scholar]
- Watanabe, S., K. Kusama-Eguchi, H. Kobayashi, and K. Igarashi. 1991. Estimation of polyamine binding to macromolecules and ATP in bovine lymphocytes and rat liver. J. Biol. Chem. 266:20803–20809. [PubMed] [Google Scholar]
- Wilson, R. W., and V. A. Bloomfield. 1979. Counterion-induced condensation of deoxyribonucleic acid. a light-scattering study. Biochemistry. 18:2192–2196. [DOI] [PubMed] [Google Scholar]
- Yoshikawa, K., M. Takahashi, V. V. Vasileskaya, and A. R. Khokhlov. 1996. Large discrete transition in a single DNA molecule appears continuous in the ensemble. Phys. Rev. Lett. 76:3029–3031. [DOI] [PubMed] [Google Scholar]


